To realize the full potential of your digital marketing efforts, you need a clear view across all your platforms. This guide will show you how to set up and implement cross-channel marketing analytics, turning raw data into valuable insights that drive impactful solutions.
What is cross-channel marketing analytics?
Cross-channel marketing analytics involves collecting, analyzing, and interpreting data from various traffic sources – such as social media, email, paid search, organic, and more. It helps you understand how these sources interact and contribute to your business goals.
Learn how you can analyze AI traffic with Google Analytics 4.
As a result, you gain a broad perspective on your marketing activities, identify which platforms are most effective, and make data-driven decisions to optimize your strategies. This approach ensures all channels work together seamlessly to enhance customer experiences and maximize ROI.
Omnichannel vs. cross-channel vs. multichannel marketing analytics
To better grasp cross-channel marketing analytics, let’s compare it with multichannel and omnichannel approaches:
- Multichannel marketing analytics allow you to explore data to understand how you interact with your customers across different platforms. However, your channels work independently and have no communication with each other.
Let’s consider an example of a customer named Jane who wants to purchase a new pair of running shoes. She clicks on your Instagram ad, visits the website, casually receives a promotional email, and visits a physical store. These interactions aren’t connected, so you’ll track the ad click, the website visit, the email open rate, and the store visit separately. So, there’s no clear link between online activities and in-store customer behavior.
- Cross-channel marketing analytics focuses on data shared between platforms to create a more connected customer experience for your target audience. It simplifies gathering and analyzing data so you can assess the effectiveness of each channel.
For example, Jane clicks an Instagram, goes to your website, and adds shoes to her online cart. You send her a reminder email, and then she completes the purchase on the website, opting for in-store pickup. You can track Jane’s path from the ad to her website activity, email engagement, and final purchase. The data lets you see how various channels influence Jane’s decisions. Still, you need more visibility into her in-store experience.
- Omnichannel marketing analytics is an advanced version of the cross-channel approach. It represents the highest level of integration, where all channels are connected, interactive, and centered around the customer. The primary goal is to bridge the gaps between a customer’s online and offline journey.
Imagine Jane browsing shoes on your app, receiving a personalized notification, visiting the store where the sales associate knows her browsing history, and completing the purchase offline. After that, her app updates with purchase details and loyalty rewards. Here, you access a fully integrated dataset to track Jane’s entire experience across all channels in real time, from her app browsing to in-store interactions.
Why cross-channel marketing analytics is a must
Cross-channel analytics, as one of the top trends in marketing, offers cost efficiency and expanded opportunities for marketing optimization. Through data integration from multiple sources, you can avoid separate evaluations of each channel. This integration reduces redundant efforts and costs associated with managing and interpreting data from disparate traffic sources.
Furthermore, this approach enables informed decisions about where to invest your marketing resources to improve budget allocation. By understanding how different channels interact and contribute to overall goals, you ensure that marketing activities better align with customer needs, ultimately driving more significant business growth.
Top 4 dashboard templates for cross-channel marketing analytics
You need a reliable solution for cross-channel marketing analytics to track and visualize your data across various platforms. For this purpose, you can use free dashboard templates by Coupler.io, a reporting automation platform, so let’s overview some of them below.
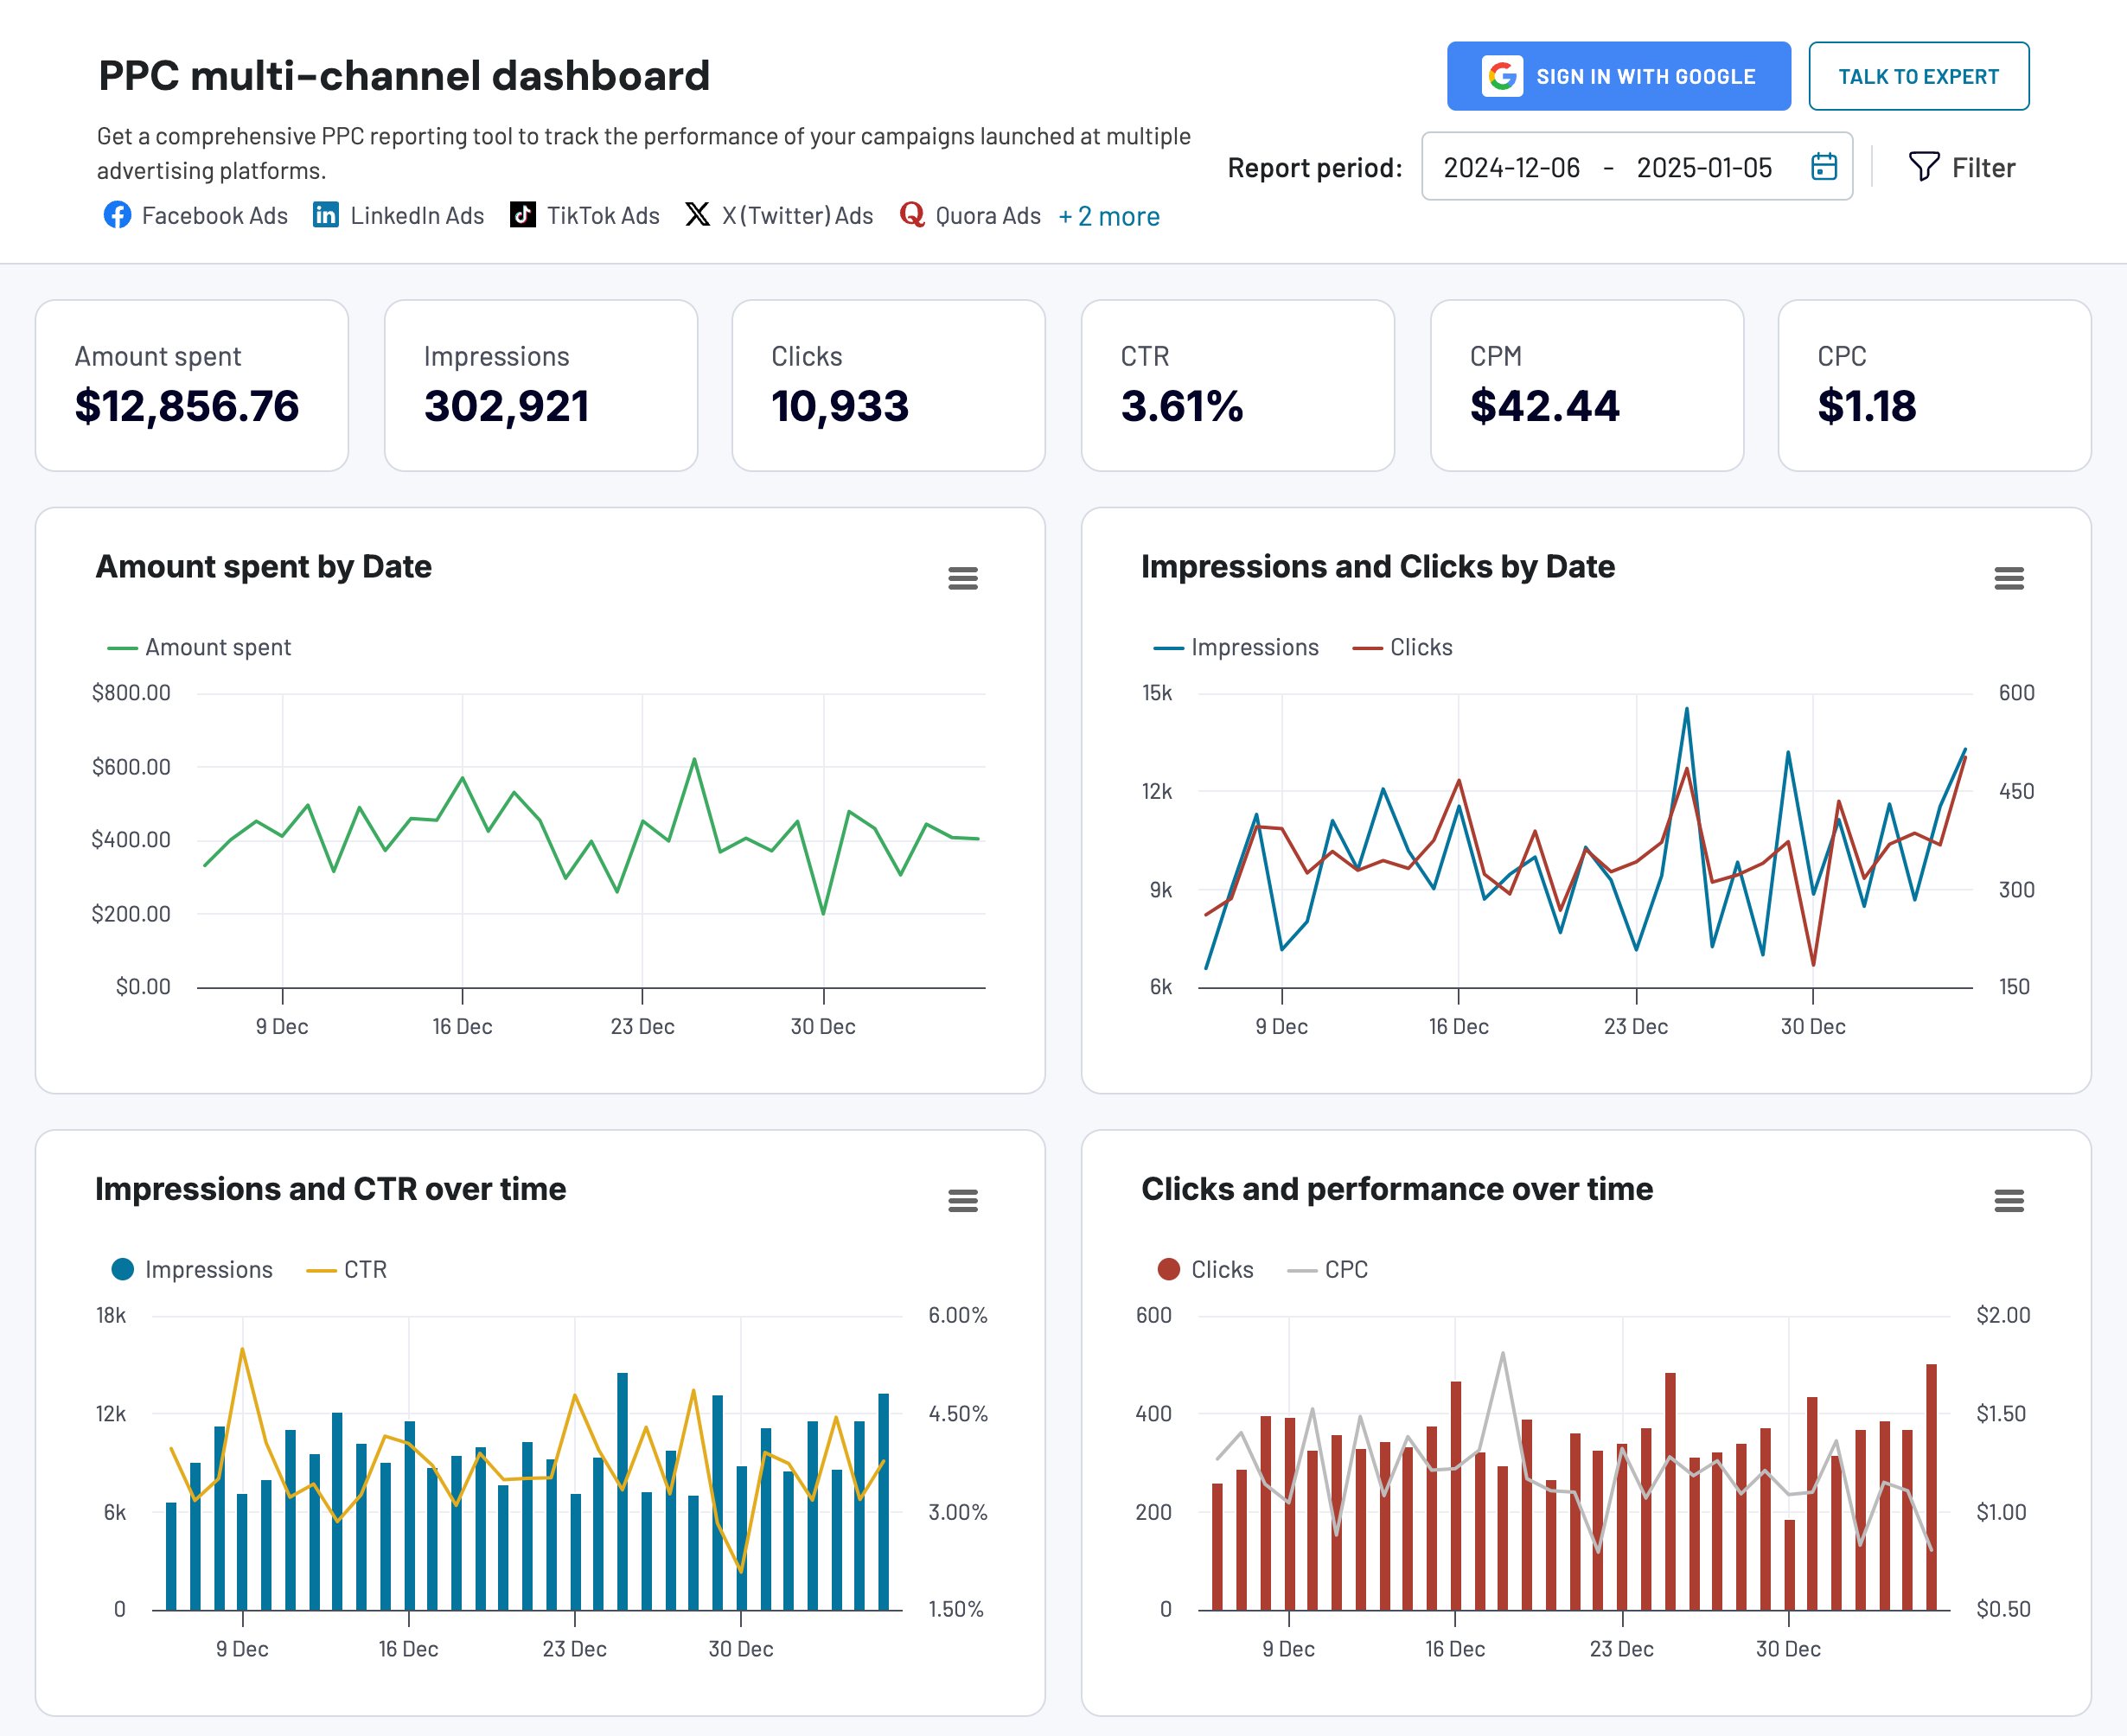
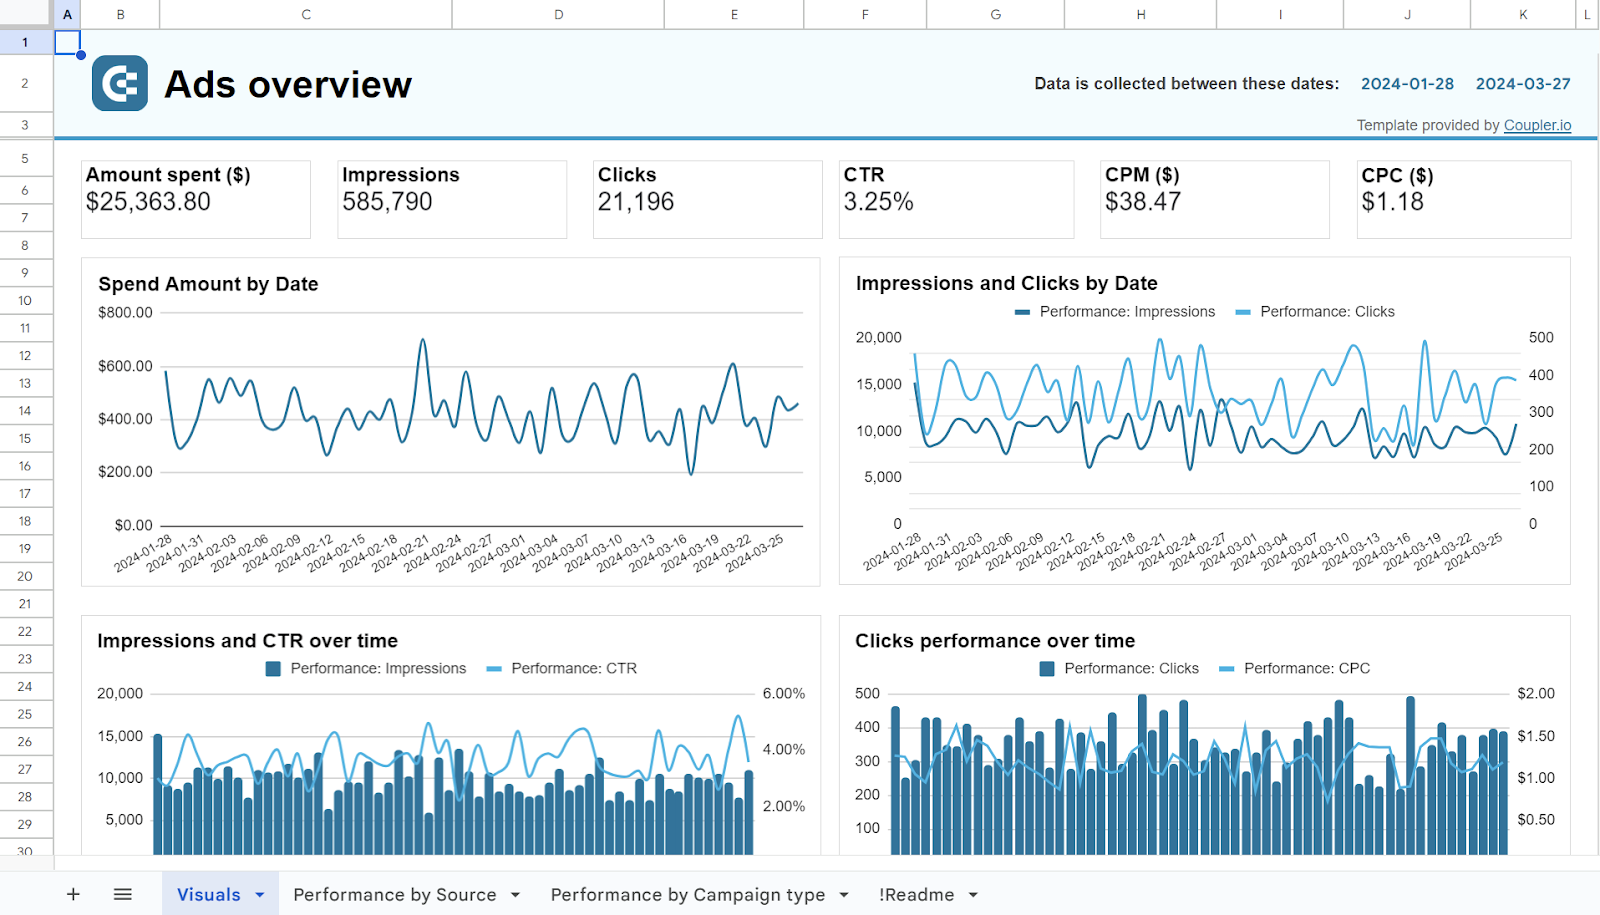
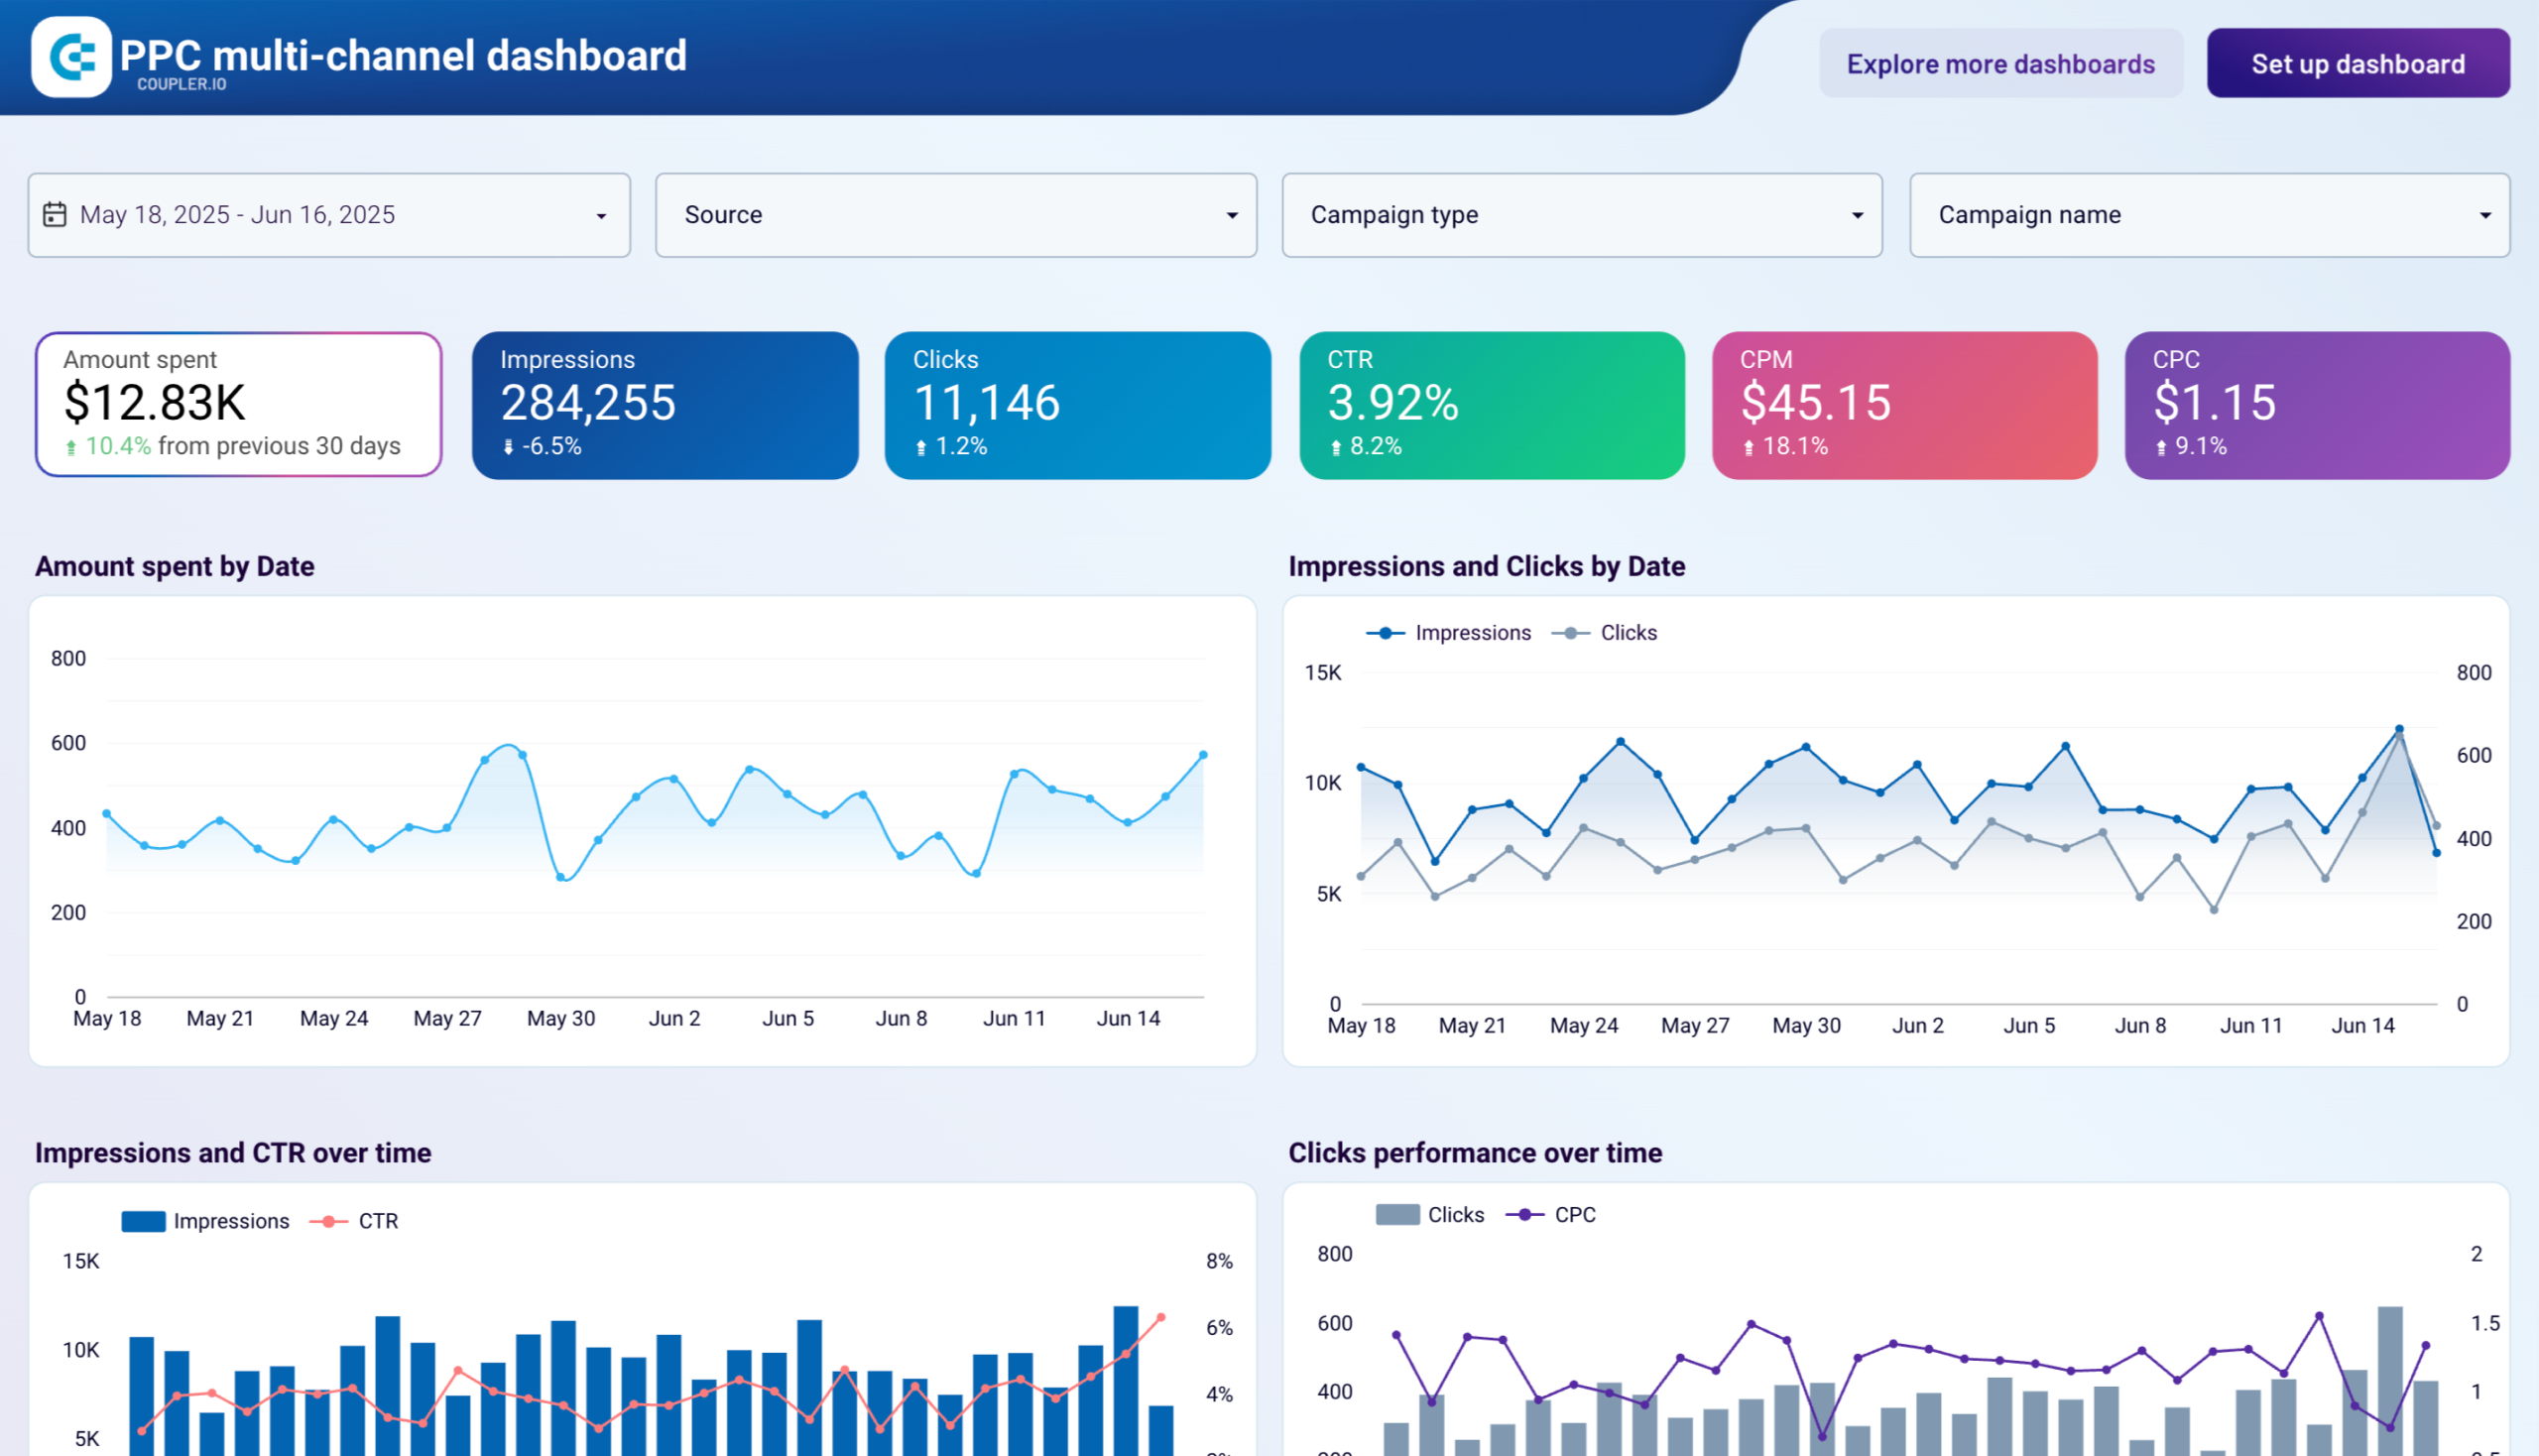
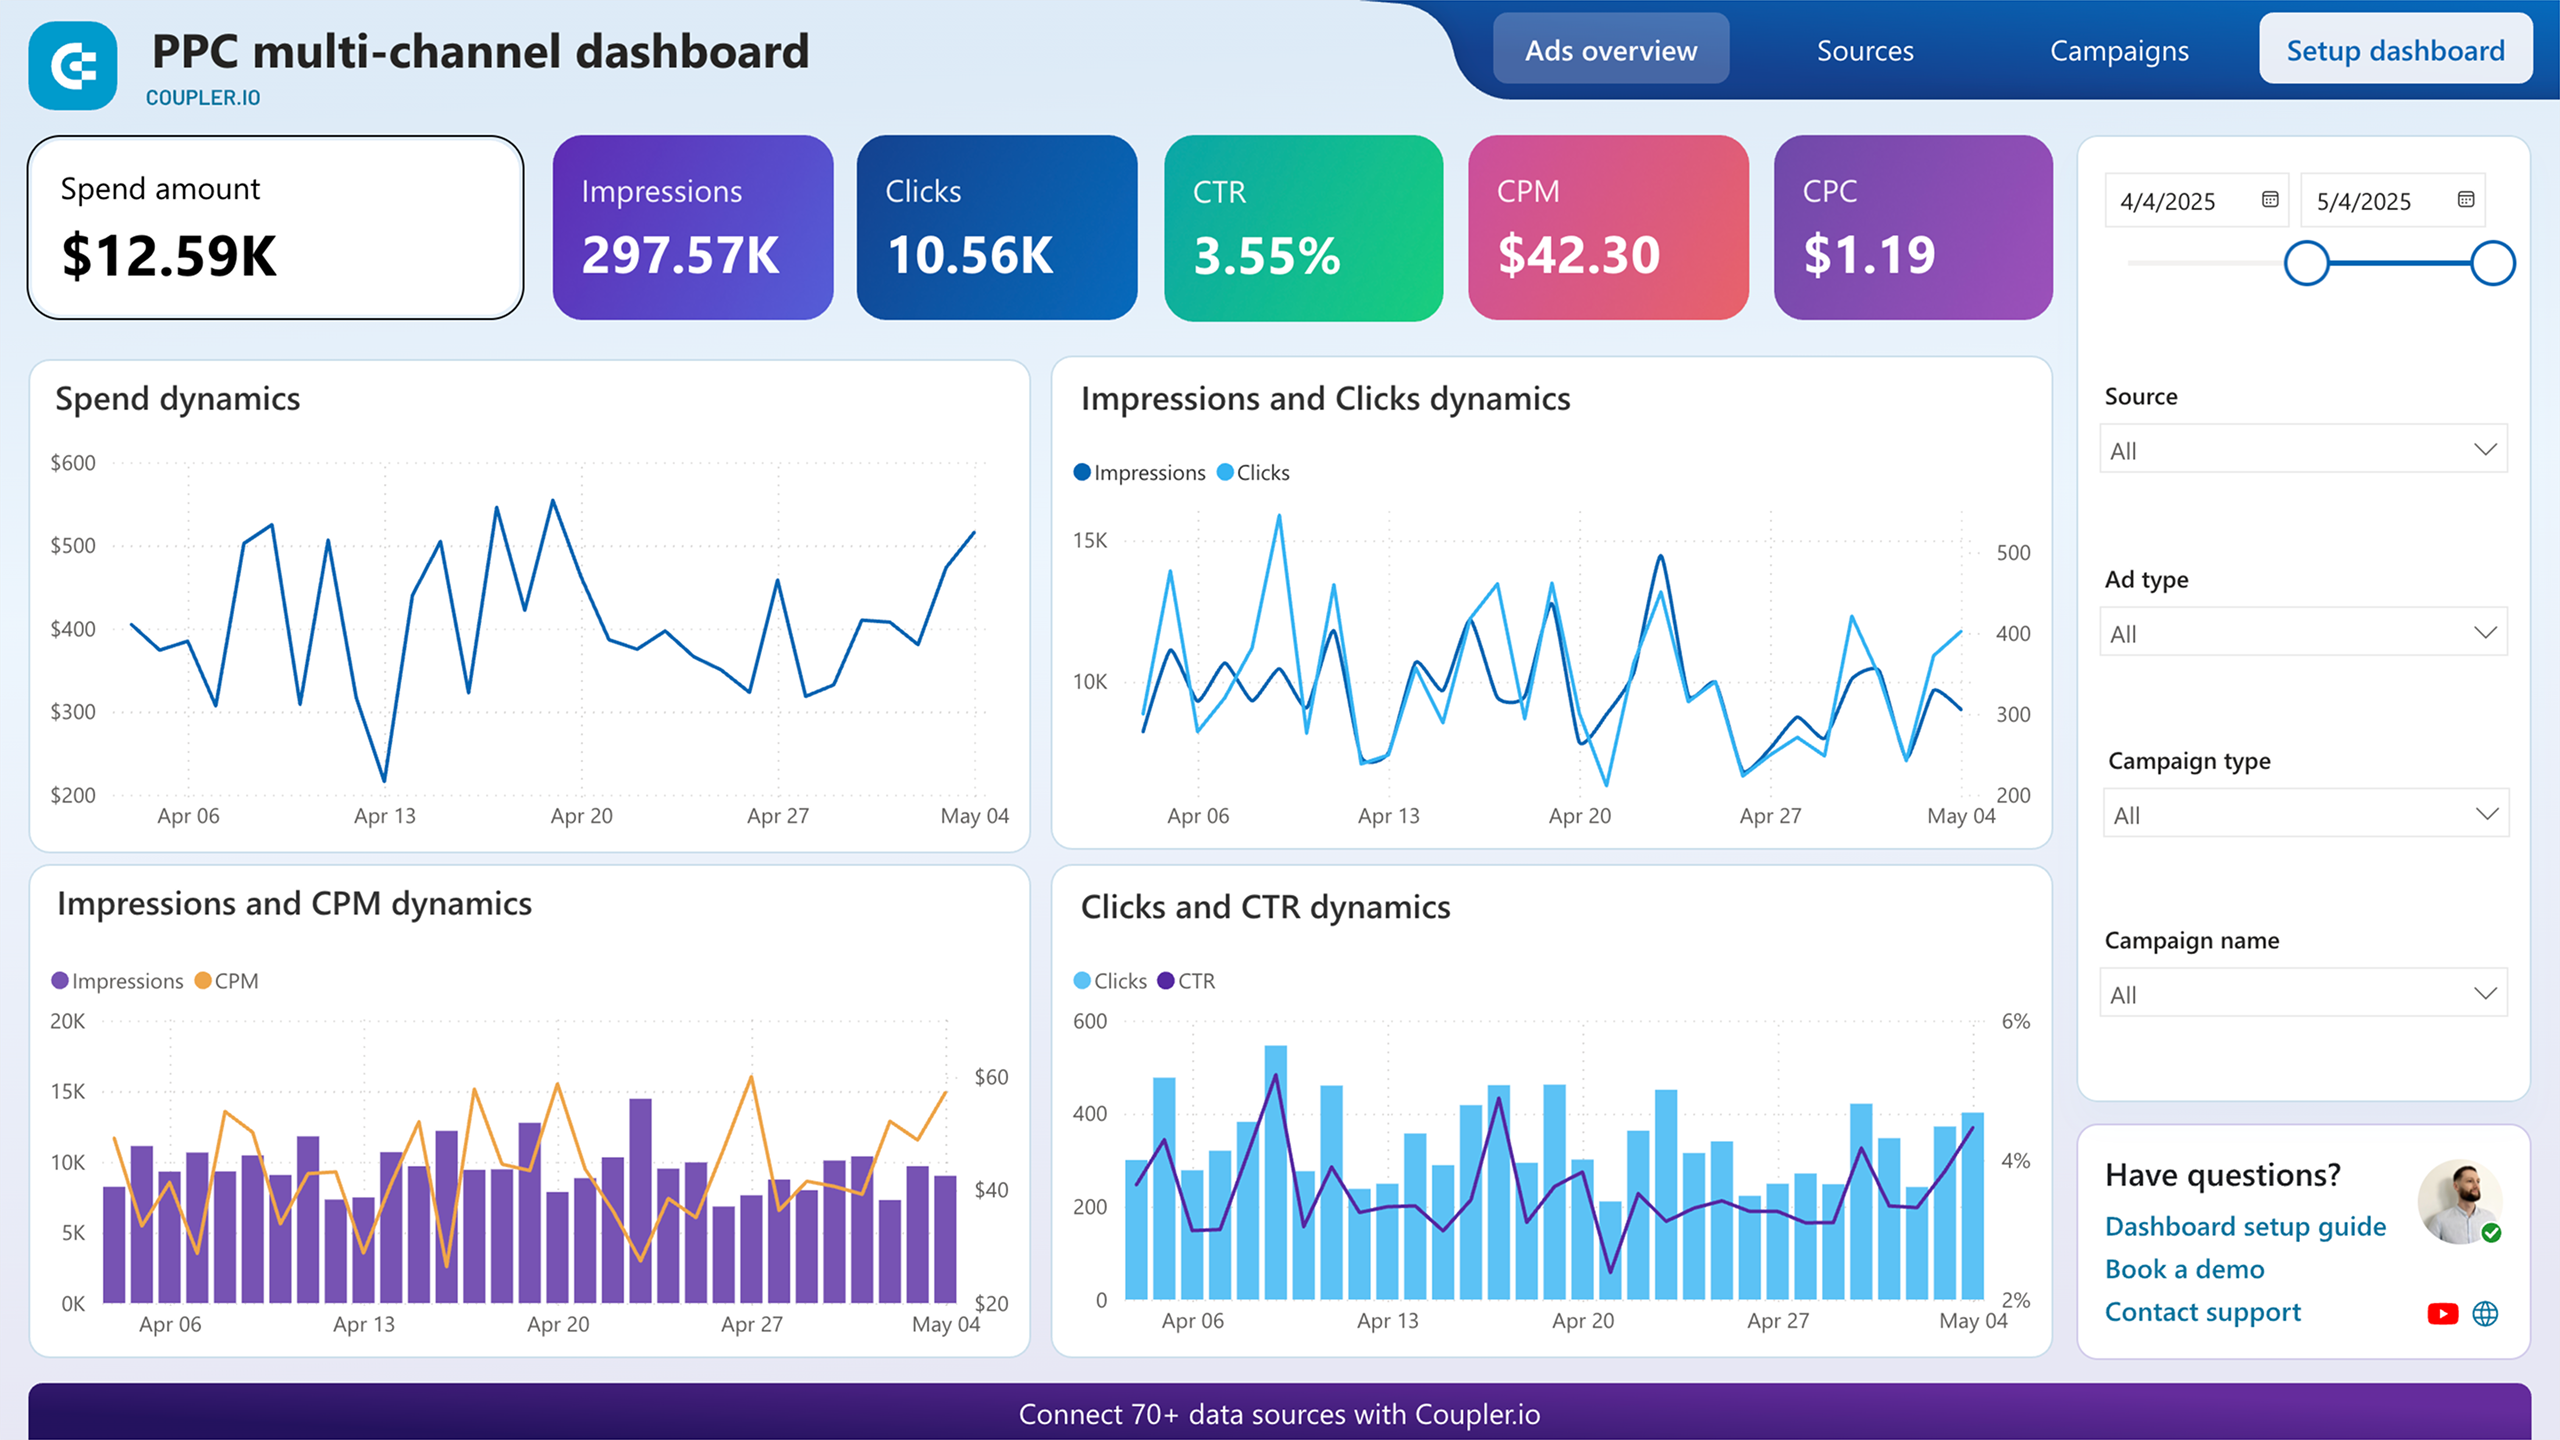
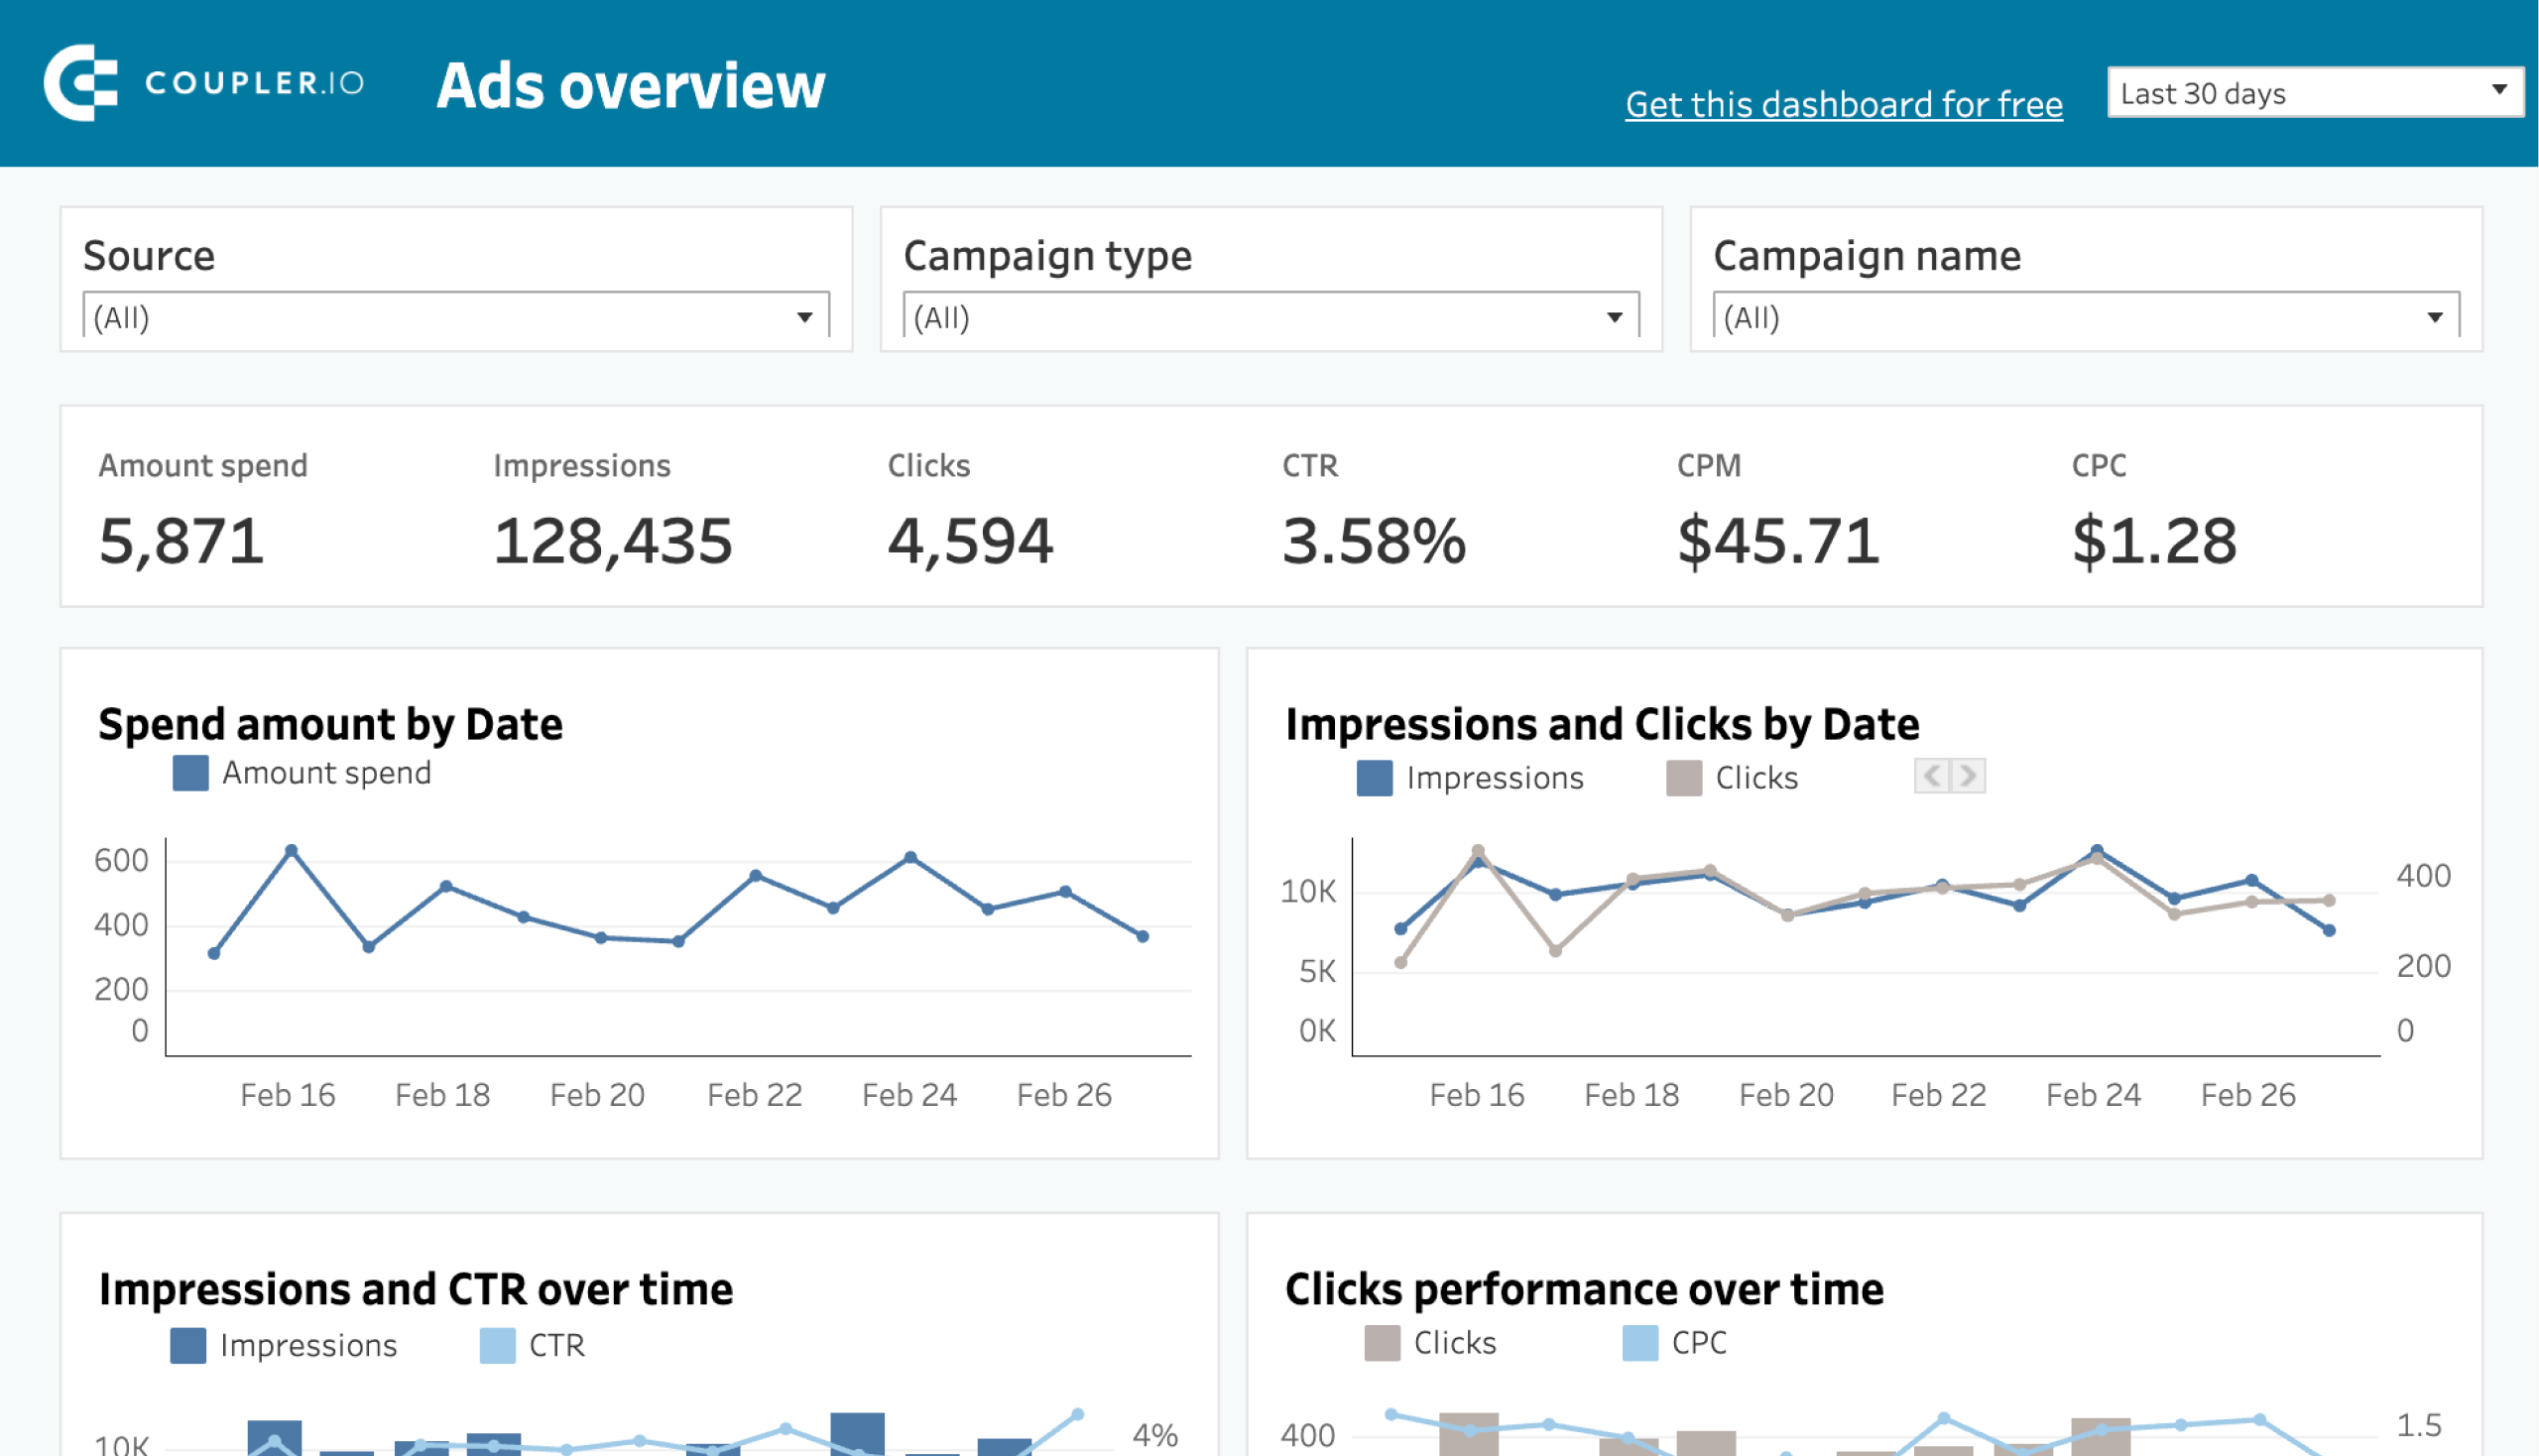
PPC multi-channel dashboard
PPC multi-channel dashboard template allows you to monitor and compare campaign performance across different advertising platforms. You can connect your ad accounts to the dashboard and access data on your metrics without switching between various interfaces.
The template supports the following apps:
- Google Ads
- X (Twitter) Ads
- LinkedIn Ads
- Facebook Ads
- Quora Ads
- Instagram Ads
- Microsoft (Bing) Ads
- TikTok Ads
Here’s what you can do using this dashboard:
- Filter data by date: Track performance variations and assess the impact of seasonal trends or campaign changes.
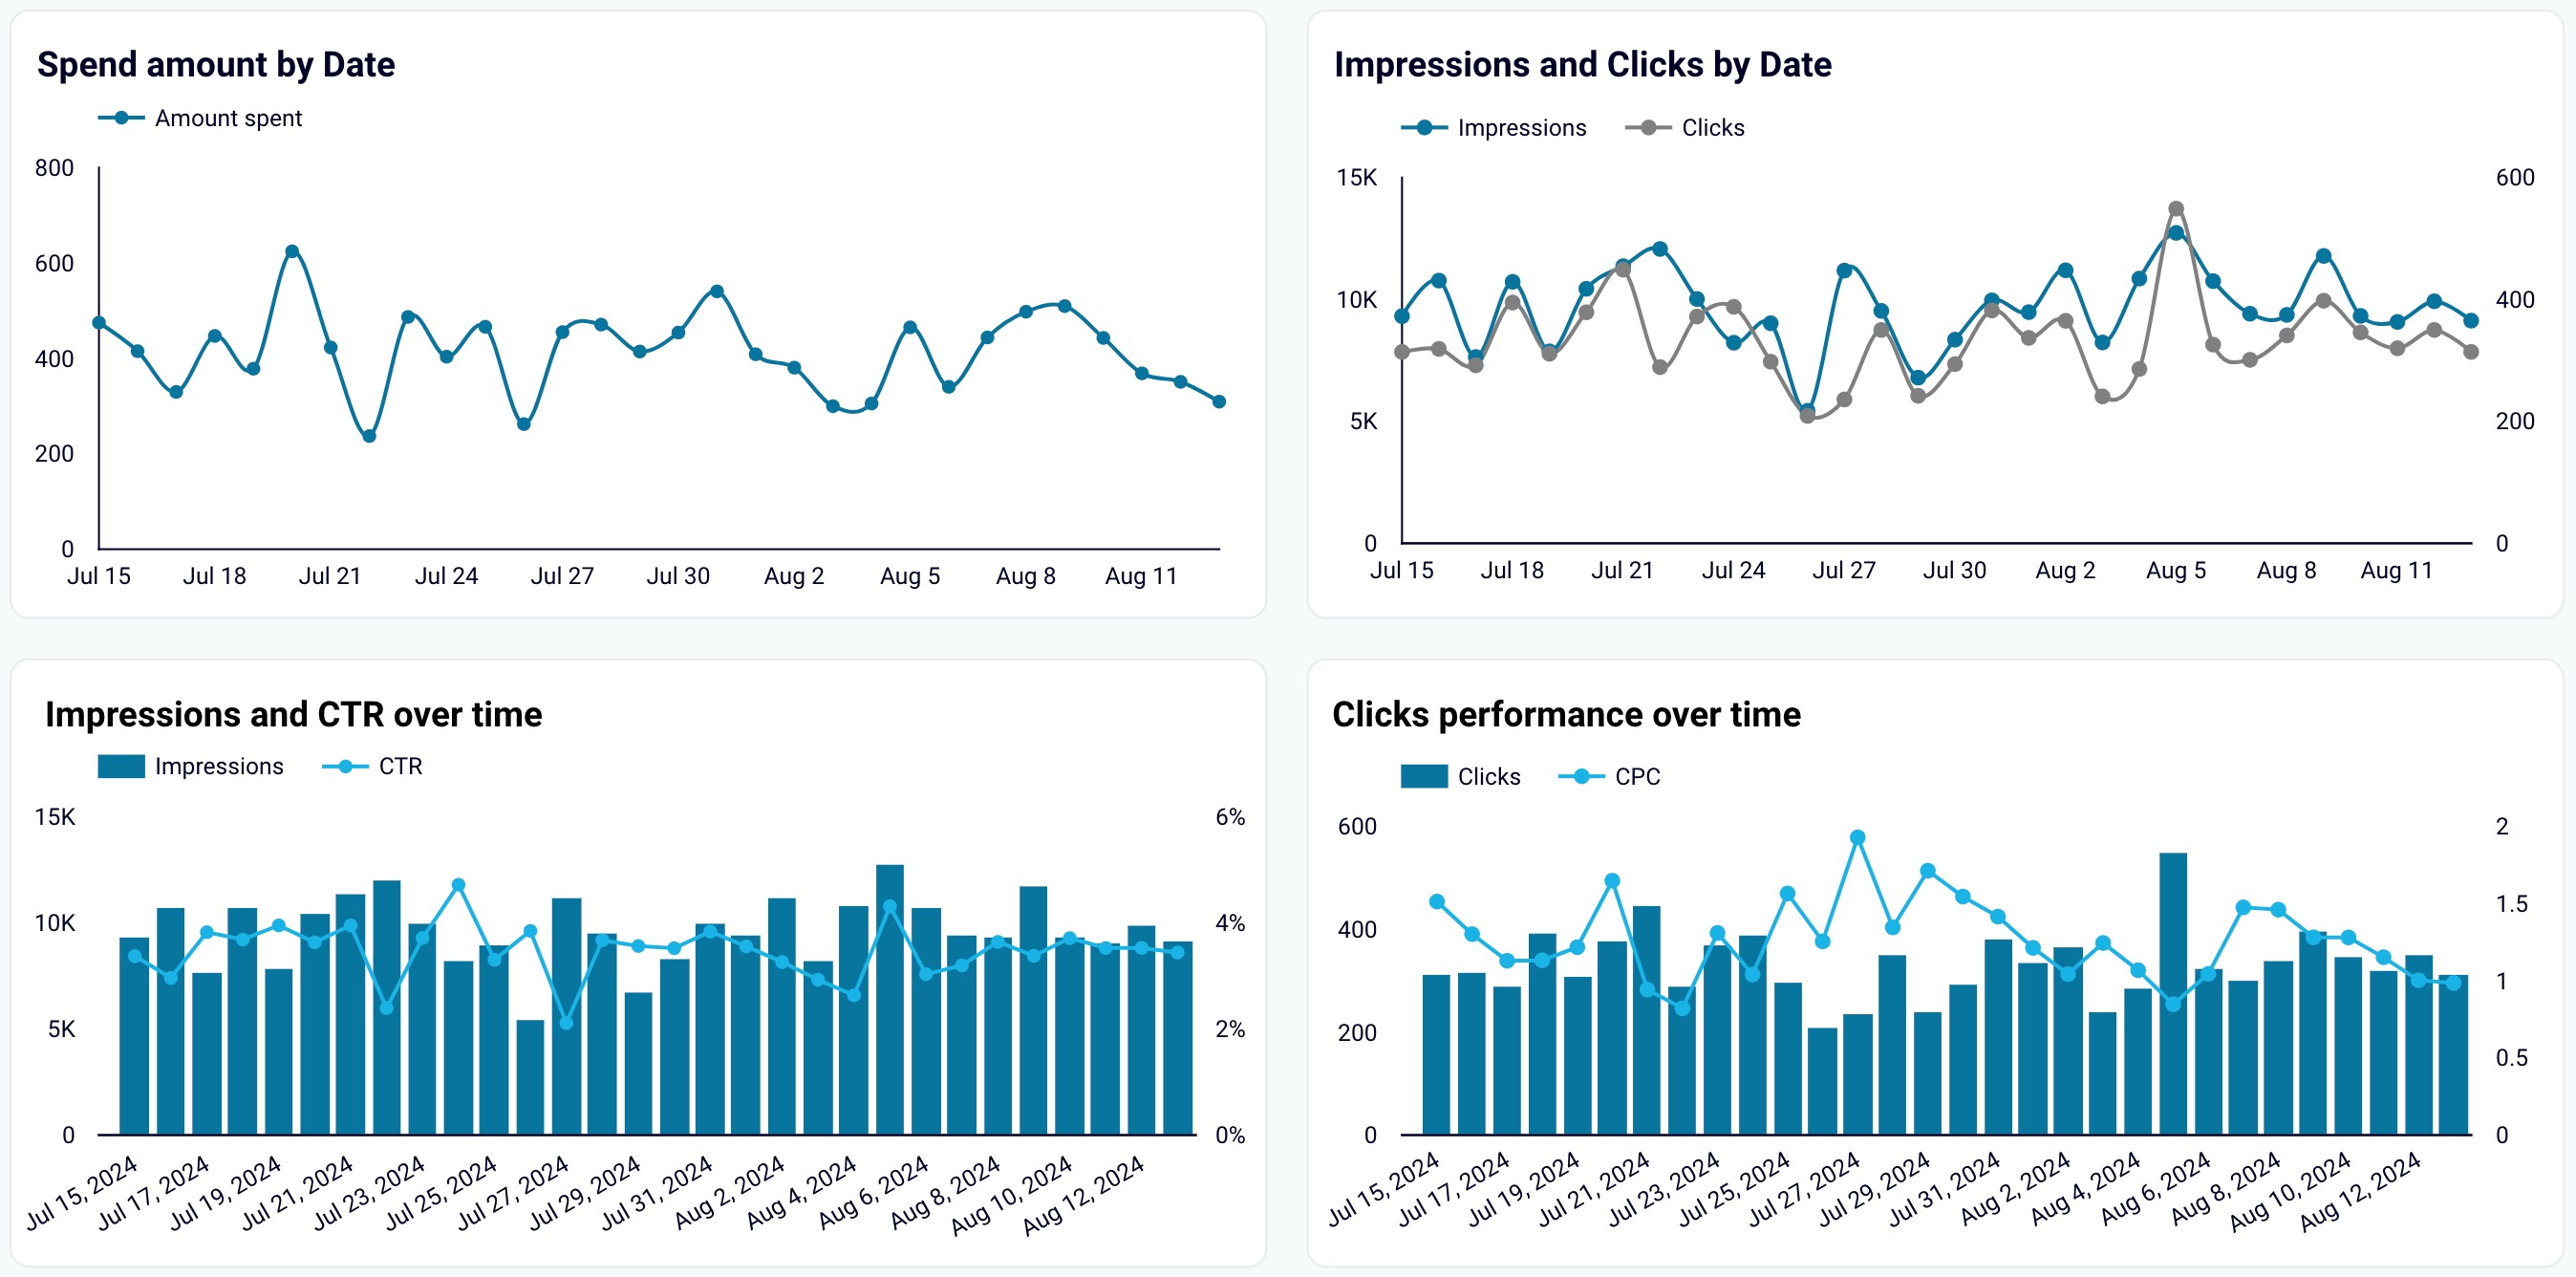
- Control key spend metrics: Monitor amount spent, cost per click (CPC), and cost per mille (CPM). This practice lets you stay updated on advertising spending and evaluate each campaign’s cost efficiency.

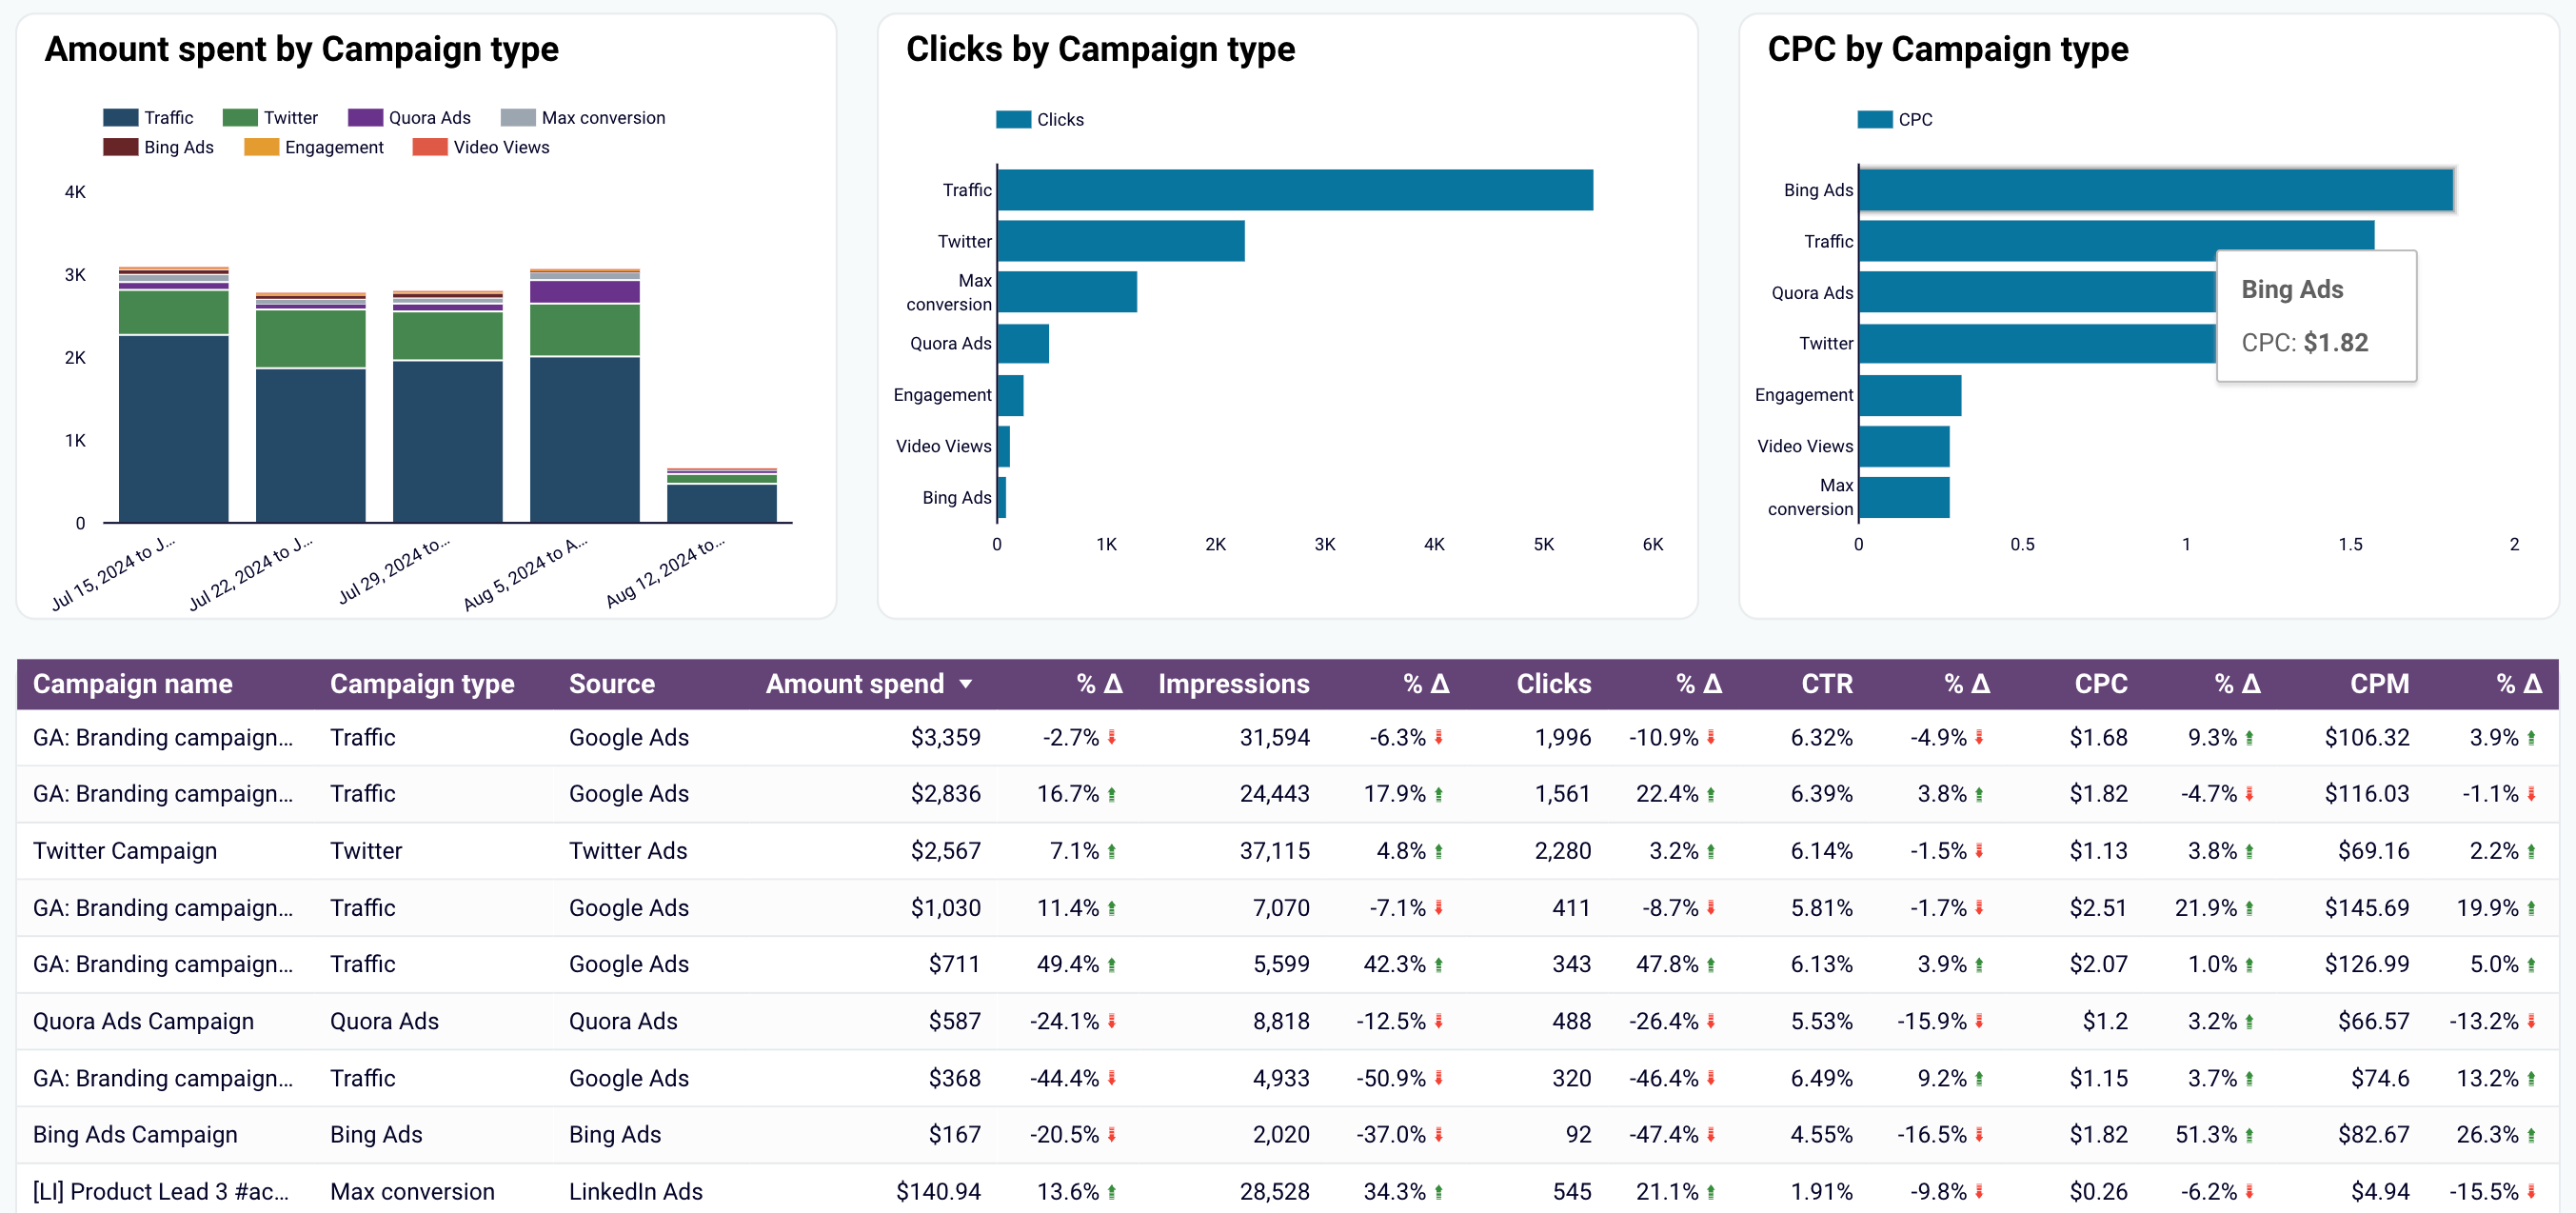
- Analyze channel performance: Figure out how each advertising platform performs. Compare metrics such as click-through rates and impressions for a more straightforward assessment of each channel’s effectiveness.
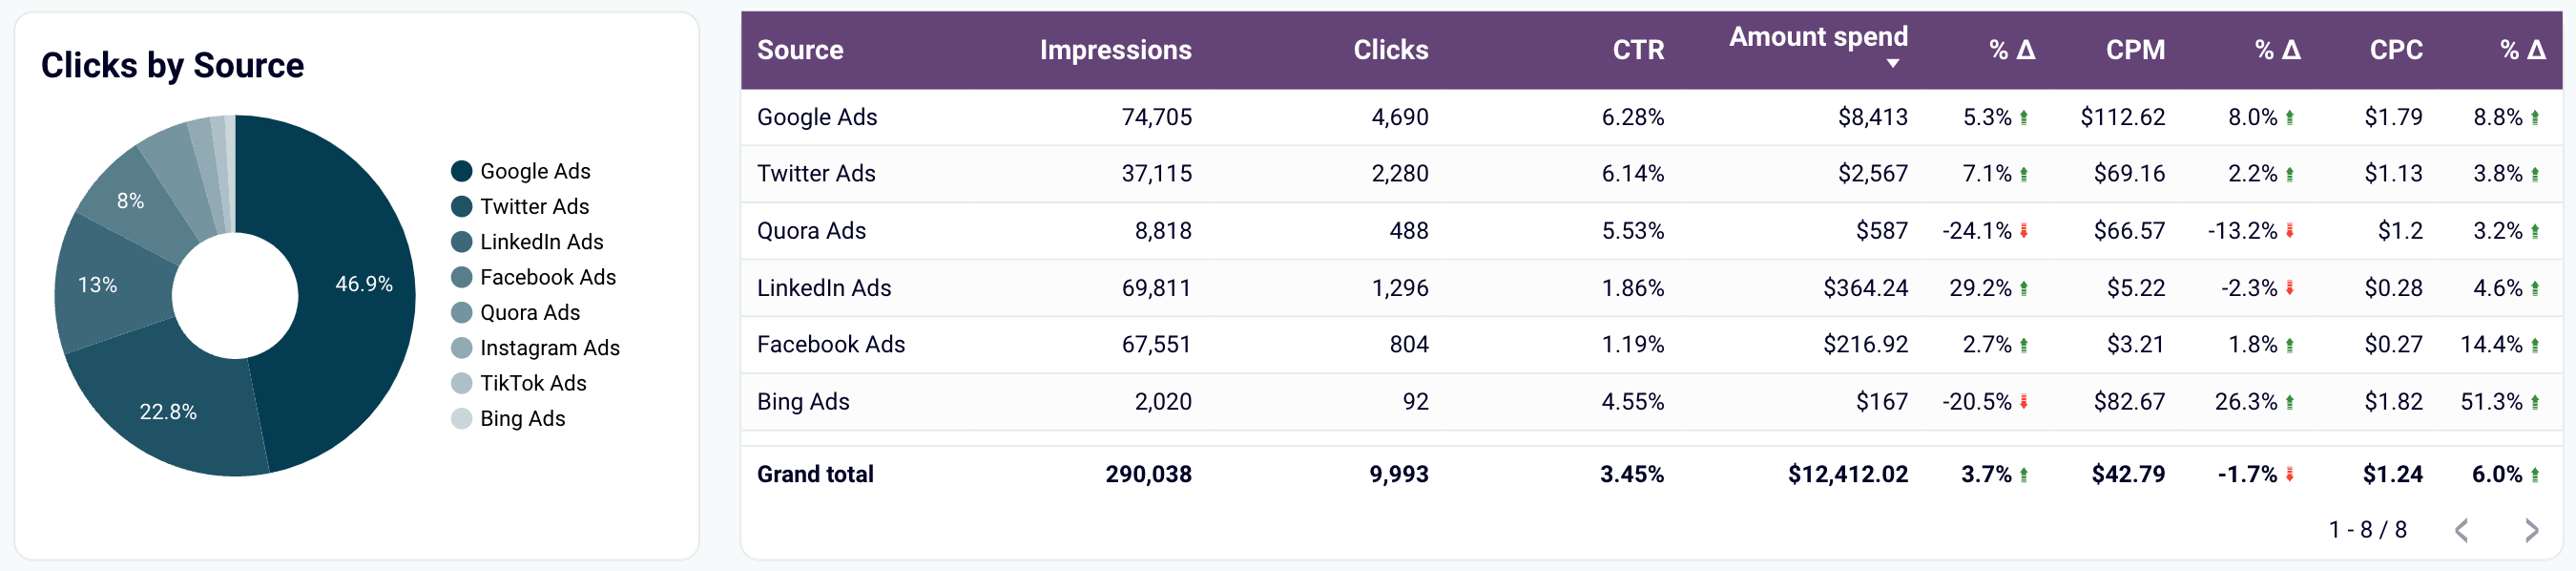
- Compare campaigns: Evaluate which campaigns deliver the best ROI and identify opportunities for optimization by analyzing performance side-by-side.
The dashboard template is available in Google Sheets, Looker Studio, Power BI, and Tableau. You can easily load data to it with the help of the built-in marketing data connectors.


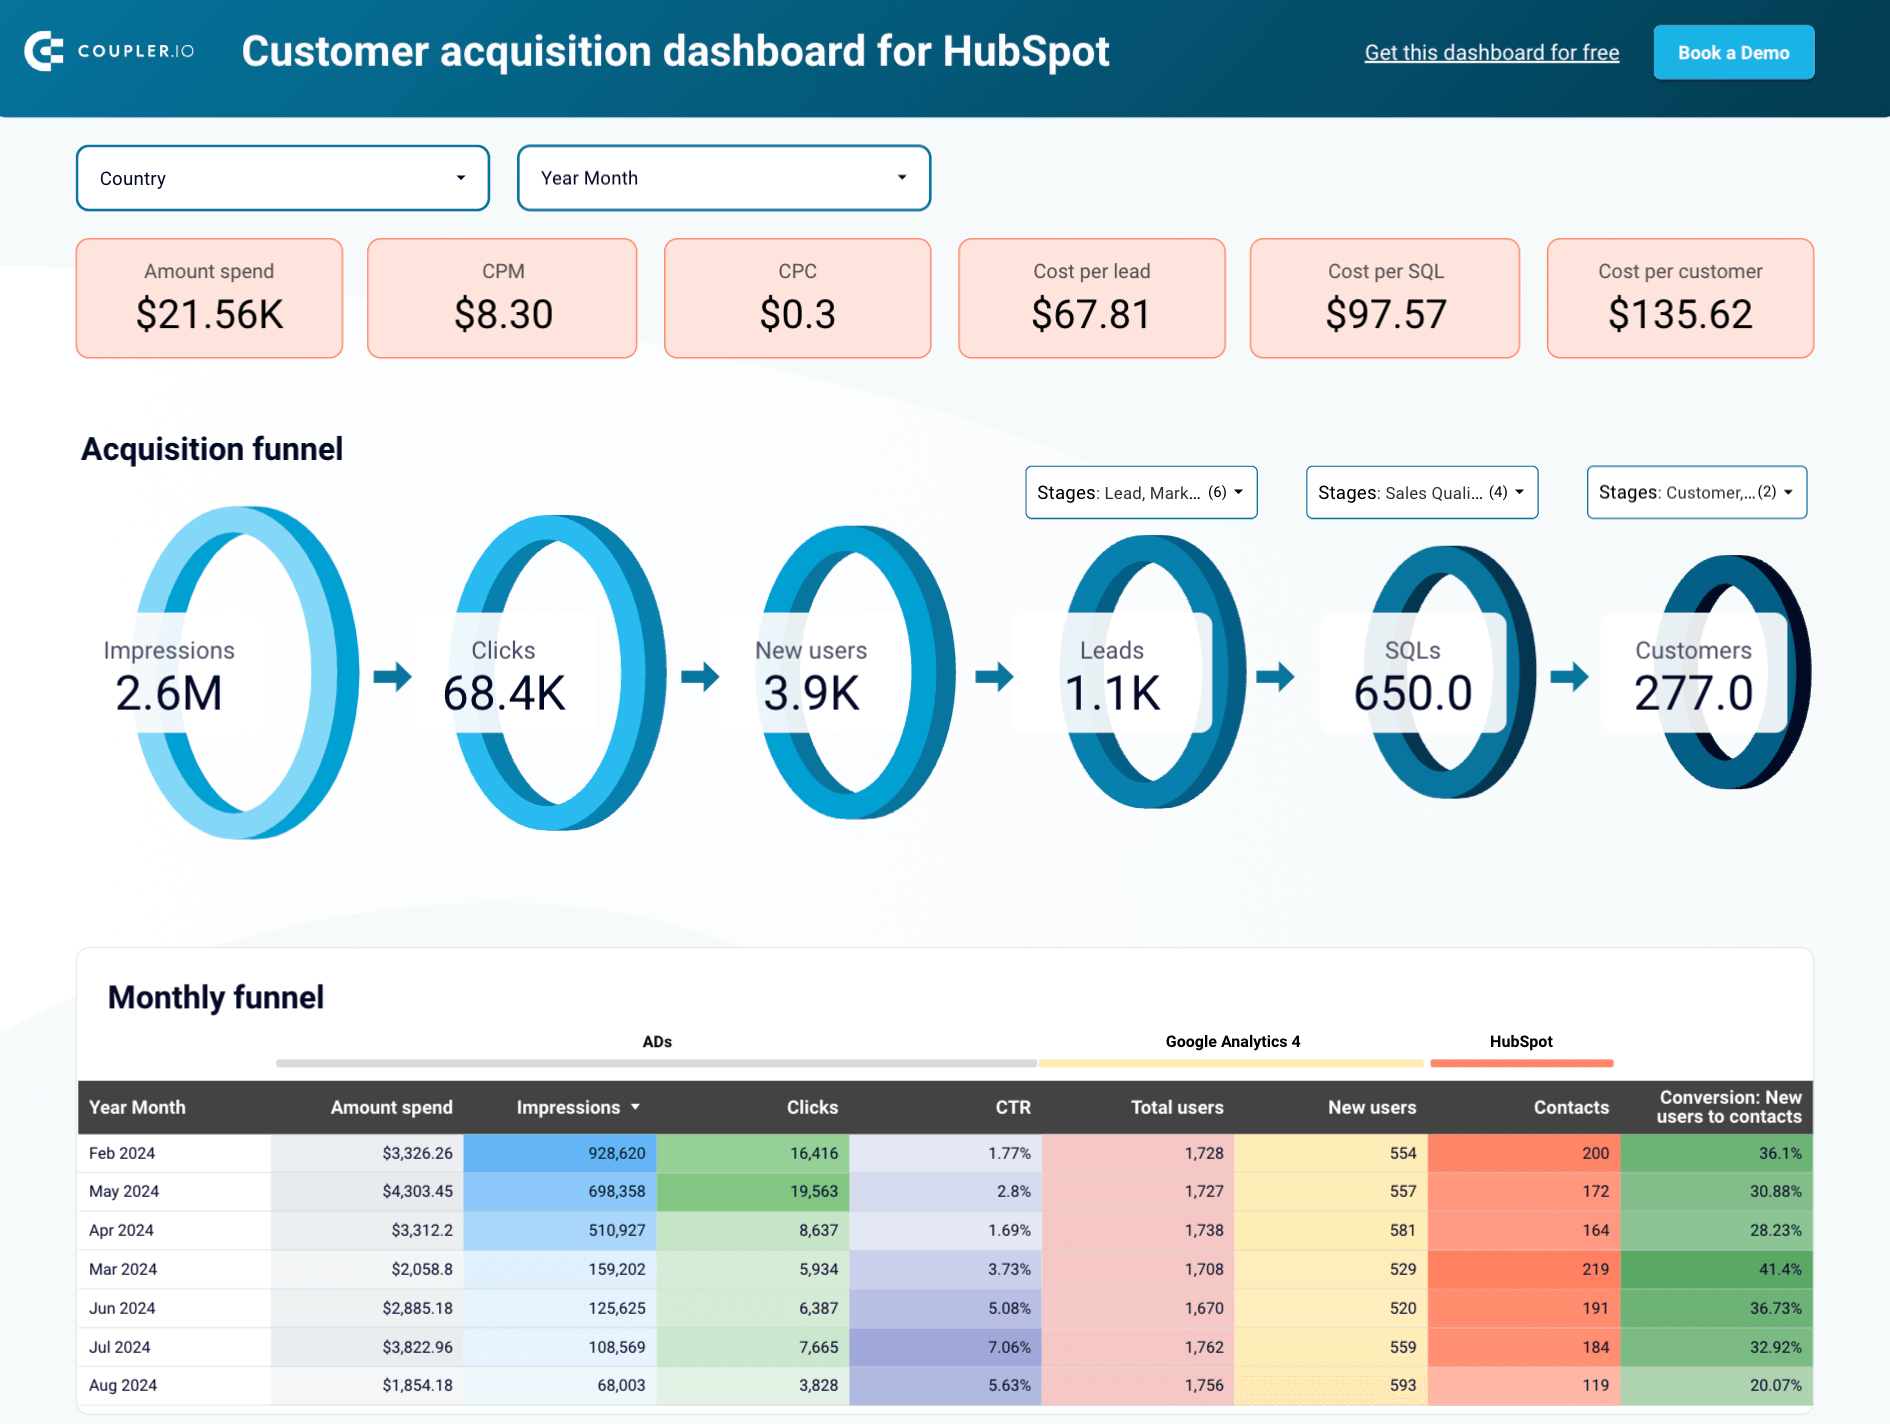
Customer acquisition dashboard
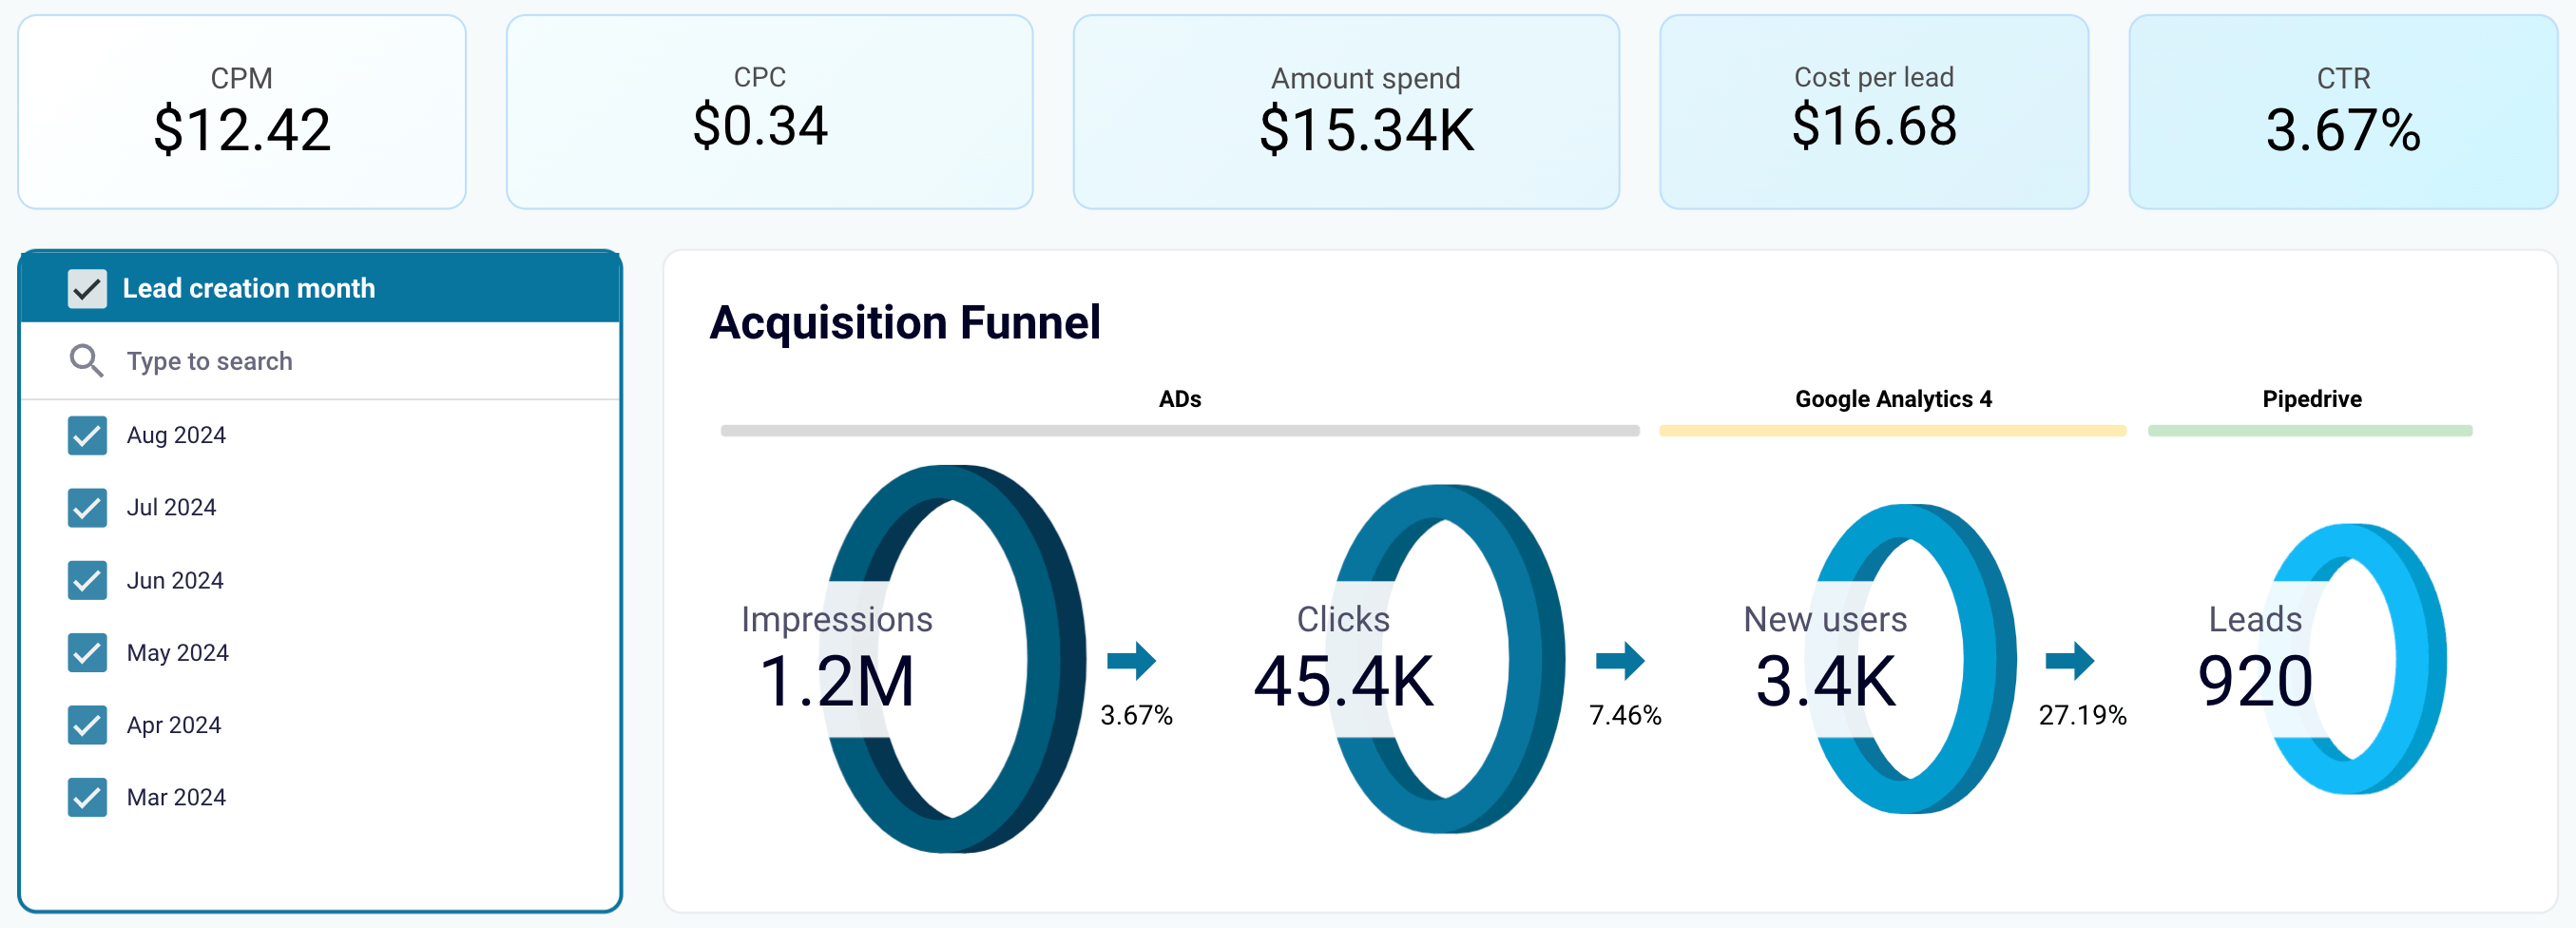
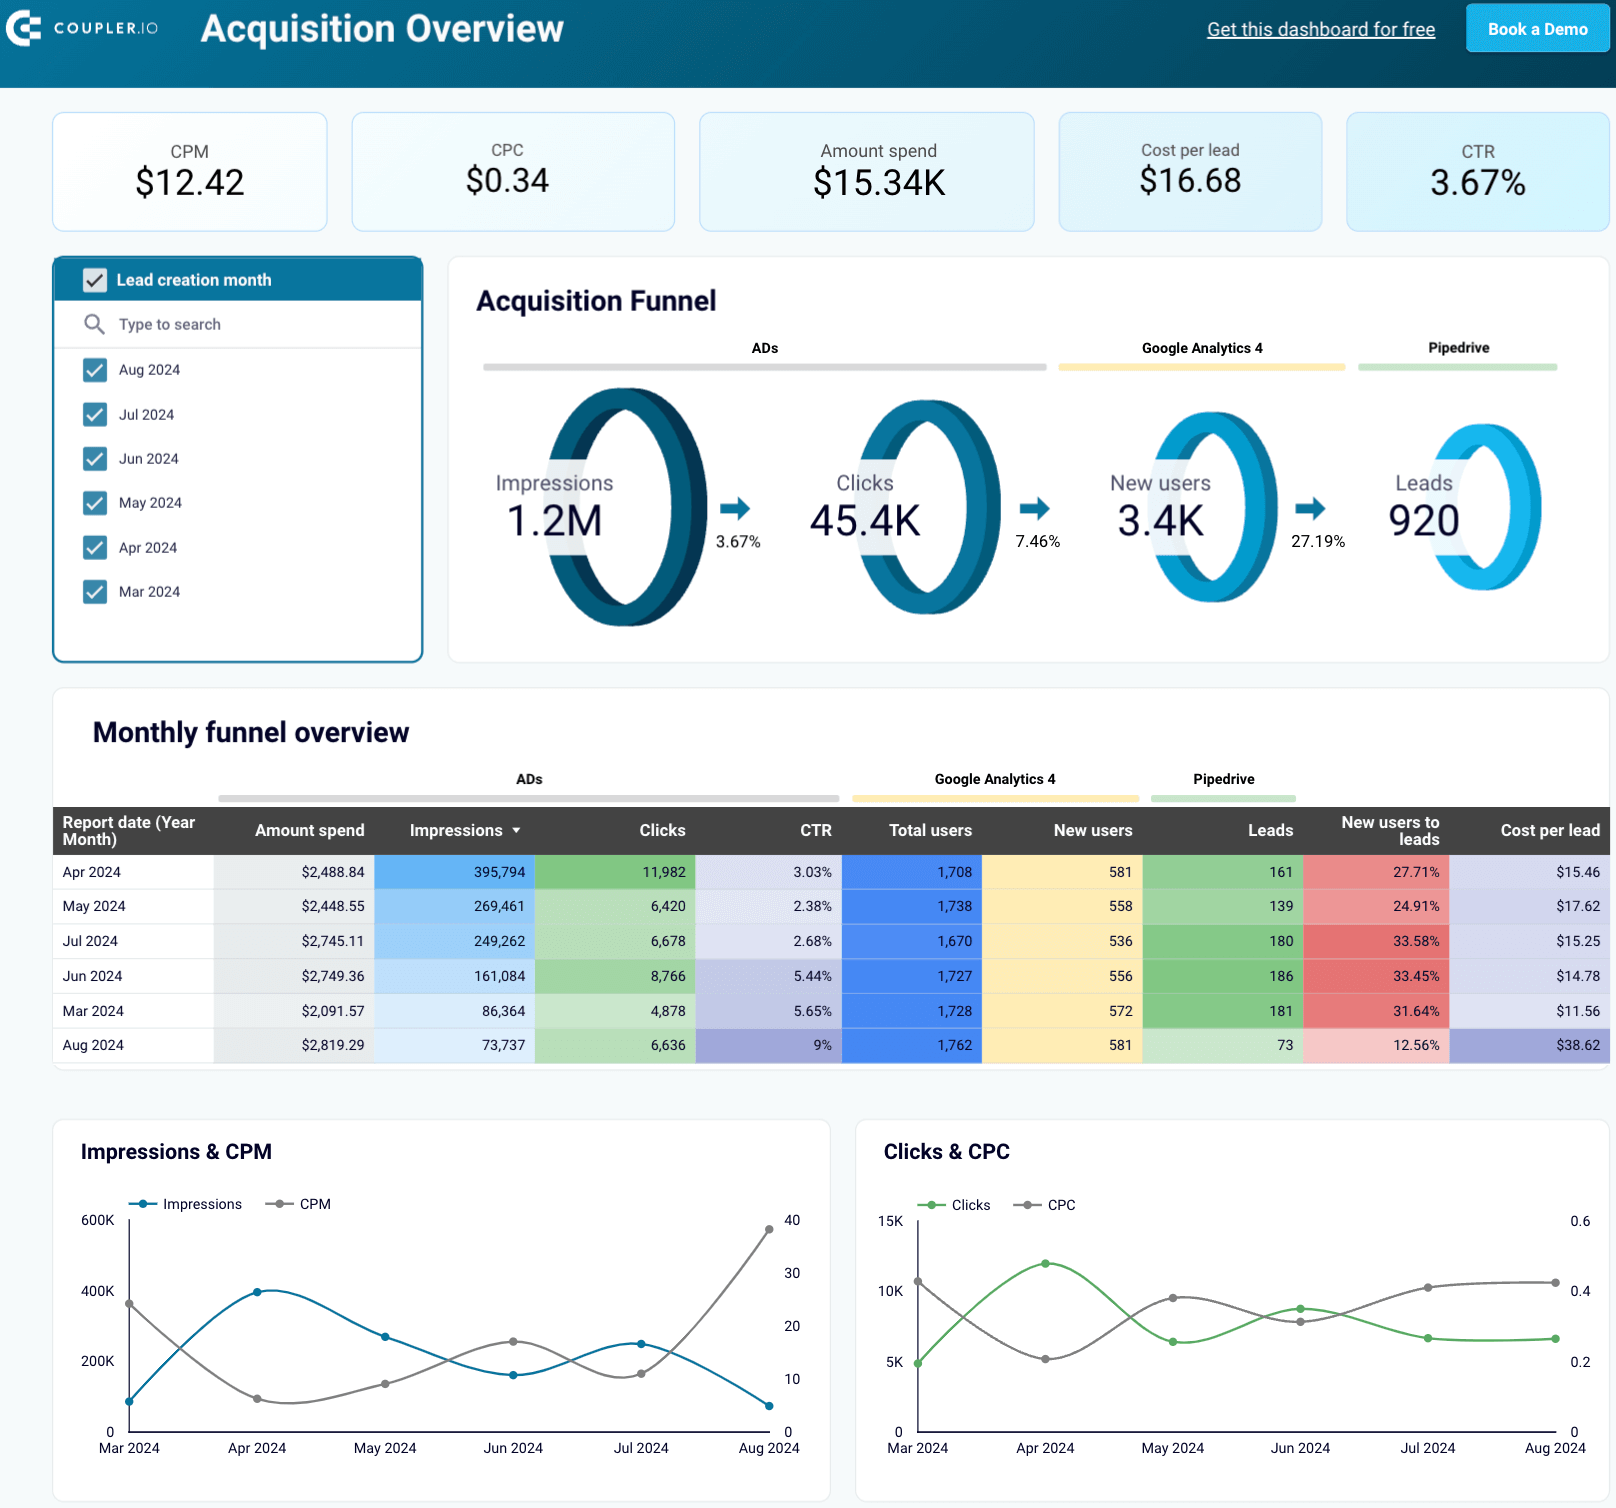
With the customer acquisition dashboard template, you can monitor and optimize your lead generation funnel, track trends over time, and compare platform performance. It integrates Pipedrive and HubSpot data with metrics from Google Analytics 4 (GA4) and various ad platforms.

The following examples illustrate how this template can be valuable:
- Analyze multi-source acquisition funnel: ?heck the impressions and clicks your ads generate, the number of users visiting your website, and the leads entering your Pipedrive/HubSpot. Identify and address any funnel leaks by comparing conversion rates at each stage with industry benchmarks.
Learn more about marketing funnel reporting.
If your rates fall below average, develop and test hypotheses to improve them, ultimately increasing revenue from your existing pipeline. You can also use historical data to forecast sales and plan future ad investments. For instance, predict the number of leads you’ll generate by doubling your ad spend.
Explore differences in marketing and sales funnels in our dedicated blog post.
You can also read more about marketing forecasting techniques for campaign optimization.
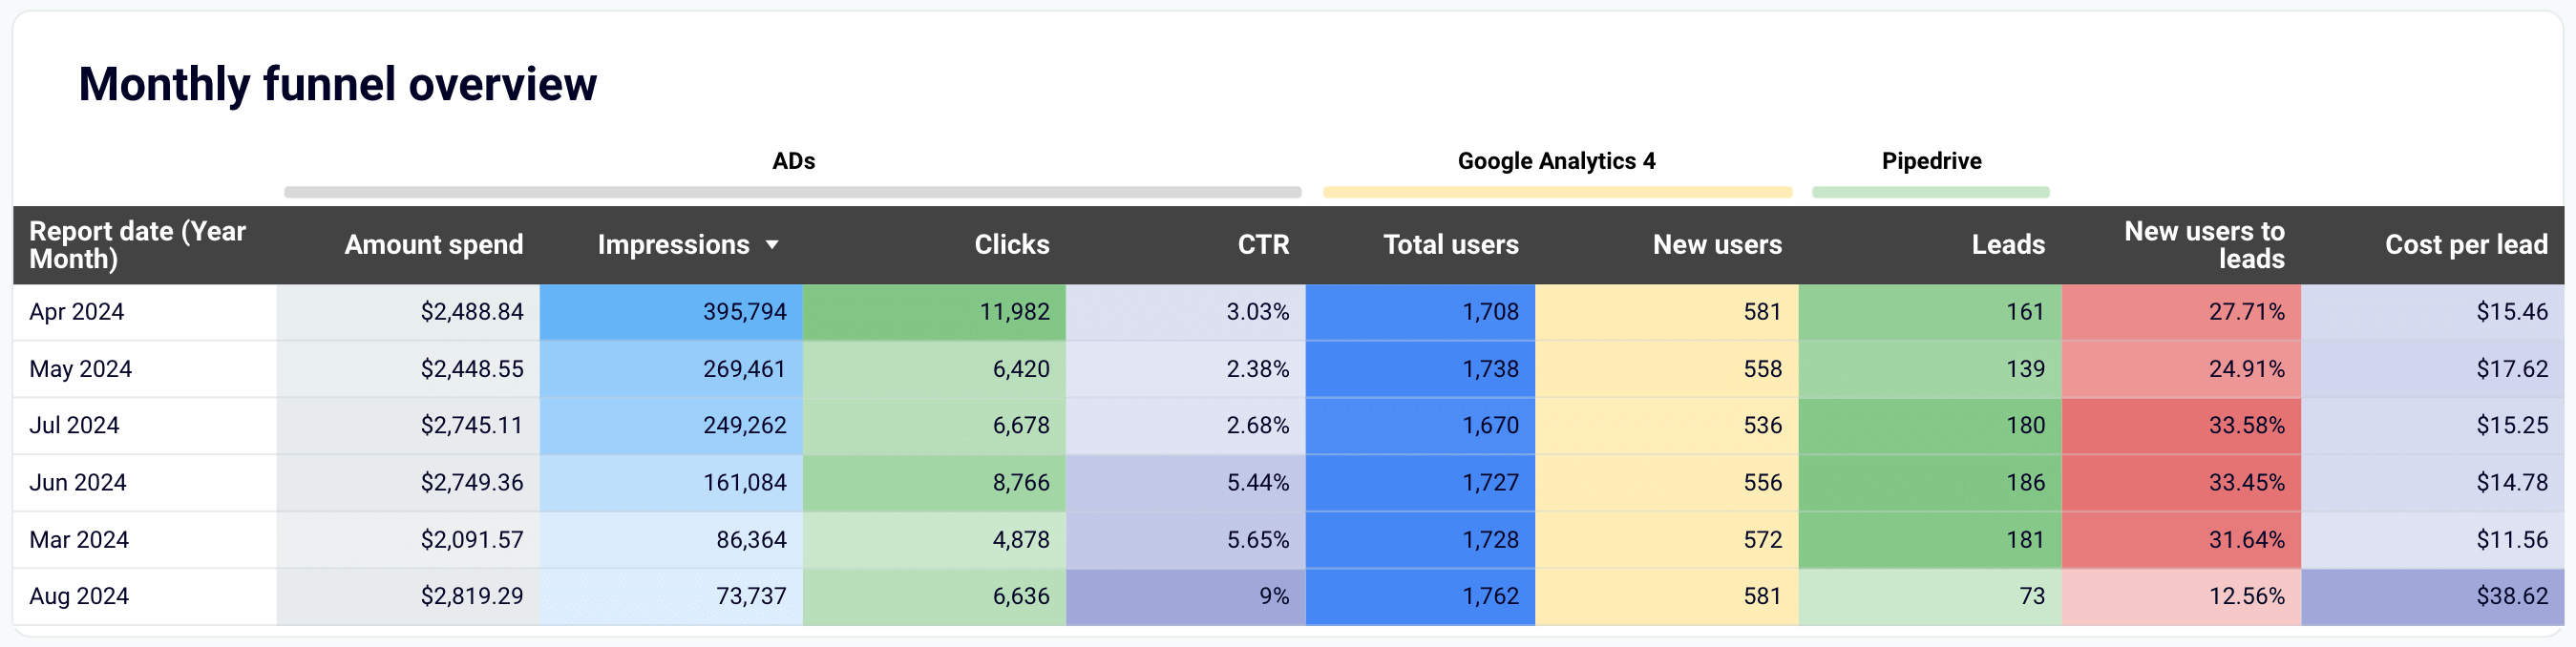
- Track the funnel month-by-month: Monitor monthly changes in your funnel to find correlations with marketing and lead generation activities. Identify your best-performing months and analyze the cross-channel marketing campaigns or activities that led to higher results, allowing you to replicate success in the future.
- Compare spending and conversion across platforms: Quickly compare your spending on different platforms with conversion rates during the same period.
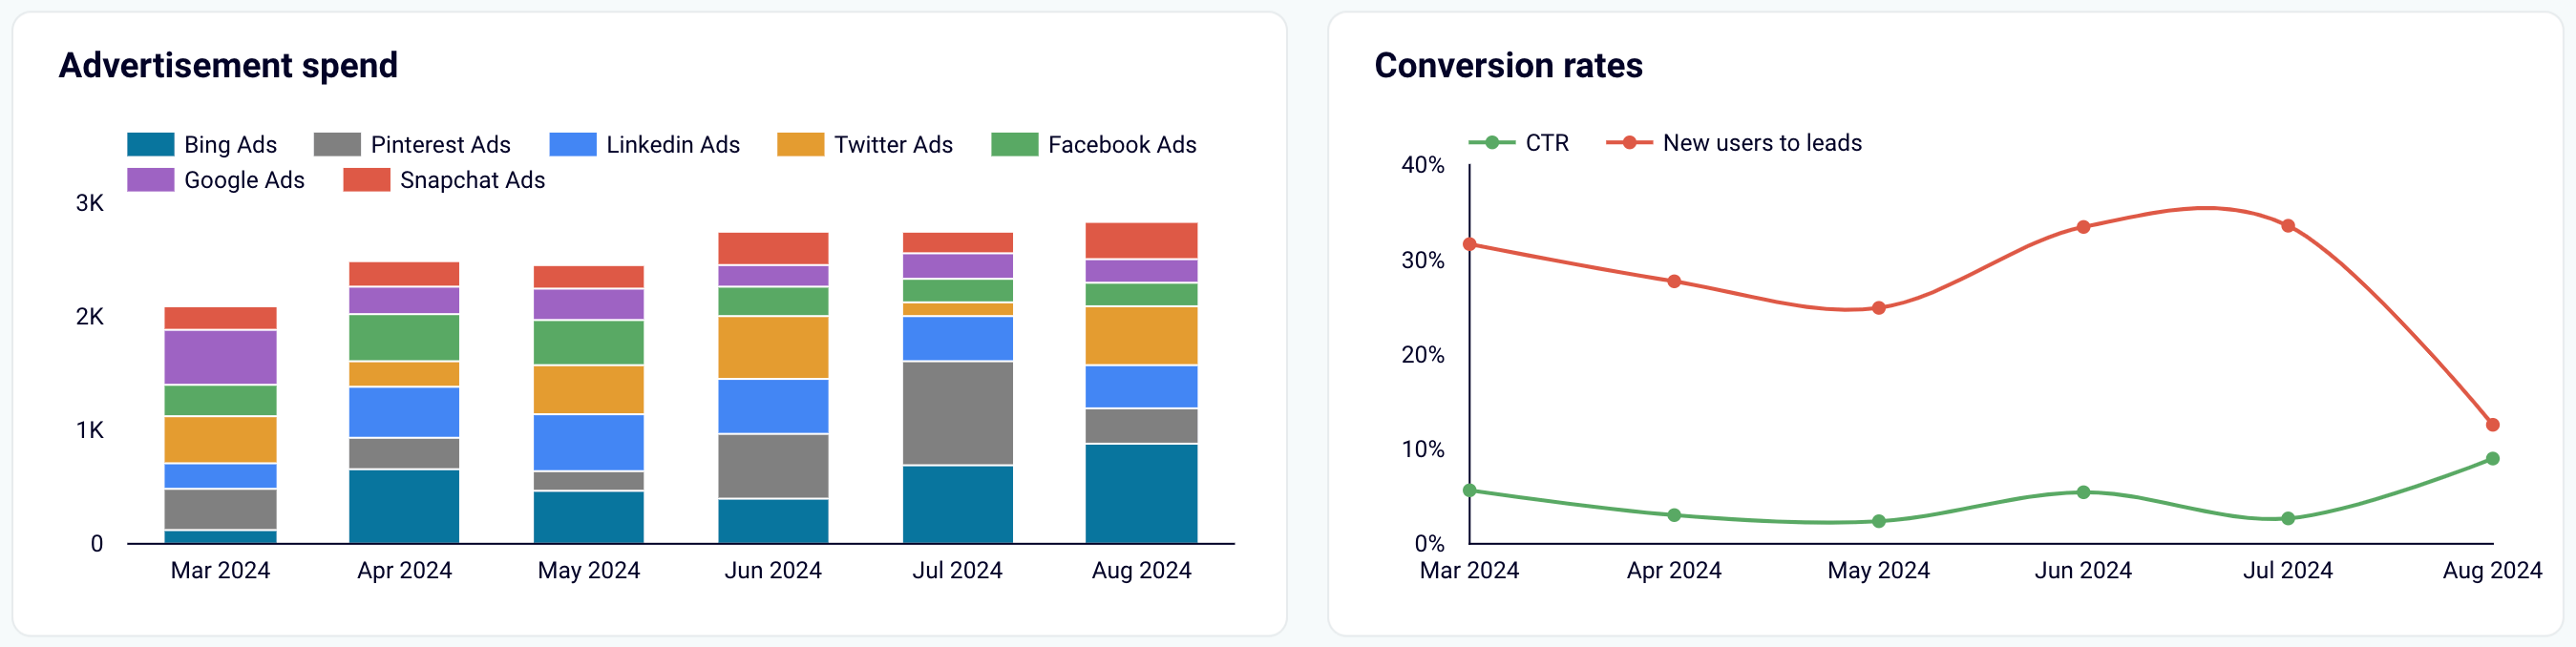
For instance, the visualization might reveal that in one month, most of your spending went to Facebook Ads while the conversion to leads decreased. This insight helps you adjust your cross-channel marketing strategy and allocate resources better.


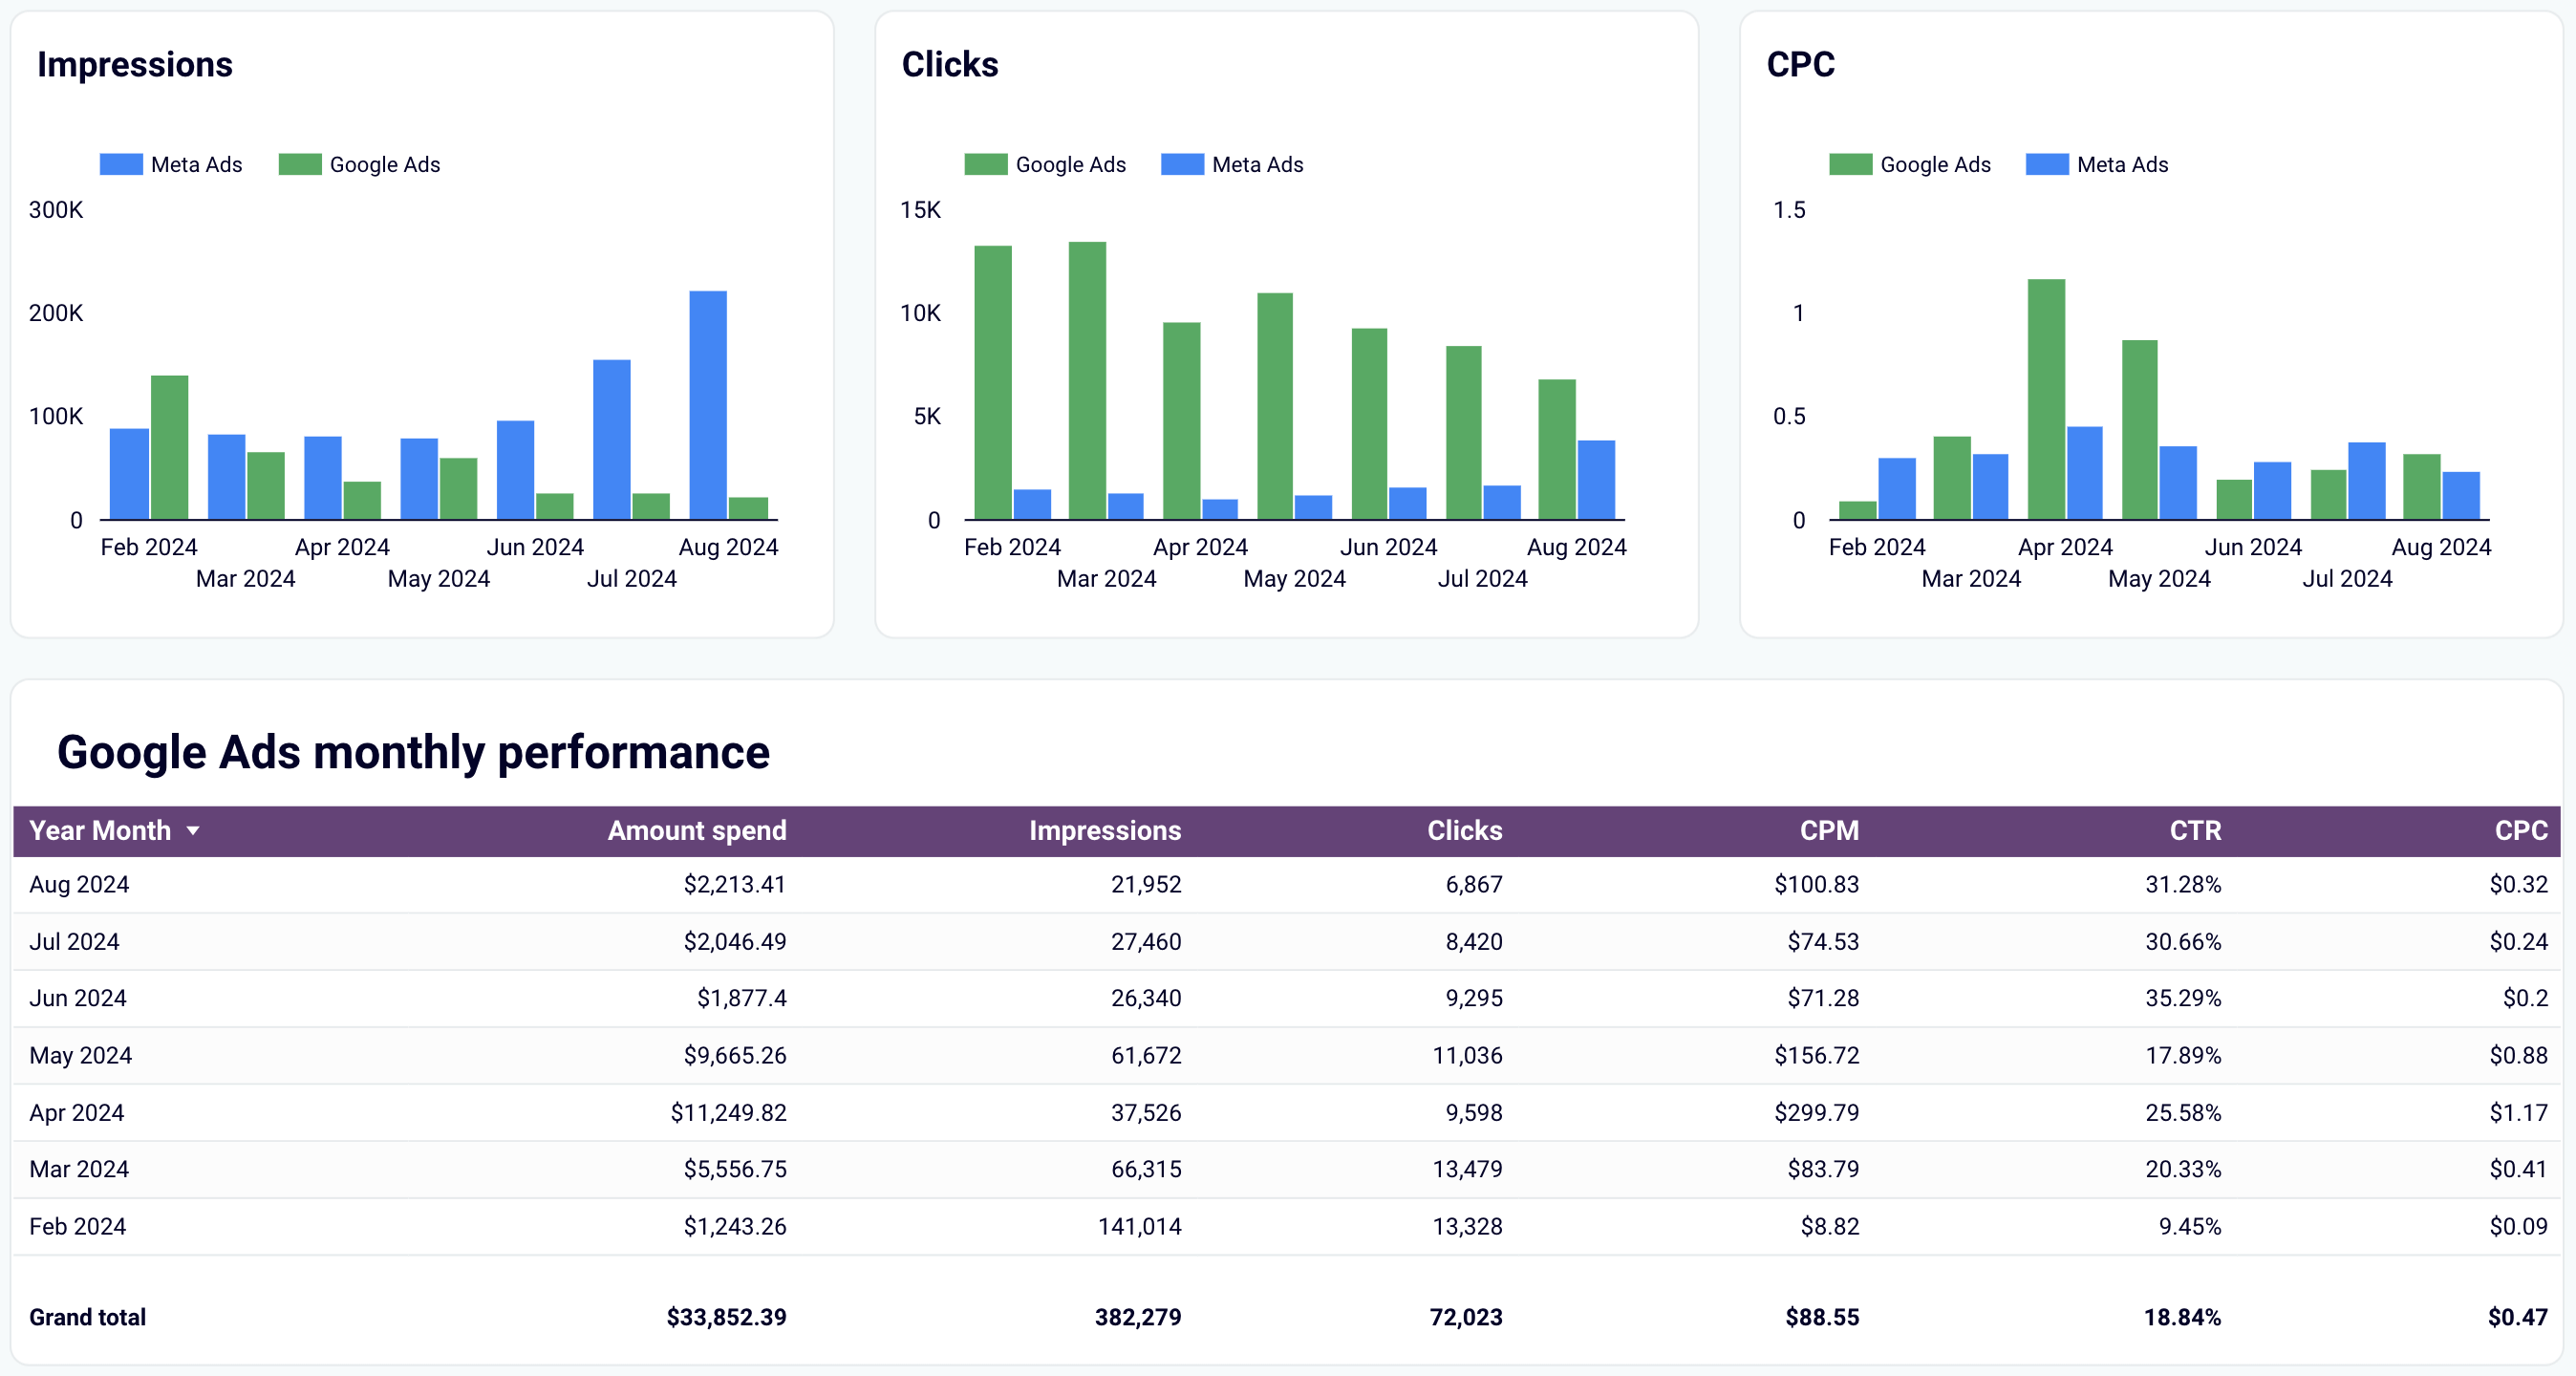
Google Ads vs. Meta Ads campaign performance dashboard
The Google Ads vs. Meta Ads dashboard in Looker Studio allows you to monitor and compare your PPC campaign performance across these two major platforms. By doing so, you can optimize your budget allocation and enhance the outcome of your campaigns.
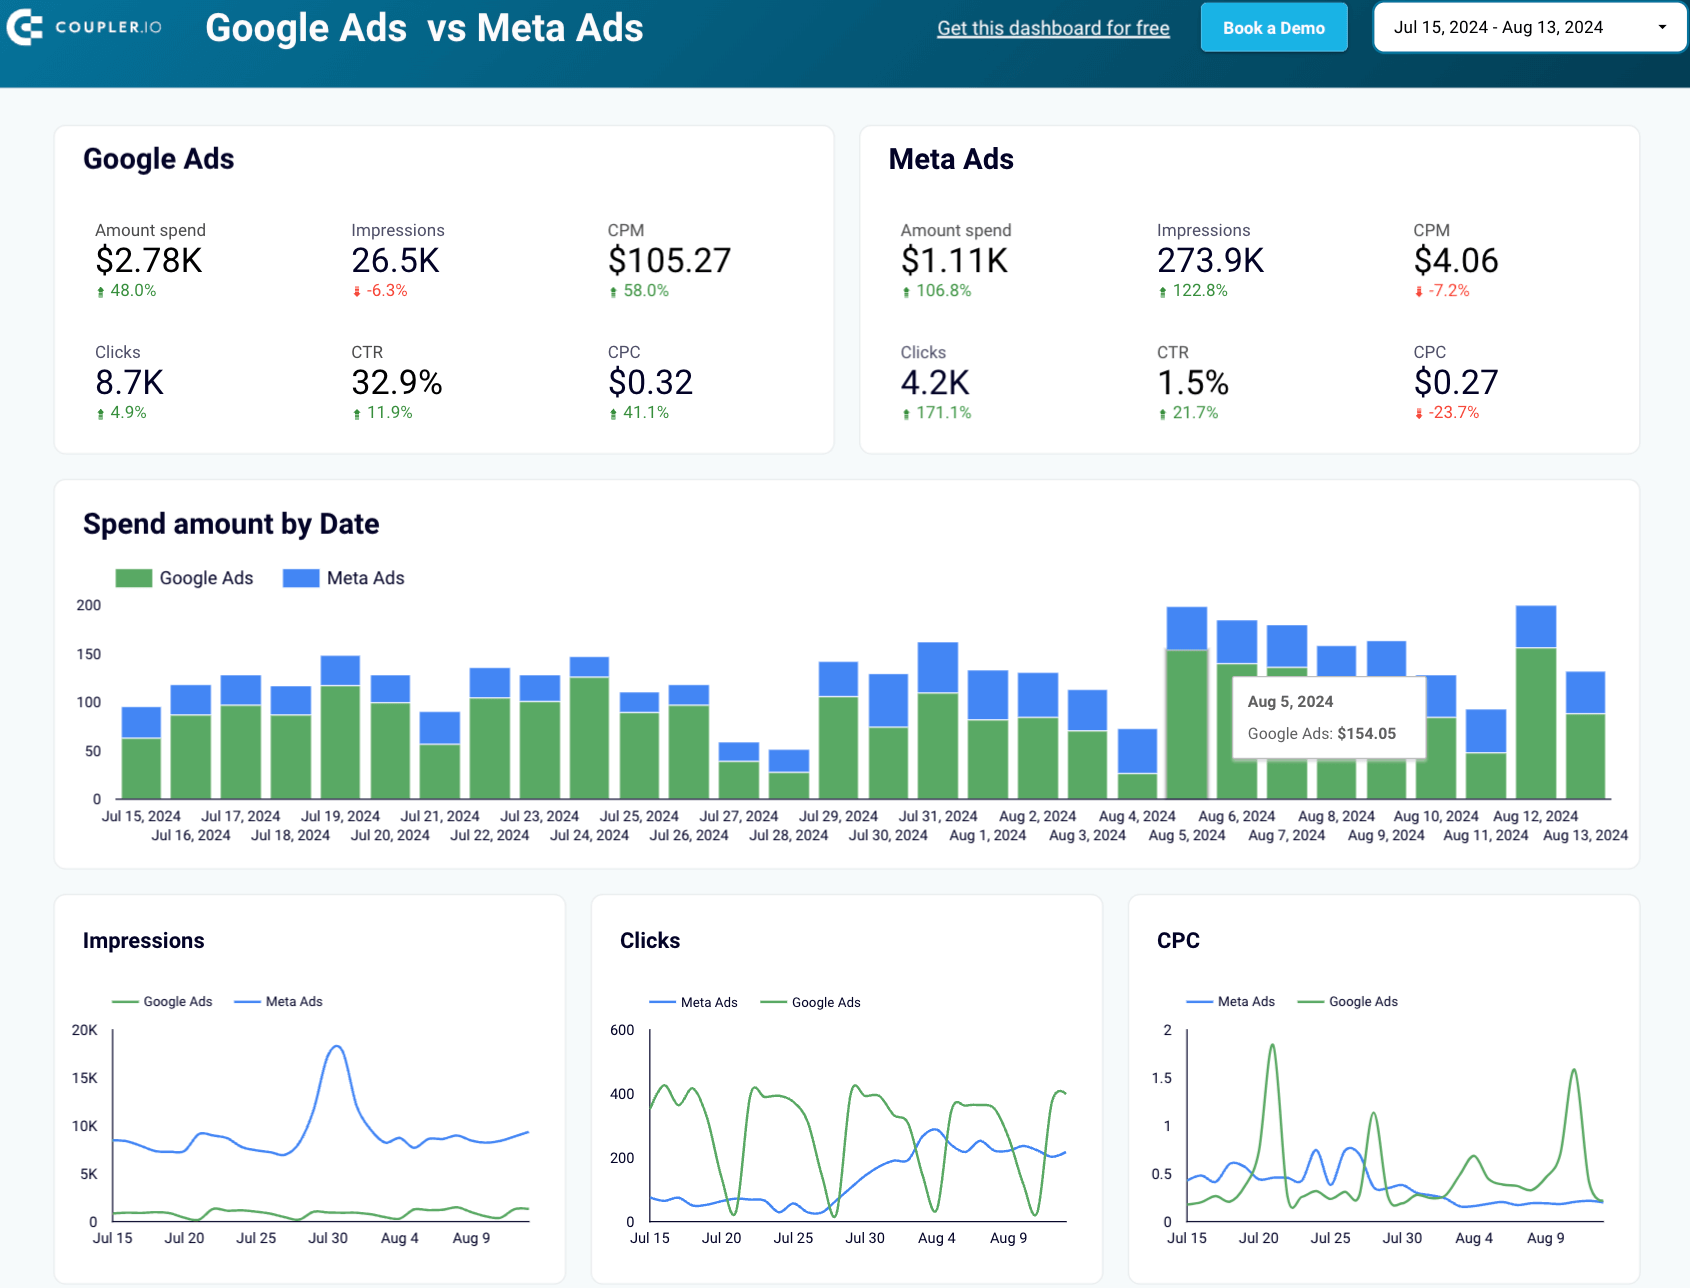
Here’s how you can put this dashboard into practice:
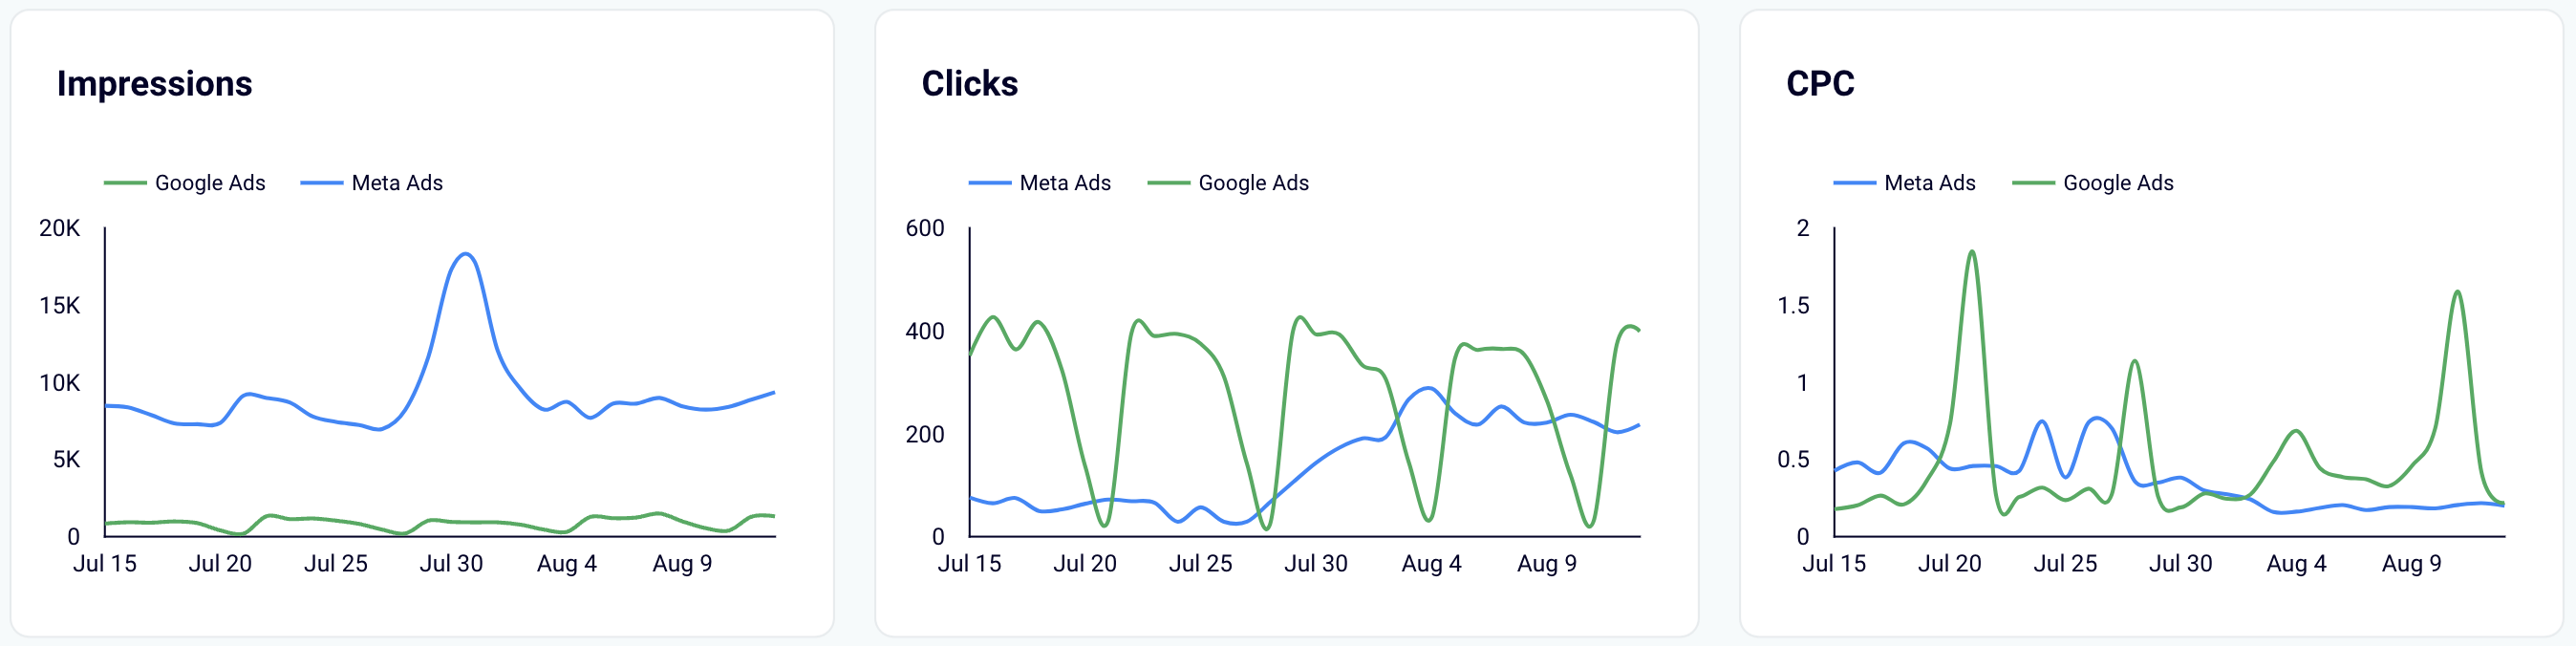
- Compare metrics across platforms: Track essential metrics to determine which platform provides better value for your investment so you can prioritize your advertising efforts.
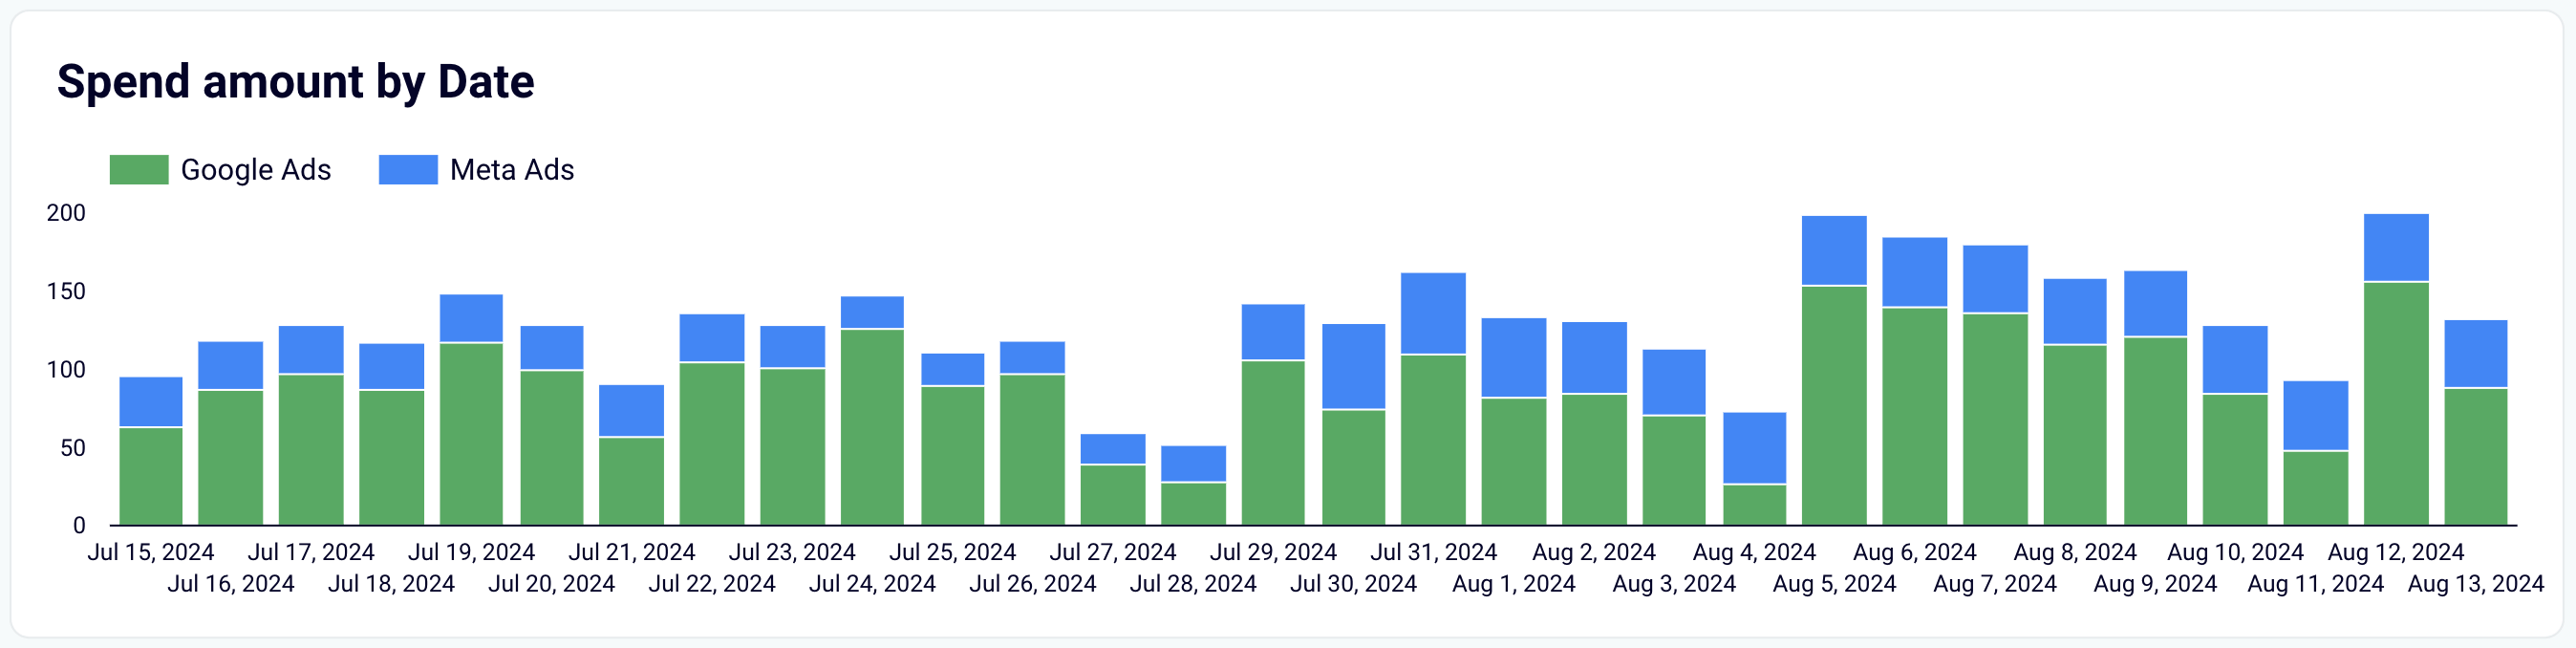
- Track spending over time: Monitor your expenditure trends to understand how much you spend on each platform over a specified period. As a result, you learn how well you manage your marketing budget and ensure your spending aligns with your campaign goals.
- Discover your monthly dynamics: Get a snapshot of your month-to-month performance to track metric trends. Proactively identify patterns, anticipate performance changes, and tweak your strategies to maintain optimal results.
Email marketing analytics dashboard for Klaviyo and GA4
This Looker Studio dashboard template is your go-to solution for monitoring and enhancing email marketing performance. It collects data from Klaviyo and GA4 to provide an in-depth look at your email campaigns.
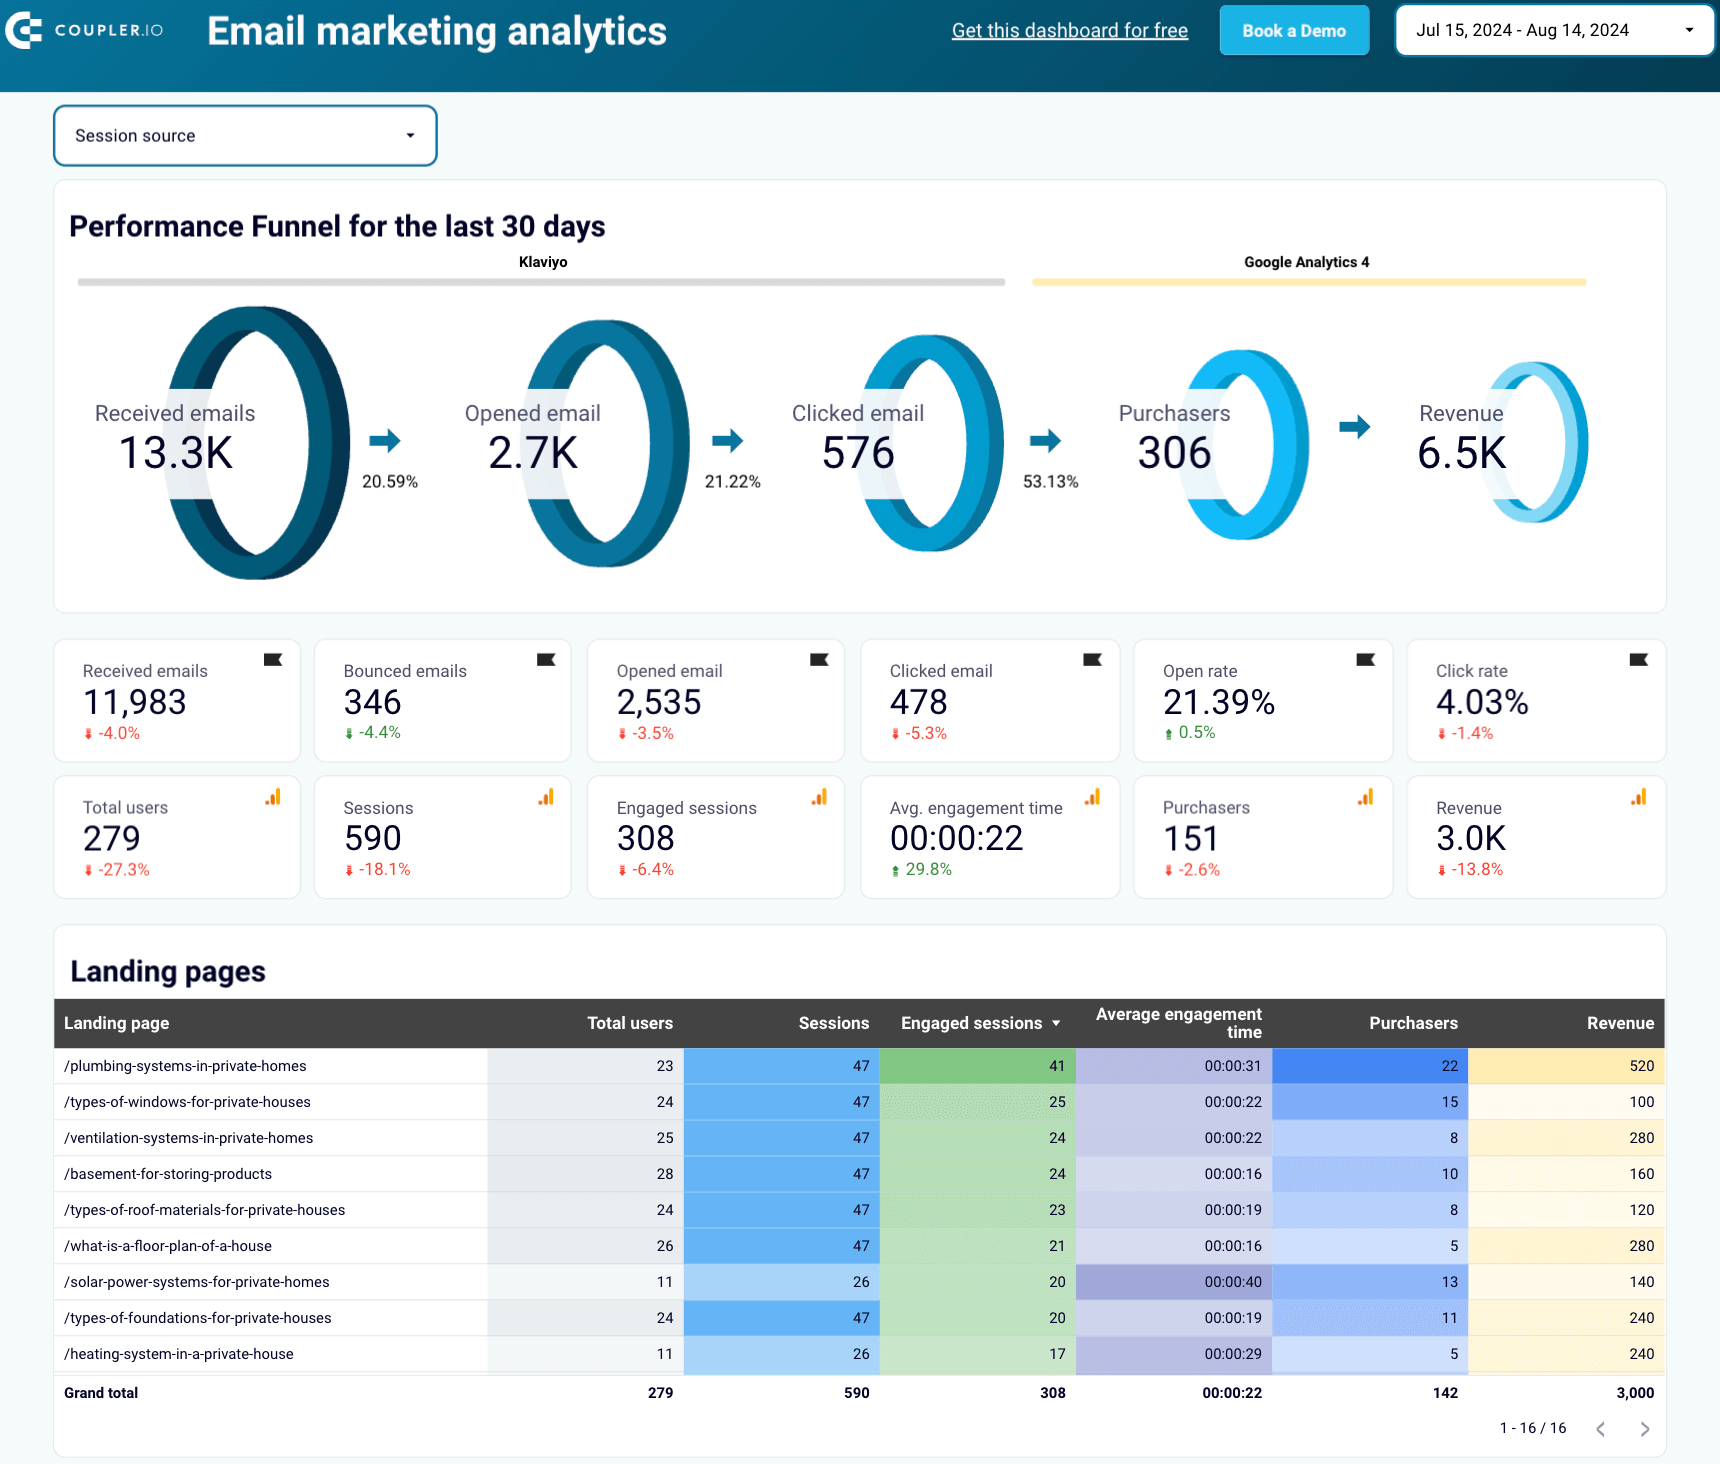
See how you can benefit from this:
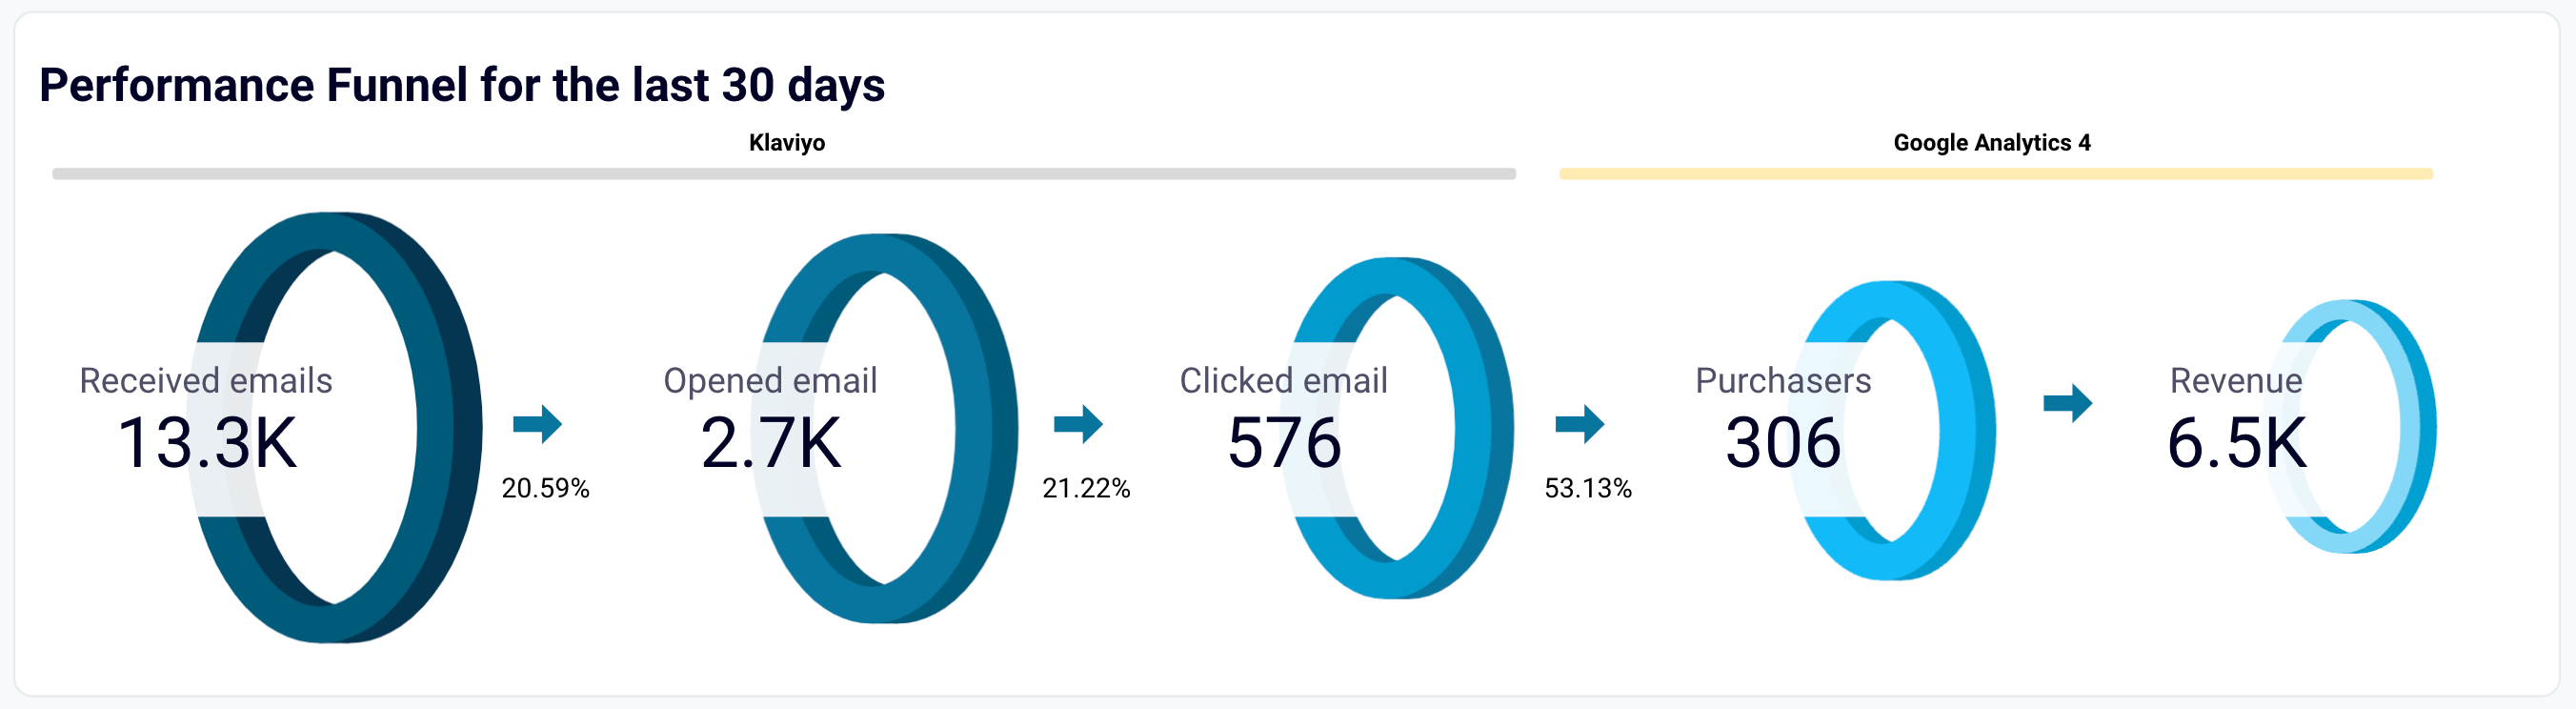
- Monitor performance funnel for the last 30 days: Track the customer decision journey from email delivery to revenue generation. You can see how many emails were received, opened, and clicked, as well as the resulting purchases and revenue. This funnel view shows how well your emails drive user engagement and conversions.
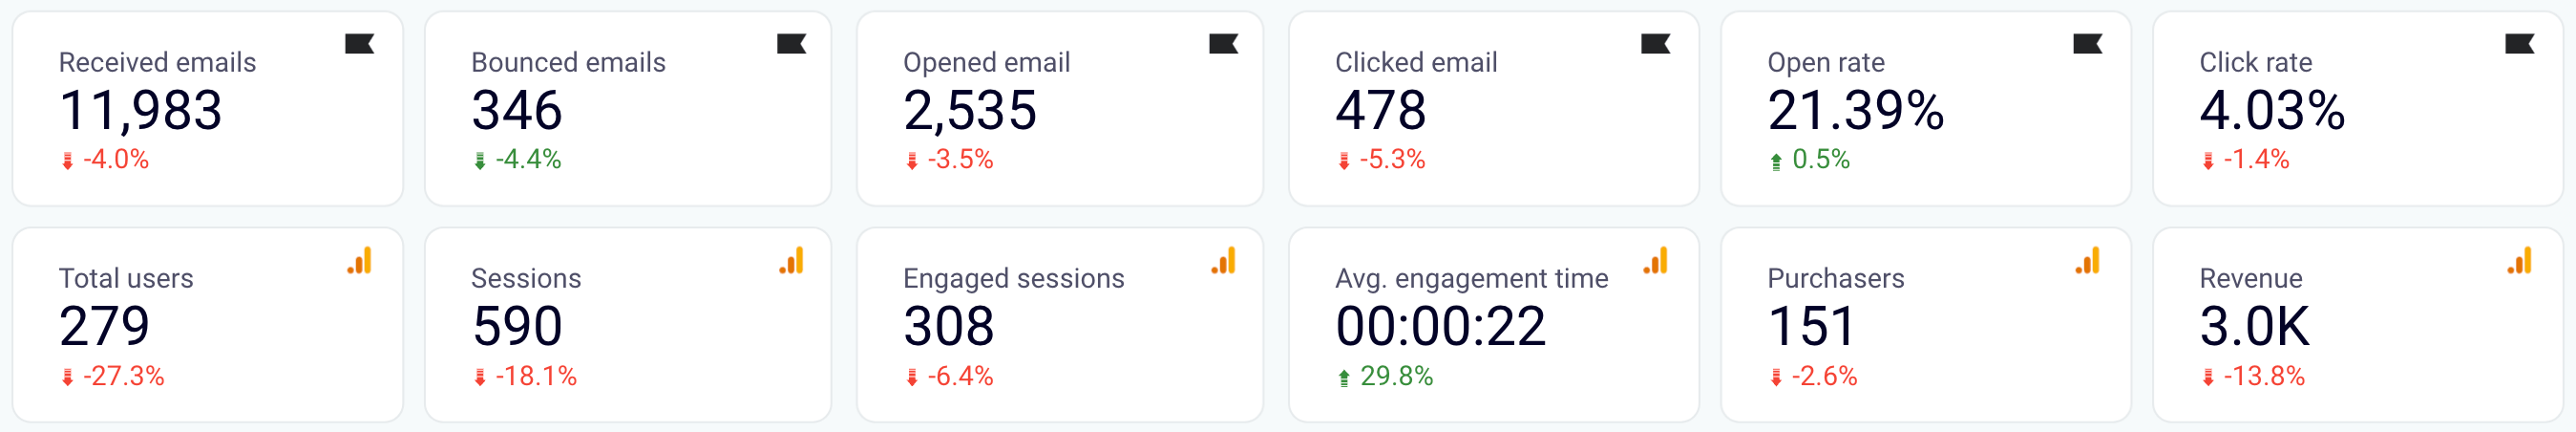
- Aggregate email metrics: Explore data on bounced emails, total users, sessions, engaged sessions, click rate, open rate, and average engagement time. These metrics reflect your email campaigns’ overall performance and help identify areas for improvement.
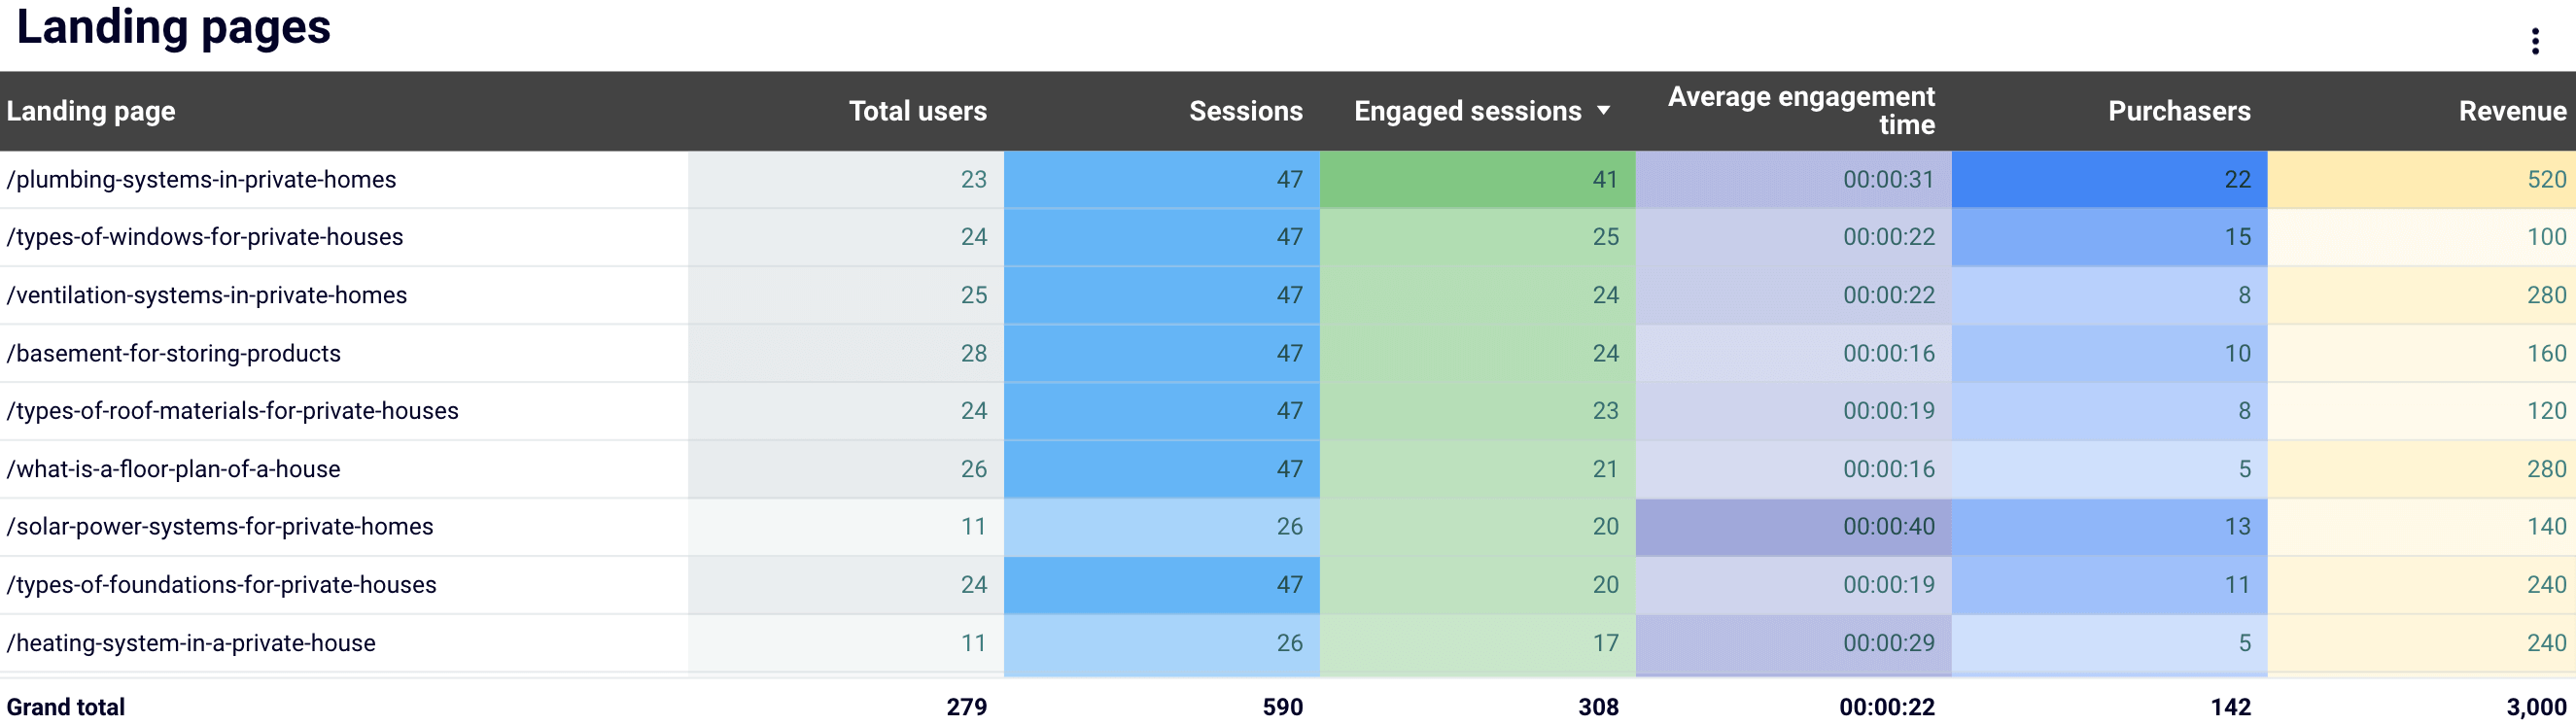
- Compare metrics by landing page or campaign: Collate metrics for each landing page or specific email campaign. Determine which pages or campaigns are most successful and take action accordingly.
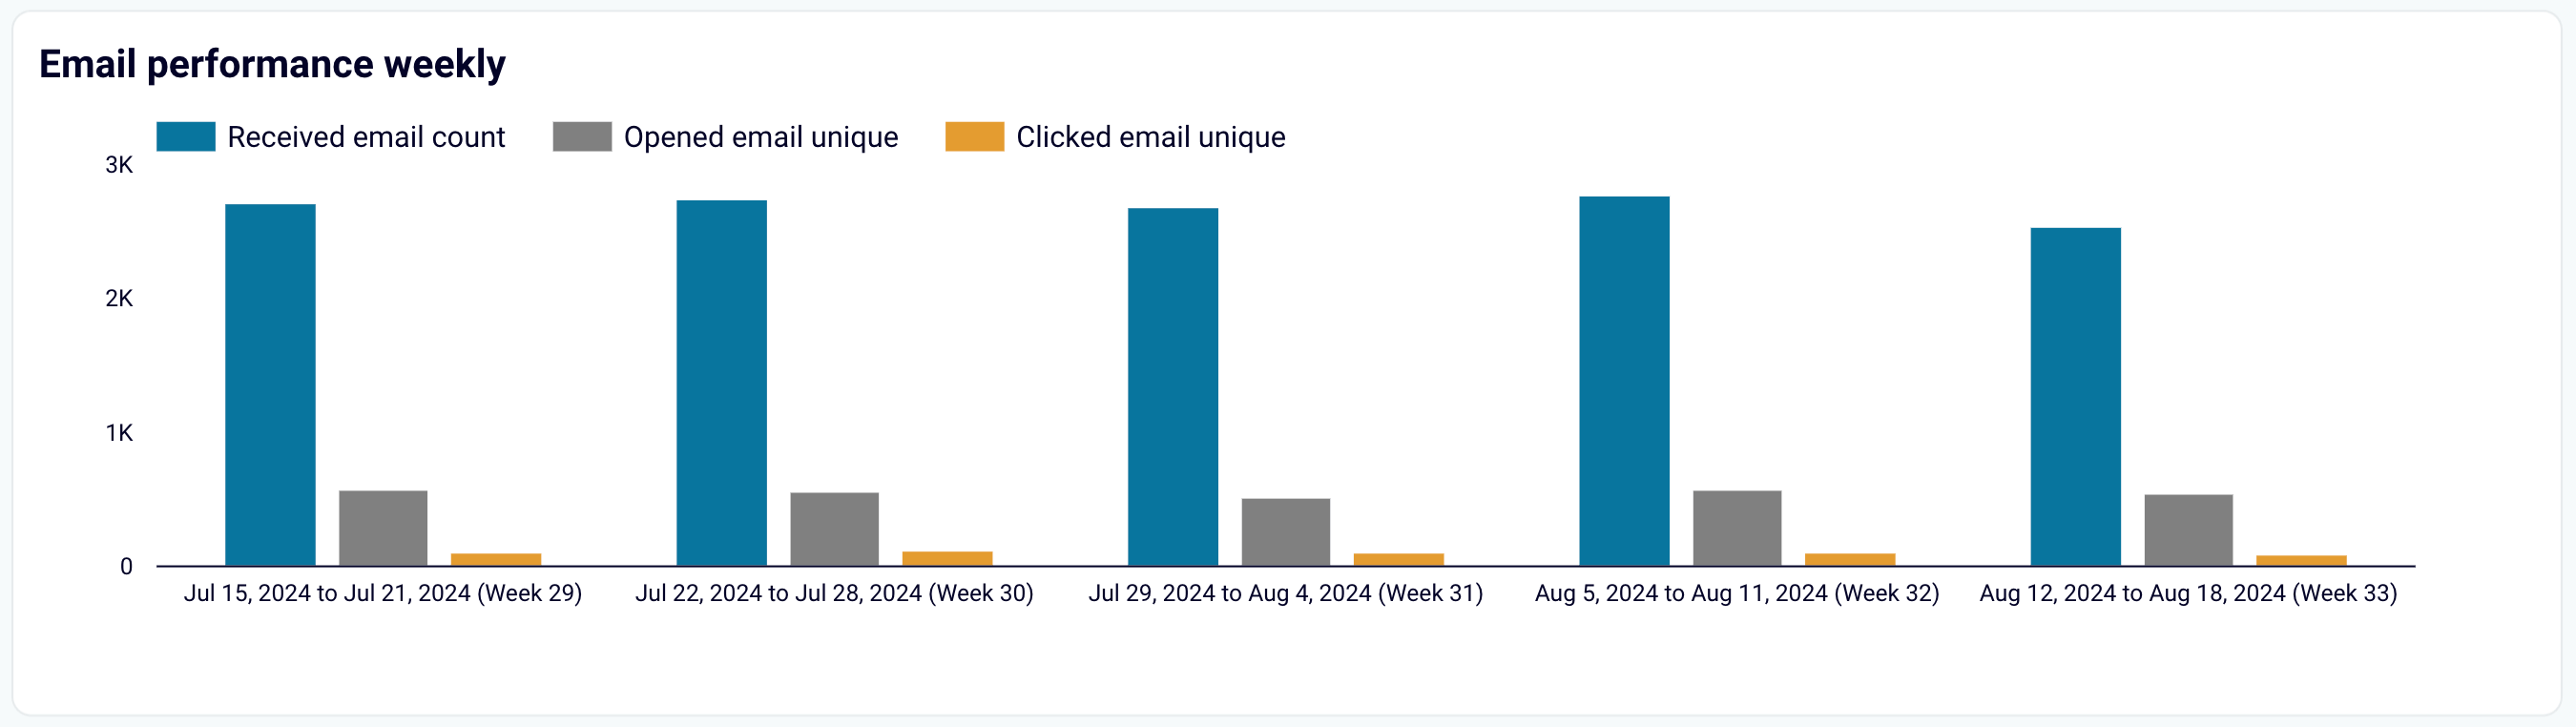
- Track weekly email performance: Be informed of fluctuations and prepare to make timely adjustments to optimize campaign results.
Reporting on GA4 conversion attribution
With GA4 as marketing attribution software, cross-channel marketing analytics allows you to track the different touchpoints that lead to conversions, also known as the conversion path. Google Analytics gives credit to each touchpoint based on its role in the conversion process. This way, you can understand how customer interactions on websites and mobile apps contribute to their journey before they convert.
GA4 offers numerous attribution models, which we can broadly categorize as follows:
- Cross-channel rules-based models: These models apply predefined rules to attribute credit for conversions. The key types include:
- Cross-channel last click: Attributes all credit to the last touchpoint before conversion.
- Cross-channel first click: Assigns all credit to the first touchpoint in the conversion path.
- Cross-channel linear: Distributes credit equally across all touchpoints.
- Cross-channel position-based: Allots a credit to the first and last touchpoints, with the remaining credit distributed among intermediate ones.
- Time decay: Grants more credit to touchpoints closer in time to the conversion, illustrating their increased influence.
- Ads-preferred rules-based model: Prioritizes credit to ads-related touchpoints over non-ad interactions.
- Data-driven attribution model: Uses machine learning algorithms to assign credit based on the actual impact of each touchpoint on conversions.
- Reporting attribution model: Provides a straightforward approach to attribution by applying predefined rules without considering the data-driven impact.
To analyze conversion paths, navigate to the Advertising ? Attribution ? Attribution paths report in your GA4 account. It allows you to view how different models impact attribution.
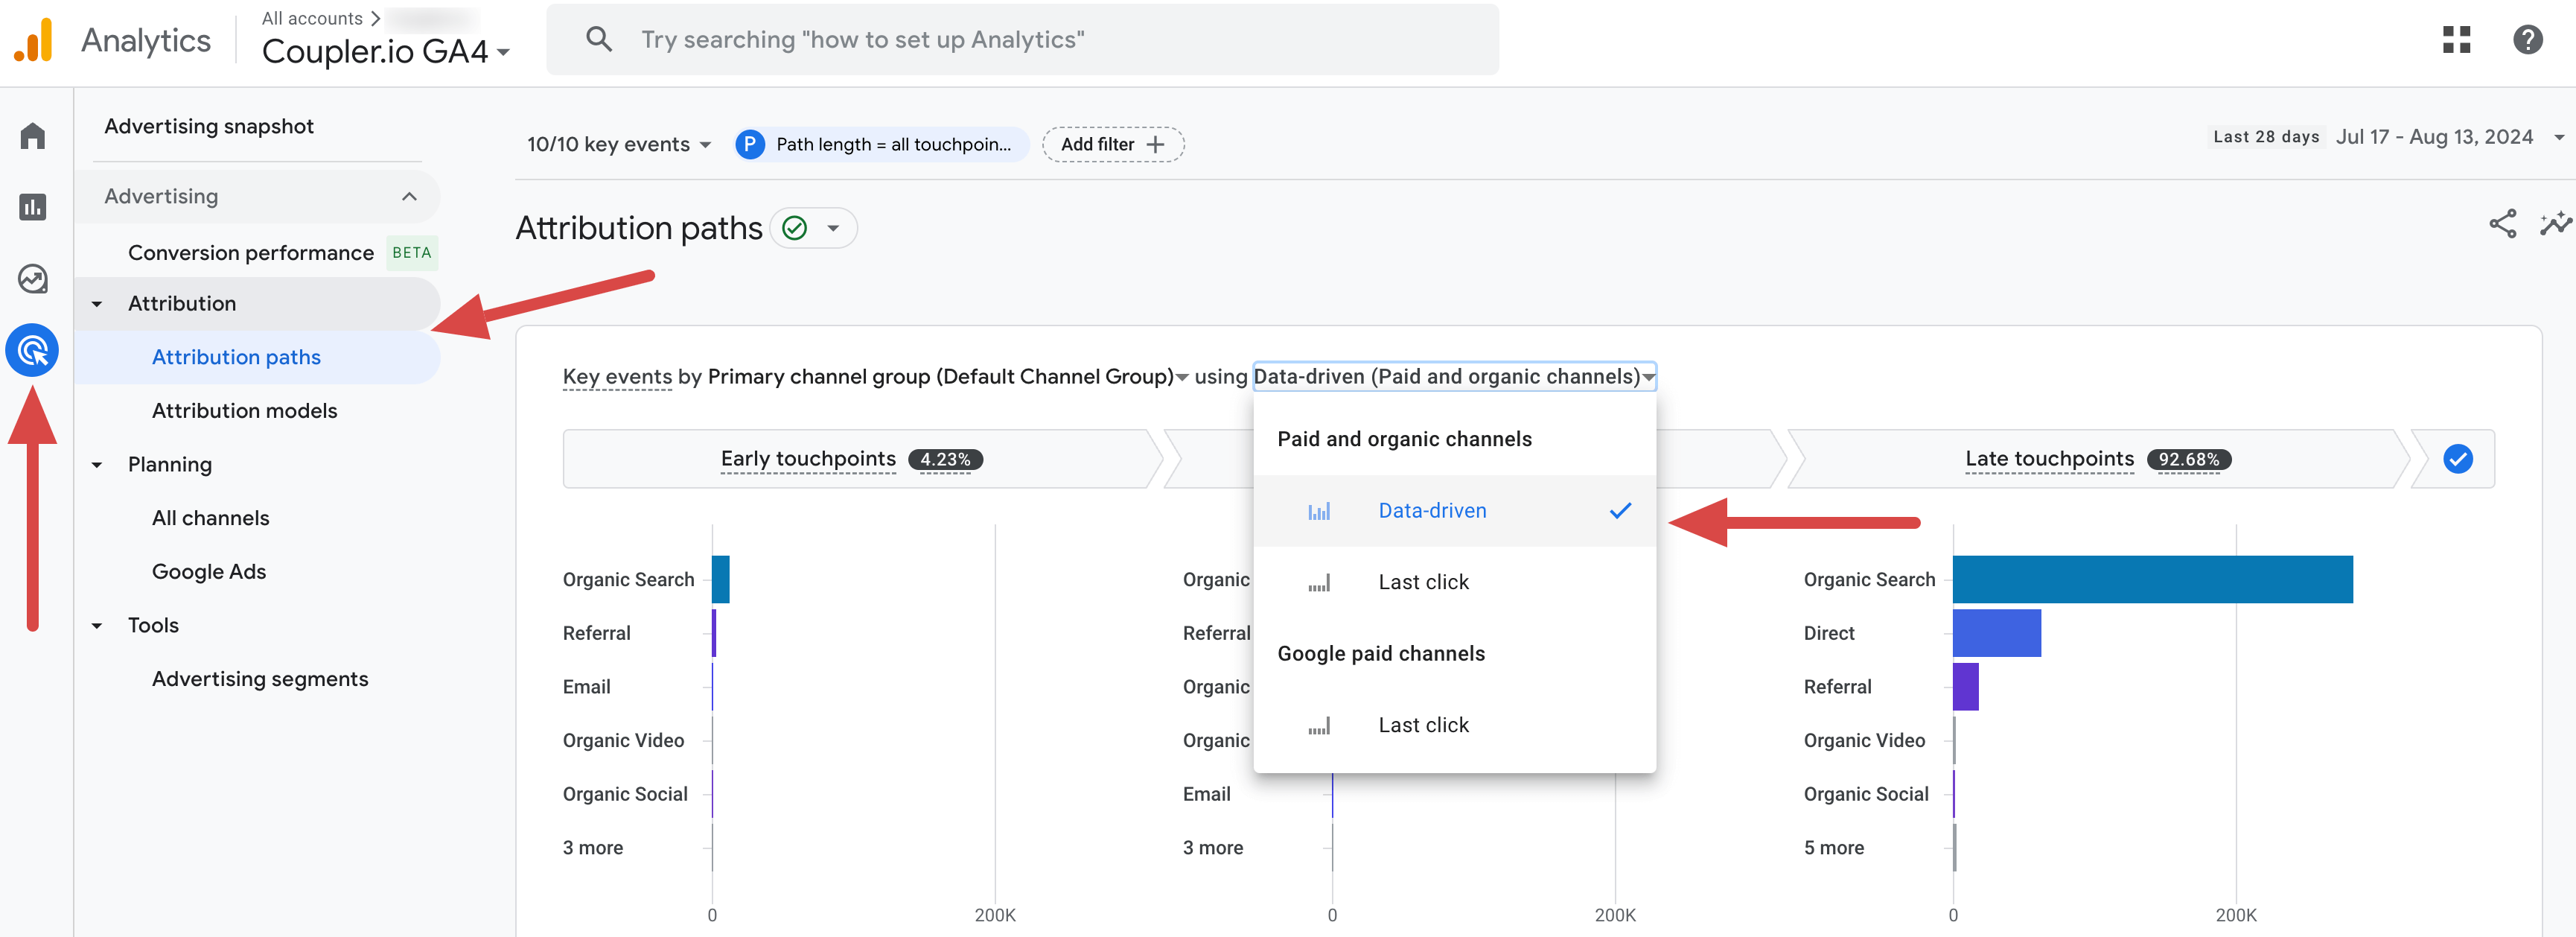
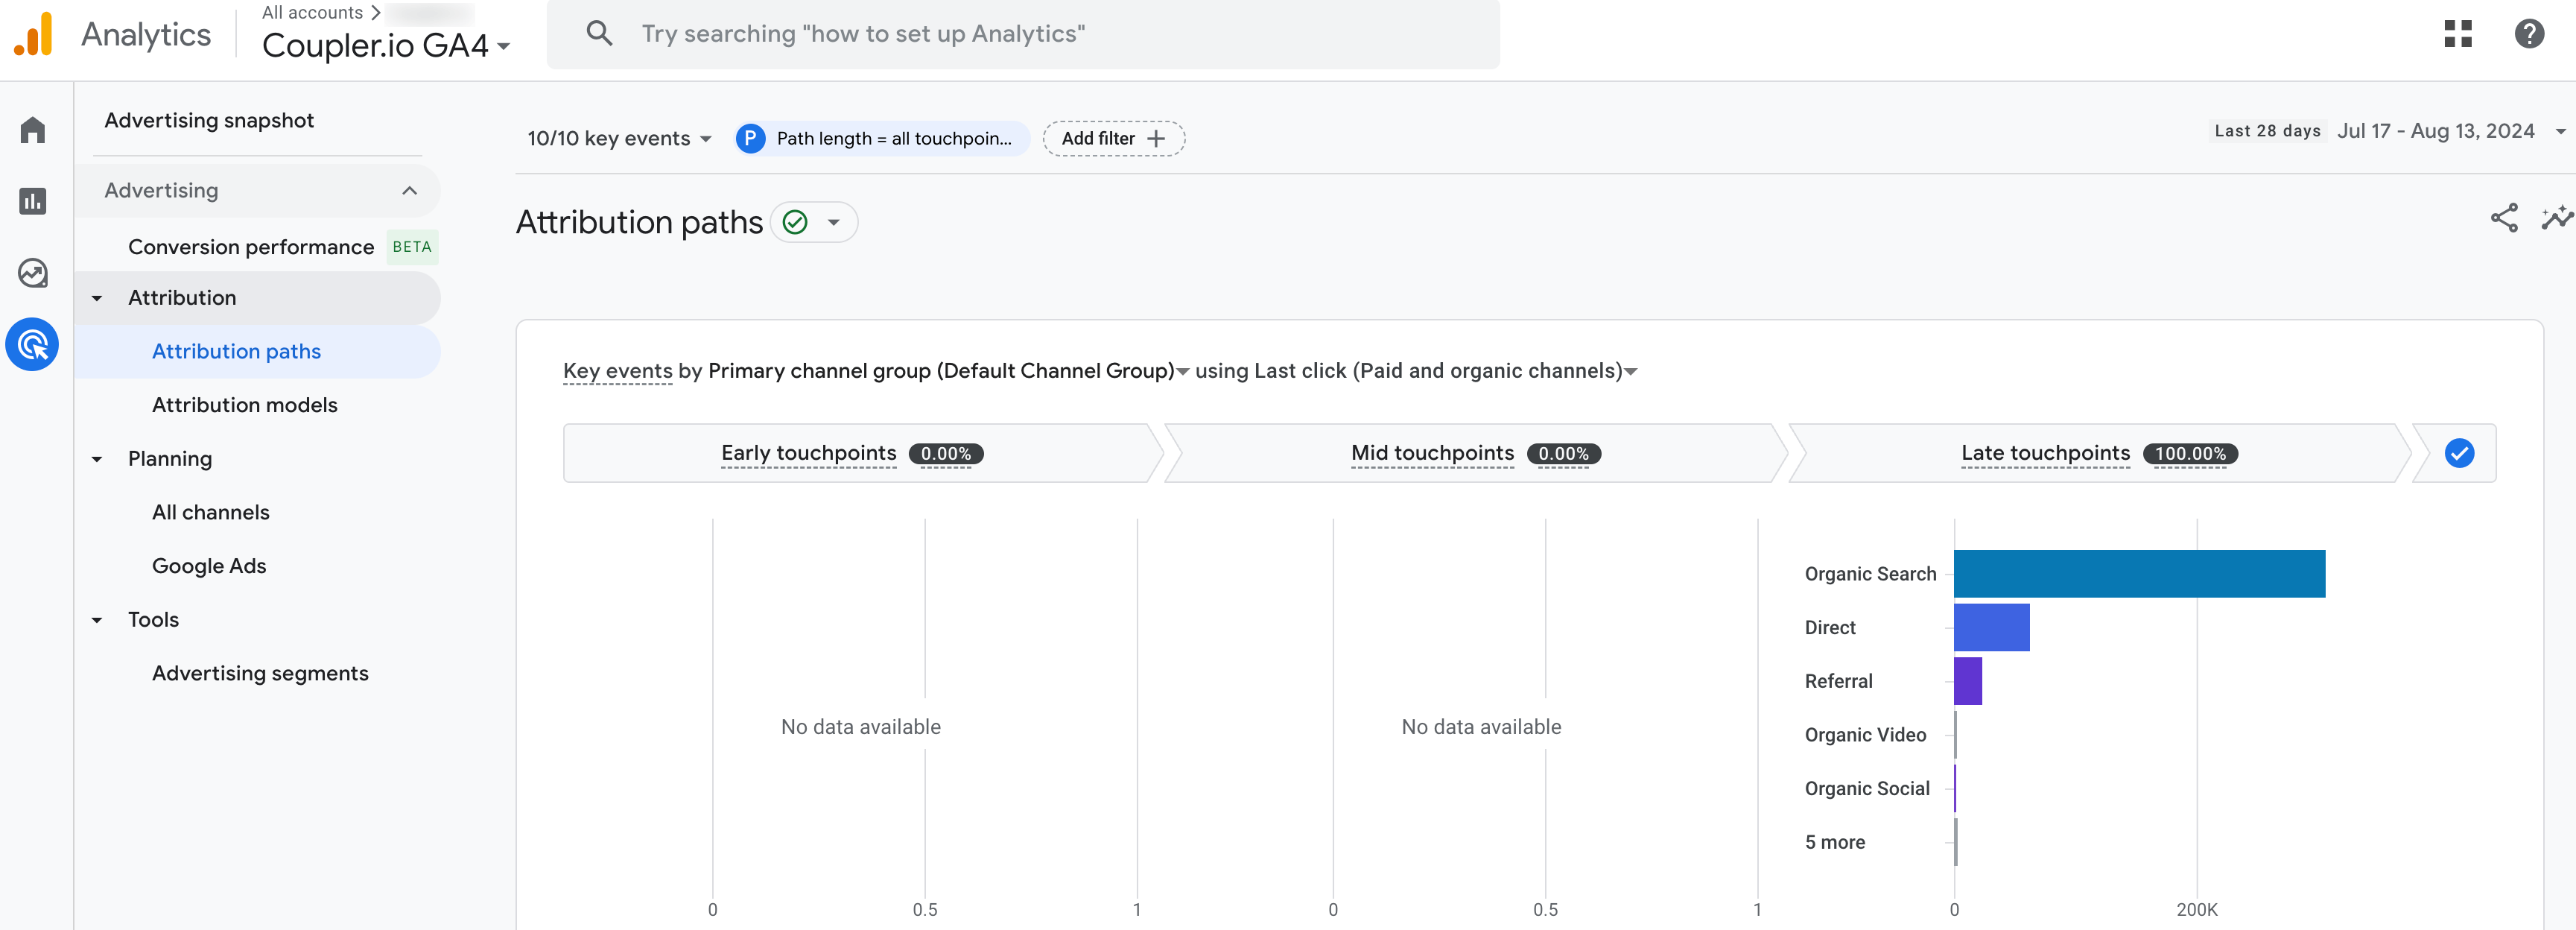
The screenshot above shows the conversion path using the Data-driven attribution model. Now, let’s select a different model, for example, Last click – you’ll see all the credit attributed only to the final touchpoints across all channels.
To analyze cross-channel marketing data, you’ll export these reports with marketing conversion metrics from GA4 and datasets from other applications. However, doing this manually can take a lot of time and effort. So, let’s explore how to optimize this process.
How to automate cross-channel marketing reporting
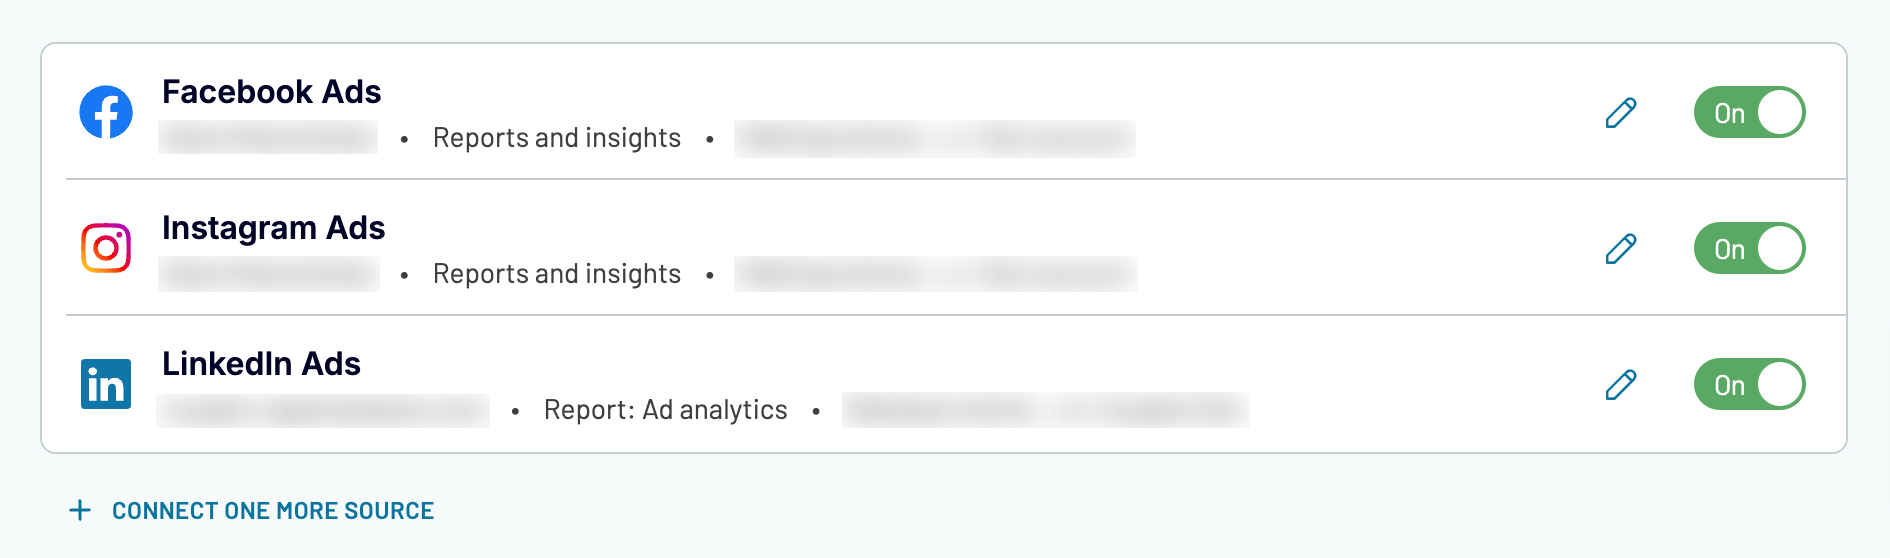
Thanks to reporting automation, you can avoid spending hours on repetitive data export and minimize the risk of human error. For example, let’s see how you can automatically create a report on advertising campaign performance across several channels: Facebook Ads, Instagram Ads, and LinkedIn Ads.
To illustrate, we’ll do this using Coupler.io:
- First, you must create a marketing ETL data flow to connect all your data sources one by one and specify the data you need for your report.
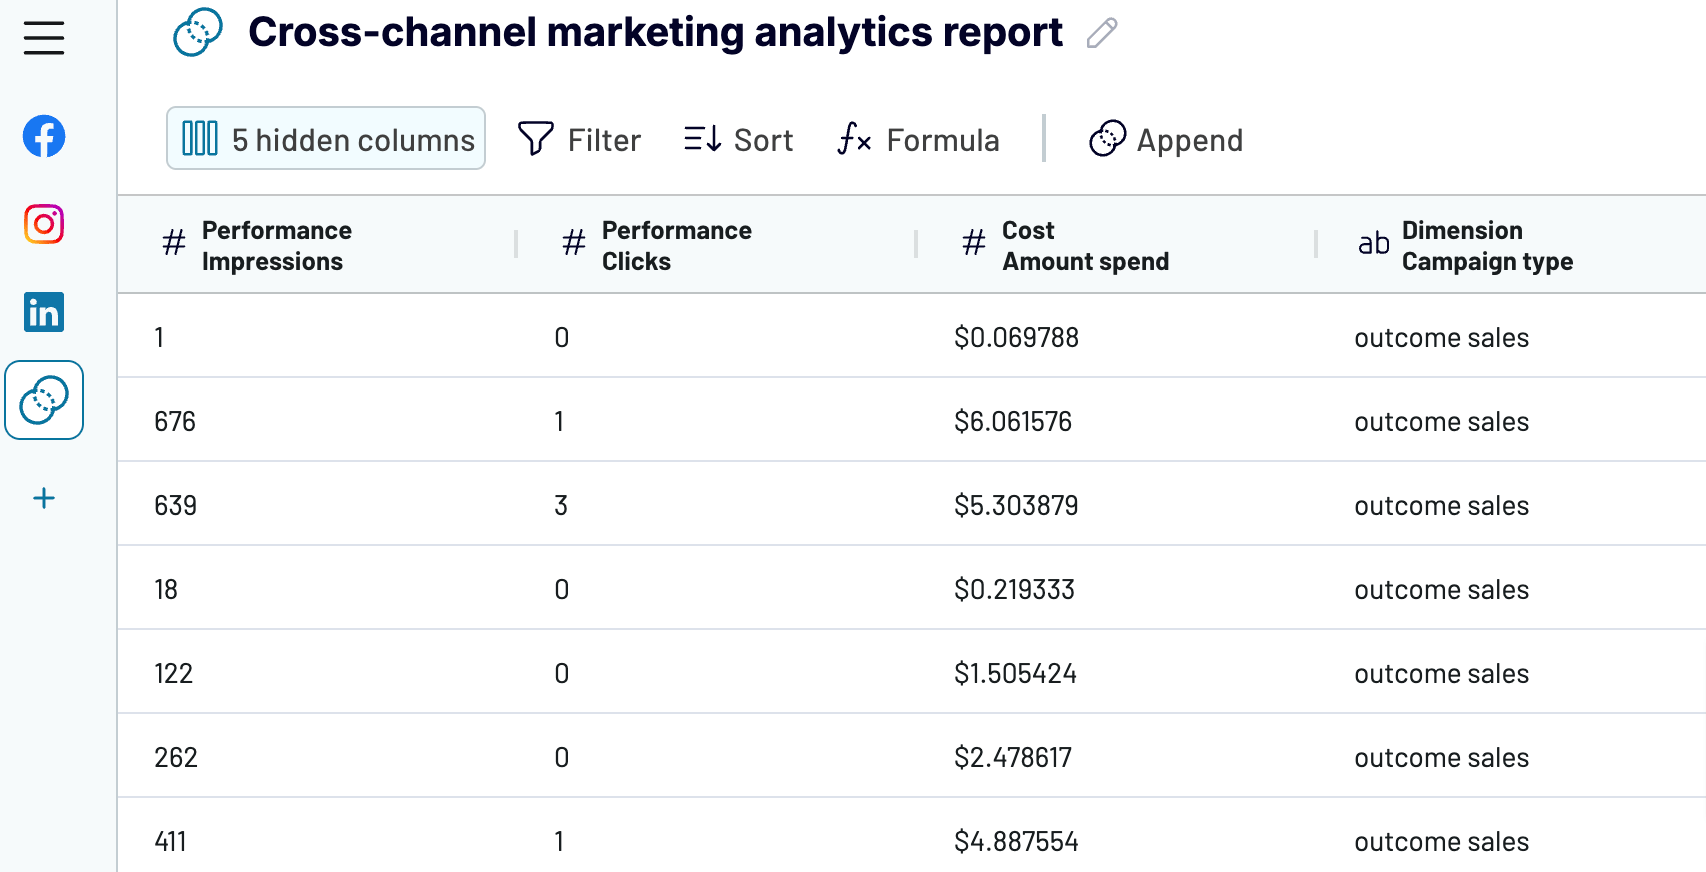
- Once you’ve connected all your sources, move forward to preview the data you’ll include in your report. In this step, you can aggregate data in the following ways:
- Append: Combine data from sources with similar structures. Columns must have matching names.
- Join: Merge data from sources with different structures. Select one or multiple shared columns to link.
For instance, let’s append data from your sources. Here’s what it looks like:
Additionally, Coupler.io lets you:
- Rename, rearrange, hide, or add columns.
- Apply filters and sort your data.
- Create new columns with custom formulas.
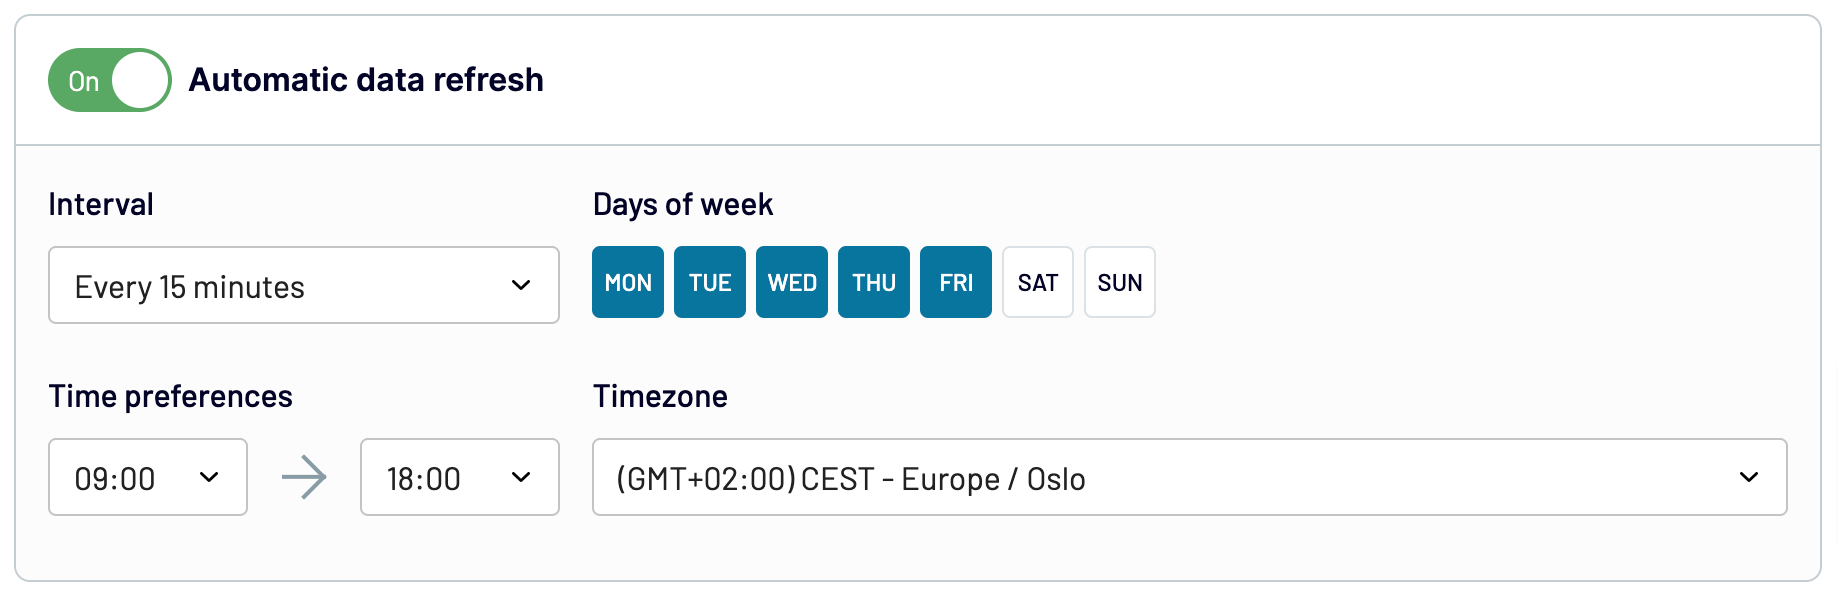
That’s it – now you have data from all your sources in a single report. Next, connect to your destination by following in-app instructions. Lastly, set up a schedule for automated updates. You can select an interval from monthly to daily or as frequently as every 15 minutes to make your report nearly real-time.
With Coupler.io, you can build a cross-channel report for your specific needs. It automatically imports data from over 70 business apps into spreadsheets, BI tools, and, optionally, data warehouses.
What tools to use for cross-channel marketing analytics
As you see, data automation is the core component of cross-channel marketing reporting. Coupler.io automatically collects data from various marketing channels – such as ad platforms, CRM software, and social media – allowing you to create reports on the go and import them into your desired destination.
The automated data refresh functionality enables you to synchronize your reports with the latest changes to your sources. You can also utilize free marketing dashboards for data analysis based on preset criteria.
To wrap up, let’s overview the analytics tools where you can import your cross-channel marketing data:
- Spreadsheet apps like Google Sheets or Microsoft Excel allow you to create custom reports and dashboards to visualize and manage your cross-channel marketing performance. They’re a go-to option for quick and straightforward marketing reporting.
- Business intelligence tools like Tableau, Power BI, Looker Studio, and Qlik enable you to delve deeper into your data. They offer advanced visual analytics capabilities that help you reveal patterns and connections across your marketing channels.
- Data warehouses like BigQuery or Redshift store and manage large volumes of data from multiple sources. They can centralize your marketing data to ensure consistency and perform complex analysis.
Try Coupler.io for free and experience the benefits of automated data management for cross-channel marketing analytics.

Automate reporting with Coupler.io
Get started for free