Where is the native QuickBooks Online connector in Power BI?
Power BI’s native QuickBooks connector, which worked via the QuickBooks ODBC Driver, was deprecated in August 2025, and Microsoft has no plans to replace it. That leaves a gap for anyone who needs to load data from QuickBooks to Power BI to visualize financial information in dashboards.
Coupler.io fills that gap with its no-code QuickBooks connector. It lets you connect QuickBooks to Microsoft Power BI and other tools, provides built-in report and dashboard templates, supports AI analytics, and more.
Easy-to-use QuickBooks to Power BI integration by Coupler.io
Coupler.io is a data integration platform and AI analytics solution that connects QuickBooks and 400+ other sources to spreadsheets, BI tools, data warehouses, and AI tools. The setup to automate exports of financial data from QuickBooks to Power BI takes a couple of minutes:
Step 1: Collect your QuickBooks data
Sign up for Coupler.io for free and create a new data flow with QuickBooks or QuickBooks Reports as a data source.
QuickBooks – you get raw transactional records such as invoices, customers, payments, bills, and so on.
QuickBooks Reports – you get the same preset reports you’d find inside QuickBooks itself: Balance Sheet, Profit and Loss, Cash Flow, Vendor Balance, Accounts Receivable Aging, and others.
Or you can start right away with the pre-configured form below. Just click Proceed, and you’ll be offered to sign up for free with no credit card required. Feel free to change QuickBooks to QuickBooks Reports if you want to export a preset QBO report.
Then connect your QuickBooks account and choose the data entity or report you want to export. You can add multiple data entities to your data flow and combine raw data with reports. For example, to build a QuickBooks Profit and Loss comparison, add two P&L summary reports for different periods.
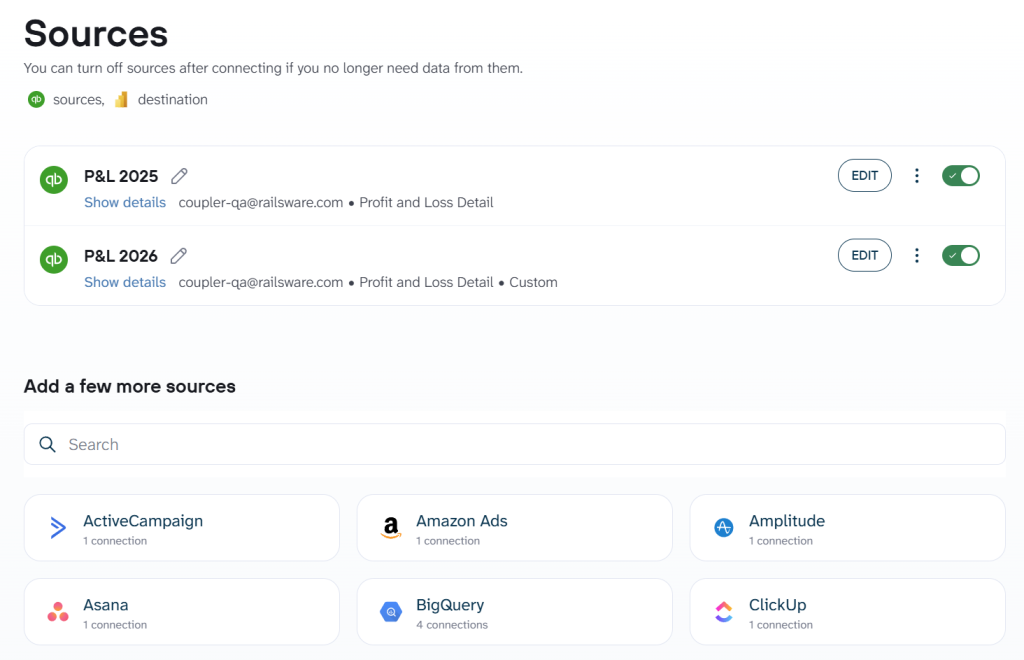
And, of course, your QuickBooks to Power BI data export can be enriched with other sources such as CRM apps, ecommerce tools, marketing platforms, and other apps from over 400 supported by Coupler.io.
Step 2: Organize QuickBooks data set
Before your QuickBooks data reaches Power BI, you can shape it to match your reporting needs. Filter out columns you don’t need, rename fields for clarity, add calculated columns, or aggregate values. If you collected data from multiple QuickBooks entities or other sources, you can combine them here:
- Append – stack data sets with the same structure vertically (e.g., combining P&L reports from different periods)
- Join – combine two or more data sets horizontally using a shared key column (e.g., matching invoices to customers by customer ID)
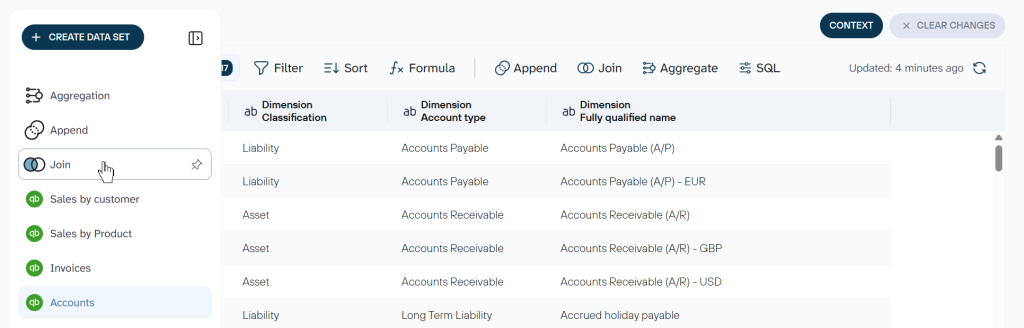
If you plan to use AI analytics later, this is also where you control what data AI will see. Hide sensitive fields like individual transaction amounts or customer contact details at this stage. You can also add context to your data, such as descriptions of what specific fields or metrics mean in your company. This context improves the quality of AI analytics results when you ask questions about the data later.
Instead of building transformations from scratch, you can start from a QuickBooks data set template. These are preconfigured QuickBooks data flows with aggregations, calculations, and column adjustments already in place. Available templates cover common financial reporting needs:
- Revenue and invoicing: Revenue analysis, Revenue by customer, Invoice aging
- Expenses and payables: Expense breakdown, Accounts payable aging, Vendor spending
- Profit and loss: P&L summary, P&L by period comparison, P&L by class/department
- Balance sheet and cash flow: Balance sheet overview, Cash flow summary, Trial balance
- Receivables and collections: Accounts receivable aging, Customer balance tracking, Payment history
To use one, create a new data flow from a template and filter by QuickBooks or QuickBooks Reports as the source.
Step 3: Load data to Power BI and schedule updates
Generate an integration URL in Coupler.io and copy it. Then open Power BI Desktop, go to Get Data > Web, and paste the link.
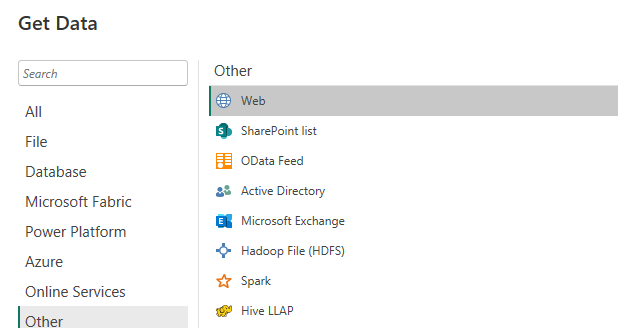
Power Query Editor will show a preview of your data where you can make additional adjustments if needed. Load the data to start building visualizations and reports.
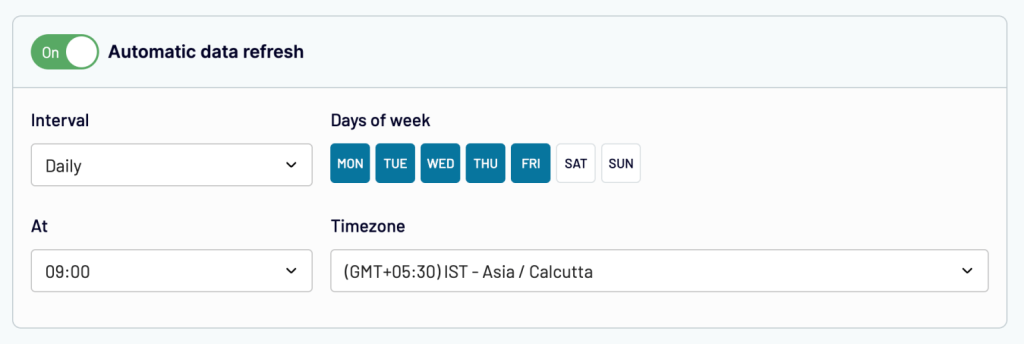
Within the same data flow for finance automation, you can send your QuickBooks data to Power BI and other destinations at once. For example, use Power BI for executive dashboards, Google Sheets for a team-level working file, and Claude or ChatGPT for conversational analysis, and so on. All the destinations will get fresh QuickBooks data automatically once you enable Automatic Data Refresh and set your preferred schedule.
Bonus step: Talk to AI right in Coupler.io
With your QuickBooks data connected to Power BI, you can also benefit from Coupler.io’s AI analytics to get answers that go beyond what a static dashboard shows.
AI Agent is built into Coupler.io and works with any data flow you’ve created. Ask a question in plain English, and Coupler.io’s Analytical Engine runs the calculations on your QuickBooks data first, then passes confirmed numbers to the AI. The AI doesn’t guess but works with computed results, not raw data.
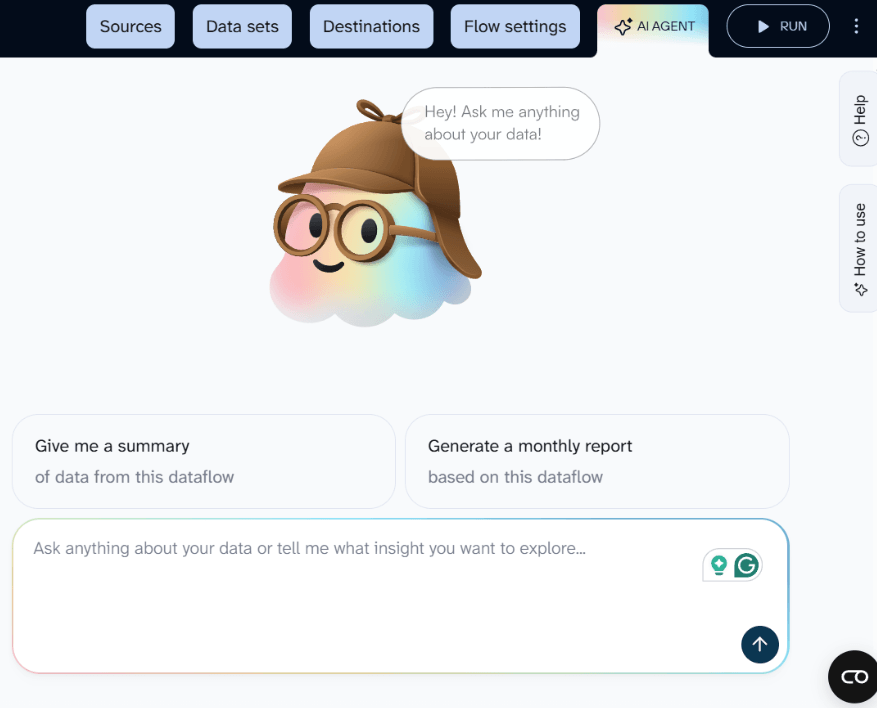
A few examples of what you can ask about your QuickBooks data:
- Which customers have the highest outstanding balances past 60 days, and how has their payment behavior changed over the last two quarters?
- What’s the month-over-month trend in operating expenses, and which expense categories are growing fastest relative to revenue?
- Show me cash flow for the last 6 months and flag any months where outflows exceeded inflows by more than 20%
- Which vendors account for the largest share of accounts payable, and are any consistently paid late?
- Compare gross margin by product line for this quarter versus the same quarter last year
For recurring analysis like monthly financial reviews or weekly cash position checks, the finance-analytics skill in Coupler.io’s skills library already knows what to look for in accounting data. So, you don’t have to write prompts from scratch each time.
If you prefer working in external AI tools like Claude, ChatGPT, or Gemini, AI Integrations connect your QuickBooks data flow to those tools via MCP. You get the same structured data in conversations inside the AI tool you already use.
What data can you load from QuickBooks Online to Power BI with Coupler.io?
Coupler.io supports two types of QuickBooks data: raw entities and preset reports. Raw entities give you individual records you can slice and combine freely in Power BI. Preset reports mirror the standard QuickBooks financial summaries and are ready to visualize as-is.
Data entities
Reports

Connect QuickBooks to Power BI and AI with Coupler.io
Get started for freeWhat are other methods to connect QuickBooks to Power BI?
Coupler.io gives you the most complete path from QuickBooks to Power BI: no-code setup, scheduled refreshes, data transformations, multiple destinations in one data flow, dashboard templates, and AI analytics on top. But depending on your situation, other methods to load QuickBooks data to Power BI may make sense.
- Manual data export. You export data from QuickBooks Online or Desktop as an Excel file, then import it into Power BI with Get Data > Excel. This works for a one-off analysis or a quick check when you don’t need the data to stay up to date. The tradeoff is that every time you need fresh numbers, you repeat the export-import cycle manually.
- Custom API integration. QuickBooks provides a REST API that developers can use to pull data programmatically and load it into Power BI. This makes sense if your team has developer resources and you need a highly customized data pipeline with logic that goes beyond what a no-code tool offers. The tradeoff is build time, ongoing maintenance, and handling authentication, pagination, and rate limits yourself.
Visualize your QuickBooks data in Power BI with a dashboard template
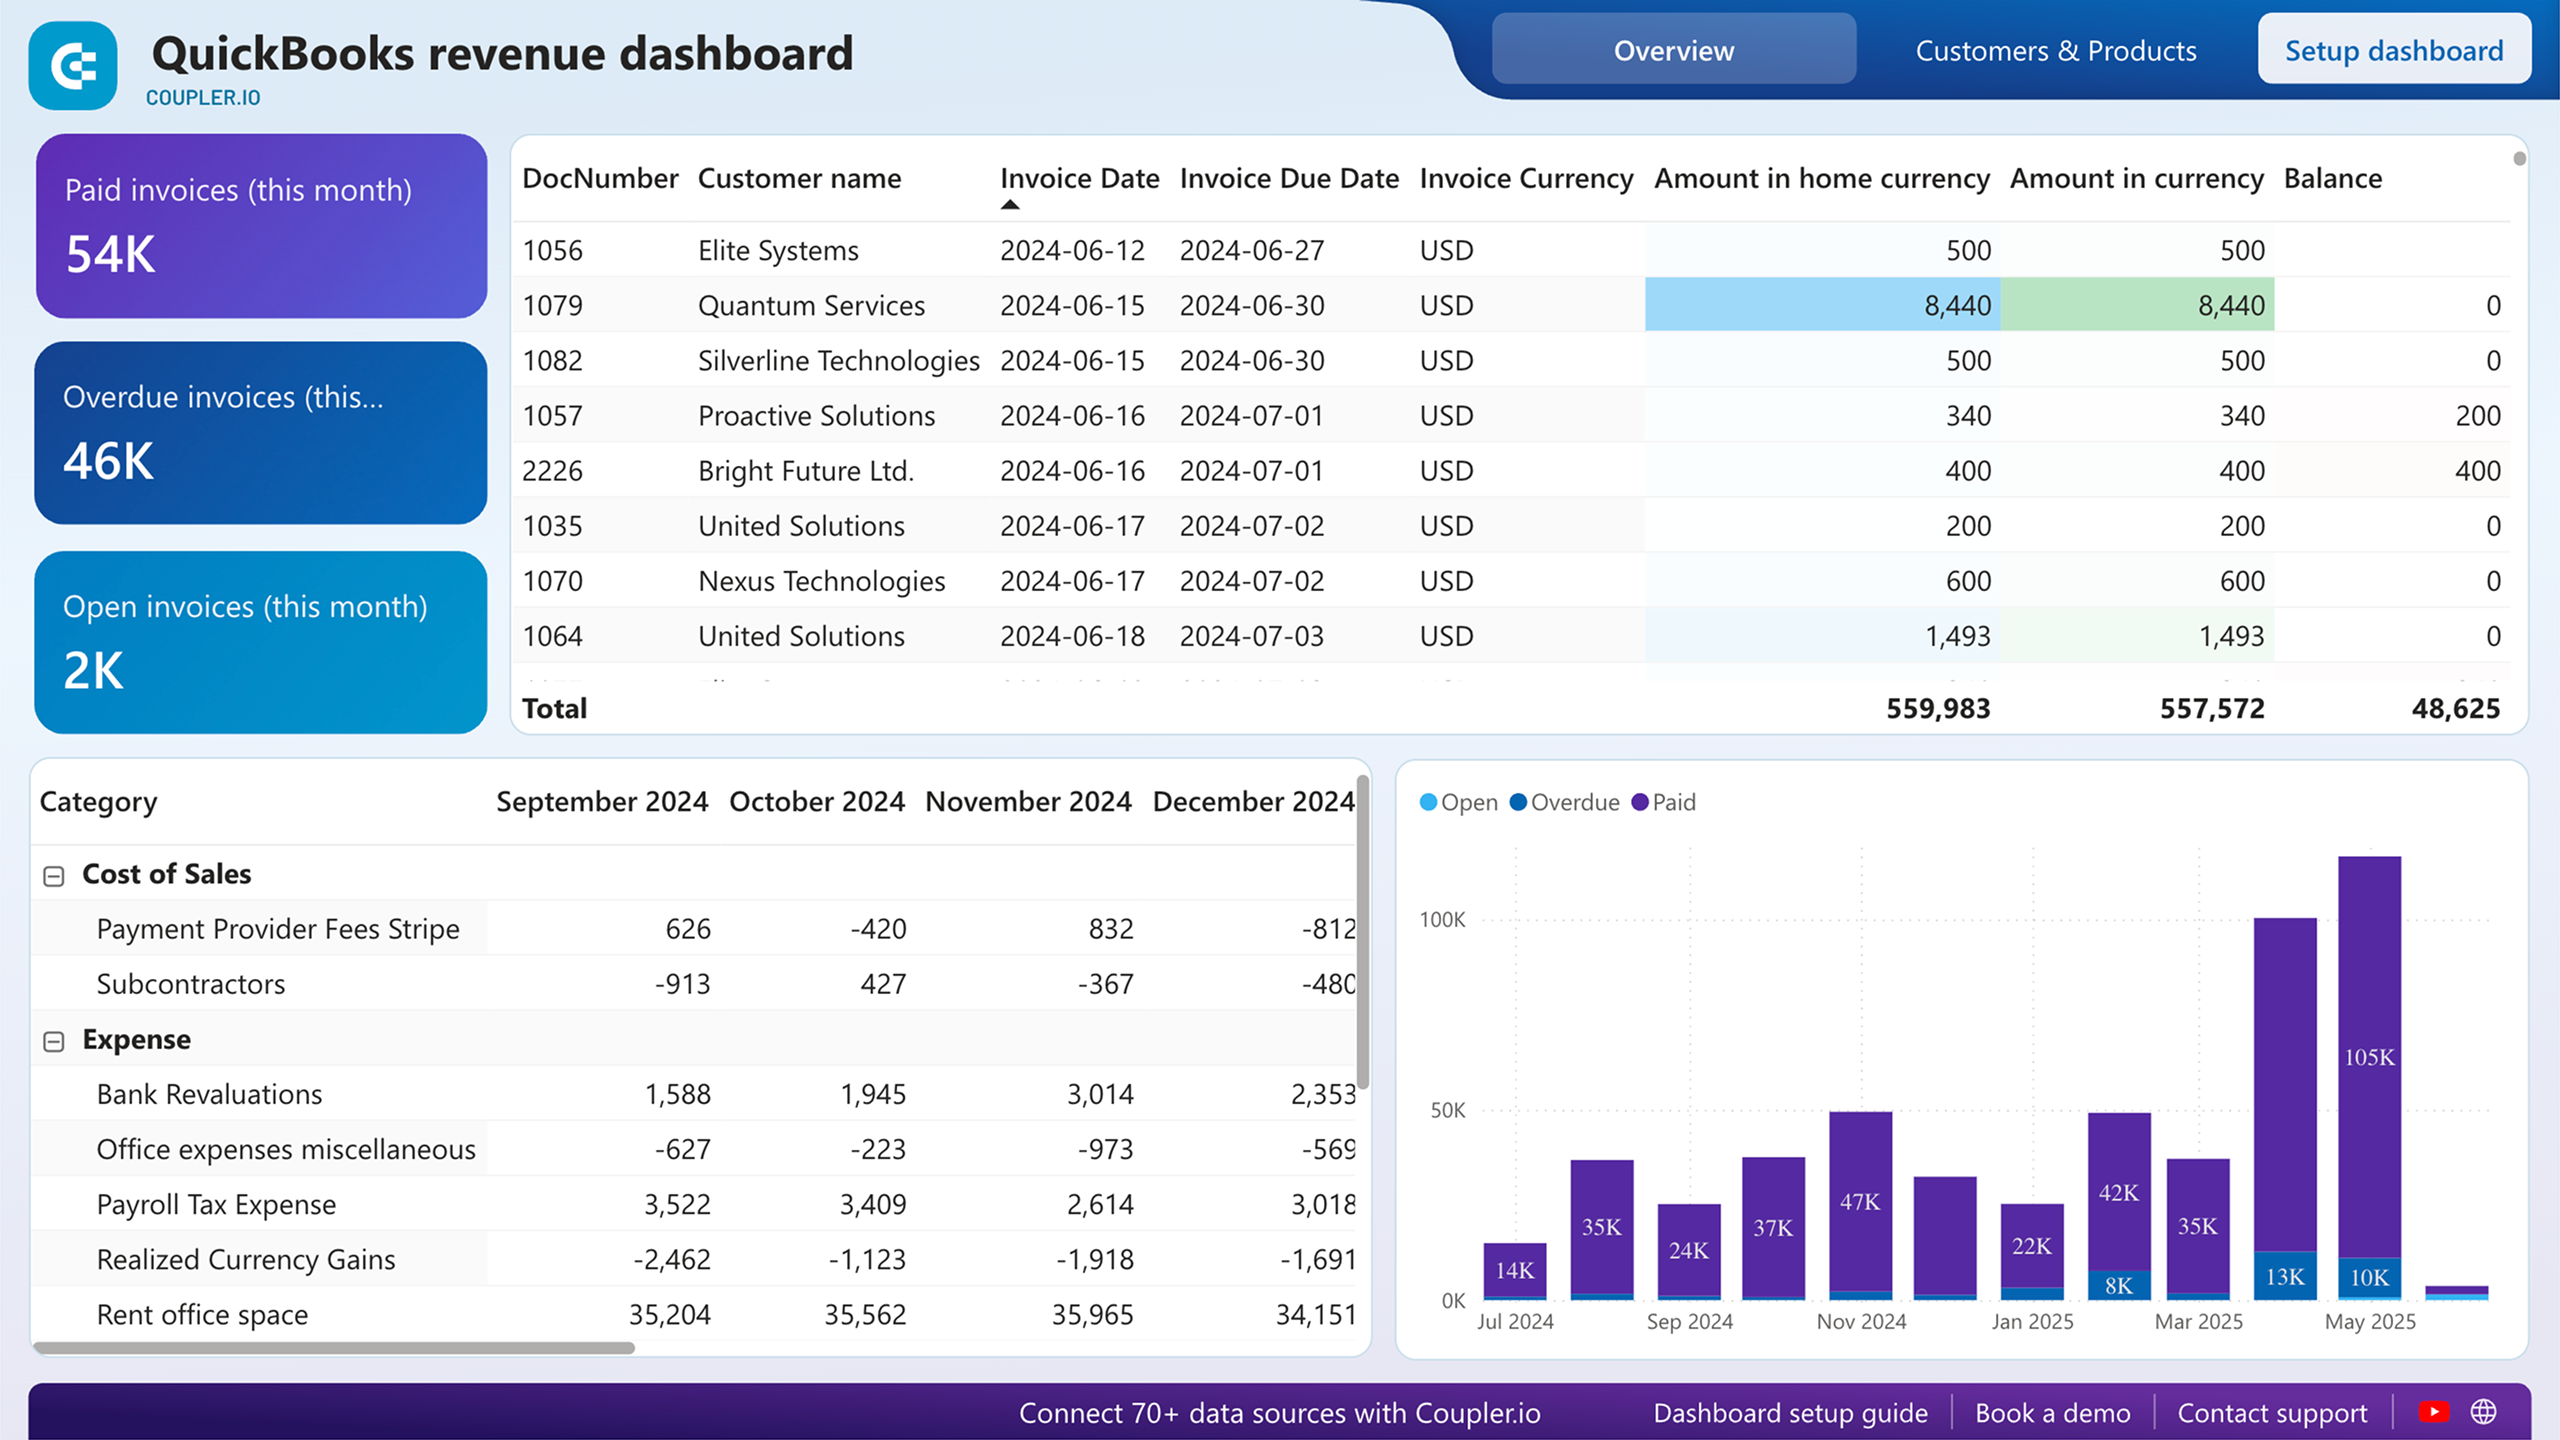
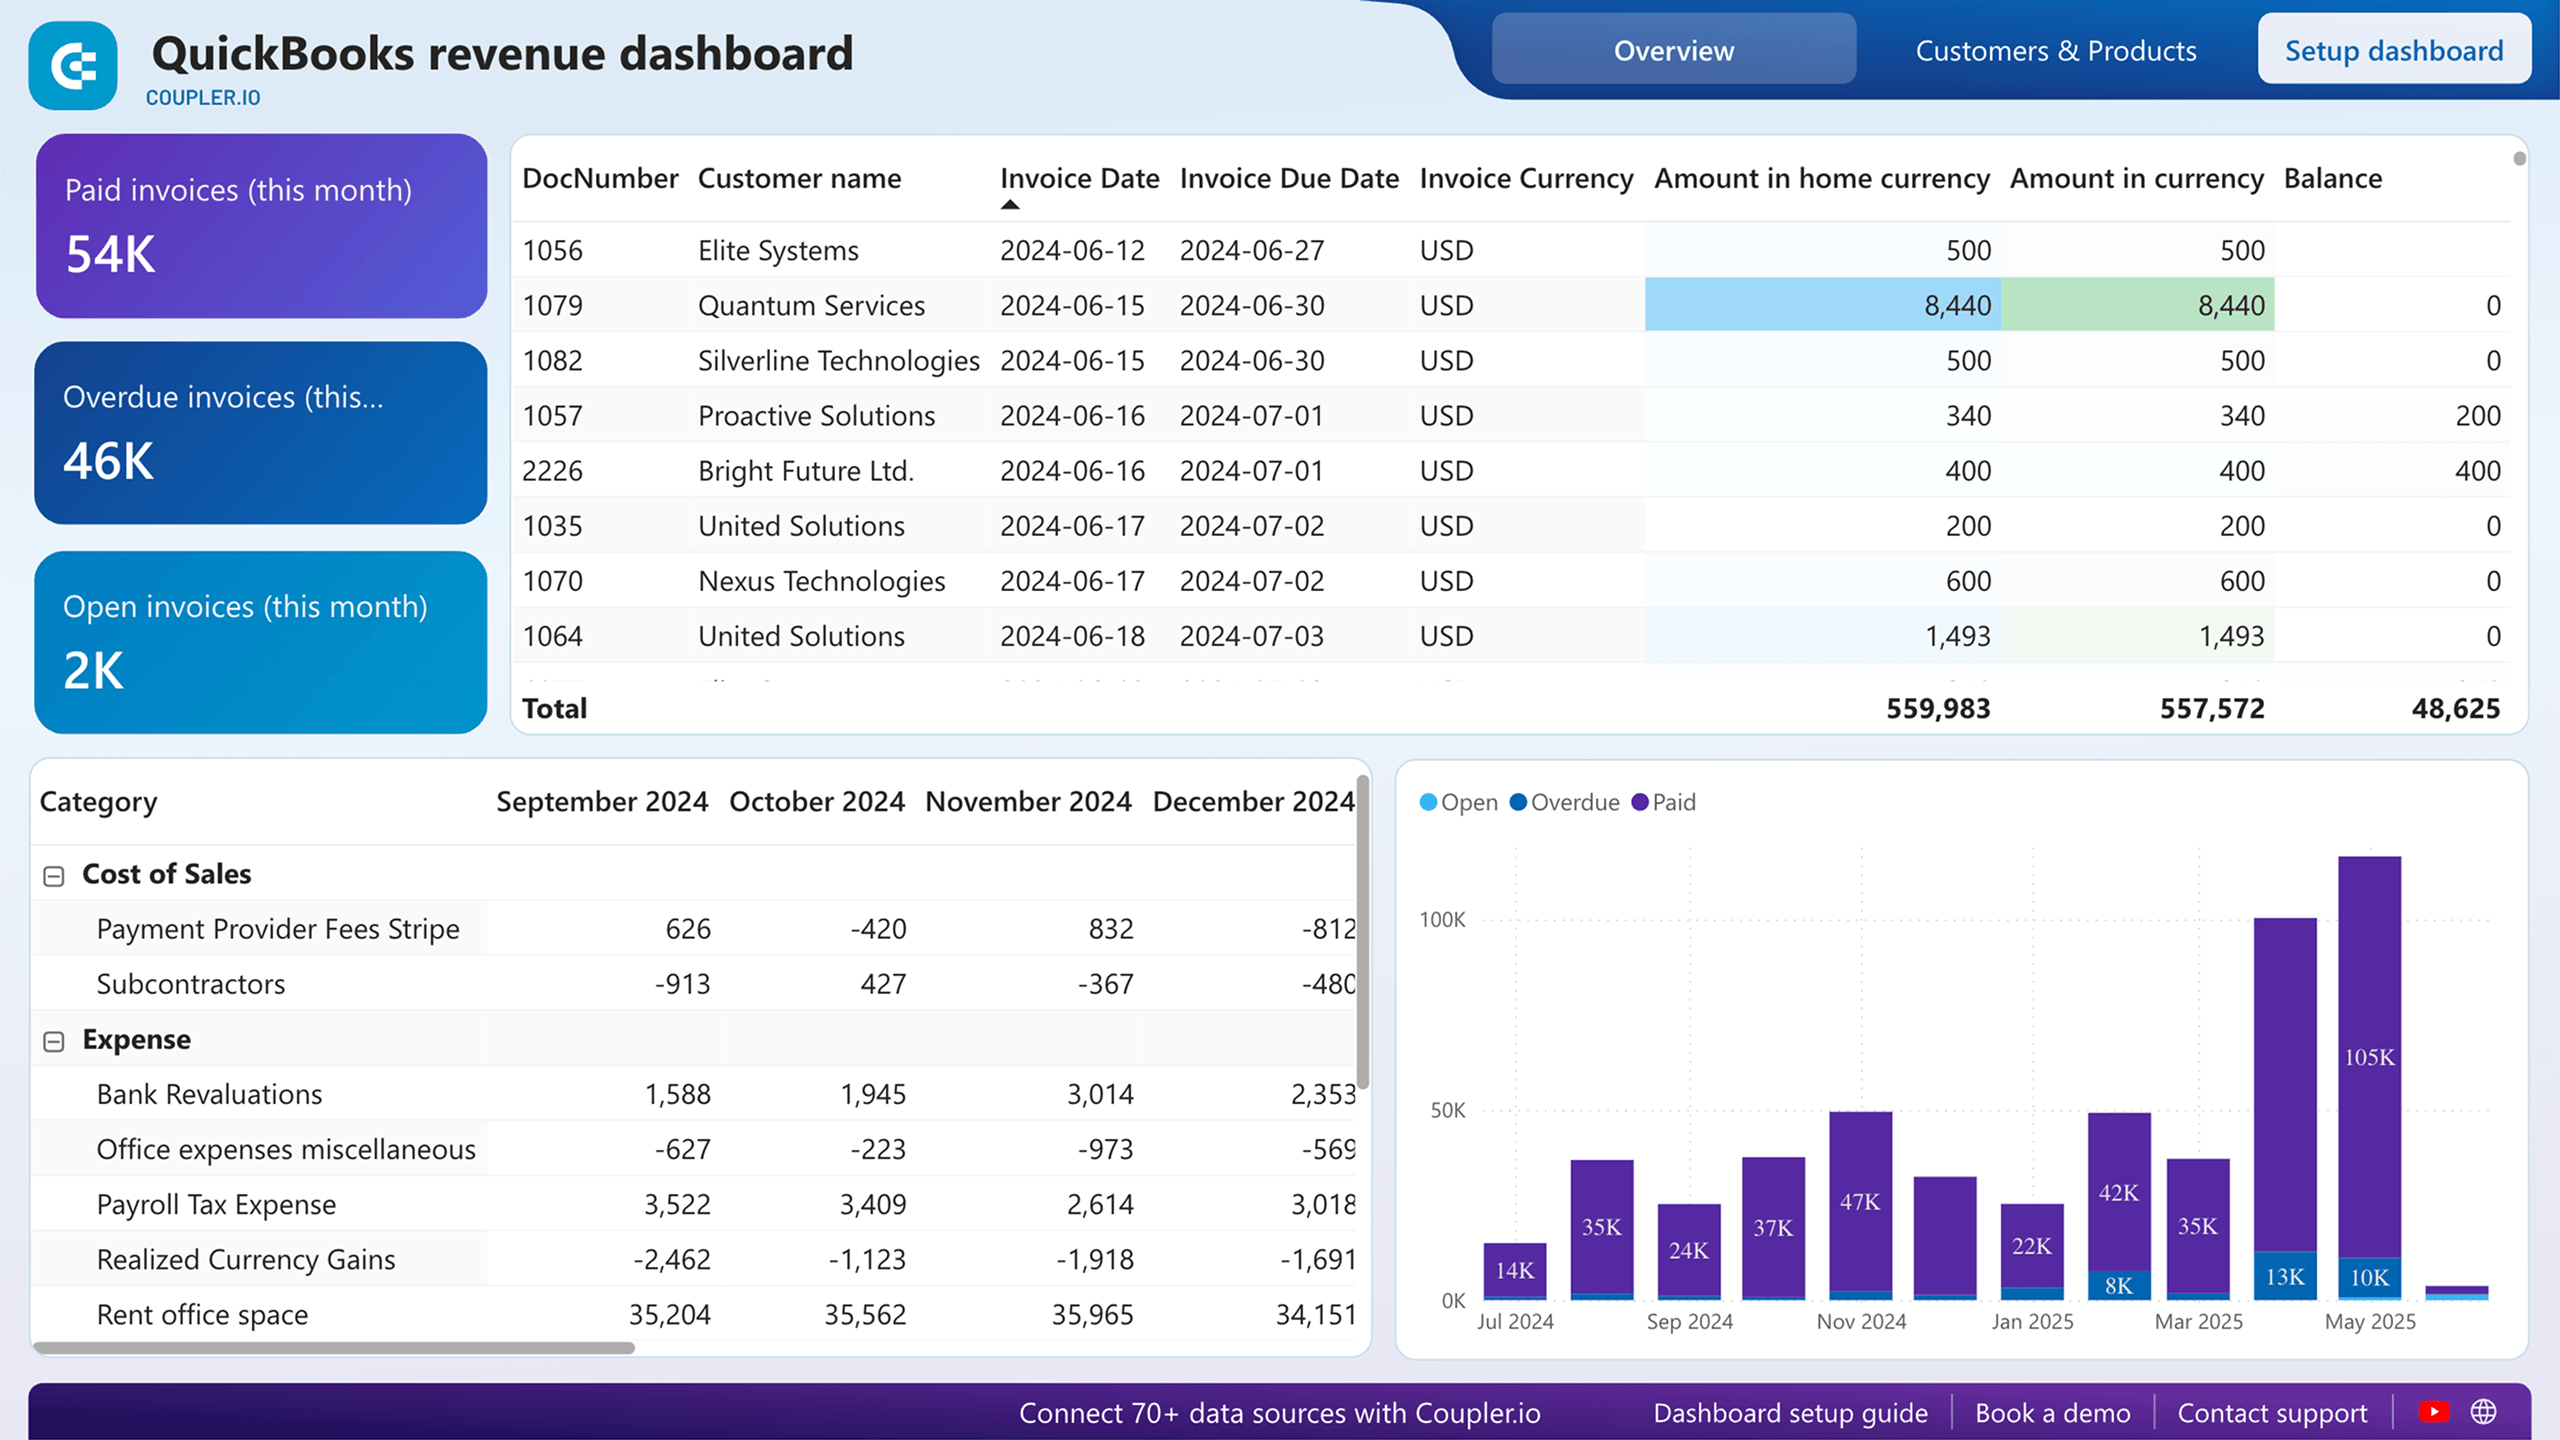
With the data flow set up, your QuickBooks data reaches Power BI automatically. You can build any report or QuickBooks dashboard you need from there. To get started faster, Coupler.io offers a ready-made QuickBooks revenue dashboard template that works with your QuickBooks connection out of the box.
QuickBooks revenue dashboard template in Power BI
 Preview dashboard
QuickBooks revenue dashboard template in Power BI
Preview dashboardThe Overview tab provides a year-long view of your revenue trends, making it easy to identify seasonal variations, peak income periods, or unexpected downturns. It also includes a table with invoice details such as due date, amount, and balance.
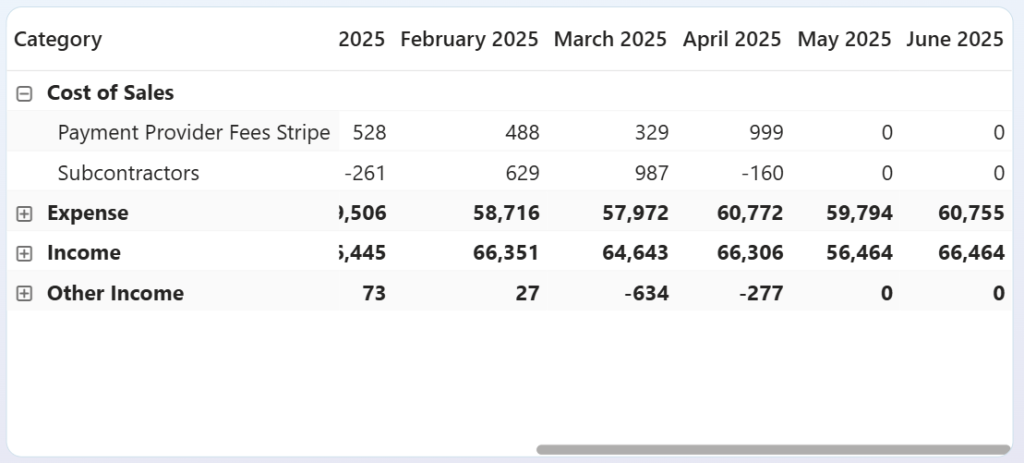
The Profit and Loss Overview complements this by comparing your income to your expenses. This gives you the insights to ensure your budget stays balanced and your financial planning is on point.
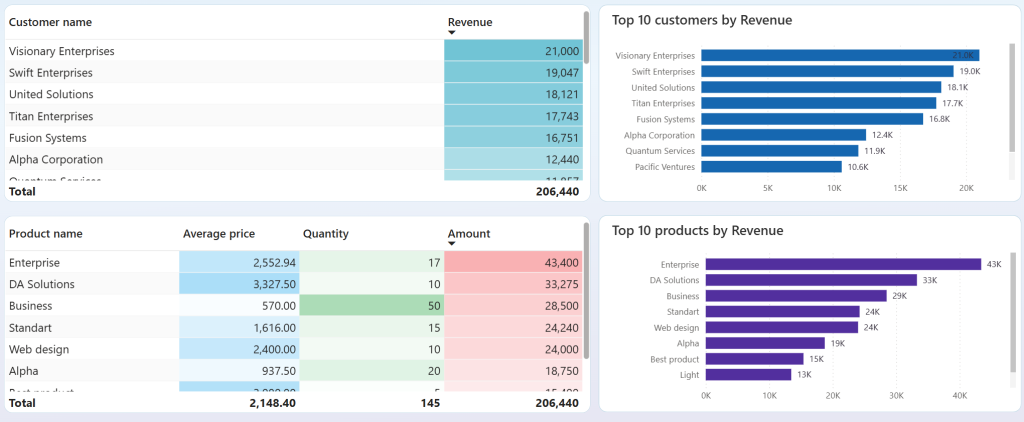
In the Customers & Products tab, the QuickBooks dashboard shows your most valuable clients. This is useful to decide where to direct targeted marketing campaigns or loyalty programs. Additionally, the dashboard provides a snapshot of your best-selling products. With this insight, you can analyze your inventory and make data-driven decisions to boost sales performance.
The dashboard is available in two versions: one for single-currency accounts and one for multi-currency accounts.
To start using the template, follow the instructions. You will only need to connect your QuickBooks account. Coupler.io will then handle the rest, making sure your reports are always refreshed automatically, with no extra effort on your part.


Additionally, Coupler.io offers other free templates for QuickBooks reports for Google Data Studio and Google Sheets.
Common business use cases for QuickBooks data in Power BI
Now that you understand what QuickBooks data you can access, explore how businesses and you can use this information to solve real challenges.
Multi-entity financial consolidation
If you run separate QuickBooks instances for different subsidiaries or locations, consolidating financial data manually takes days every month-end. With Coupler.io, you can aggregate P&L statements, balance sheets, and cash flow data from multiple QuickBooks accounts into a unified Power BI dashboard, even when the chart of accounts structures and currencies differ.
This is particularly useful for holding companies, franchises, or international businesses that need to handle different chart of accounts structures and currencies. Instead of spending days manually compiling reports, you can reduce your month-end close to just hours while eliminating consolidation errors.
Sales performance and commission tracking
Businesses often struggle to connect CRM performance metrics with the actual collected revenue from QuickBooks. Using Coupler.io, you can blend QuickBooks payment data with sales systems like HubSpot or Salesforce to create Power BI dashboards that show true sales performance beyond just bookings.
That makes it possible to calculate commissions on collected revenue rather than booked amounts, and to spot at-risk accounts early based on payment patterns. With AI Integrations, you can also ask questions like “which reps have the widest gap between booked and collected revenue this quarter” in Claude or ChatGPT, using the same blended dataset.
Multi-location inventory optimization
Retail and distribution businesses operating across multiple locations need centralized inventory visibility. Coupler.io can aggregate inventory data from multiple QuickBooks instances and automatically refresh it in Power BI to provide up-to-date stock level monitoring. Your dashboards will include location-based stock reports, demand pattern analysis, and identification of slow-moving inventory. The result is reduced stockouts, optimized working capital, and data-driven decisions about inventory allocation across locations.
Each of these use cases starts the same way: connect your QuickBooks account to Coupler.io, build the data flow, and let it run. The QuickBooks connector for Power BI by Coupler.io offers a simple, user-friendly experience for data integration. From there, you can add QuickBooks report templates, layer on AI analytics, or export QuickBooks data to other destinations as your reporting needs grow.
Automate QuickBooks reporting and analytics with Coupler.io
Book a demo