There’s plenty you can get out of analyzing your Asana data regularly. You can better monitor the projects, find bottlenecks, analyze dependencies, and improve the team’s performance on the go. What’s more, using the historical data you can forecast what the future holds – what resources you’re going to need, what the realistic deadlines are, and so on.
Asana analytics can be done in two possible ways and we’ll explore both approaches in the following chapters. Stay tuned!
How to use Asana data for analysis – two approaches
You can either do Asana analytics inside the platform or you may prefer to export the data for analysis somewhere else. There are pros and cons to both approaches.
Approach I – Native Asana analytics
Asana itself offers reporting features built into the platform. They may be good enough for running some basic analytics – monitoring tasks, projects, milestones, and more. Rather than having to keep track of individual items, you get to see the big picture – a visual summary of all tasks split by status, assignee, or other criteria, your progress towards the team’s goals or milestones, and more.
The advantage of this approach is that the Asana data for analysis is already there. You don’t need to set up any data flows and worry if your data is up-to-date. You can pull up a dashboard with all the relevant data within minutes and start looking for the insights you need.
The cons? Many find the built-in analytics limiting. You need to rely on the available reports which you can customize to some extent, picking different data types or trying out a new chart type, but that’s about it. The raw data is spread across the platform and nearly impossible to aggregate or compare in a scalable way. If you wish to prepare some calculations, create and track new metrics, or enhance your data in any way, you’re out of options, unfortunately.
Approach II – Custom Asana analytics
For that reason, many users choose to export Asana data for analysis into external tools. Spreadsheets and data warehouses are common destinations for such data as both allow for virtually unlimited processing of information – calculating KPIs, merging the data with other available datasets, and even predicting what the future may hold. Commonly Asana data analytics also find their way into DataViz tools, such as Tableau or Looker Studio where they can be showcased on charts, pivot tables, or scatter plots and analyzed in the most convenient form.
The key advantage of external solutions is virtually unlimited possibilities. You can export the raw data and process it in any way you please. You get to choose from the best tools on the market whose analytical features far outweigh what Asana has to offer. What’s more, running external analytics makes it possible to connect to the data outside of your Asana account – time-tracking records, financial statements, you name it.
What about the disadvantages? Running external analytics certainly means more work, at least in the initial stages. After all, you need to export your Asana data analytics, make sure they’re up-to-date, and process them into a more insightful shape. There are various tools that can facilitate the process in a user-friendly way. We’ll show you an example shortly.
Native Asana analytics
Let’s get back to the built-in analytics and see what’s in store. As you venture into the Reporting tab, you’ll find the default dashboard that gives you some basic charts to look at. They mostly focus on the status of tasks and projects and serve more as a basic control center for project managers, less frequently analysts.
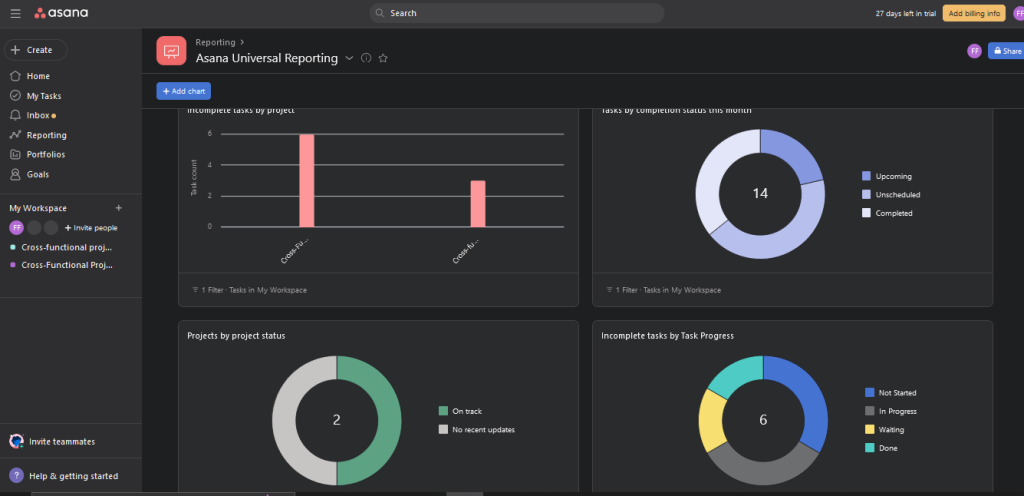
You can customize that view to some extent, adding new charts and tweaking them to show precisely what you’re after. The templates cover many common scenarios – monitoring projects by the status of the underlying tasks, tracking the workload of individual team members or teams as a whole, etc.
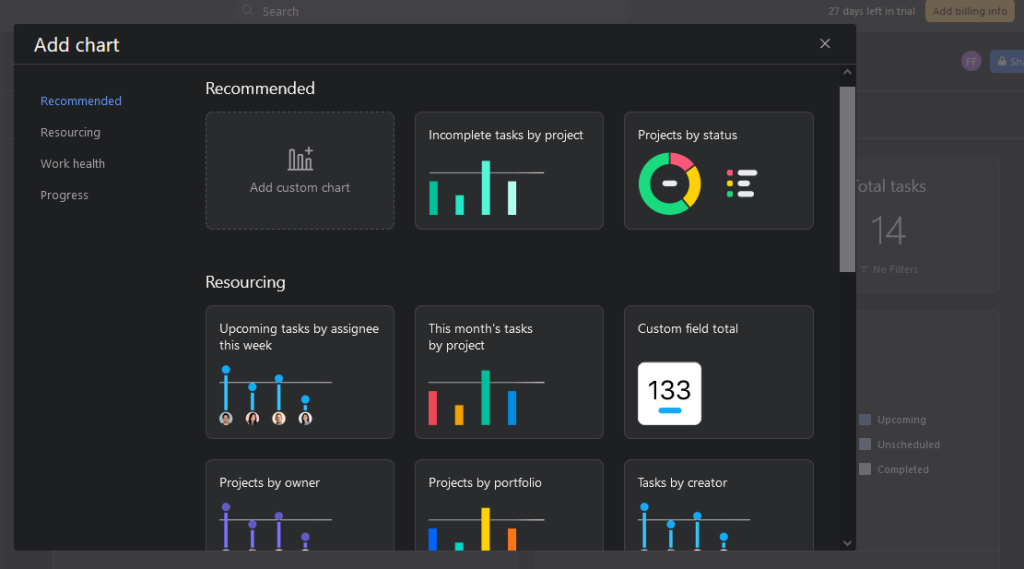
You can pick either, make adjustments if needed and it will be instantly populated with Asana analytics from your account.
Some more stats you’ll find in the relevant categories – goal completion stats reside in the Goals tab, the performance of a portfolio is outlined in the Portfolios tab, and so on. And that’s about all when it comes to built-in Asana analytics.
For basic purposes, such as tracking which teammates may be overloaded or estimating when a project can realistically finish, this can be just enough. However, to get more out of your data, you’ll need to export it into a more capable tool.
Custom Asana analytics
Now let’s look at an alternative way to analyze Asana data that relies on exporting it first into the tool more suitable for analytics.
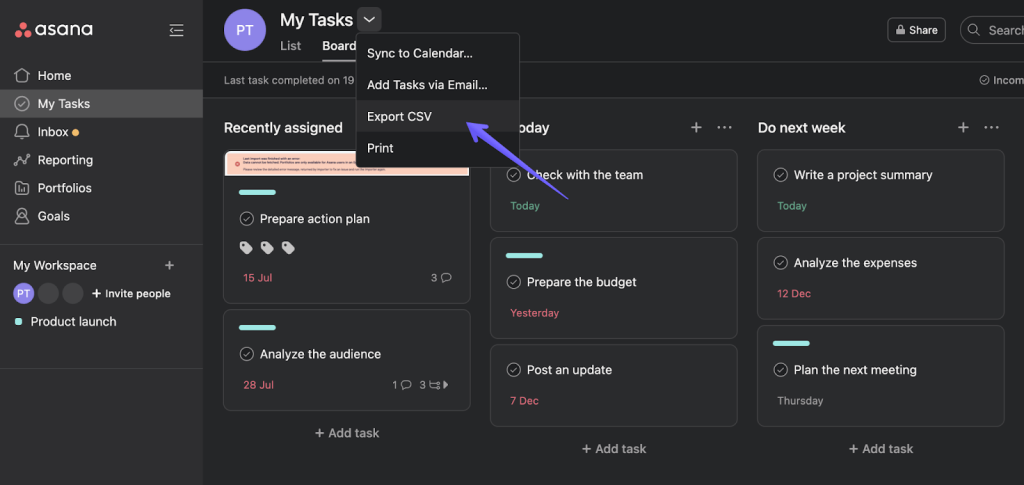
Technically, you could export data such as tasks or projects manually from within the Asana dashboard. To do that, jump to the respective category and choose the button for exporting that data entity as a CSV file.
This can work as a one-time activity, for example when a project has finished and you want to fetch the corresponding data for analysis. Most often, though, people analyze Asana data as a regular activity and for that, they need data that’s always up-to-date. Such things are only possible with automated solutions such as Coupler.io.
Coupler.io is a data automation and analytics platform that can be used to automatically extract data from the numerous apps you use, including Asana, Salesforce, HubSpot, Airtable, GA4, and more. The data is pulled according to the schedule you choose, for example daily at 9 am. and as often as every 15 minutes. The available destinations for data are Google Sheets, Excel, and BigQuery.
What’s more, Coupler.io also offers data analytics consulting services where data professionals can build for you any custom data flows, set up automations, and visualize your data on custom dashboards in Tableau, Power Bi, and other tools. If the built-in analytics are too limiting but analyzing them externally seems a bit overwhelming, then the service we offer may be just the right fit.
Read more about the service and feel free to get in touch to discuss your case.
Exporting Asana data for analysis
Let’s now have a look at how to set up a simple Asana workflow.
- Sign up for a free Coupler.io account.
- Click the Add importer button.
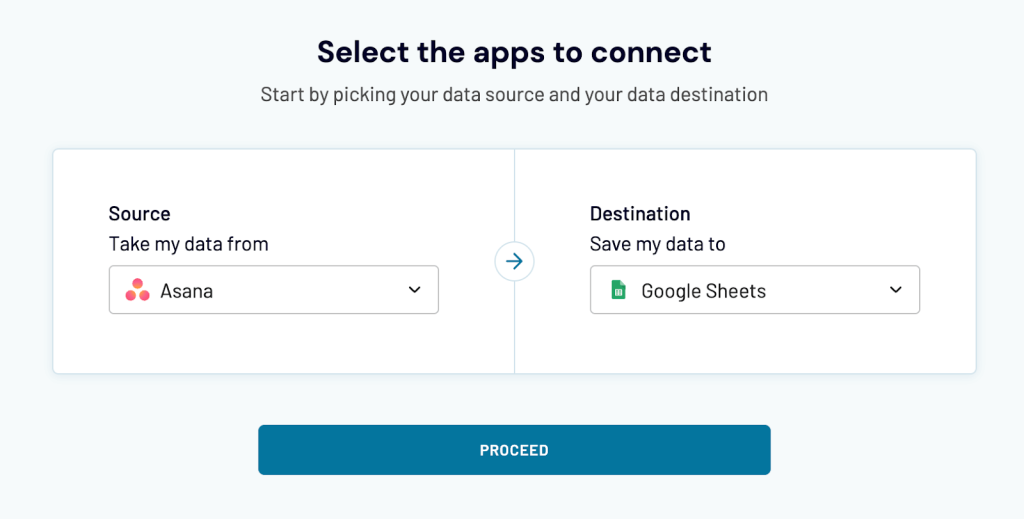
- Choose the apps you want to connect. Here, we want to set up an Asana to Google Sheets integration but if you prefer, you can choose to export Asana to Excel or send data from Asana to BigQuery.
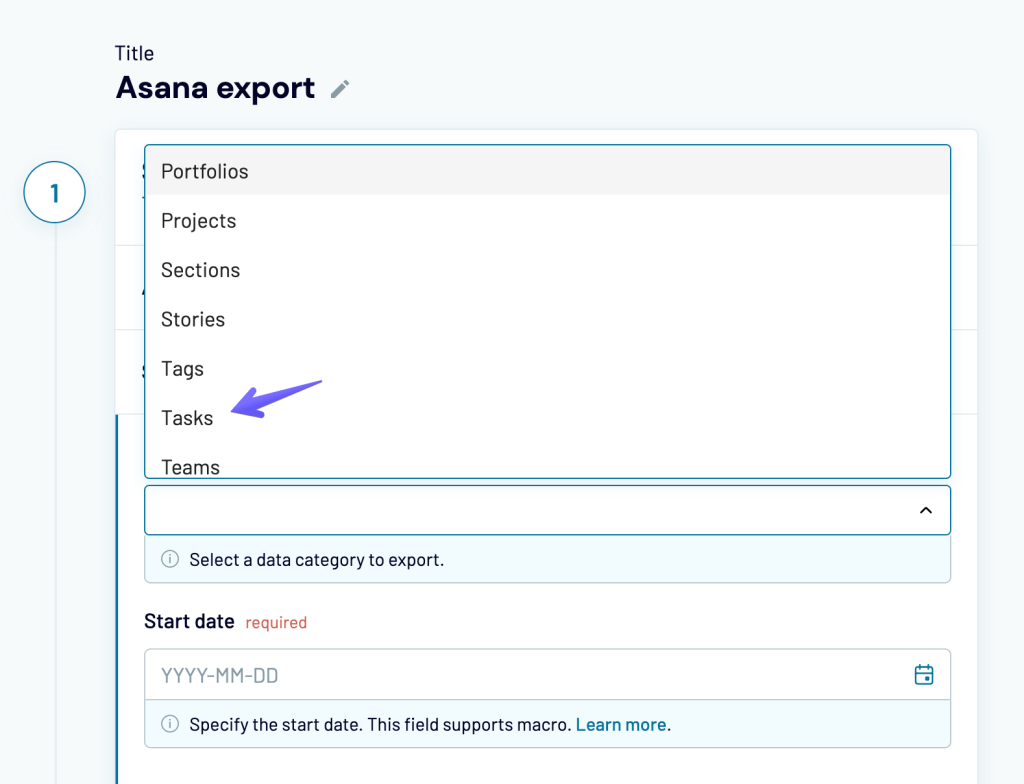
- In the next stage, connect your Asana account and choose what to import. There are a number of entities available. We’ll go with Tasks for now. Once you set up this importer, you’ll be able to make a copy with just a few clicks and import any other type of data simultaneously.
- Next, choose where to import the Asana data for analysis in your chosen destination app.
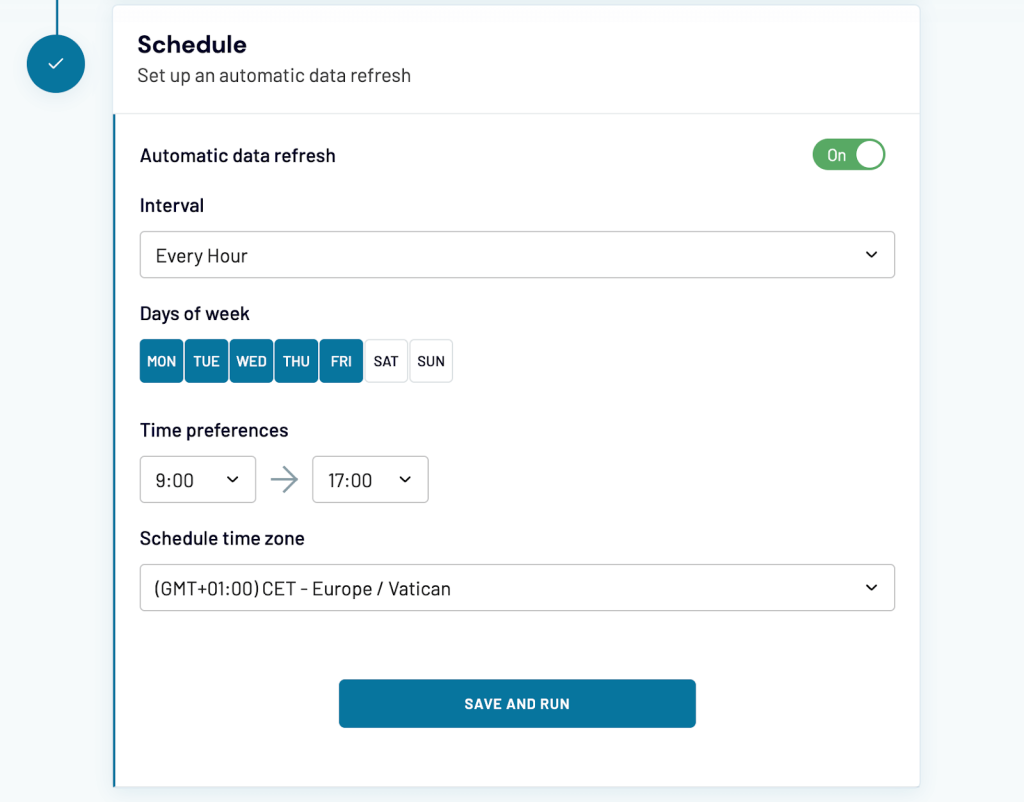
- Lastly, set up a schedule so that the data can be refreshed automatically and run the importer.
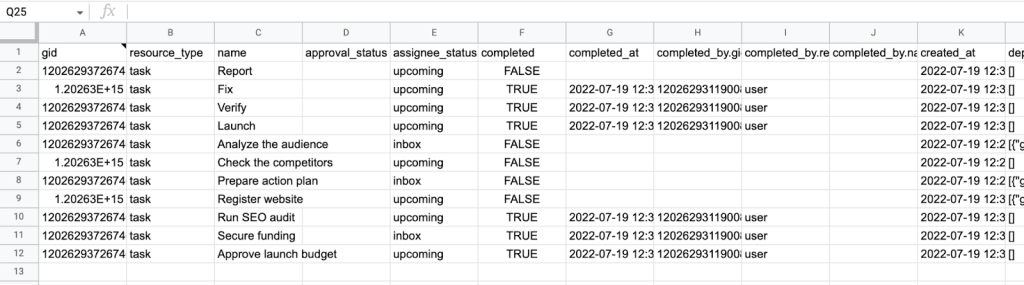
And that’s it. The importer will process for some seconds and you’ll soon see the outcome of your import. Here’s a sample import of tasks from Asana:
With this particular dataset, you could:
- Map out the list of dependencies to see if they can be balanced better.
- Calculate the average time needed to complete certain tasks and use it to estimate the project coming up.
- Collect the notes attached to tasks and load them into another spreadsheet for further analysis.
These are just some of the ideas and we’ve only touched on one data entity so far. The bottom line is, with all that data in your spreadsheet, it’s going to be a lot easier for you to process and analyze it than it would ever be on the platform. Try it out yourself and see if it can indeed enhance your Asana data analytics.
Asana analytics – sum up
When you want to analyze Asana data, you basically have three options. You can:
- run your analytics with the reporting features already on Asana
- choose to export all the vital data into a tool more suitable for analysis – for example, a spreadsheet.
- or opt for a custom analytics solution delivered by data professionals.
Built-in analytics is definitely an easier and faster approach as the ready reports are already waiting for you. Exporting the data, on the other hand, opens up the doors to more detailed analysis, potentially connecting Asana data to other information (such as first-party product data) at your disposal.
A custom analytics solution combines the two – it gives you extensive analytics tailored to your needs without any effort on your side.
So, now that you know about the different options you should test out what works for you and your needs and go from there. Best of luck!