Allocating your resources efficiently can give you a competitive edge over your rivals. Asana provides a built-in dynamic reporting system that gives insight into your day-to-day operations. You can use this data to make informed decisions and achieve work efficiency.
In this article, we will cover all the key features of Asana reporting, why it is a good choice for monitoring and managing your everyday business activities, and how you can create advanced reports with Asana.
Asana reporting features
Asana has inbuilt reporting features that allow you and your organization’s leadership to monitor the progress of tasks, projects, and portfolios in real-time, all from one centralized location. Furthermore, this overview of the work progress allows you to manage the workflow and make changes when necessary very easily. You can use the insights provided by Asana reporting to efficiently allocate resources and reach your business goals in an optimal way.
However, there’s another way of reporting your Asana projects and business activities – with third-party tools such as Coupler.io. This method allows you to automatically export project data into a spreadsheet or data warehouse for deeper analytics on project performance. The benefit of solutions like Coupler.io is that it offers a lot of flexibility. For example, you can combine the data from other sources with Asana’s and perform analysis on it.
For now, let’s look at the key elements of Asana’s reporting.
Asana reporting: Dashboard
The dashboard provides an overview of all the ongoing activities. This feature is available in paid versions (Premium, Business, and Enterprise). You can find it by clicking “reporting” on the navigation bar on the left side.
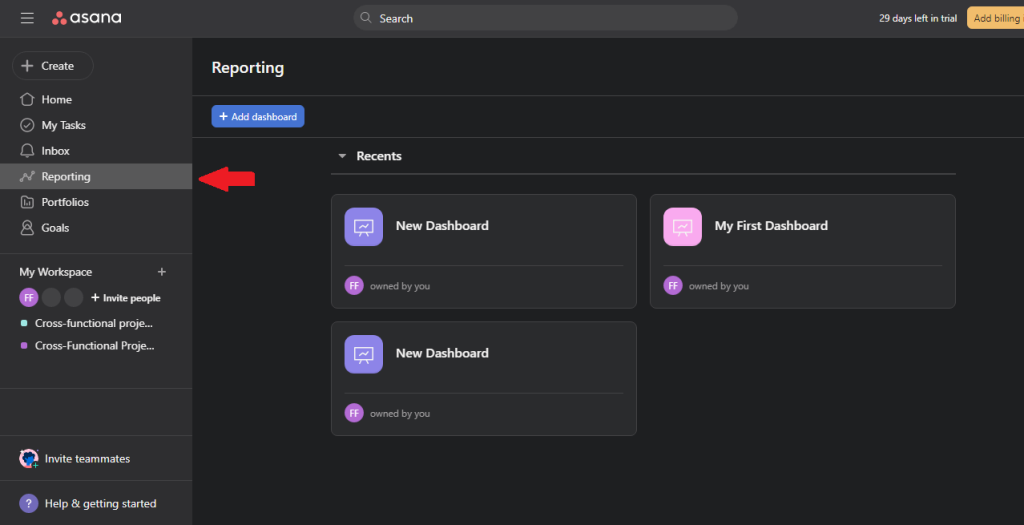
It’s highly customizable, so you can use it to display information and report on any project you choose. You can utilize this information for a wide variety of purposes, including keeping tabs on progress toward goals, boosting performance, seeing patterns, and making predictions. The dashboard provides a real-time overview of your company’s most important metrics without the need for further, time-consuming research. You can use this insight to make all the strategic decisions.
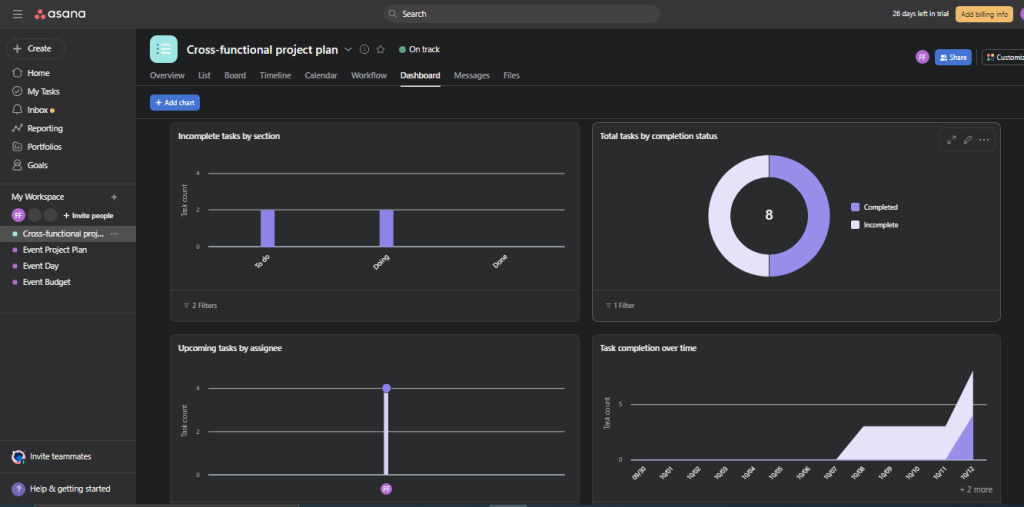
Asana reporting: Dashboard Charts
Charts are the method of visually displaying all the data in the dashboard. When you initially access the Dashboard tab, charts will load automatically. You may also add your own data in the form of charts and summaries. If you have a dashboard set up, each time you go to that tab or refresh the page, the data will be fresh.
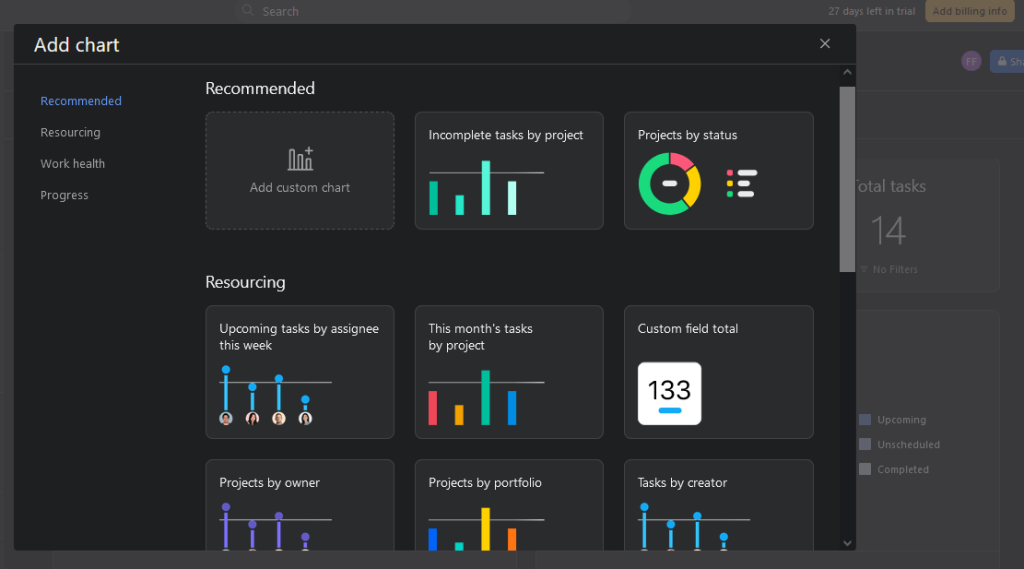
You can use a variety of chart types to visualize the data, each offering different analyses:
- Bar chart: With bar charts, you can display tasks by section or custom fields, allowing you to pinpoint process inefficiencies and potential bottlenecks.
- Lollipop chart: This format provides an overview of the project’s progress. You can see which tasks have been completed, which are still in progress, which are overdue, and which have reached critical milestones or been approved.
- Donut chart: This chart style displays the allocated workload within the team.
- Burn-up chart: Burn-up charts provide insight into overall team productivity and time spent on individual tasks.
- Numeric roll-up chart: Allows you to add custom numerical fields such as budgets, costs, and estimated work hours.
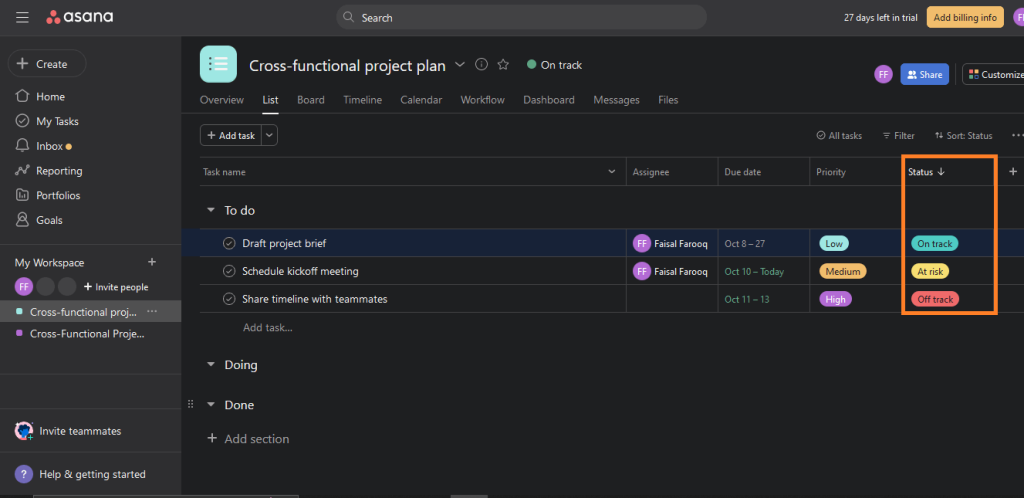
Asana reporting: Status Update
Asana status report makes it easy to keep all of your cross-functional stakeholders informed by centralizing all of your project information in one location. Without having to hold regular follow-up meetings or switch between multiple platforms for updates and information, the Status Update allows you to keep everyone up-to-date on the progression of your project.
To utilize this function, you have to choose which sections to show, and then use Highlights and Charts to visually communicate important data about the Project, such as the status of completed tasks, the progress toward important milestones, and so on.
Asana reporting: Goal Tracking
The goal-tracking feature allows managers and executives to define, measure, and manage company objectives on the same platform as their teams. Businesses and corporations may utilize Asana to create two distinct kinds of objectives:
- Organizational Objectives: The big-picture goals tied to fulfilling your organization’s mission are known as corporate goals.
- Team Goals: Shorter-term goals that lead to the mission-oriented objectives of your organization.
Every employee may view the company’s long-term objectives at any moment. This also means you won’t have to spend a lot of time after an adjustment is made re-aligning and re-communicating key goals. Instead, you can swiftly change your goals and pivot your organization to focus on high-value projects.
Furthermore, you can add the tasks appointed in the team goals to you in your personal goals and stay on track with the organization’s goals.
Asana time chart reporting
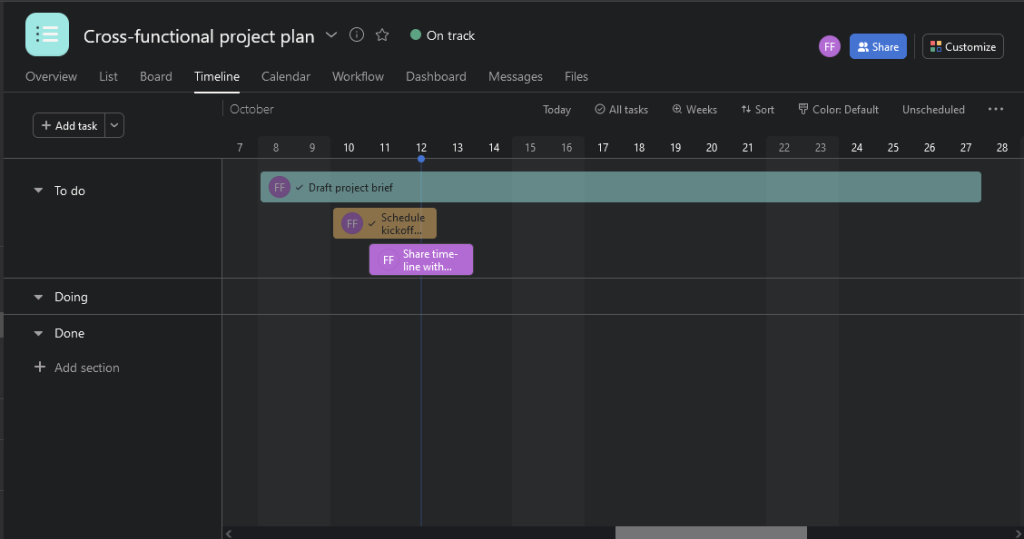
Asana offers another reporting feature, timeline charts, which provide a real-time perspective on the interconnectedness of your tasks, allowing you to get off to a good start and reliably meet your deadlines.
Timeline allows you to make a plan for your project that illustrates how its parts relate to one another. A well-communicated strategy may garner support, instil confidence in the group’s ability to complete tasks on schedule, allow for adjustments as needed, and keep a project from veering off course.
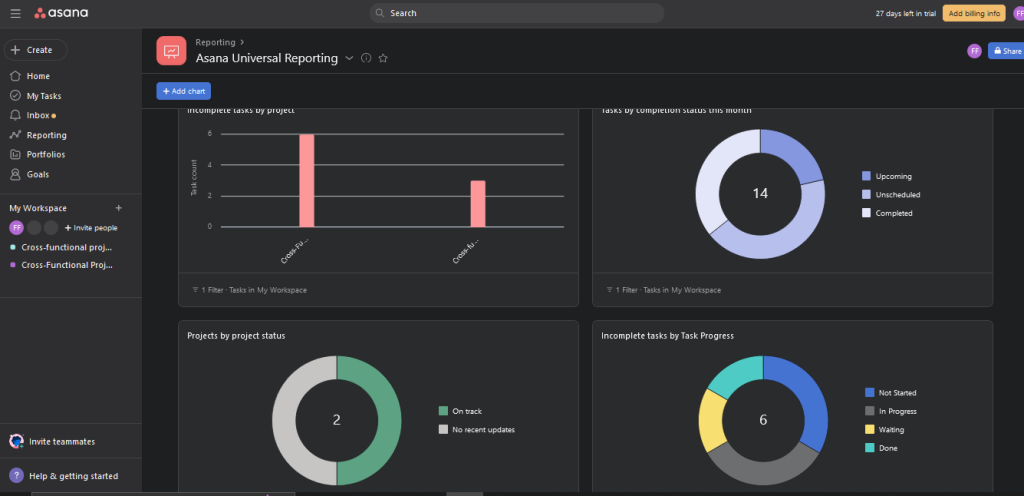
Asana Universal Reporting
Asana Universal reporting is another premium feature of the platform. Universal reporting in Asana provides all the information in a visual format so you can interpret and understand it easily.
This feature makes it easy to align your teams with distinct goals, set appropriate priorities, and get a clear picture of what’s happening across your business. Additionally, In order to quickly get an overview of the key objectives that are important to them, other team members can utilize Dashboard to get a visual representation of the information.
The Universal Reporting feature allows for automatically updated and maintained Dashboards across all teams and projects, providing data on workloads, budgets, and scheduling.
Advanced reporting in Asana
For some purposes, you might need to create an advanced report with a specific set of features and metrics. However, Asana’s native functionality doesn’t offer you much freedom in this regard. So, for advanced reporting, it’s better to use third-party solutions – for example, Coupler.io. This data analytics and automation platform allows you to extract your data from Asana and import it to Excel, Google Sheets, or BigQuery on a schedule. Once your data is loaded to one of these apps, you can calculate custom metrics using various formulas and functions, blend your Asana data with information from other sources, and perform deep analysis. And, of course, you can gather all your findings, insights, and custom metrics in tailored reports. If needed, you can easily visualize your data with Excel’s or Google Sheets’ native features or by connecting these apps to Google Data Studio or Power BI.
In addition to this, Coupler.io can regularly update your Asana data in Excel, Google Sheets, or BigQuery. This means your custom reports and dashboards will be self-updating, always giving you access to the latest data from Asana. Reports built outside of Asana are also easy to share with different stakeholders without giving them access to your company’s Asana profile. This can be handy for communicating with clients, partners, vendors, etc. If the need arises, you can create different reports for different stakeholders, helping them focus on the metrics that matter most. As you can see, creating advanced reports with third-party solutions gives you a lot of flexibility and opportunities for customization.
Let’s see how to export data for reports with Coupler.io.
First, you need to sign up for a Coupler.io account.
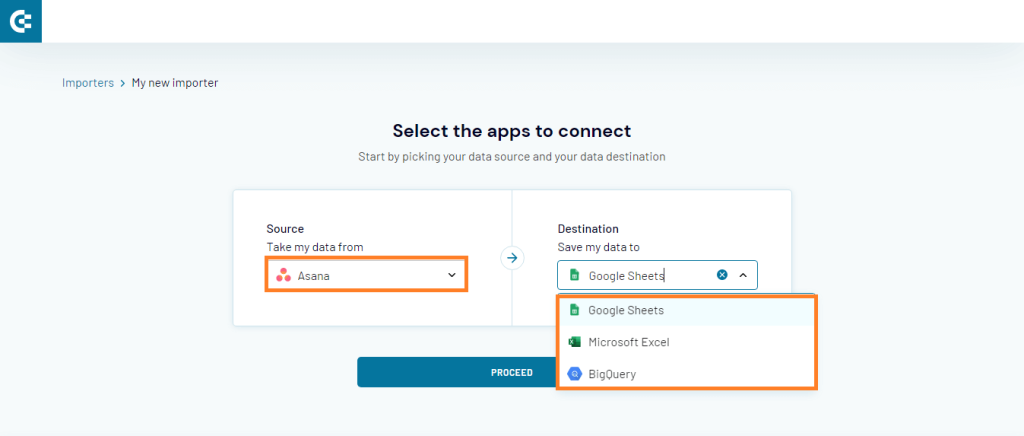
Next, provide a source for your data export – in our case, it’s Asana. Then, pick a destination where you want to export the data. You can connect Asana to Google Sheets, or export data from Asana to BigQuery or Excel.
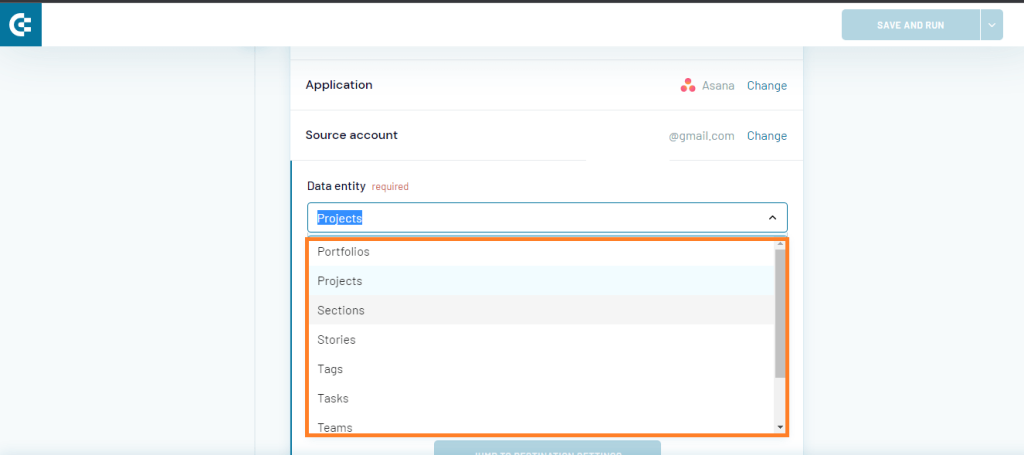
After connecting your accounts, you’ll need to select which data entity you want to export. Coupler.io gives you the option to export Portfolios, Projects, Users, Tasks, Teams, and more.
Next, select the specific spreadsheet file on which you want the data and click Continue. After processing, your data will be exported to the desired destination.

You can add a new importer and repeat the same process to export a different data entity and combine it with others to create advanced reports catered to your requirements.
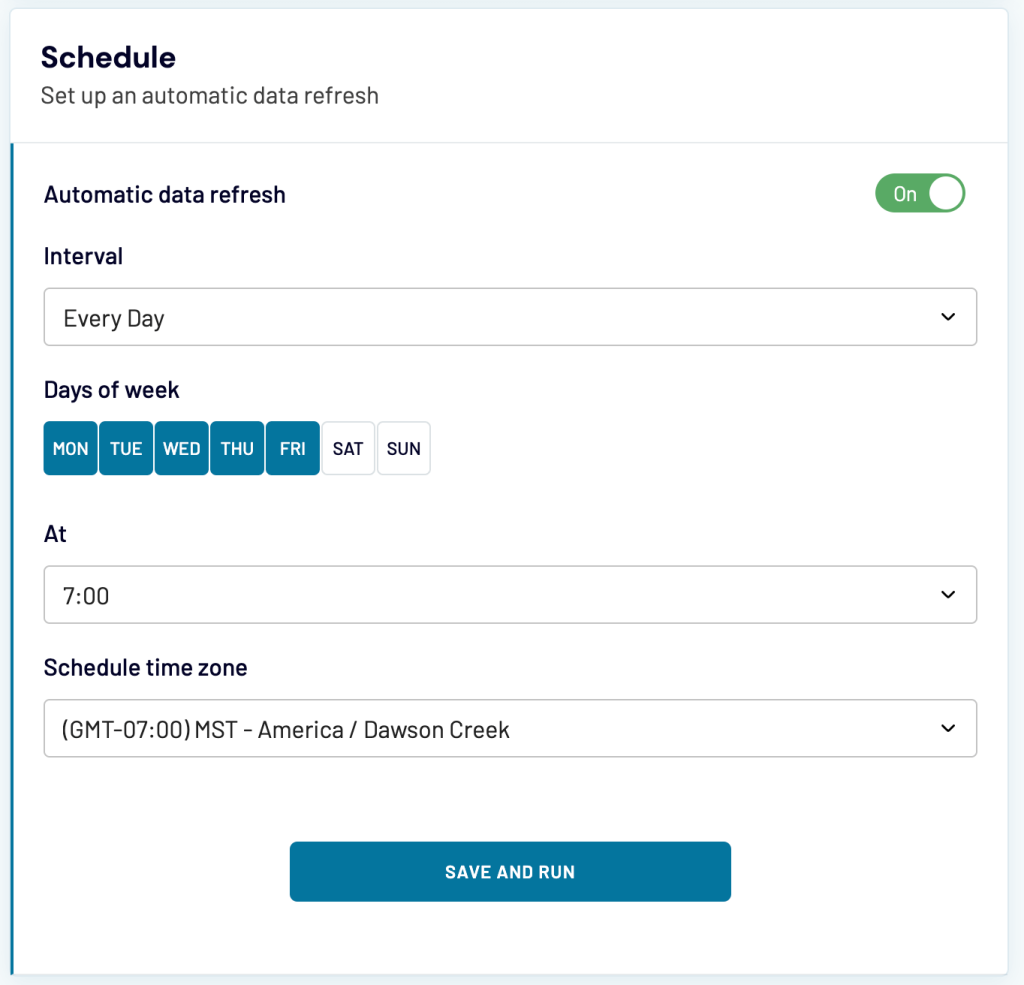
As the last, optional step, you can set up a schedule for automated data refresh. For example, you can fetch the latest project data every morning just as you start your working day. Or, you can export all the completed tasks right in time for a monthly report. Adjust the frequency to your needs and hit the Save and Run button.
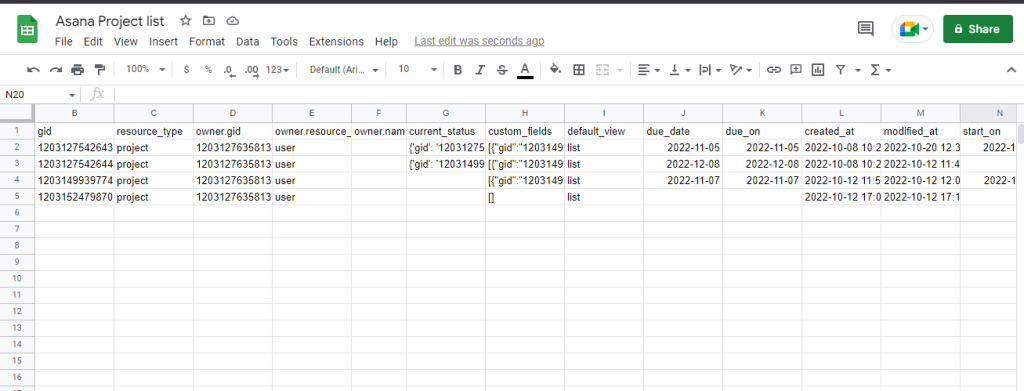
Here is an example of what your export will look like.
Asana reporting capabilities
We have looked at the reporting features of Asana. Now, let’s see them in action and check out how you can improve the efficiency of your business activities.
Asana project reporting
Project reporting provides an overview of the project’s work progress. It allows you to create charts on projects and understand, track, and compare important data across projects. Asana project report is a good way to quickly know the task distribution amongst the team members, performance of team members, delays in work, and so on.
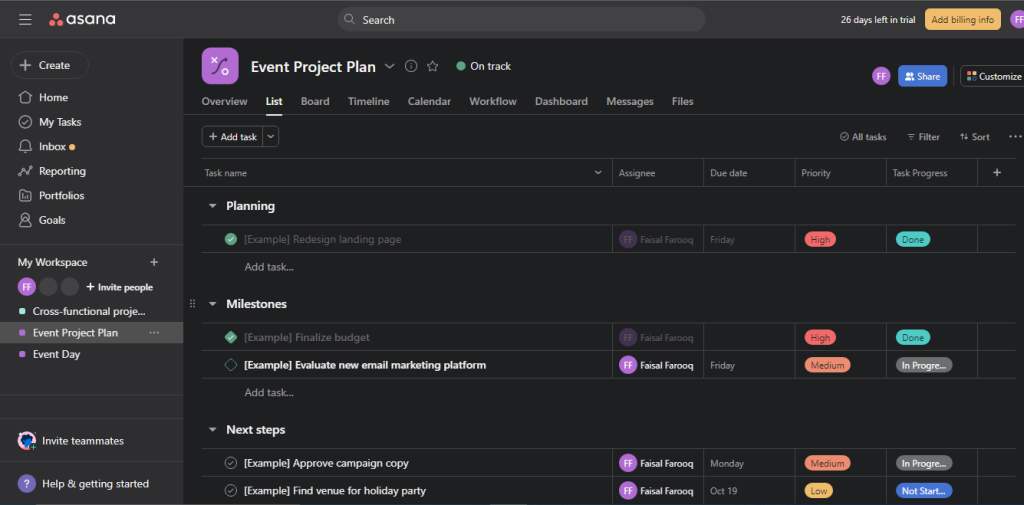
You can use this information to make operational decisions, such as reassigning tasks, switching team members from other projects, or providing assistance to them to finish the task.
Additionally, you can use project reporting to compare the performance of different projects. This allows you to highlight high-performing members, those who are underperforming, and so on.
Asana portfolio reporting
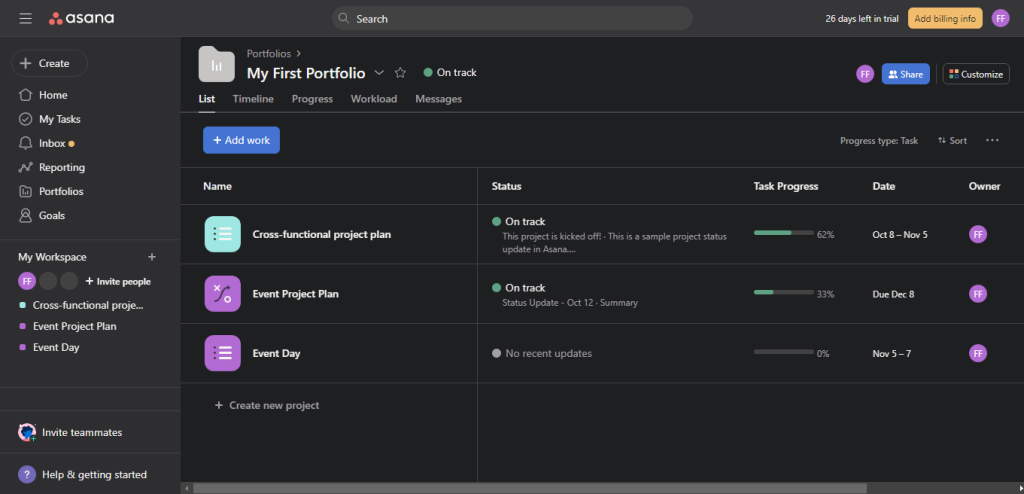
With Asana portfolio reporting, you gain a new tool for managing your projects portfolio. You can track all of your most critical projects and the development of your business’s goals in one convenient location. It’s like having a control room for your entire business operations, where you can monitor and manage everything from strategy to implementation. Portfolios are built on Asana’s base of tasks and projects, making it easy to see who is responsible for different tasks, what the deadlines are, and how it relates to the big picture.
How you want to organize the portfolios will depend on you, your team, and your company’s needs. You can make a portfolio to monitor and keep track of your company’s goals, your team’s projects, or your campaign’s progress, and then customize it with sections for tracking things like your team’s stage, budget, and other pertinent information. Afterwards, your portfolio’s projects may be viewed and sorted in any way that suits you.
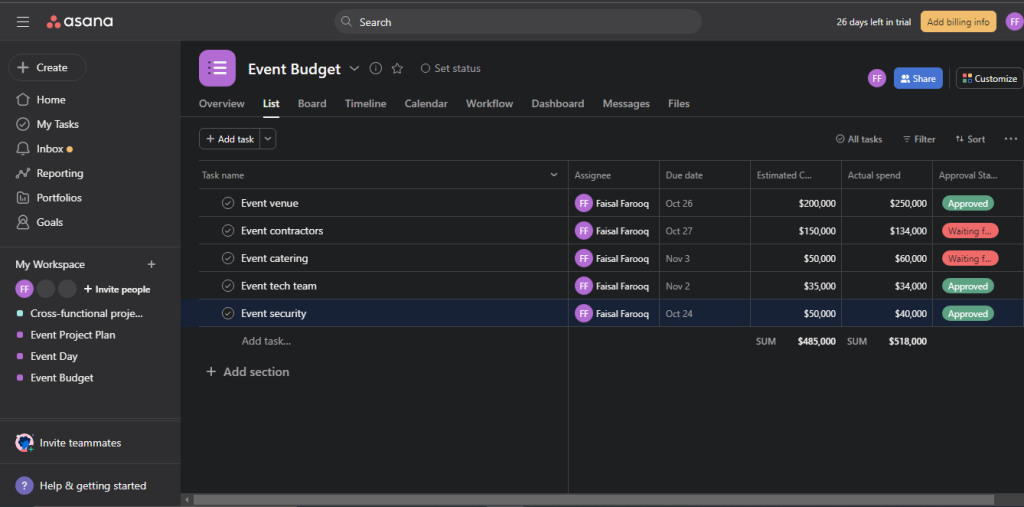
Expense reporting in Asana
You can set up a budget plan for your projects in Asana. A project budget is an estimate of the money you’ll need to complete a given task by a certain date. For example, freelance web designer fees, marketing expenses, etc. To avoid the typical problems of running out of resources or going over budget, it is helpful to make a budget plan ahead of time and stick to it throughout the project’s duration.
Additionally, creating a budget before beginning a project will help you define its scope and keep expenditures in check. Making a thorough expenditure plan is also an excellent method to convince stakeholders to back your project and provide the necessary funding as it clarifies to approvers exactly how the money you’re asking for will be put to use. As the project develops, you may use the budget as a reference point to see how much you’ve spent compared to what was planned, and adjust accordingly.
Asana reporting in the free version
You can use all the standard project management tools in the free version, which is enough for small businesses that just need to manage their day-to-day activities. Additionally, the free version offers basic reporting capabilities such as status update and allows you to export projects as PDF and CSV files. However, if you want to access advanced reporting in Asana, you’ll have to pay for one of the premium versions. Alternatively, you can use Coupler.io to export Asana to Excel, Google Sheets, or BigQuery and create your own custom reports.

Automate data export from Asana with Coupler.io
Get started for freeReporting in Asana: Conclusion
Asana reporting is a great feature for monitoring and managing day-to-day operations. You can get all the information you need to make informed decisions on your project progression and employees’ work efficiency. However, if you want to perform an advanced in-depth analysis of your business activities, it’s better to create custom reports outside the platform.
With Coupler.io, you can automatically export the data from Asana to a spreadsheet or data warehouse for record-keeping or for generating custom reports. Additionally, because these reports are generated outside the platform, you can easily share them with all the stakeholders.
