Discover How to Automate Shopify Reports with No Tech Skills

As a Shopify store owner, you’re likely losing hours each month manually exporting reports on sales, inventory, orders, customers, and acquisition metrics. Native Shopify analytics are useful for basics but fall short when you need custom insights, automated updates, or data combined with ad platforms or other tools in spreadsheets or dashboards.
Report automation saves significant time, eliminates errors, delivers data updates on the schedule you choose, and empowers faster decisions to optimize stock, marketing, and growth. This is where Coupler.io, a no-code data integration platform, comes into play. It connects Shopify directly to Google Sheets, Looker Studio, Excel, Power BI, etc., in minutes to automatically export key data and build custom reports.
In this article, you’ll get practical guidelines on how to automate Shopify reporting that eliminates hours of manual effort.
Can you schedule Shopify reports to run automatically with Shopify’s native functionality?
A short answer is “No”. To schedule Shopify reports, you need to use automation tools like Coupler.io with its Shopify connector, Shopify Flow, or third-party apps. These platforms let you set up automated data exports on daily, weekly, or monthly schedules.
With Coupler.io, it’s super easy for Shopify store owners to create and automate Shopify reporting. Just connect your Shopify data (e.g., sales, orders, products, inventory, and customer info) to the reporting tools you already use (such as Google Sheets, Looker Studio, Excel, Power BI, or BigQuery). Additionally, you can mix in data from other sources. Then set up automatic data refresh for your report according to your business needs.
How to create and automate Shopify reports with Coupler.io
You can easily build and automate Shopify reports using Coupler.io in two ways:
- Using pre-built data set templates
- Building an automated data flow from scratch
Both options are no-code and easy-to-configure. Let’s go over each of them in detail.
Quick-start Shopify data templates
To help you get started faster, Coupler.io offers pre-built data set templates for Shopify. These come with your Shopify data already structured, combined (like with Google Analytics 4 for behavioral insights), and ready for analysis.
Examples include:
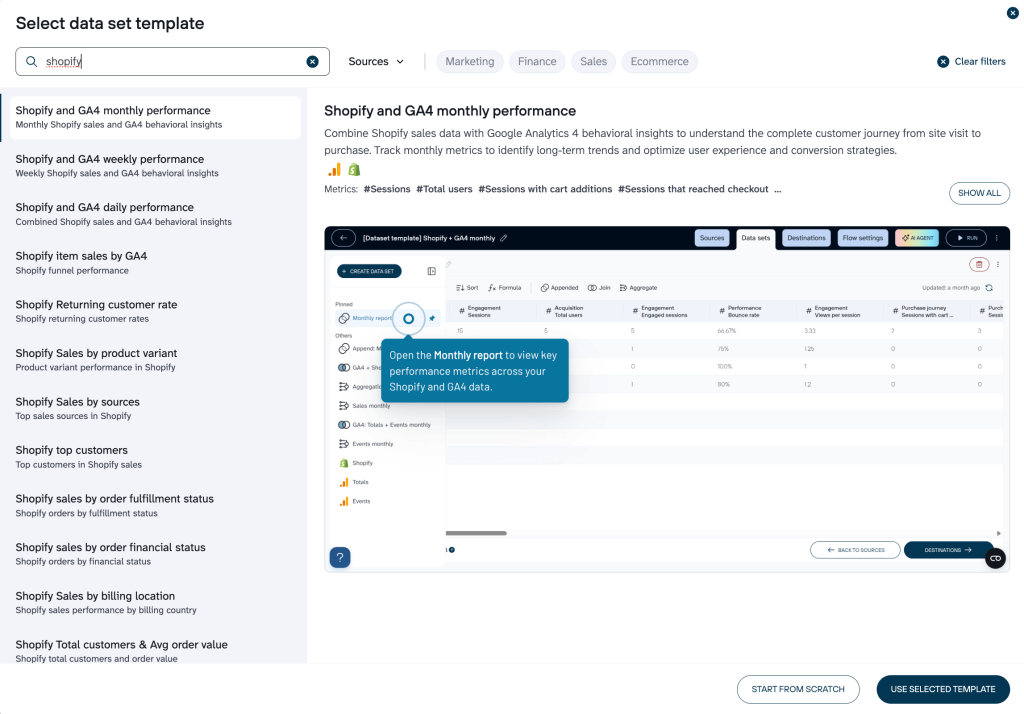
- Shopify and GA4 monthly performance: Combines Shopify sales with GA4 behavioral data to track the full customer journey from sessions to purchases, with monthly trends for long-term insights.
- Shopify and GA4 weekly performance: Weekly views of sales and user behavior to spot shorter-term patterns.
- Shopify and GA4 daily performance: Detailed daily metrics on sessions, cart additions, checkouts, and more.
- Shopify item sales by GA4: Product-level sales tied to analytics insights.
- Shopify returning customer rate: Tracks repeat buyer percentages and engagement.
- Shopify sales by product variant, sources, top customers, order fulfillment status, billing location, and more.
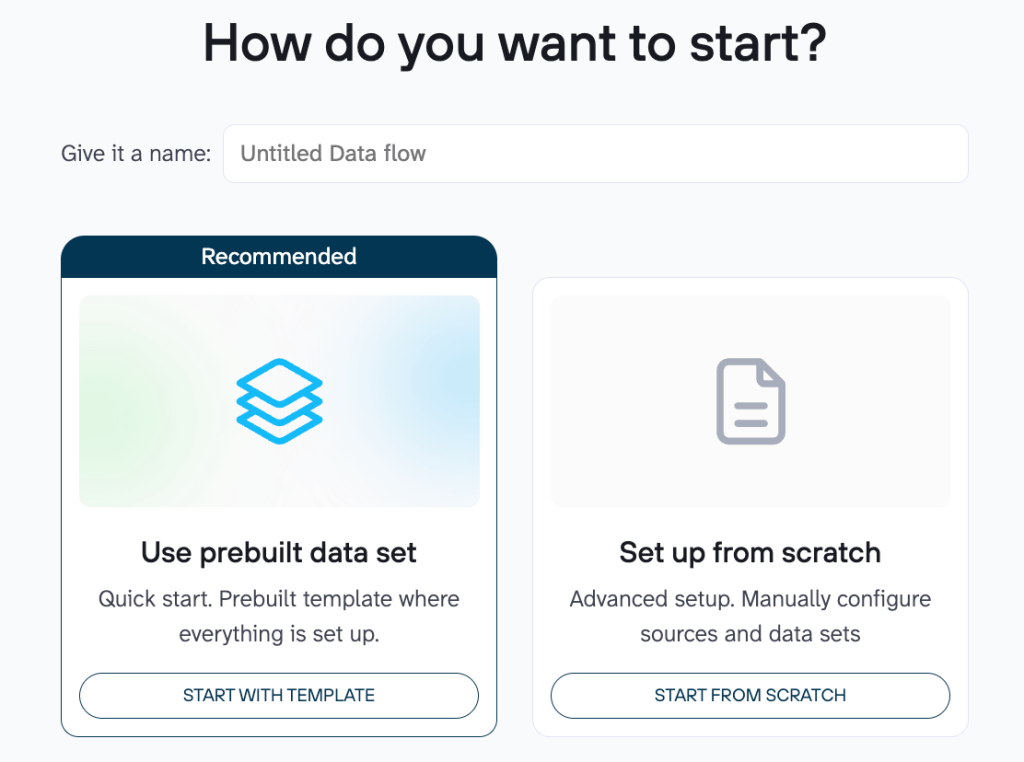
To access a data set template, create a new data flow in Coupler.io and select the “Start with template” option.
Search for “Shopify” in the bar, browse the available templates filtered by e-commerce or sales, pick one that matches your needs, and continue to configure it with your Shopify connection. Your data will load automatically, ready for reporting or dashboards.
Automated data flow from scratch
You can easily create and automate a data flow for your Shopify report in four steps:
Step 1. Connect your Shopify account
Select your destination (for example, Looker Studio, Google Sheets, Power BI, BigQuery, or Excel) in the form below:
Sign up for a free Coupler.io account, no credit card required. Once logged in, connect your Shopify store. Then, choose the data entity to export (e.g., Orders, Customers, Products, Inventory, etc.).

| Pro tip:You can also add more data sources (e.g., Google Analytics, Google Search Console, Meta Ads, or other e-commerce/marketing tools) to build a complete, unified dashboard for your Shopify store and beyond. |
Step 2. Organize your data set for reporting
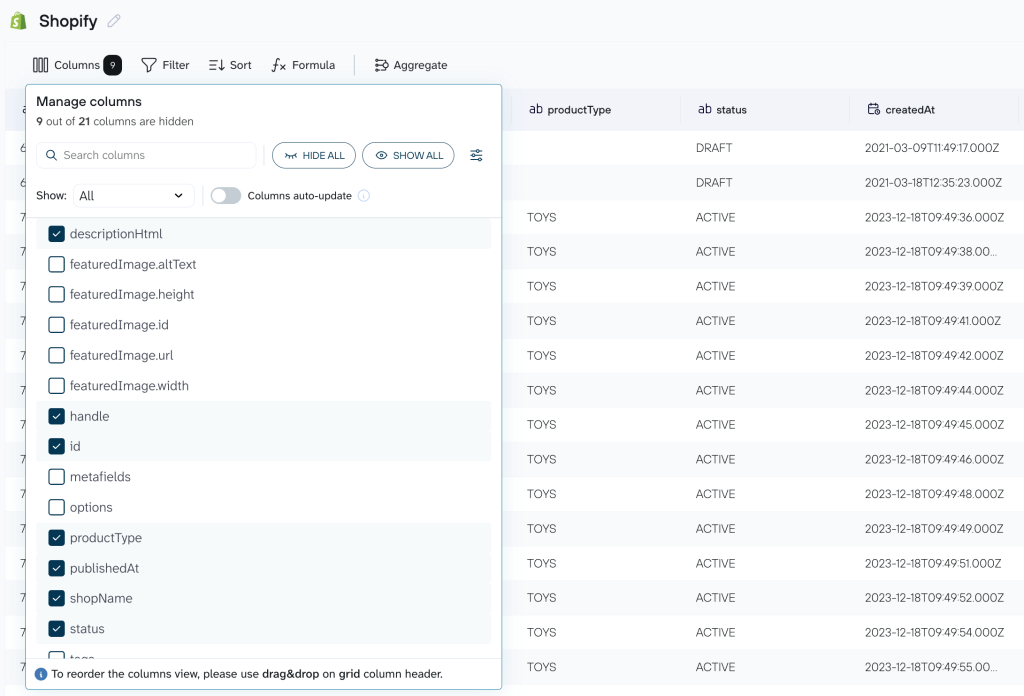
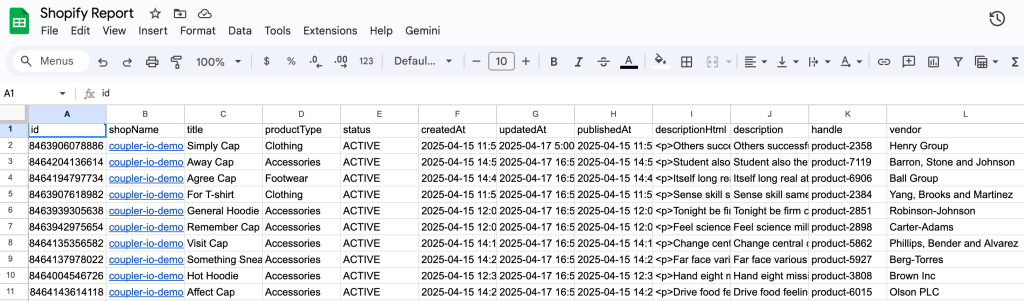
Raw Shopify data often includes extra columns or needs tweaks to fit your reporting needs (for example, cleaning up unnecessary fields or creating custom metrics). In this step, you can easily transform the data without any coding. Common actions include:
- Hide or remove unwanted columns (e.g., remove “Vendor”, “Tags”, “Compare at Price” if you only need sales-focused data like Product Title, Quantity Sold, Revenue)
- Rename or rearrange columns (e.g., rename “Lineitem price” to “Item Price” or move “Product Title” to the first column for easier reading)
- Filter rows or sort the data (e.g., Filter to show only orders from the last 30 days or sort by “Total Sales” descending to see top-performing products first)
- Aggregate values (e.g., sum “Revenue” by Product Title to get total sales per item; count orders per customer to calculate average order frequency; average daily units sold per product)
- Add calculated columns (e.g., create “Profit Margin” = (Revenue – Cost) / Revenue or “Days of Stock Left” = Available Inventory / Average Daily Sales)
If you’ve connected multiple sources (e.g., Shopify + Google Analytics 4), you can merge them here. For example, join Shopify orders with GA4 sessions by date or UTM parameters to create one unified dataset that shows sales + traffic sources.
Once your Shopify data looks clean and useful, move on to building reports or loading it into dashboards.
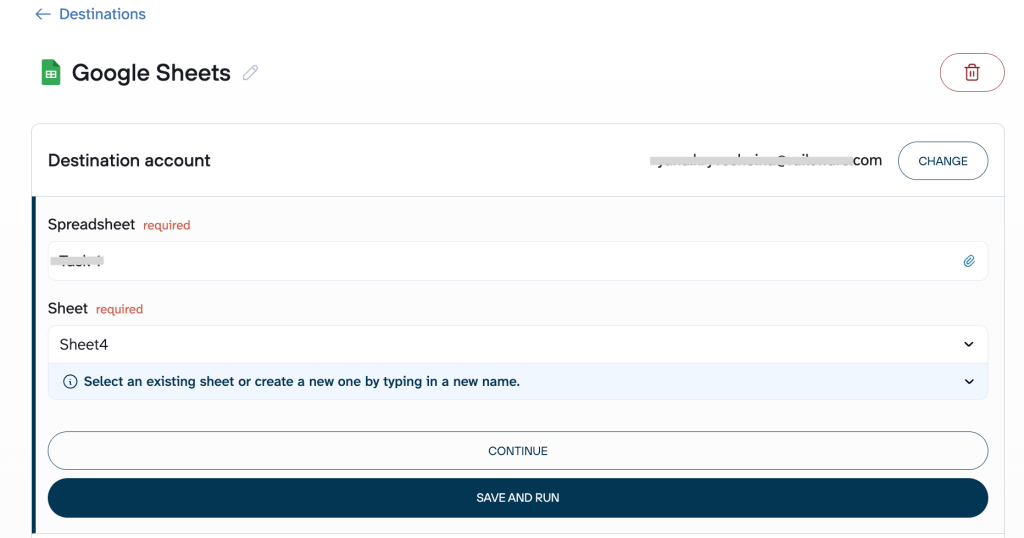
Step 3. Connect the reporting tool
Set up the reporting solution you’ve selected at the beginning. Connect your account (e.g., Looker Studio, Google Sheets, Power BI, etc.) and configure the required settings based on the reporting tool you’ve selected.
Step 4. Automate your report
Turn on automatic data refresh to keep your Shopify reporting updates running without manual work. Coupler.io offers two main ways to automate Shopify reports and keep them up-to-date:
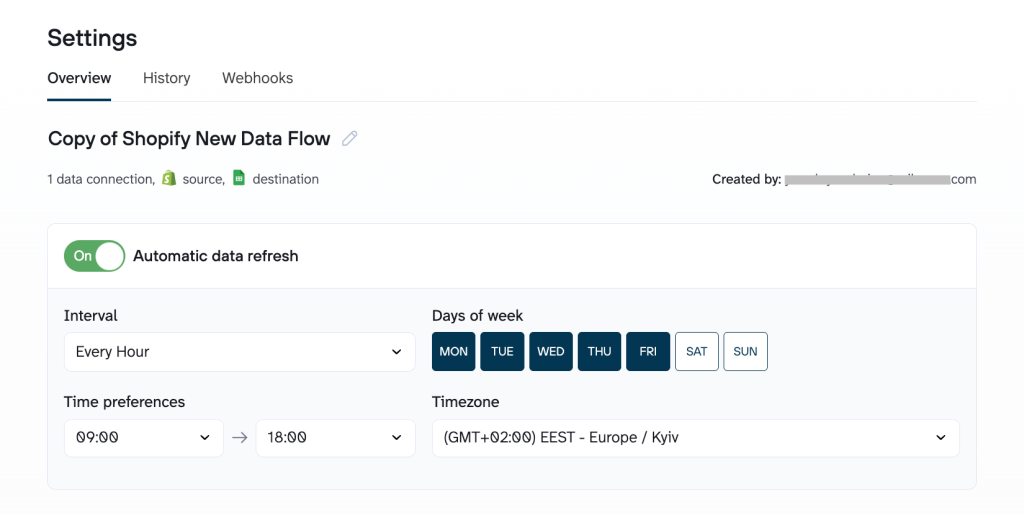
- Scheduled refreshes
Set your preferred interval (as frequent as every 15 minutes for near-real-time updates, or hourly, daily, weekly), choose specific days of the week, and pick exact times that fit your routine. This ensures your data in Google Sheets, Looker Studio, or other destinations stays current on autopilot.
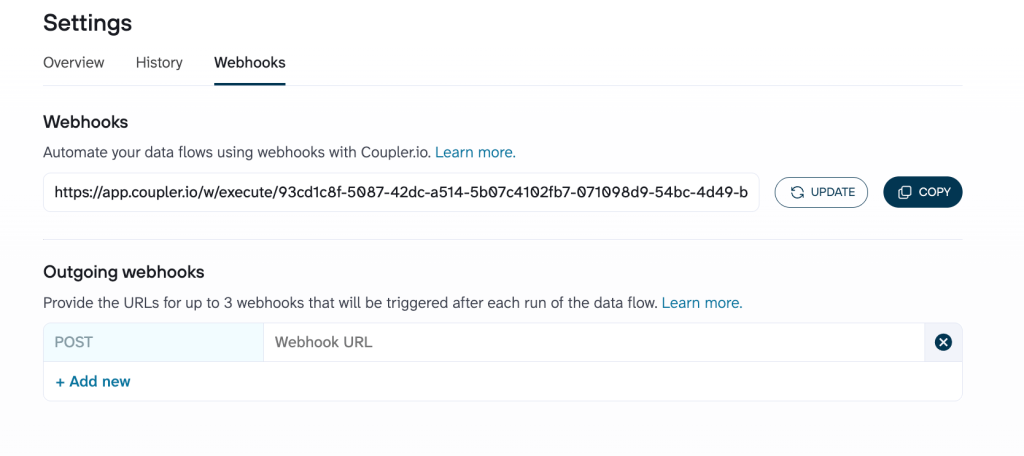
- Webhooks for triggered automation
Use incoming webhooks to start a data refresh instantly when something happens, like a new order placed in Shopify or another event in your connected tools. This gives event-based, on-demand updates beyond fixed schedules. For example, a new customer signs up or places their first order → refresh of customer metrics gets triggered → marketing or CRM views stay up-to-date in real time.
Outgoing webhooks can also notify other systems once your refresh completes. For example, once a Coupler.io data flow finishes refreshing (e.g., your Shopify sales data is updated), Coupler.io sends a webhook out to notify or trigger something like starting another tool or sending a Slack message.
Once done, your report will automatically refresh on its own according to the schedule you’ve set.
Automate your Shopify reporting with Coupler.io
Get started for freeAI-powered features for automated Shopify reports
Reports are excellent for spotting performance trends, like sales, inventory, or revenue, but they rarely reveal why products succeed or fail. Slow-moving stock? Breakout variants? Margins quietly eroding?
Coupler.io automatically pulls your Shopify data (orders, products, inventory, customers, etc.) into tools like Google Sheets, Looker Studio, or Power BI for up-to-date, automated reports. You can also feed this data directly to AI for natural-language insights.
Coupler.io’s built-in AI always works with your up-to-date Shopify data (plus other sources if connected). Simply ask natural questions directly in your reports:
“Why are these SKUs underperforming?”
“What’s hurting margins this month?”
You’ll get fast answers, trends, root causes, and recommendations, which are often faster than manual analysis.
You can choose between the two AI features Coupler.io offers:
- AI integrations – to talk with external AI tools like ChatGPT or Claude about your Shopify reports
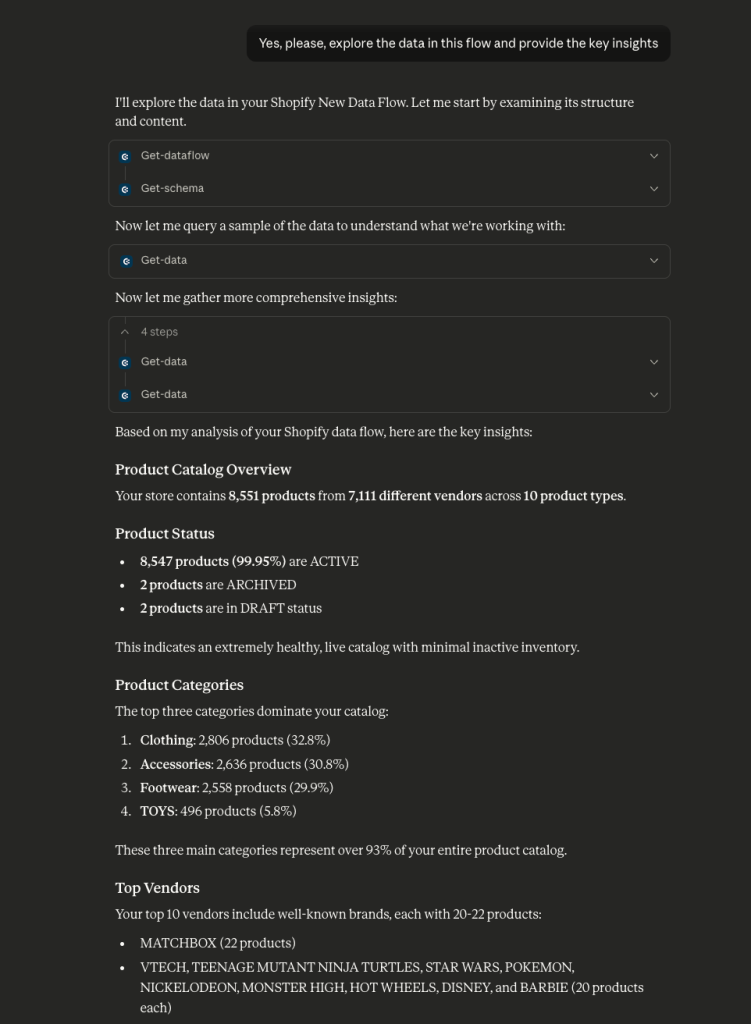
- AI Agent – to ask questions about your Shopify data and get insights into it right in Coupler.io
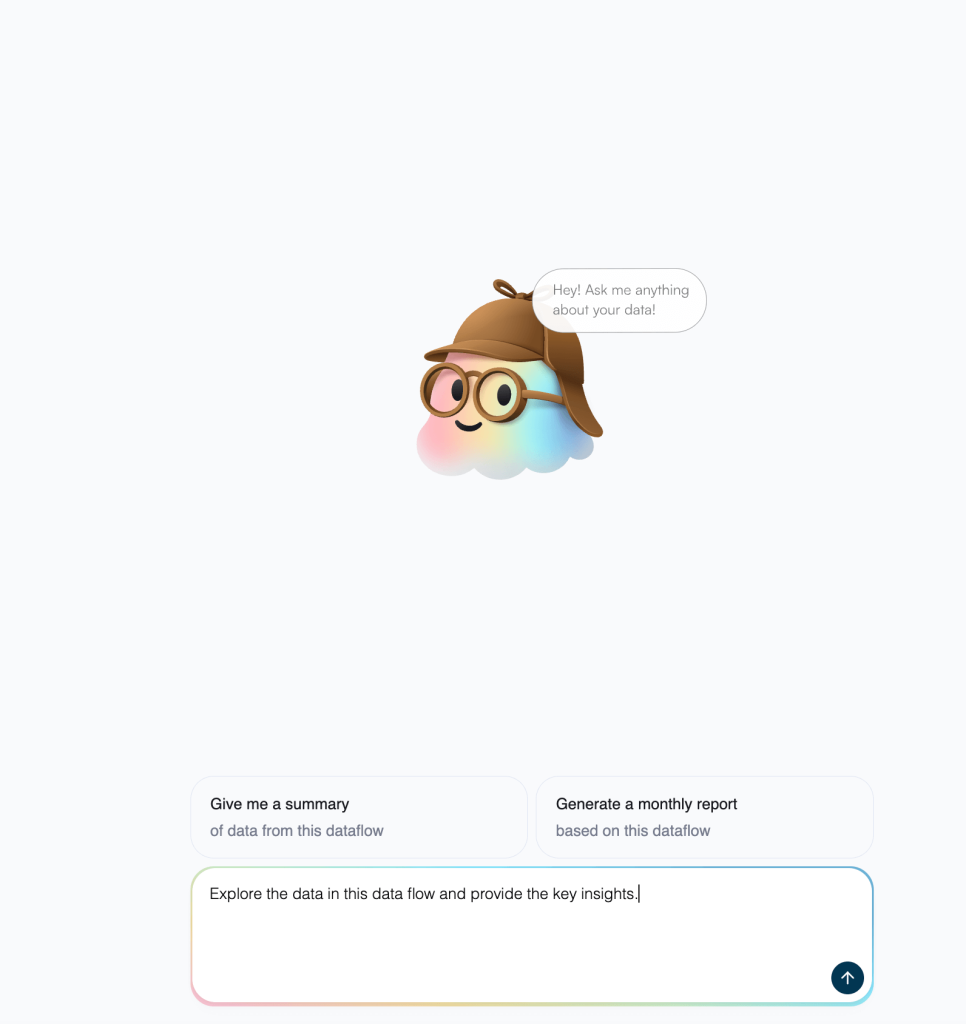
Ask a simple question and instantly get a deep analysis or actionable insights.
Note: Your data stays protected. Coupler.io shares only the necessary data points or summaries with AI tools, not the full dataset, and your information is never used for AI training.
You can even share these AI-ready data flows with clients and surprise them with powerful, AI-driven insights.
Try AI reporting with Coupler.io
Register for freeCoupler.io also provides free, ready-made dashboard templates for Shopify data. These cover the most common views: sales overview, inventory tracking, order details, customer patterns, and basic marketing performance. You can start with one of these, load your connected data, and get clear visuals right away instead of building reports from zero.
Automate Shopify reporting with ready-to-use dashboards
No need to waste hours connecting sources, designing charts, and configuring them manually to build and automate Shopify reports from scratch.
Coupler.io gives you a better way: ready-made Shopify dashboard templates that connect in seconds, load your data instantly, and keep updating themselves so you can focus on decisions, not setup.
Orders dashboard
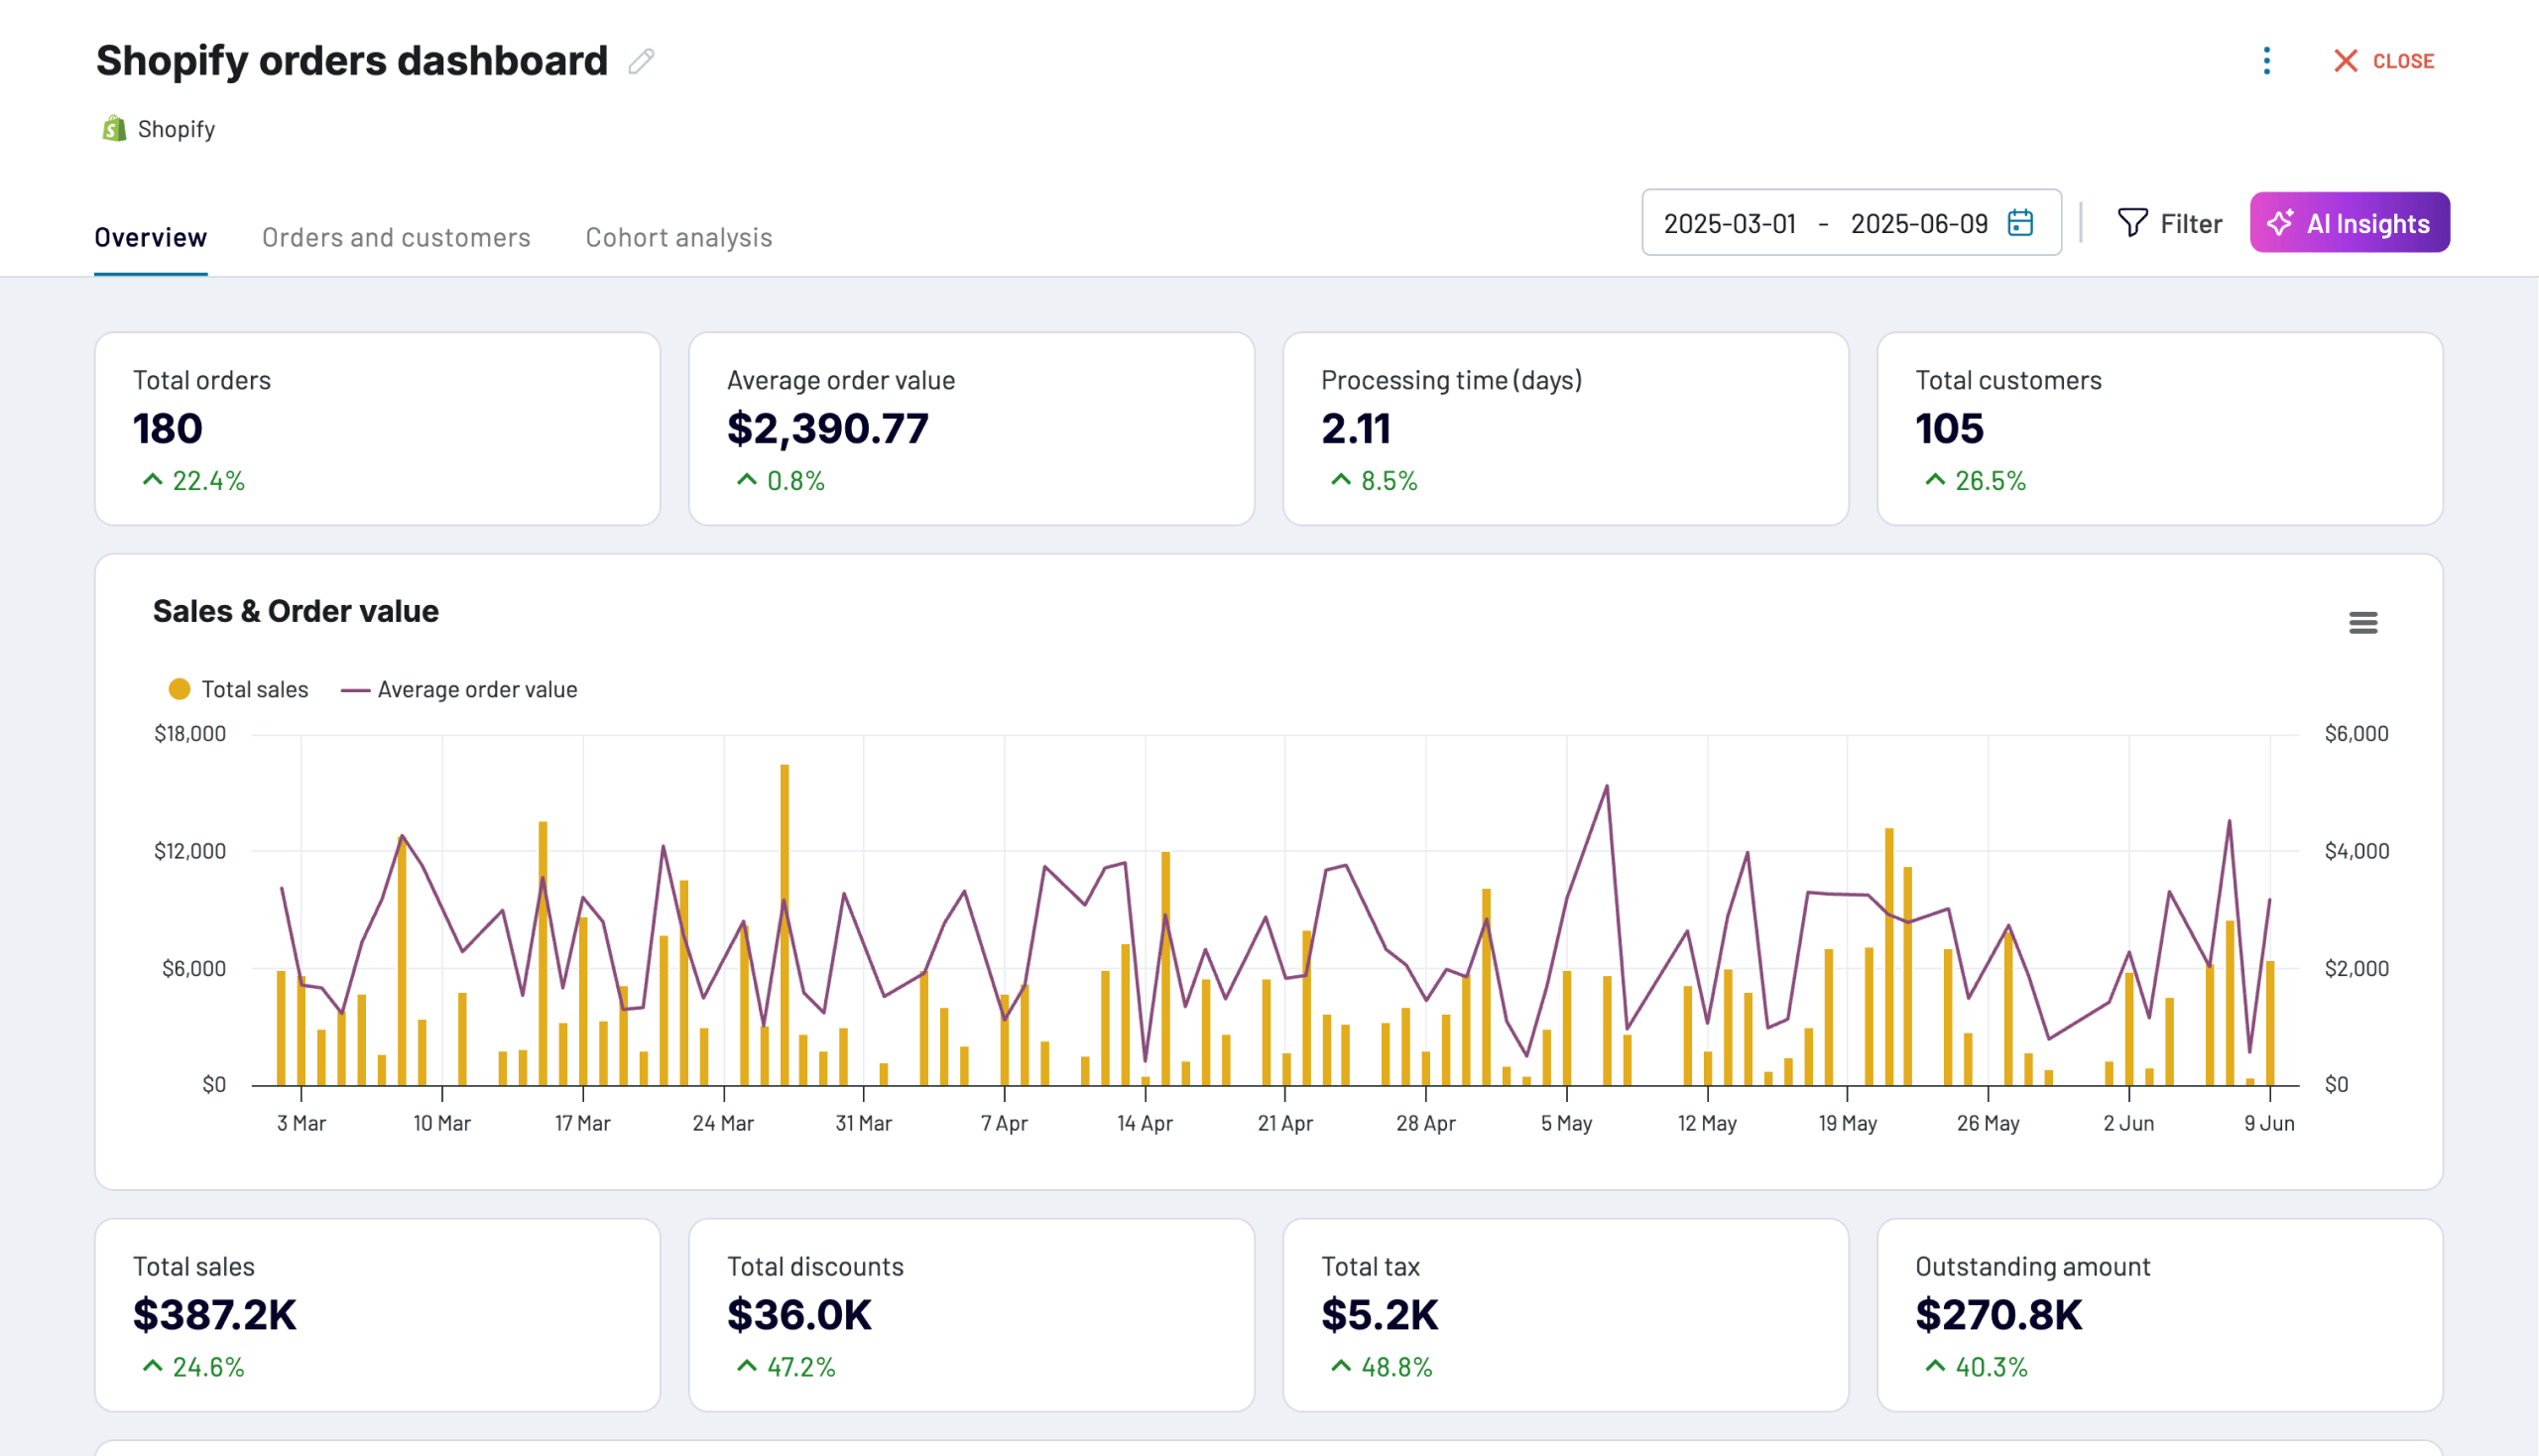
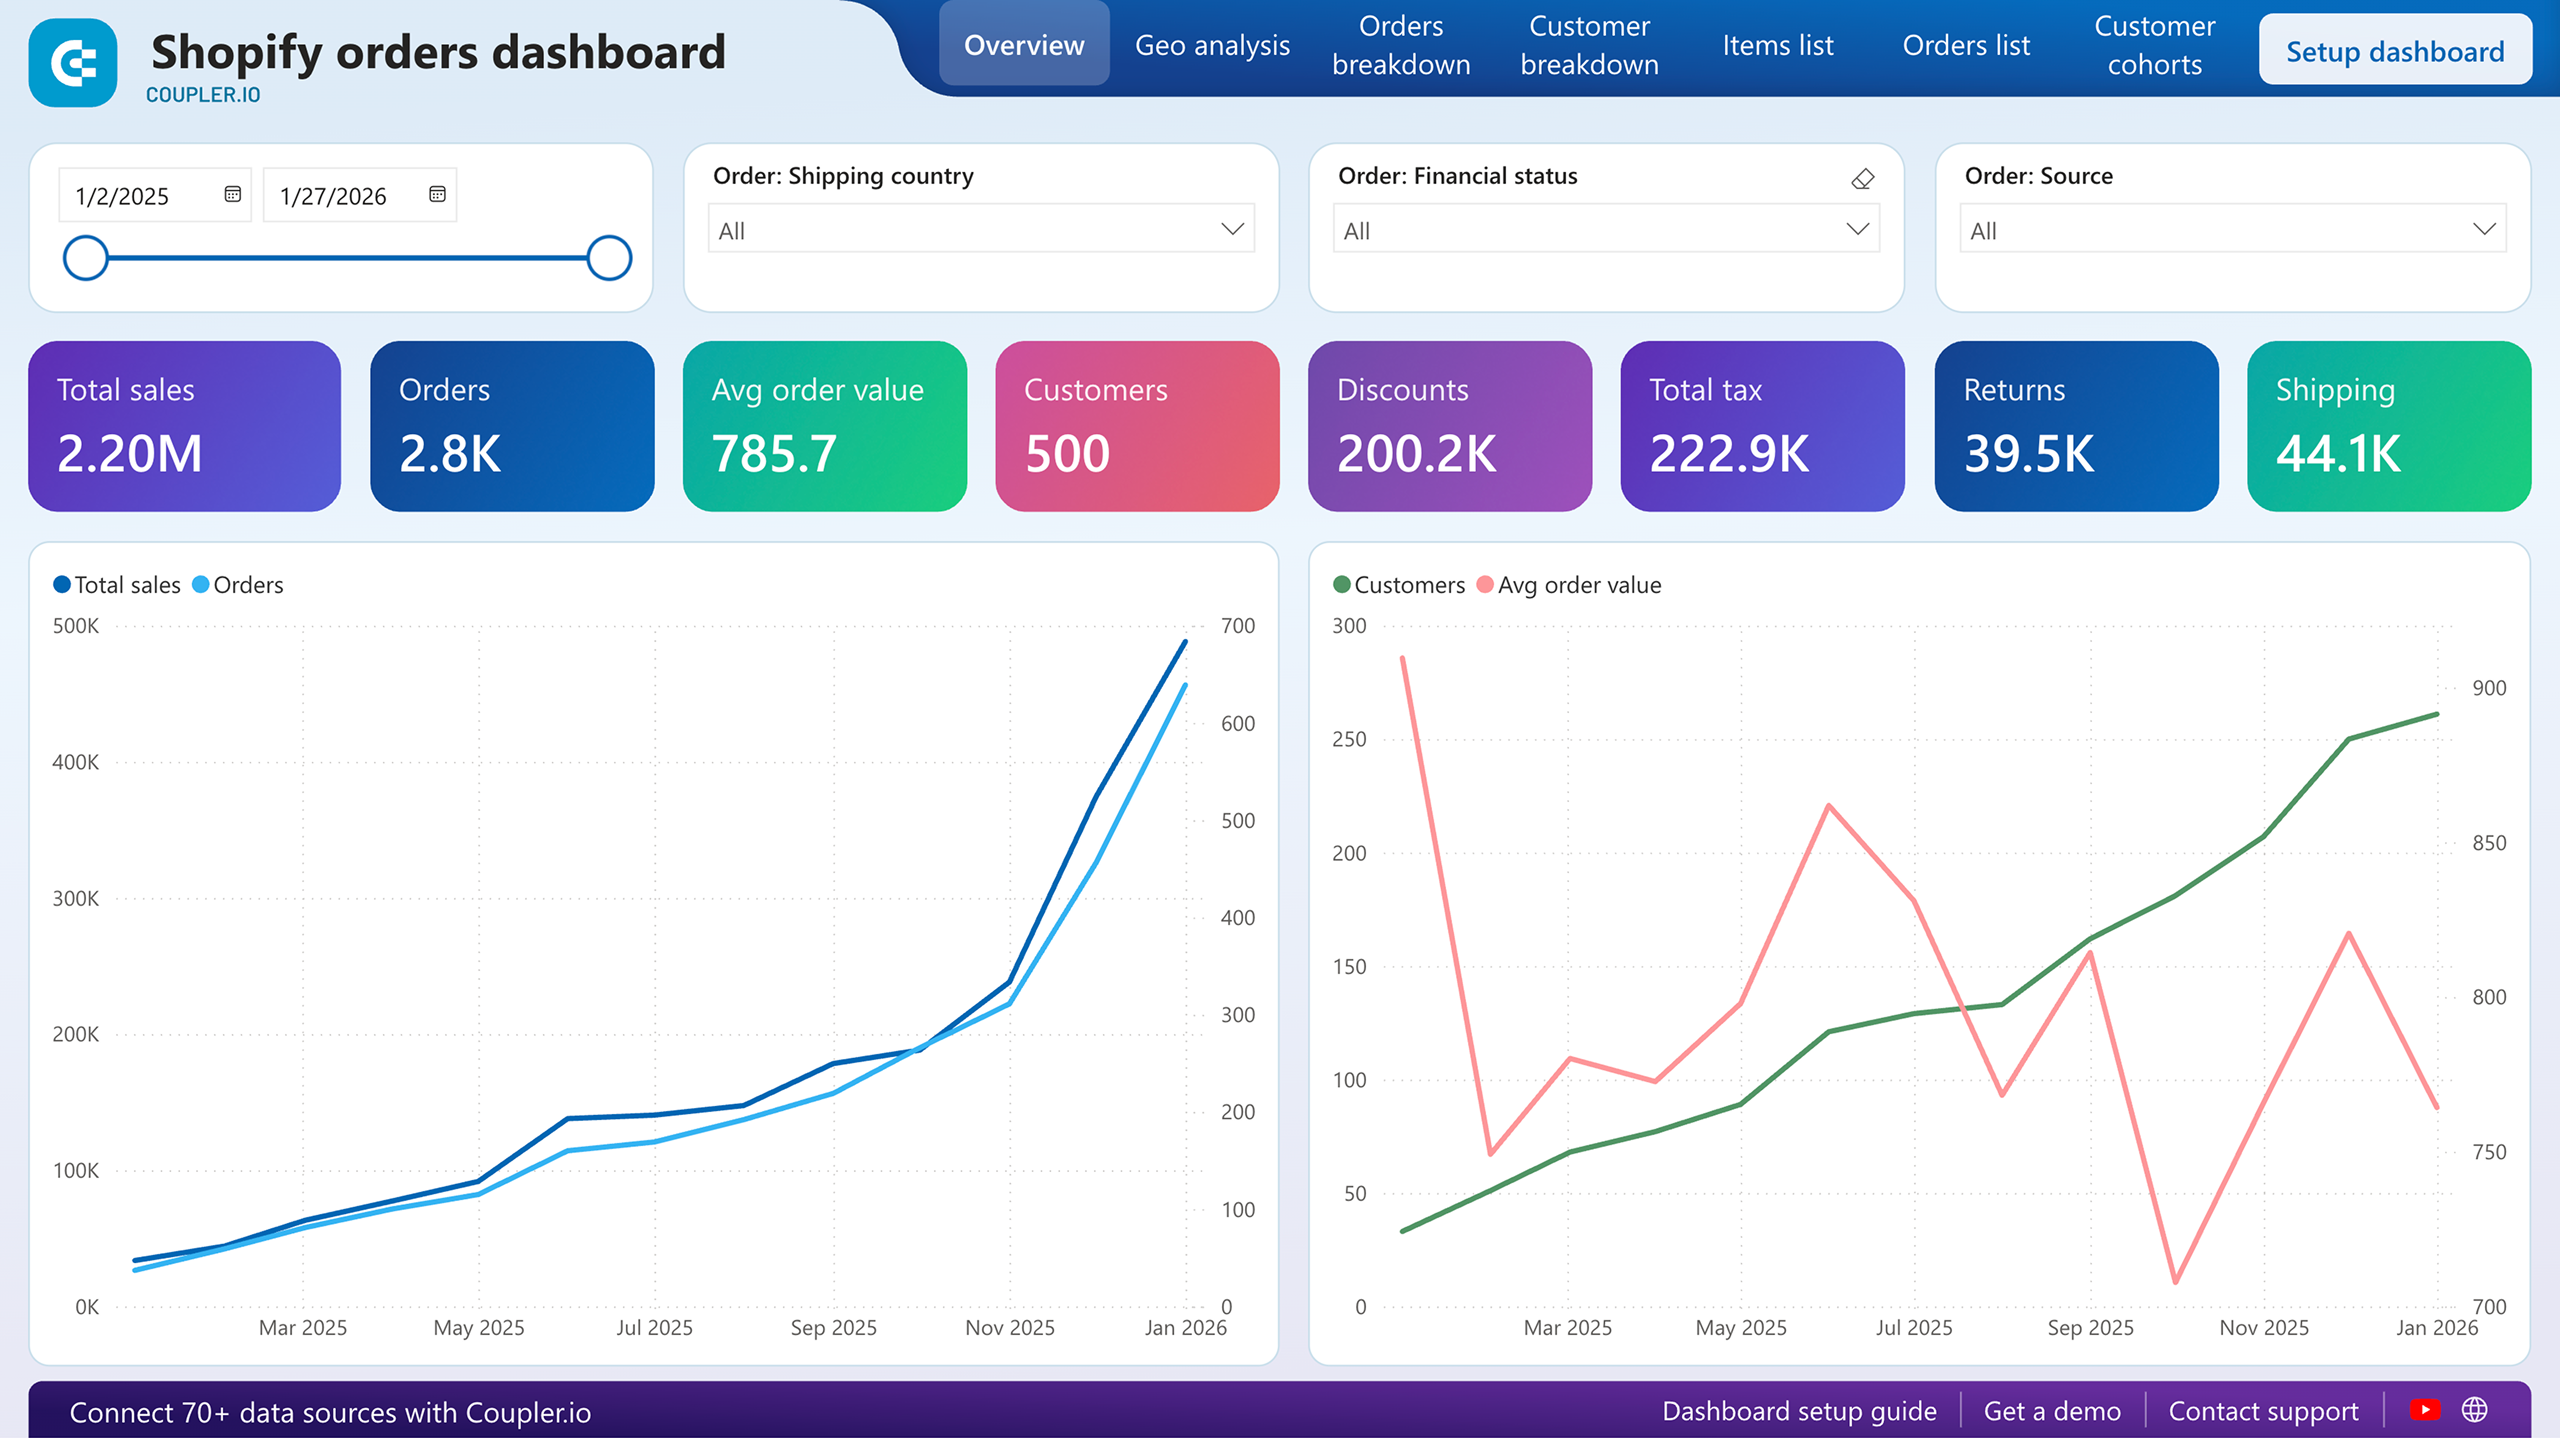
The Shopify orders dashboard offers a detailed overview of your store’s order performance, sales trends, and customer metrics in one place. With automatic data from Shopify and tabs for Overview, Orders, and customers, and Cohort analysis, plus date range filtering and AI insights, it helps you track revenue growth, order patterns, discounts impact, and customer base expansion.
What insights the dashboard provides:
- High-level orders and sales overview: See total orders, average order value, processing time (days), total customers, total sales, total discounts, total tax, and outstanding amount, including period-over-period percentage changes.
- Sales and AOV trends over time: Analyze daily/weekly fluctuations in total sales (bars) and average order value (line) to identify peak periods, dips, seasonality, or unusual spikes in revenue or spending per order.
- Discount and tax impact: Monitor total discounts applied and total tax collected across the period to understand promotional effects on profitability and tax obligations.
- Customer growth signals: Track total customers and their increase percentage to gauge acquisition success and overall store reach.
- Outstanding payments: View the current outstanding amount to manage cash flow and follow up on unpaid or partially paid orders.
How to use
The Shopify orders dashboard is available in Coupler.io and as a template in Google Sheets, Looker Studio, and Power BI. Connect your Shopify store, configure automatic refreshes as often as you need, and follow the included Setup guide. Your data will sync and display within minutes.
Shopify orders dashboard
Monitor your e-commerce order flow with comprehensive insights into sales patterns, customer behavior, and fulfillment metrics.


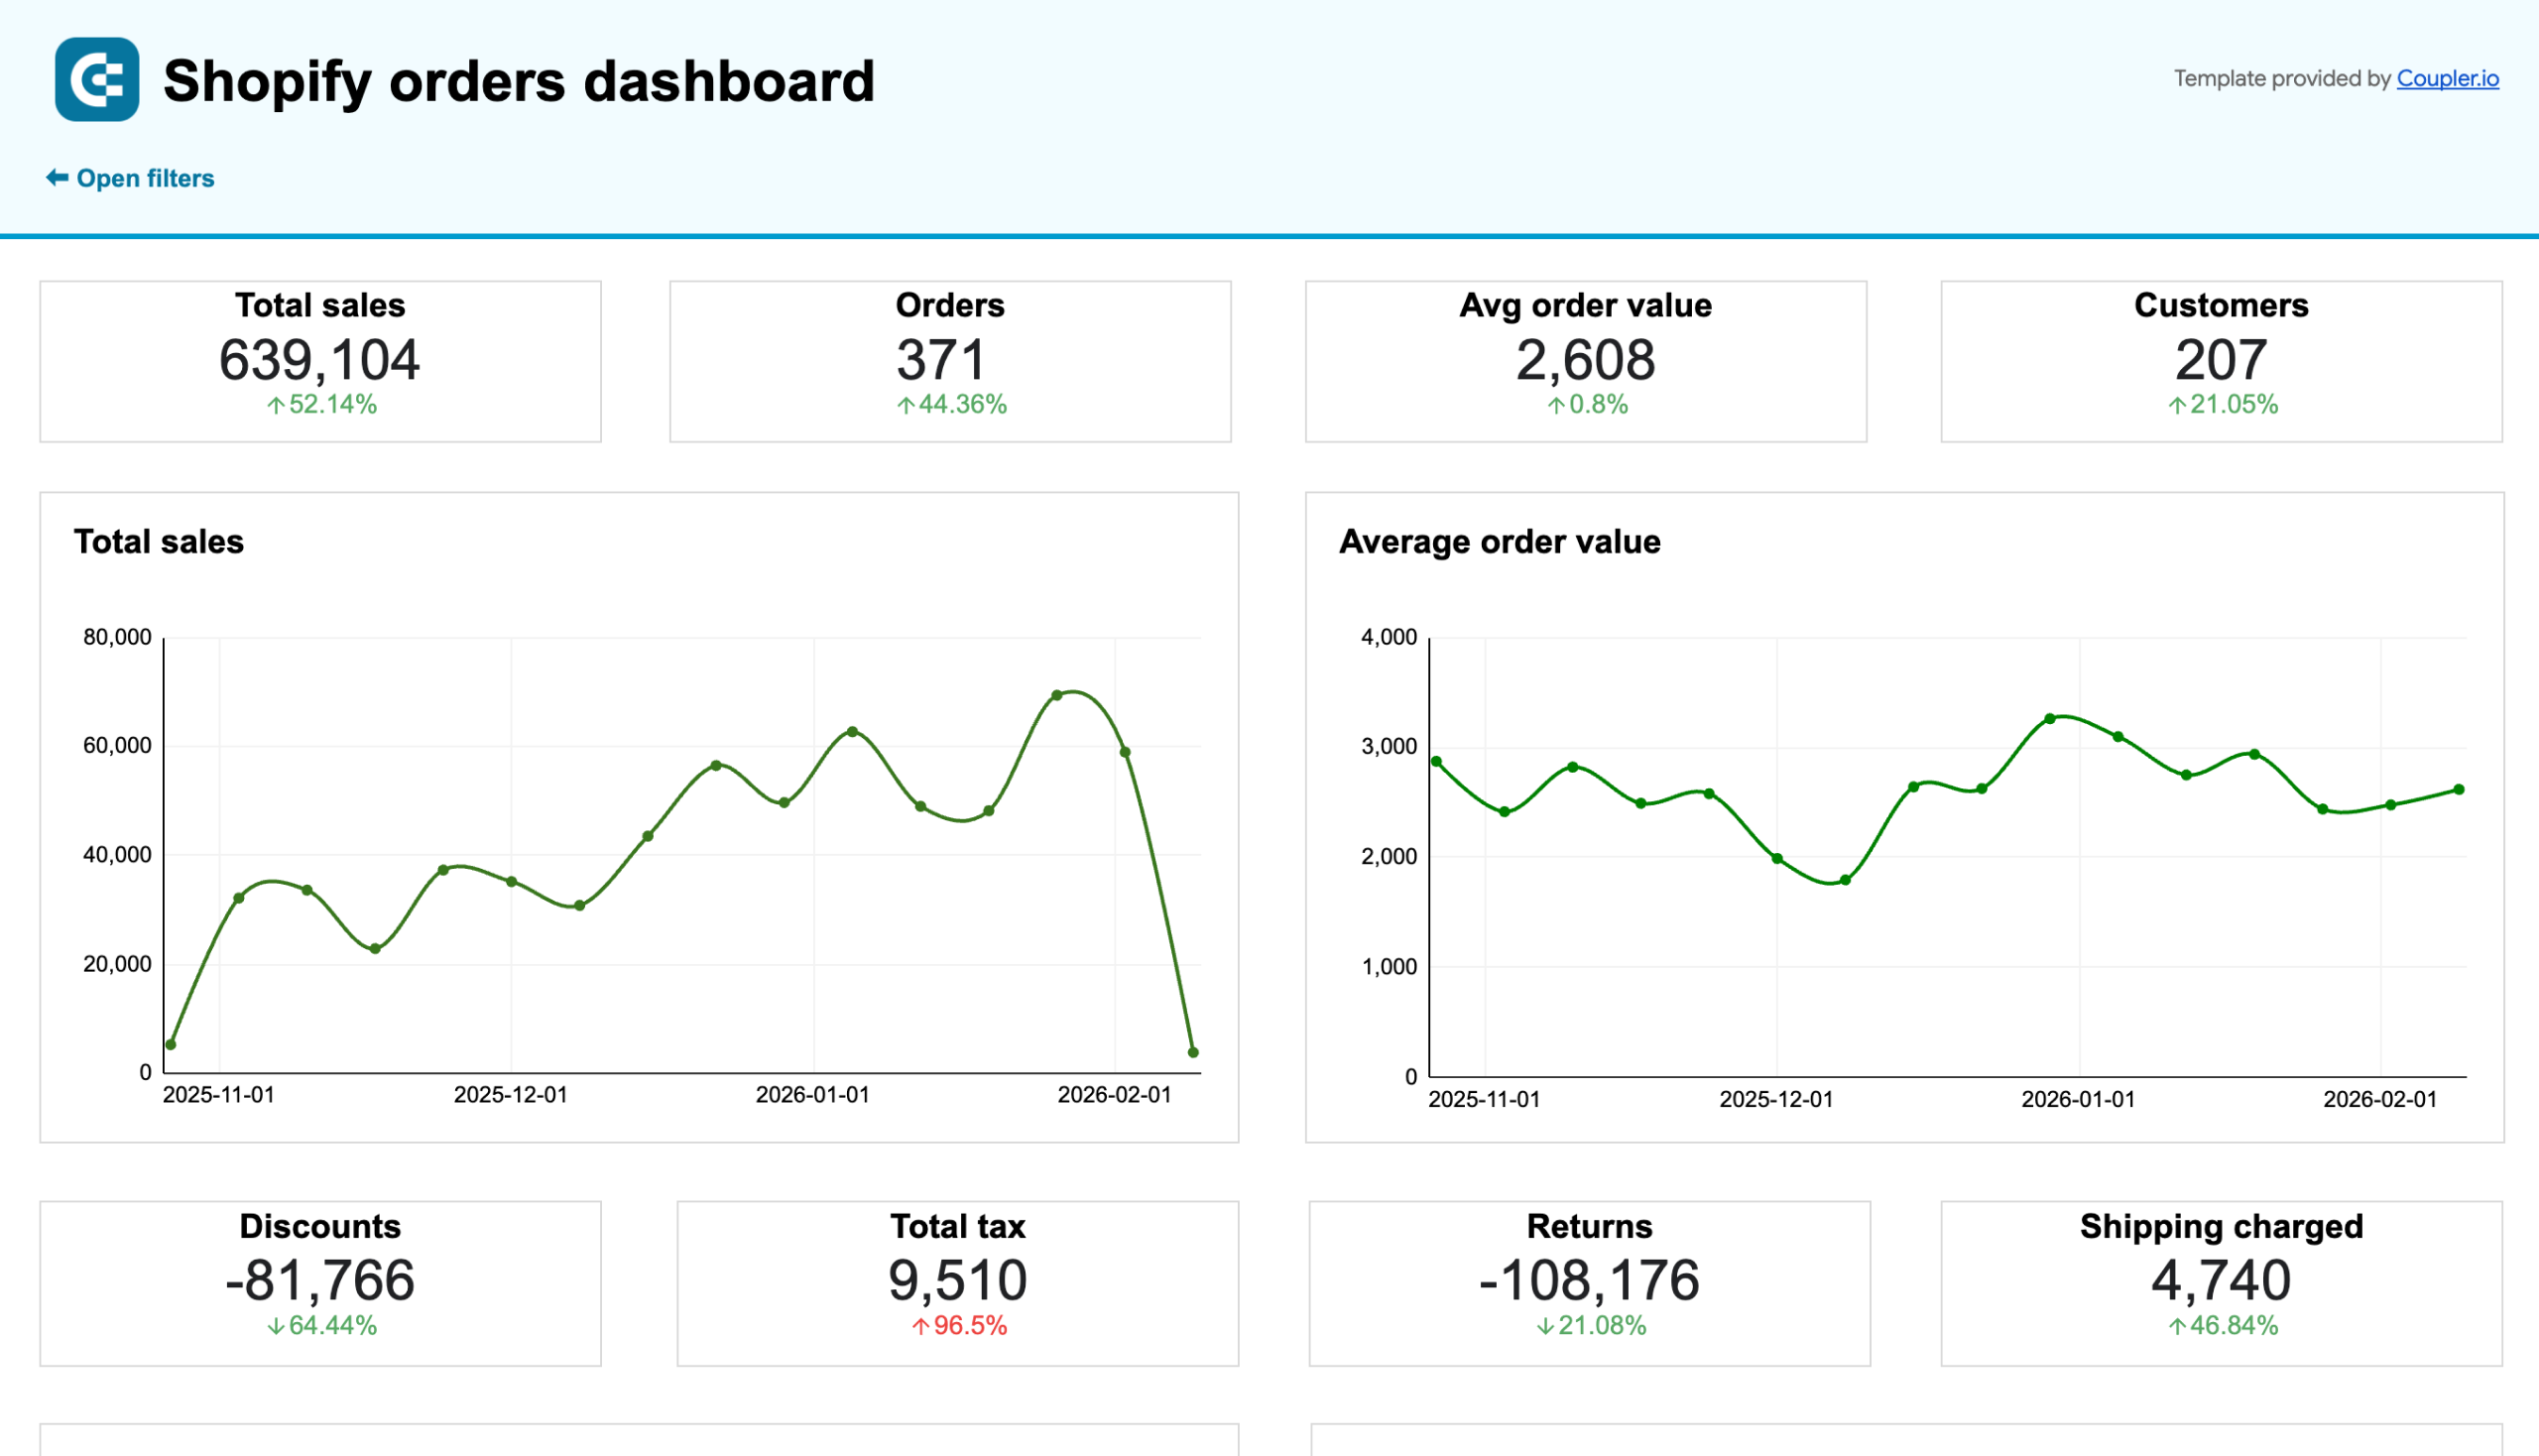
Shopify orders dashboard in Google Sheets
Monitor your Shopify store’s orders to efficiently manage sales, shipping, inventory, and identify customer trends.

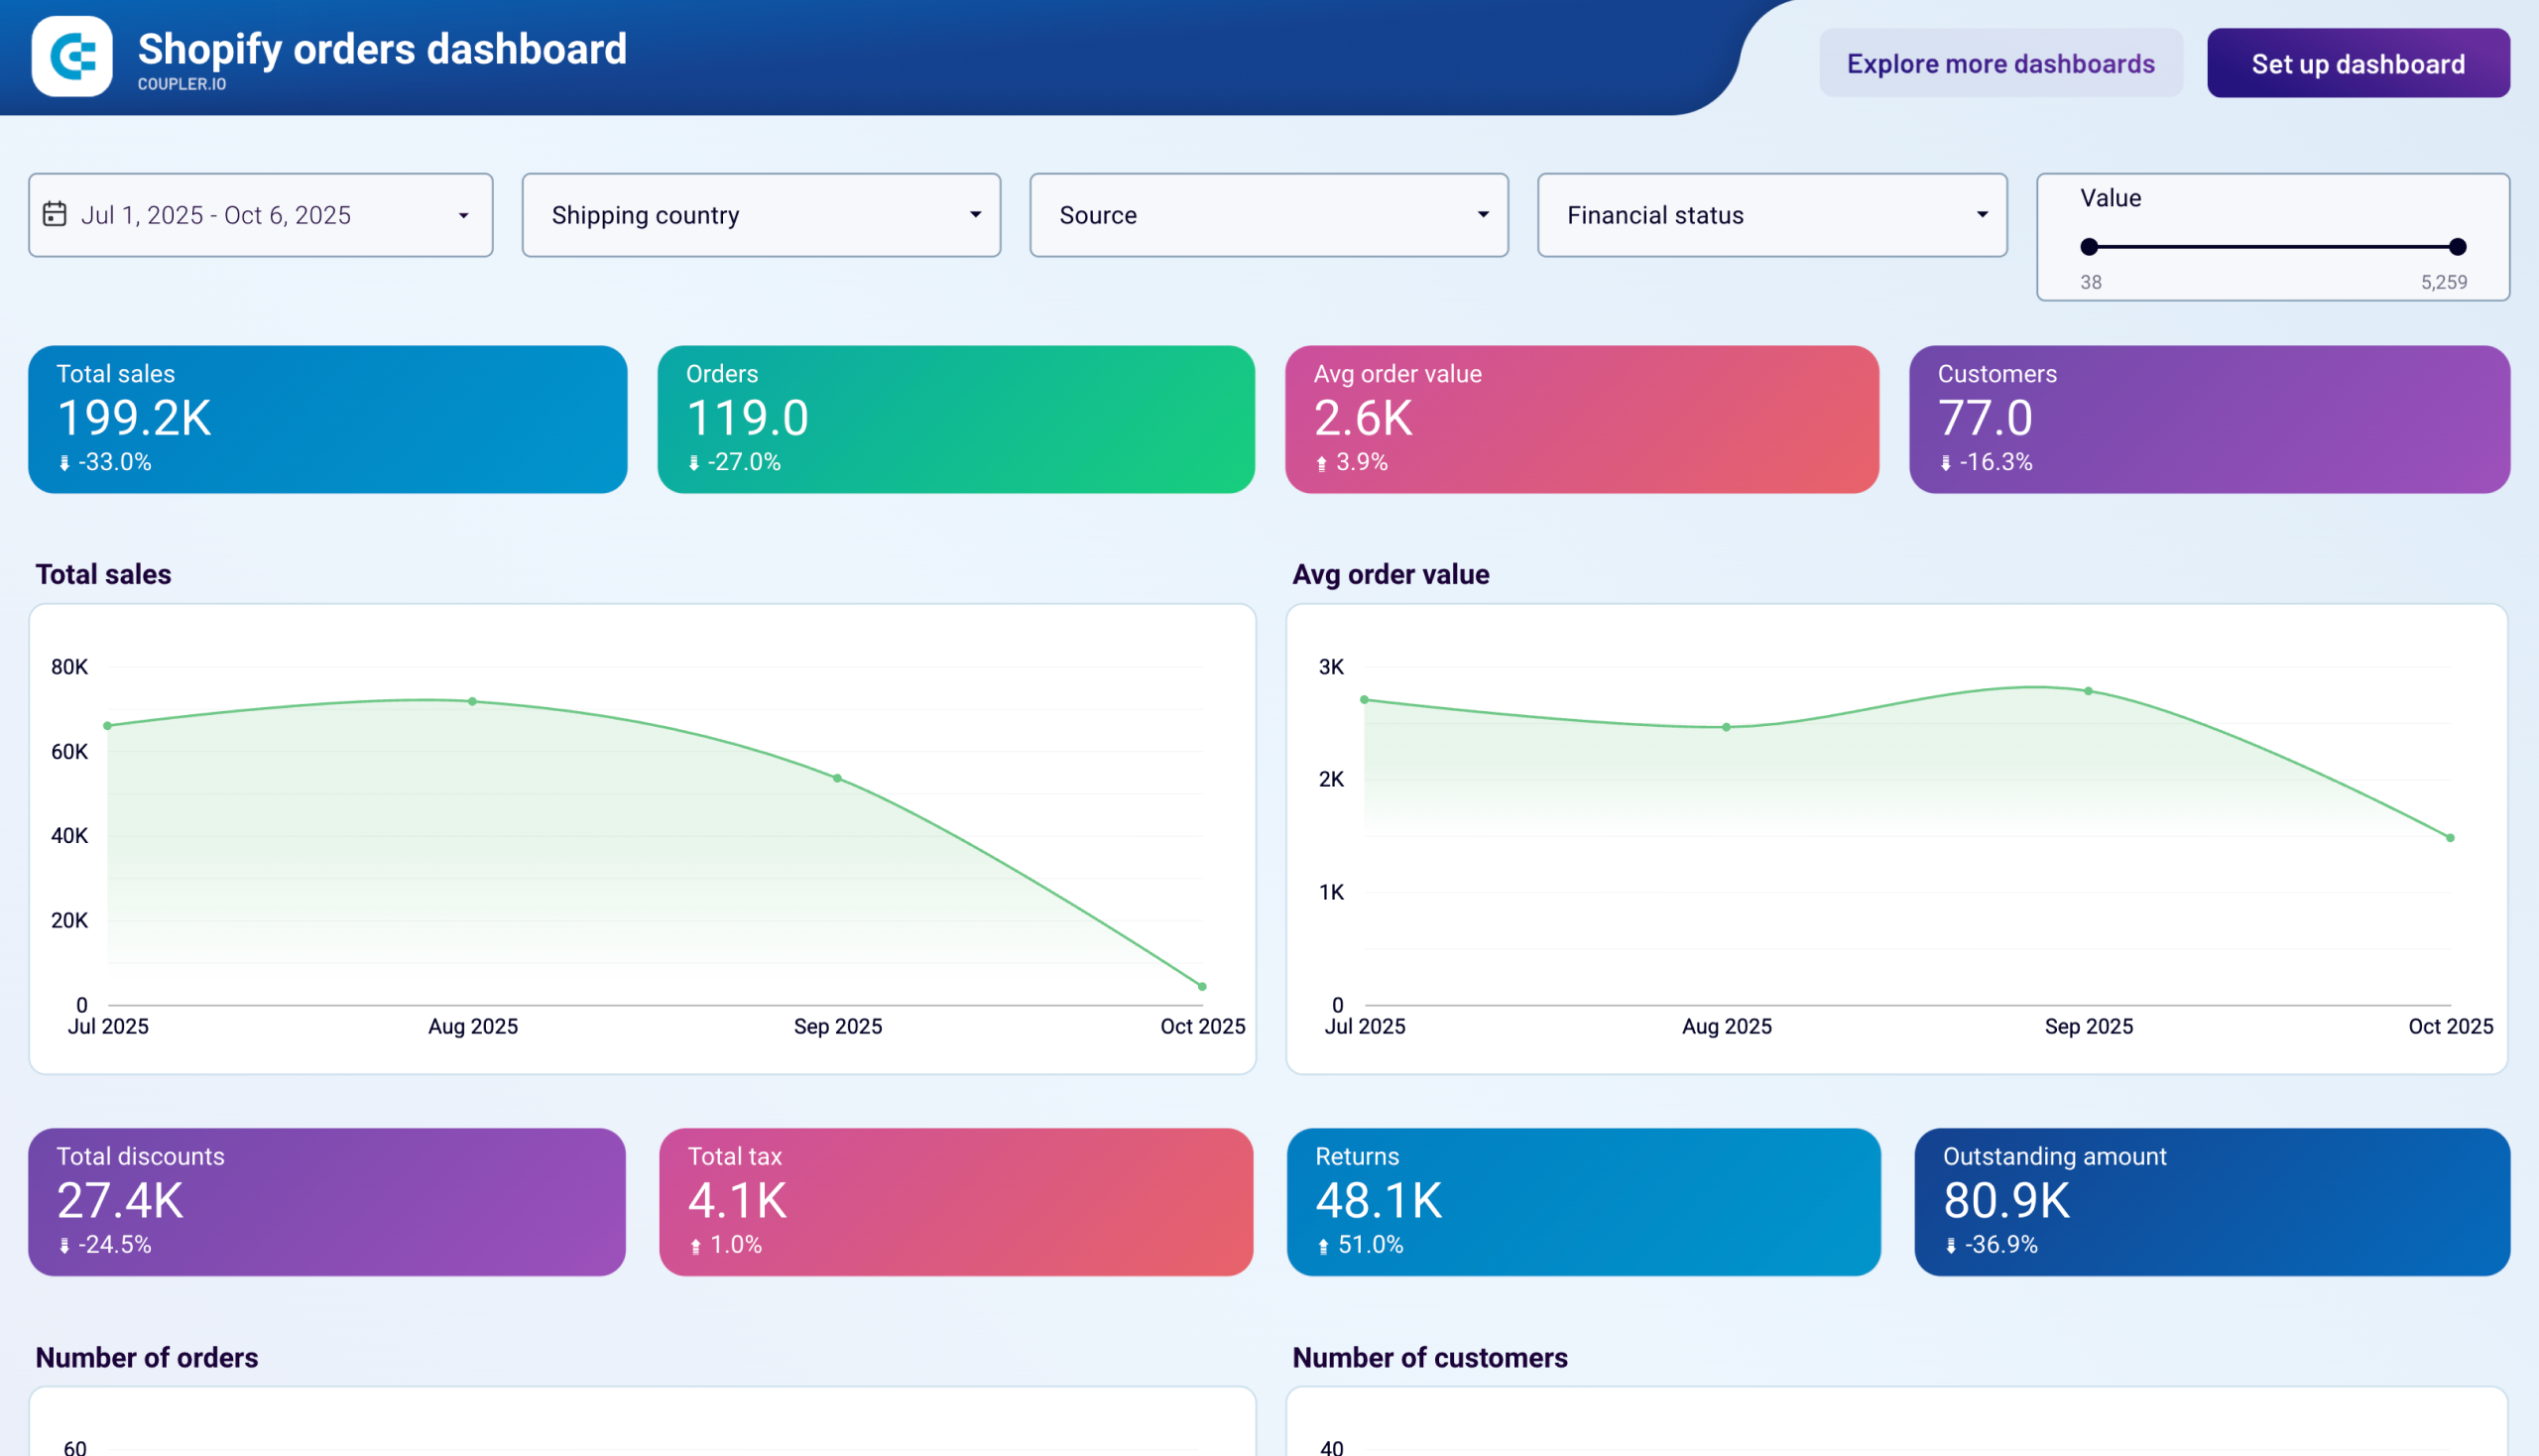
Shopify orders dashboard in Looker Studio
Access the performance of your Shopify ecommerce store and uncover critical insights into how to manage your orders effectively.

Shopify orders dashboard in Power BI
Track order volumes, payment statuses, and shipping performance with detailed visualizations of your Shopify store’s transaction data.

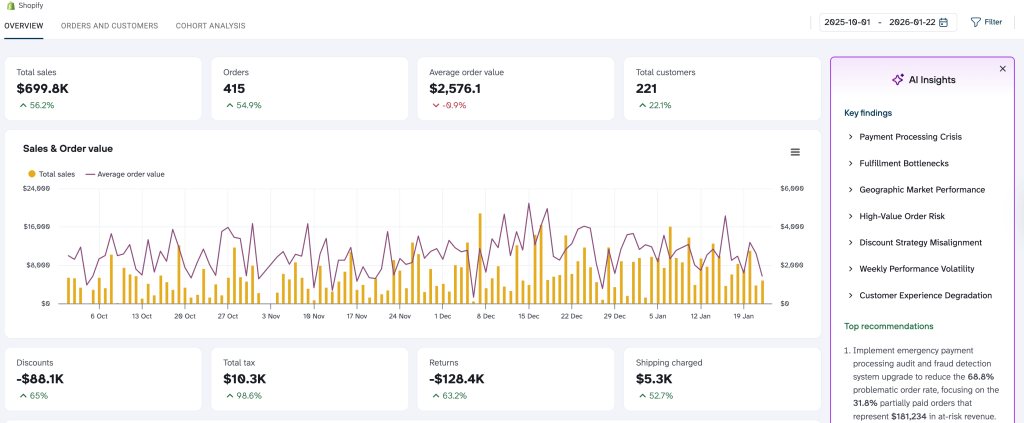
Coupler.io’s dashboards feature AI insights — a time-saving feature that automatically analyzes your data and spotlights the biggest stories: emerging trends, critical shifts, and anything unusual. These findings are presented in plain, easy-to-read language. You’ll catch vital changes sooner, focus on what drives results, and make informed decisions faster, regardless of your analytics experience.
Inventory dashboard
The Shopify inventory dashboard provides a unified overview of your product stock performance over the last 30 days. It pulls data directly from Shopify to show key metrics like stock value, order quantities, refund patterns, and predicted stock runway, helping you monitor availability, spot fast-selling items, manage reordering, and reduce unnecessary refunds or overstock.
What insights the dashboard provides:
- High-level summary: View total stock value, recent order value, and overall refund rate, with change indicators compared to the previous period.
- Product-level details: See each product’s stock value, available quantity, units ordered, average daily sales, estimated days of stock left, refunded quantities, and refund percentage (highlighted with color coding for quick identification of issues).
- Grand totals: Aggregate figures for total stock value, available units, ordered quantities, average daily sales, days remaining, refunds, and overall refund rate.
- Units sold trends: Visualize quantity ordered over time, with filters by shipping country or city to understand geographic demand patterns.
How to use
The Shopify inventory dashboard is available as a free template in Looker Studio and Google Sheets. Powered by Coupler.io’s connection to your Shopify store, it refreshes data automatically on the schedule you select (e.g., every 15 minutes or daily). Automate Shopify reporting by linking your account and following the included setup instructions; within minutes, you’ll get an up-to-date view of your data without manual exports.
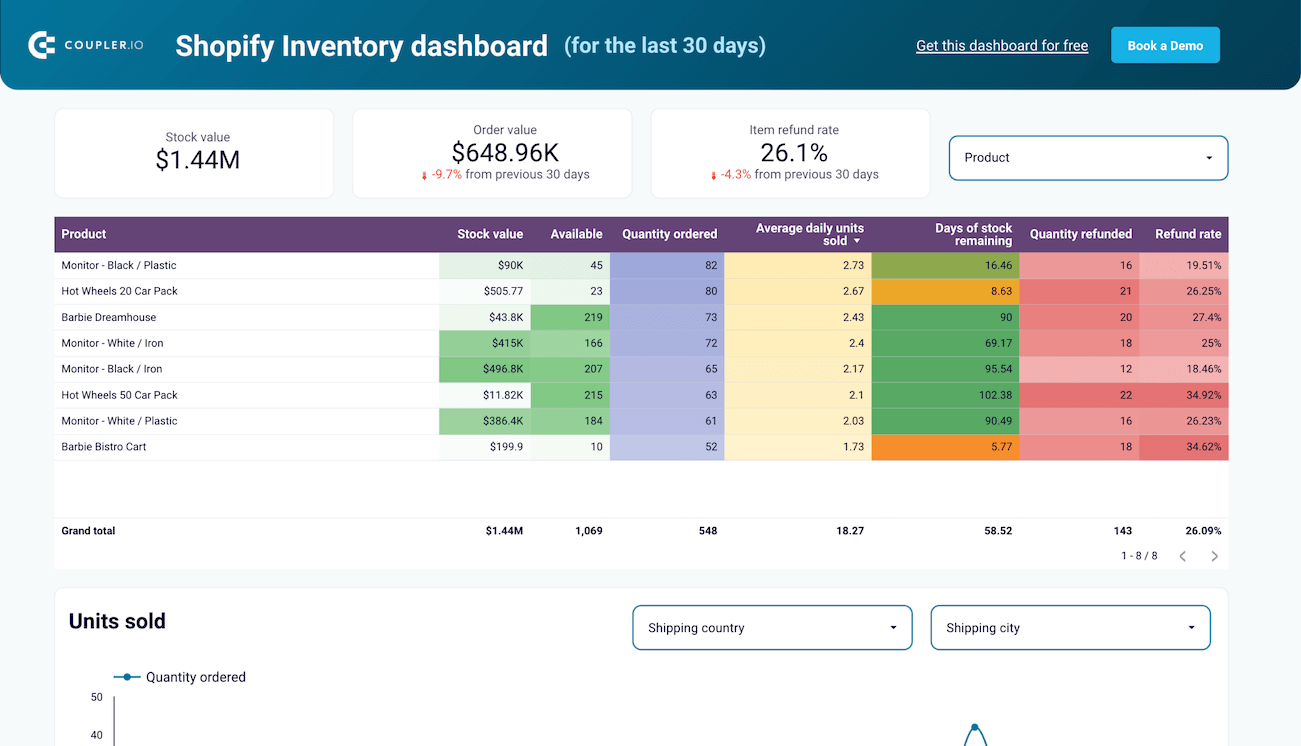
Inventory dashboard for Shopify in Looker Studio
Monitor real-time stock levels across all products with helpful charts and breakdowns to prevent stockouts and optimize reordering processes.
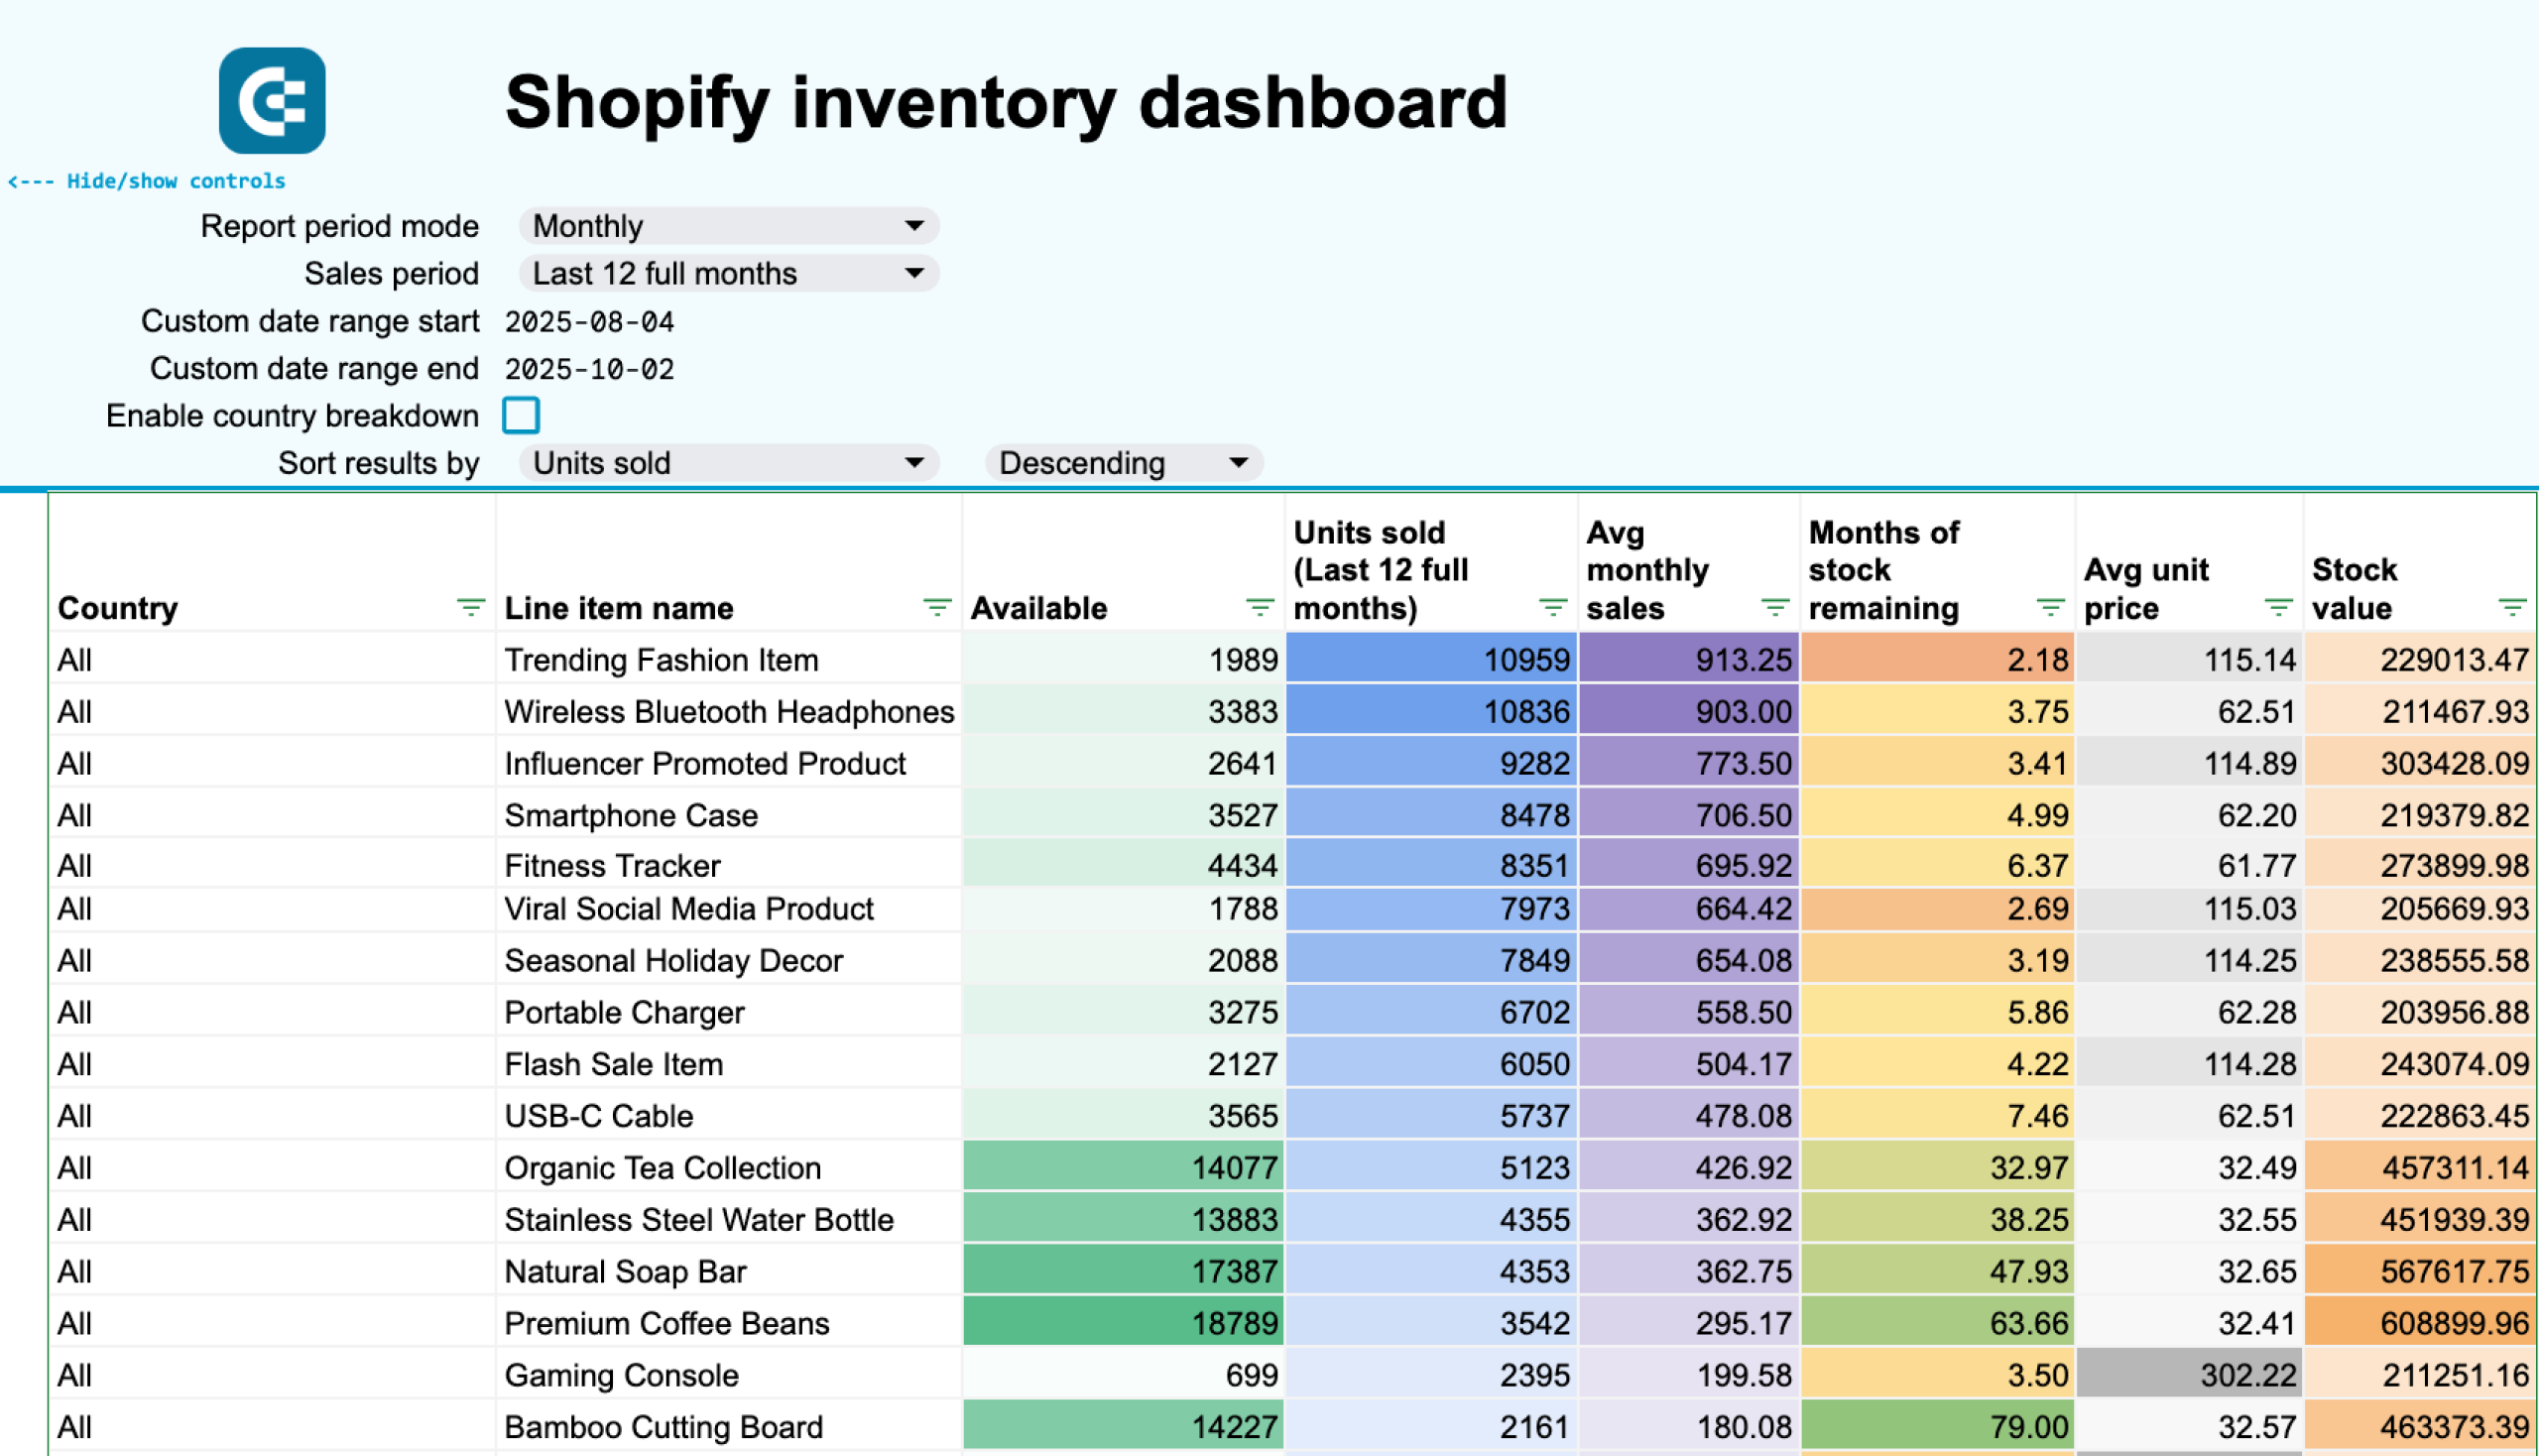
Shopify inventory dashboard in Google Sheets
Prevent stockouts and optimize reorder timing with predictive inventory analytics for your Shopify store. Track stock levels, calculate stockout probabilities, get automated reorder recommendations, and analyze sales patterns by location to maintain optimal inventory across all products.
Marketing funnel dashboard
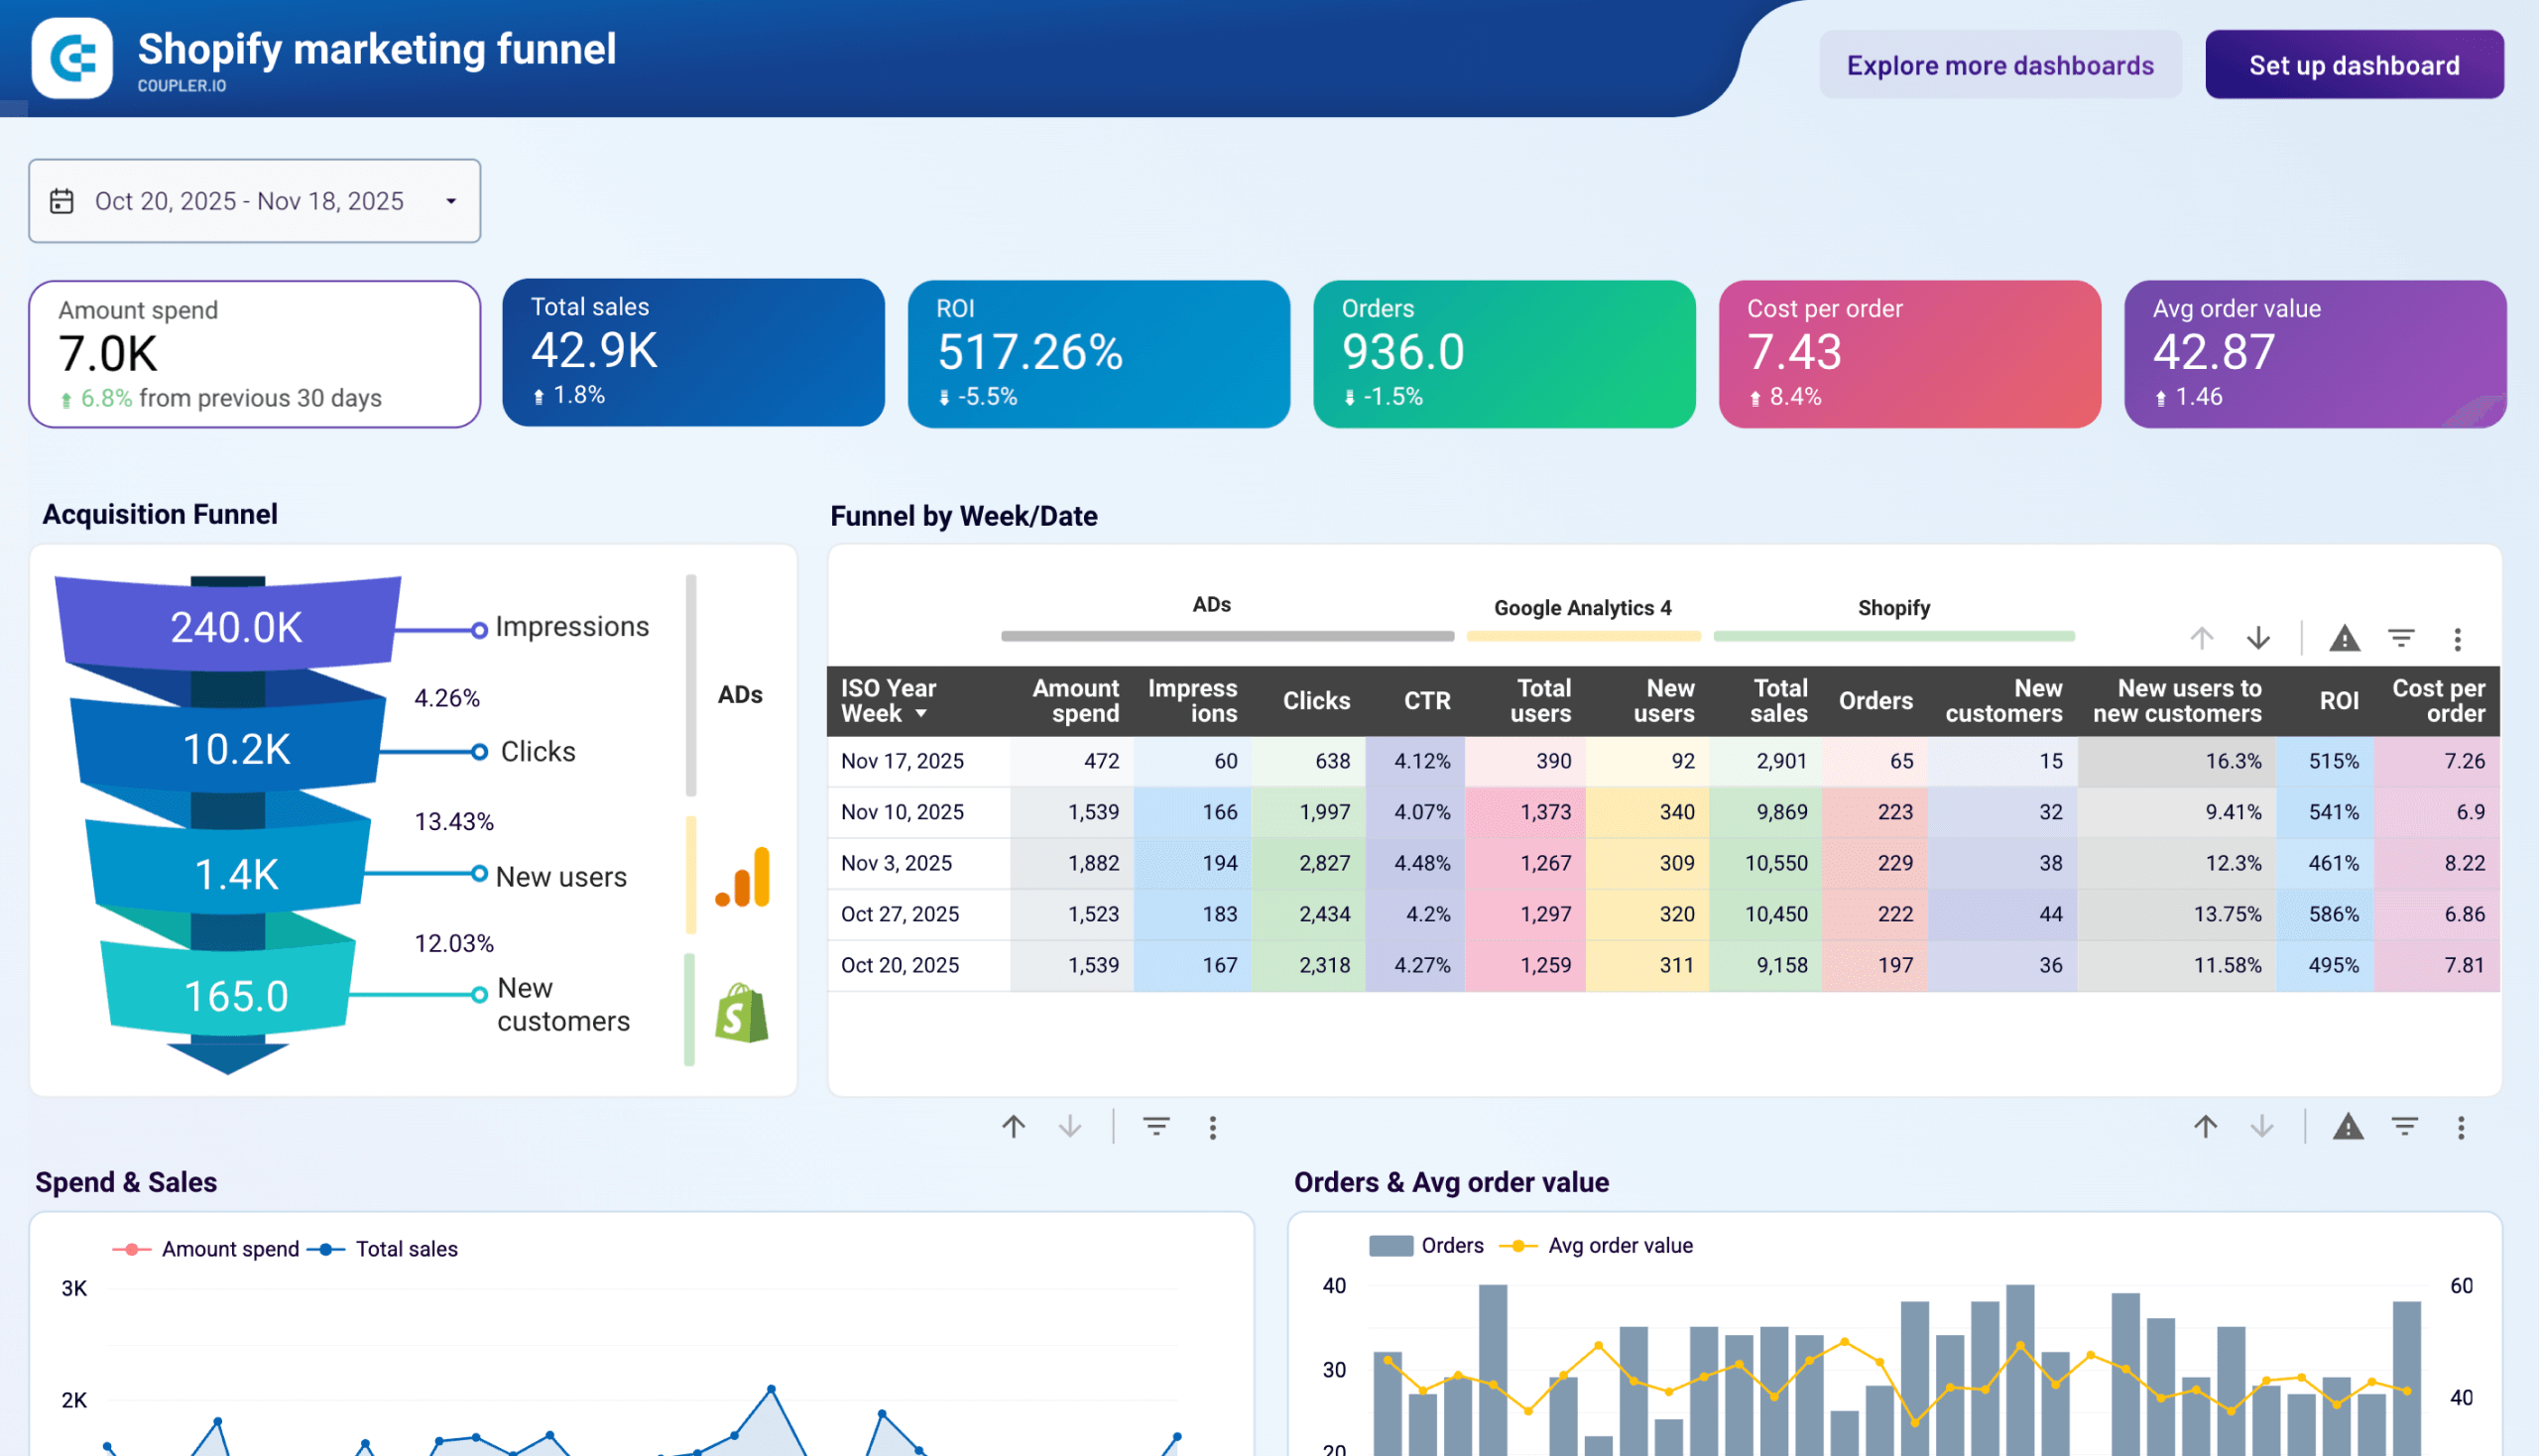
The Shopify marketing funnel dashboard offers a consolidated view of your paid acquisition performance in one place. With automatic data pulls from ads, Google Analytics 4, and Shopify, plus clear funnel visuals, it helps you evaluate campaign efficiency, spot conversion drop-offs, and optimize ad spend.
Marketing funnel dashboard in Looker Studio
 Preview dashboard
Marketing funnel dashboard in Looker Studio
Preview dashboardWhat insights the dashboard provides:
- High-level performance overview: See total spend, sales, ROI, orders, cost per order, and average order value at a glance, with period-over-period change indicators.
- Acquisition funnel breakdown: Track the full journey from impressions → clicks → new users → new customers, including conversion rates and drop-offs at each stage.
- Weekly trends and comparisons: Analyze spend, impressions, CTR, users, sales, orders, new customers, ROI, and cost per order week by week to identify improvements or issues.
- Spend vs. sales correlation: View how ad investment translates into revenue over time to spot mismatches or scaling opportunities.
- Orders and AOV patterns: Monitor order volume and average order value trends to understand customer behavior and revenue quality.
How to use
The Shopify marketing funnel dashboard is available as a template in Looker Studio and PowerBI. This dashboard is powered by the Coupler.io integrations with your ad platforms, Google Analytics 4, and Shopify. After connecting your accounts, data refreshes automatically on the schedule you choose to automate Shopify reporting updates. Follow the Setup guide included in the template, and within minutes, the dashboard will populate with your real data.
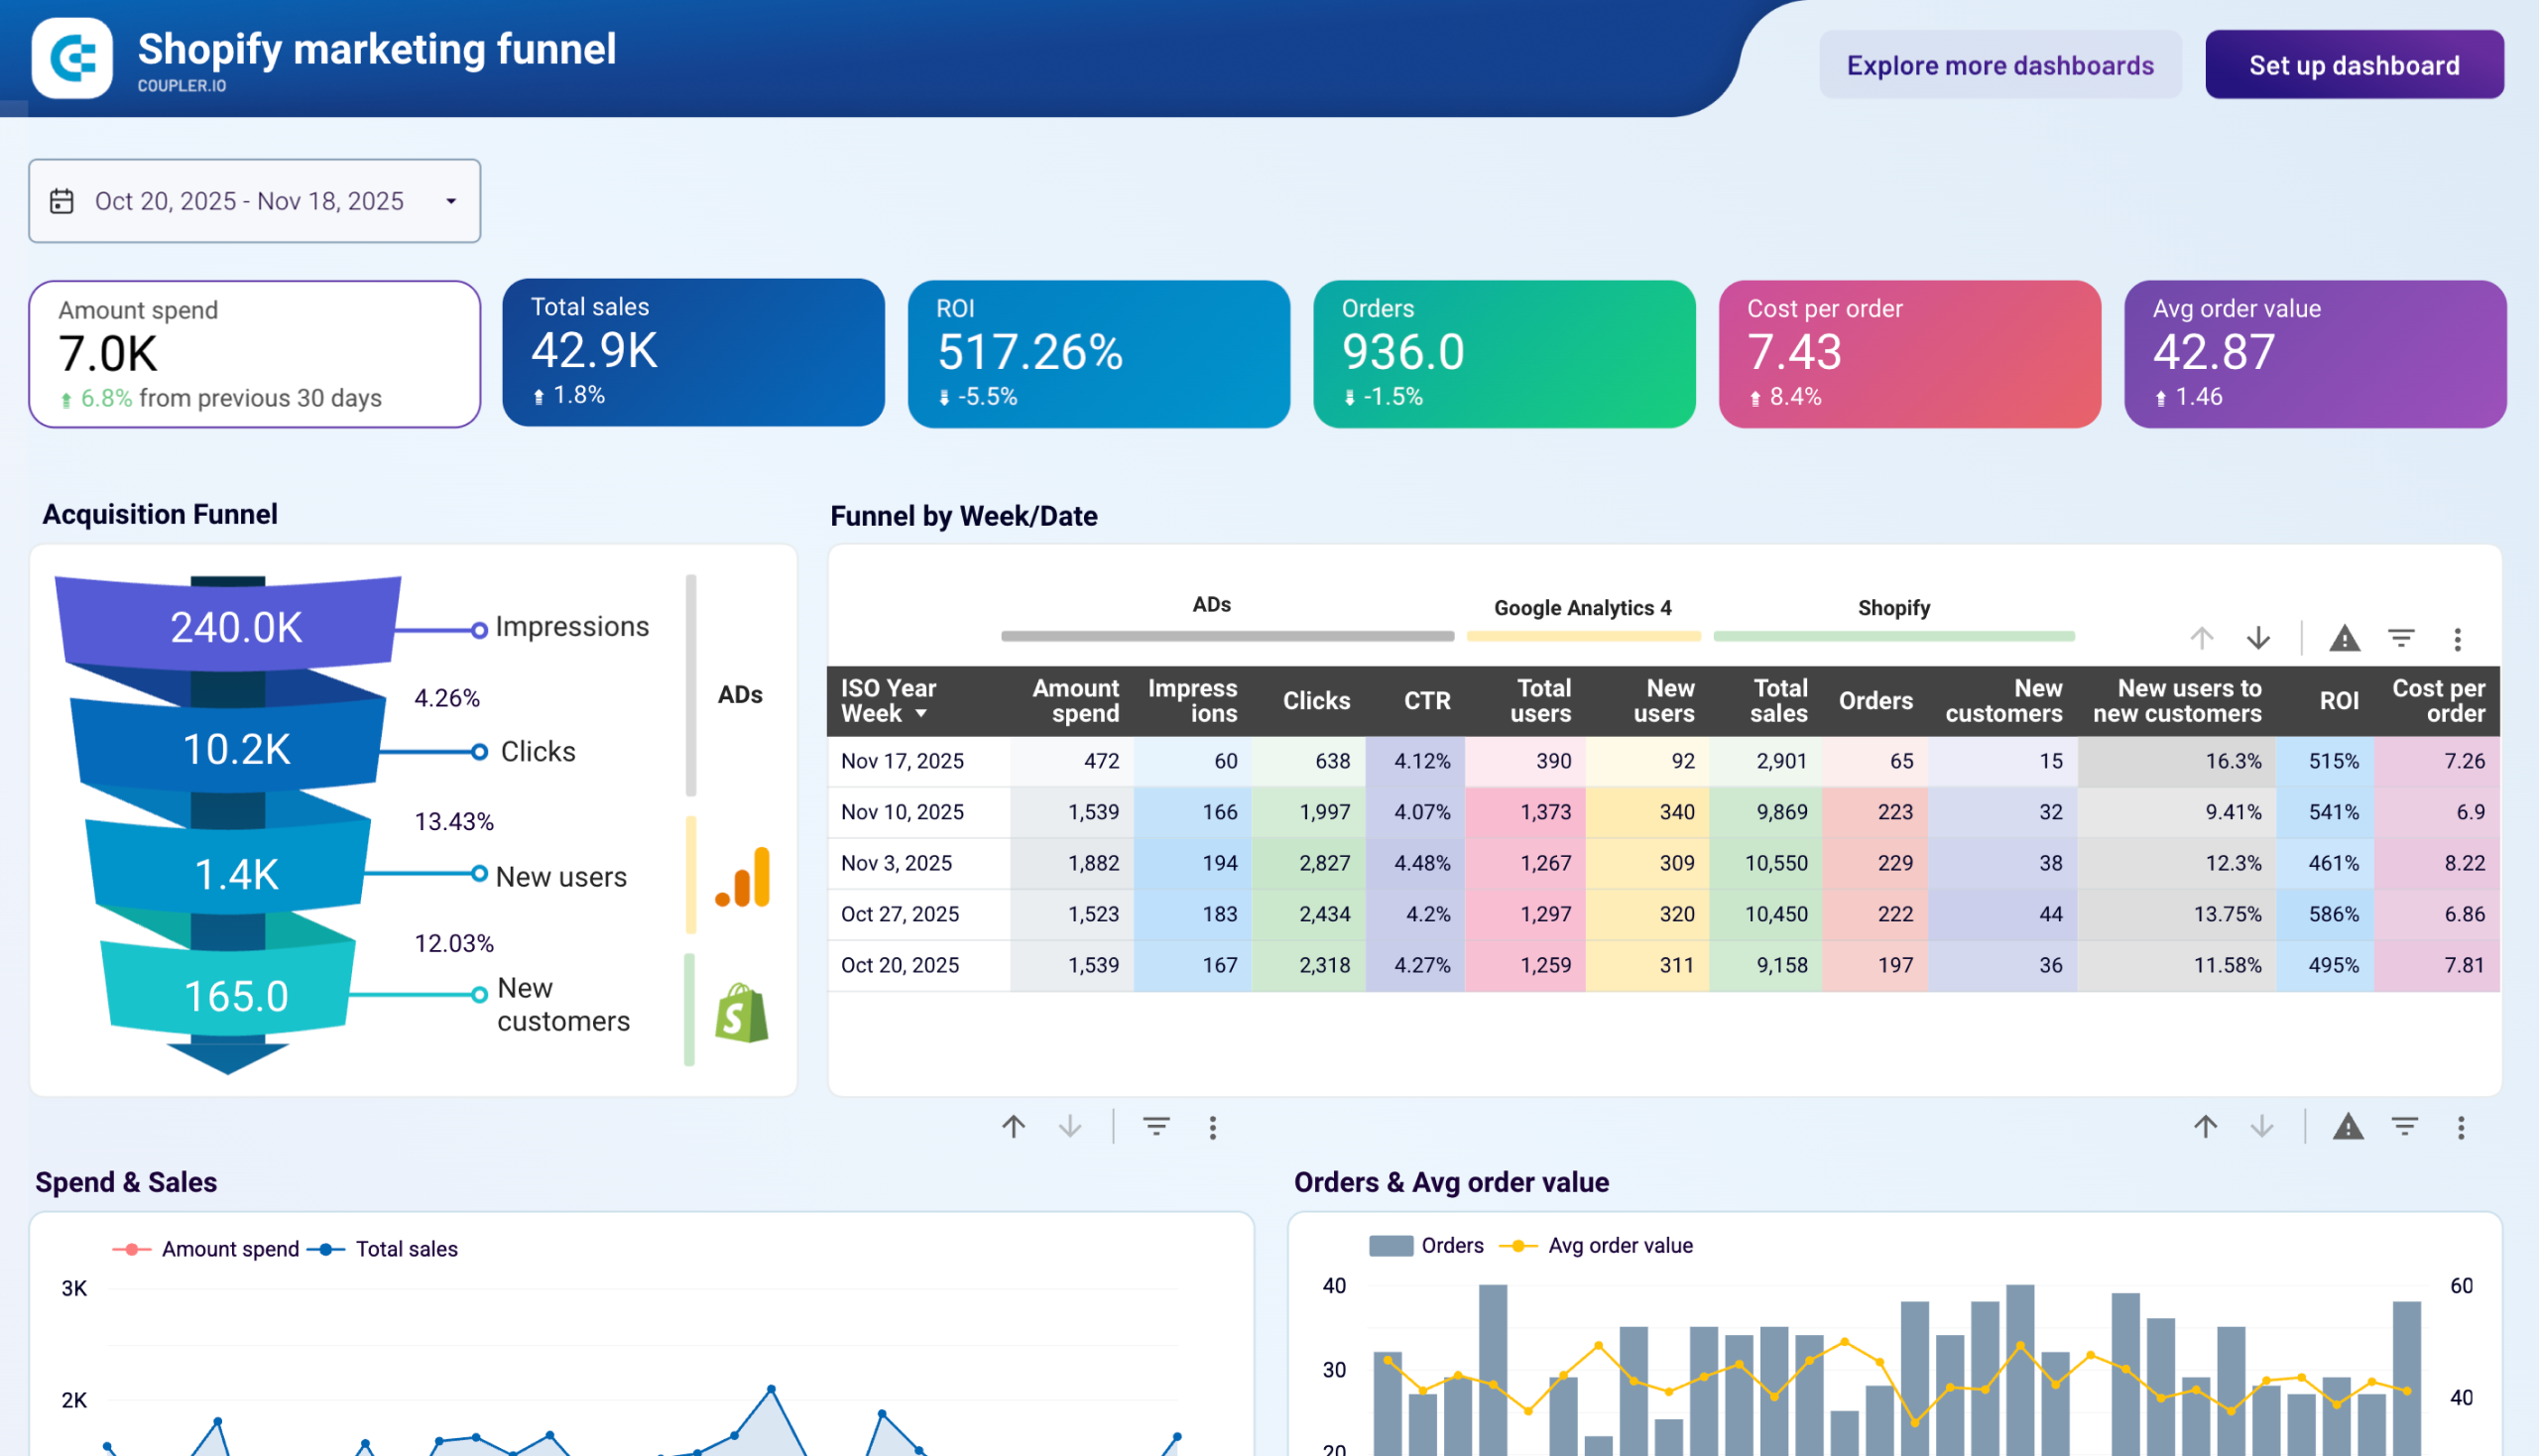
Shopify marketing funnel dashboard in Looker Studio
Analyze the performance of the traffic to your Shopify store using data from advertising platforms and Google Analytics 4, all consolidated on a single dashboard.


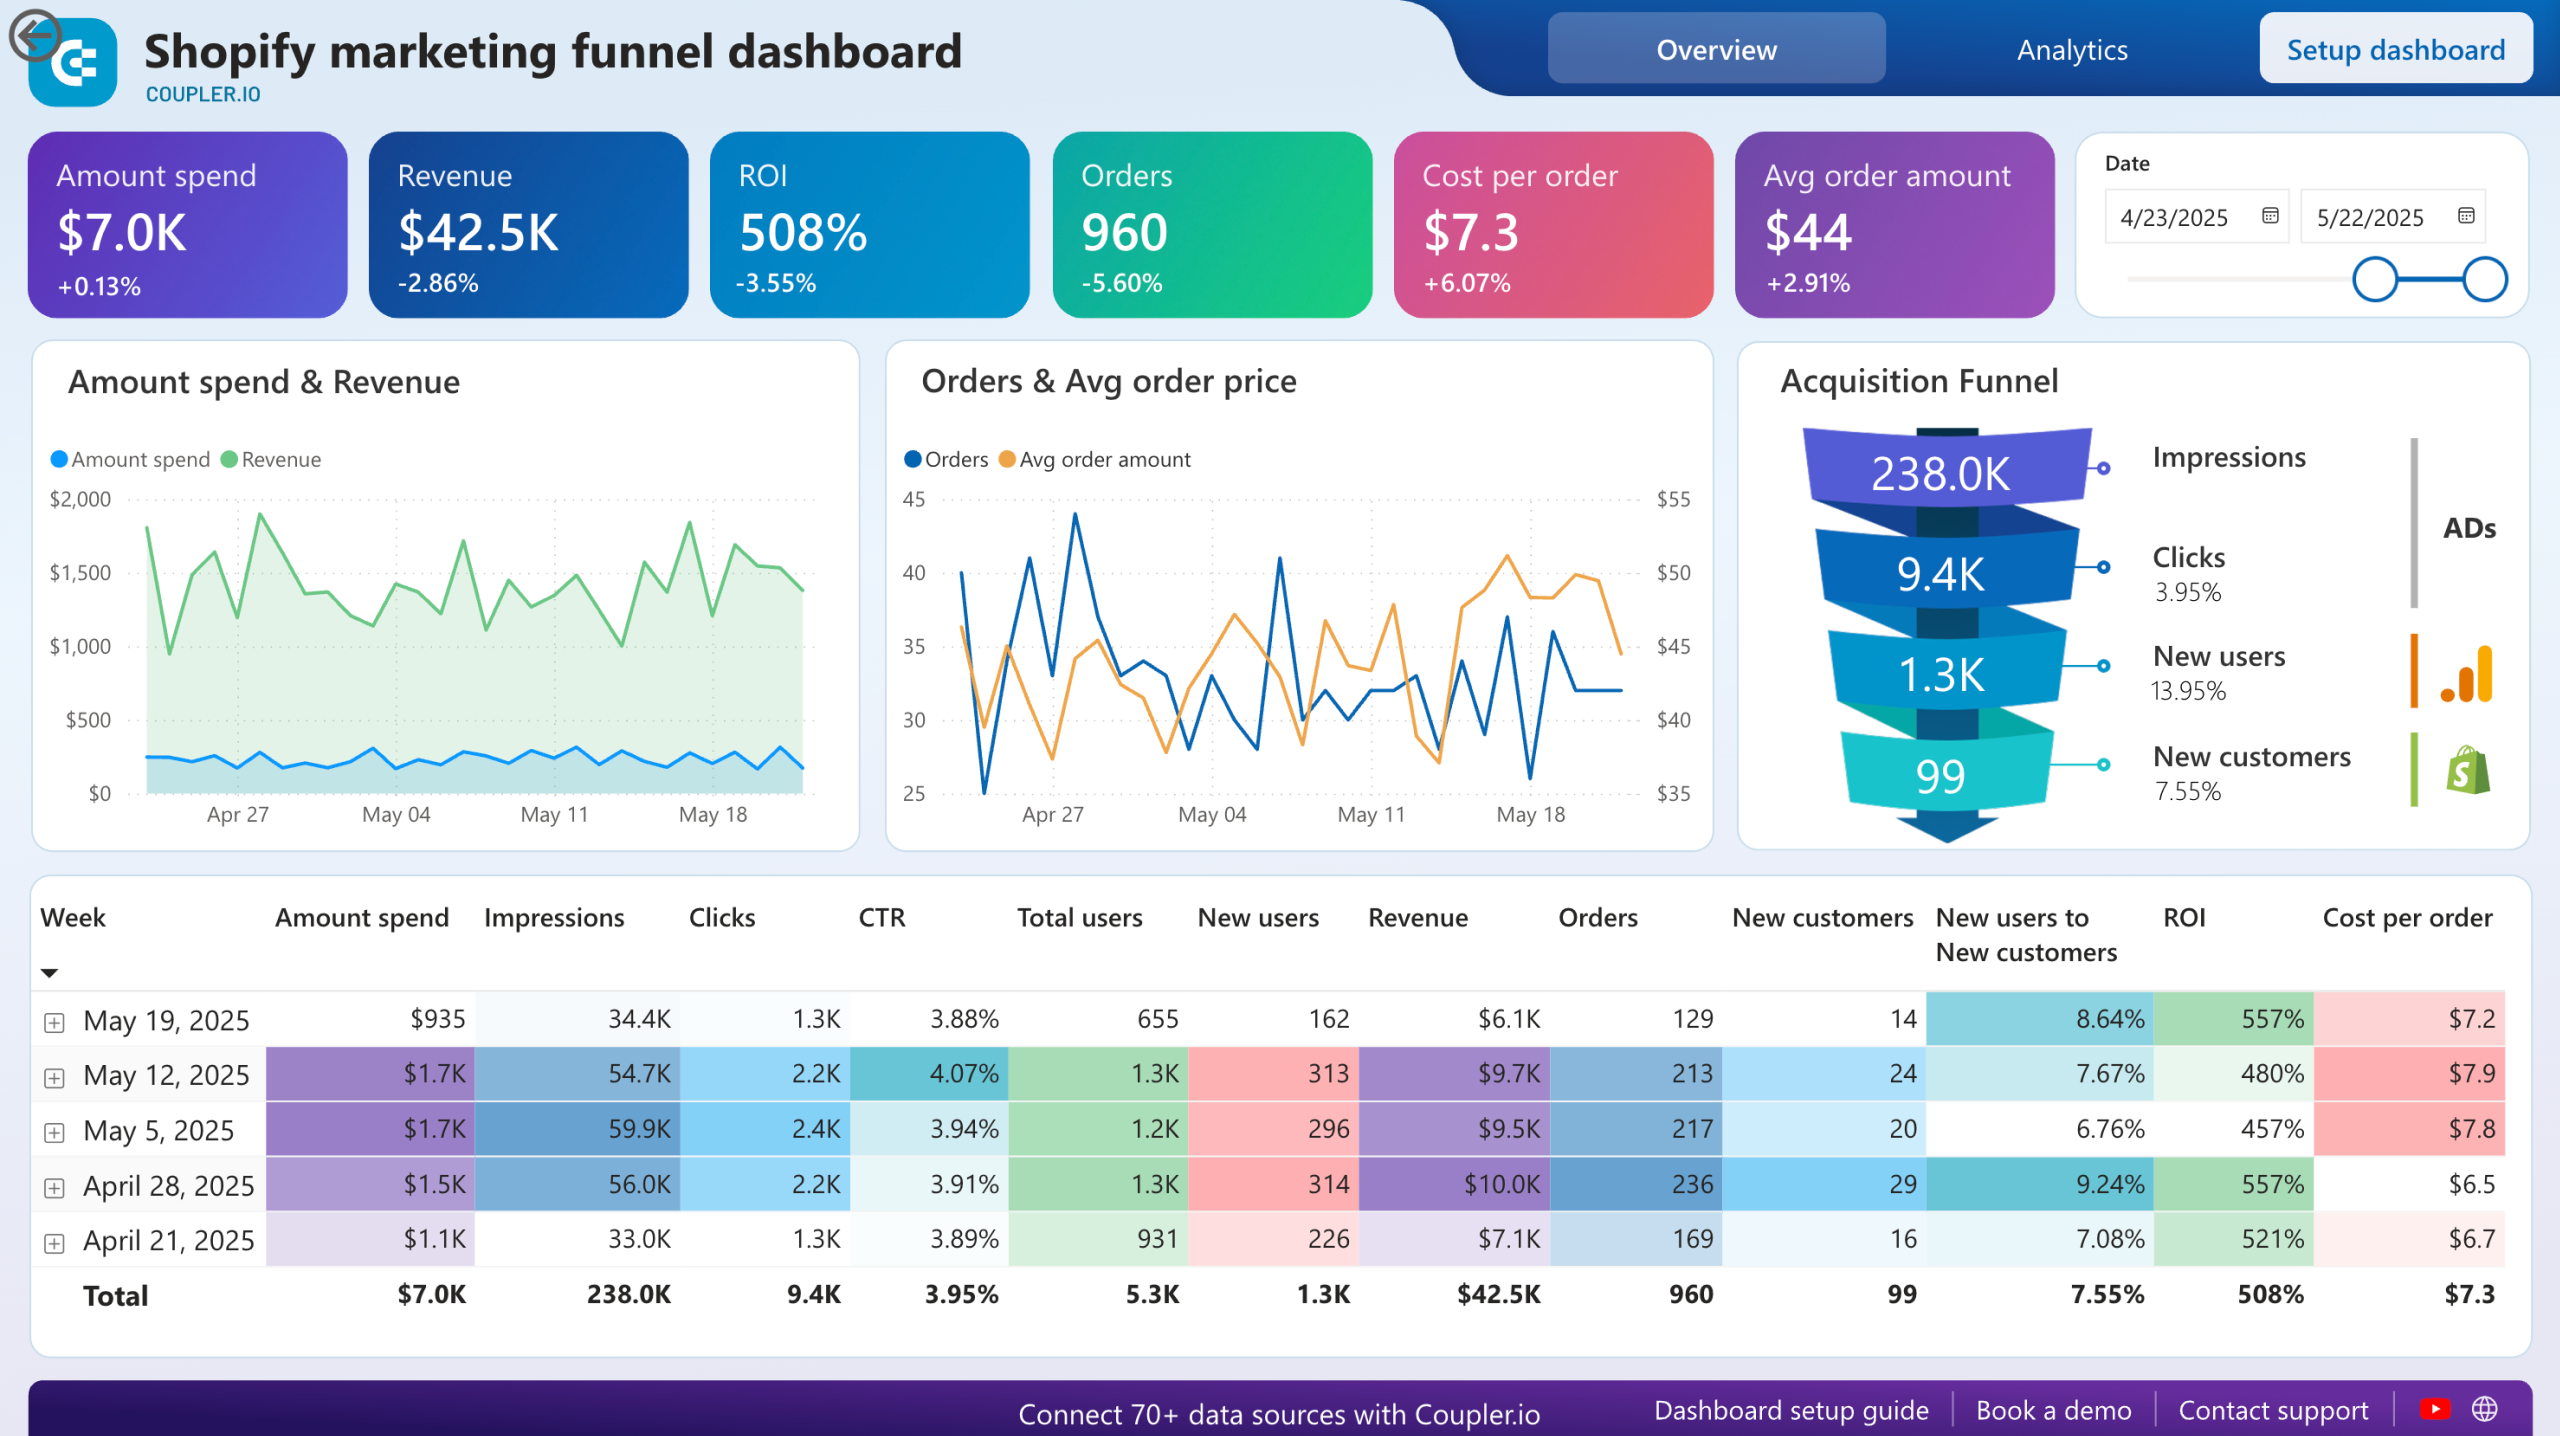
Shopify marketing funnel dashboard in Power BI
Examine the customer journey from advertising exposure to purchase completion with integrated data from your Shopify store, advertising platforms, and analytics tools.


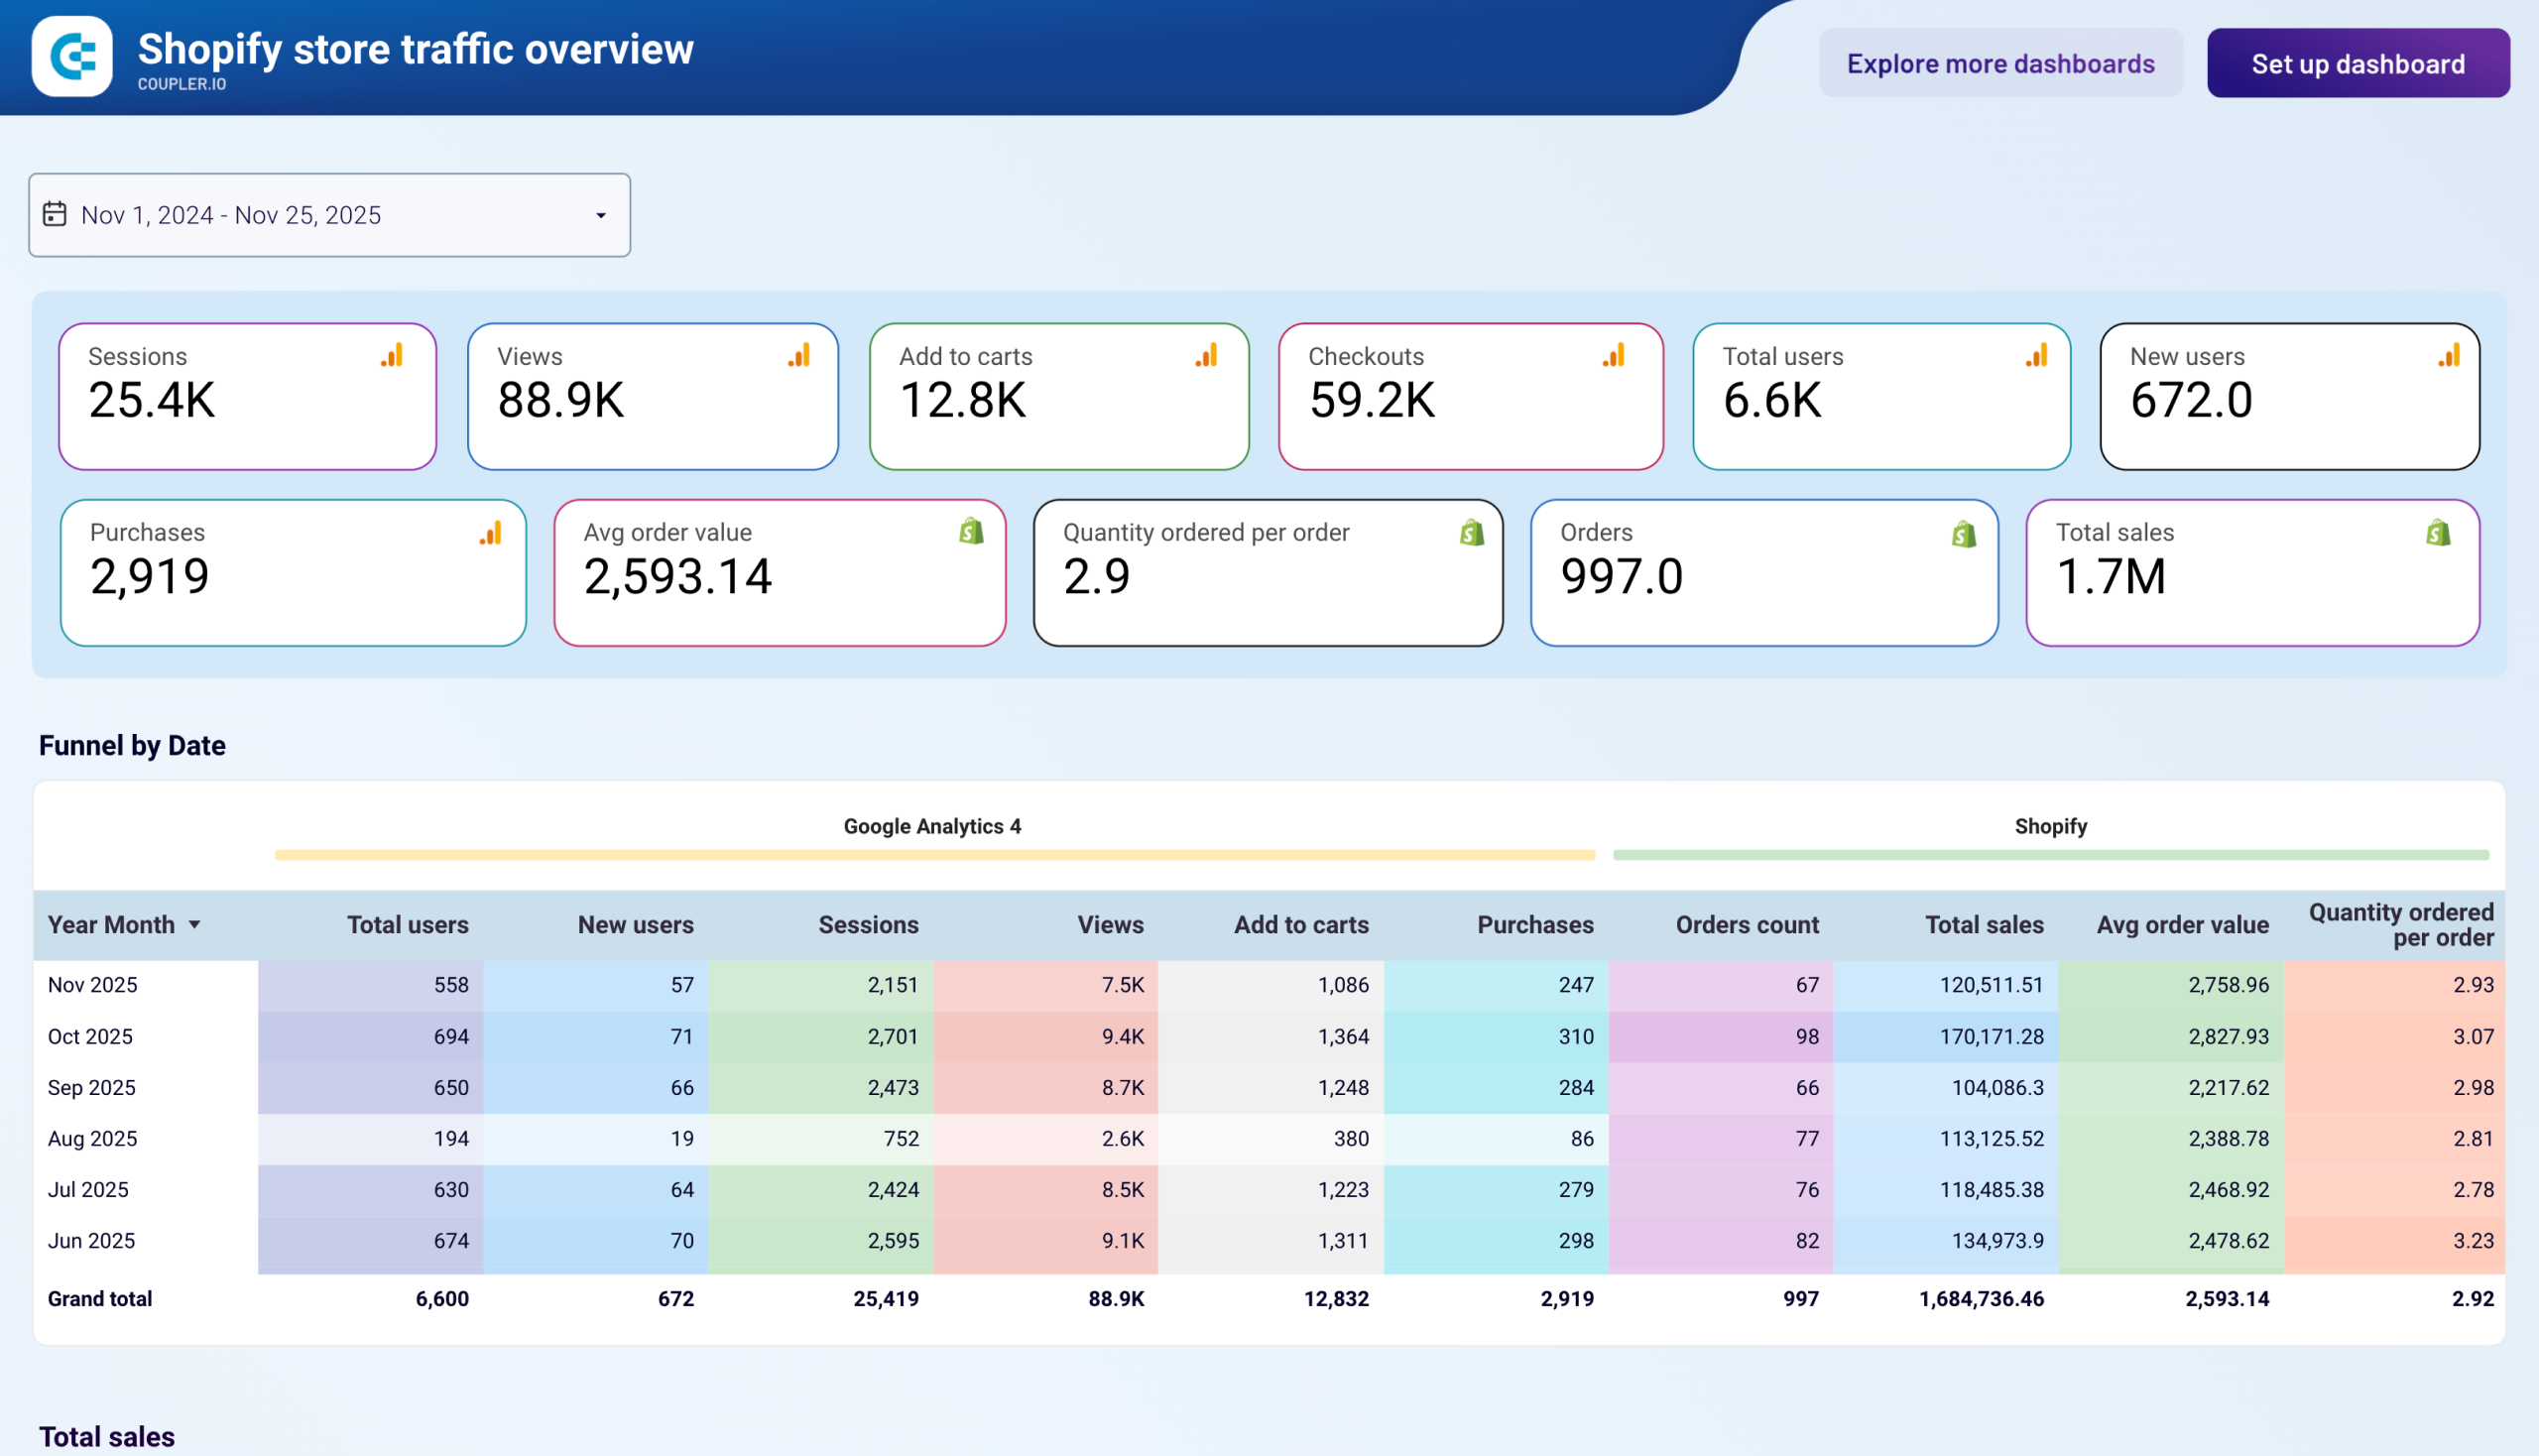
Store traffic dashboard
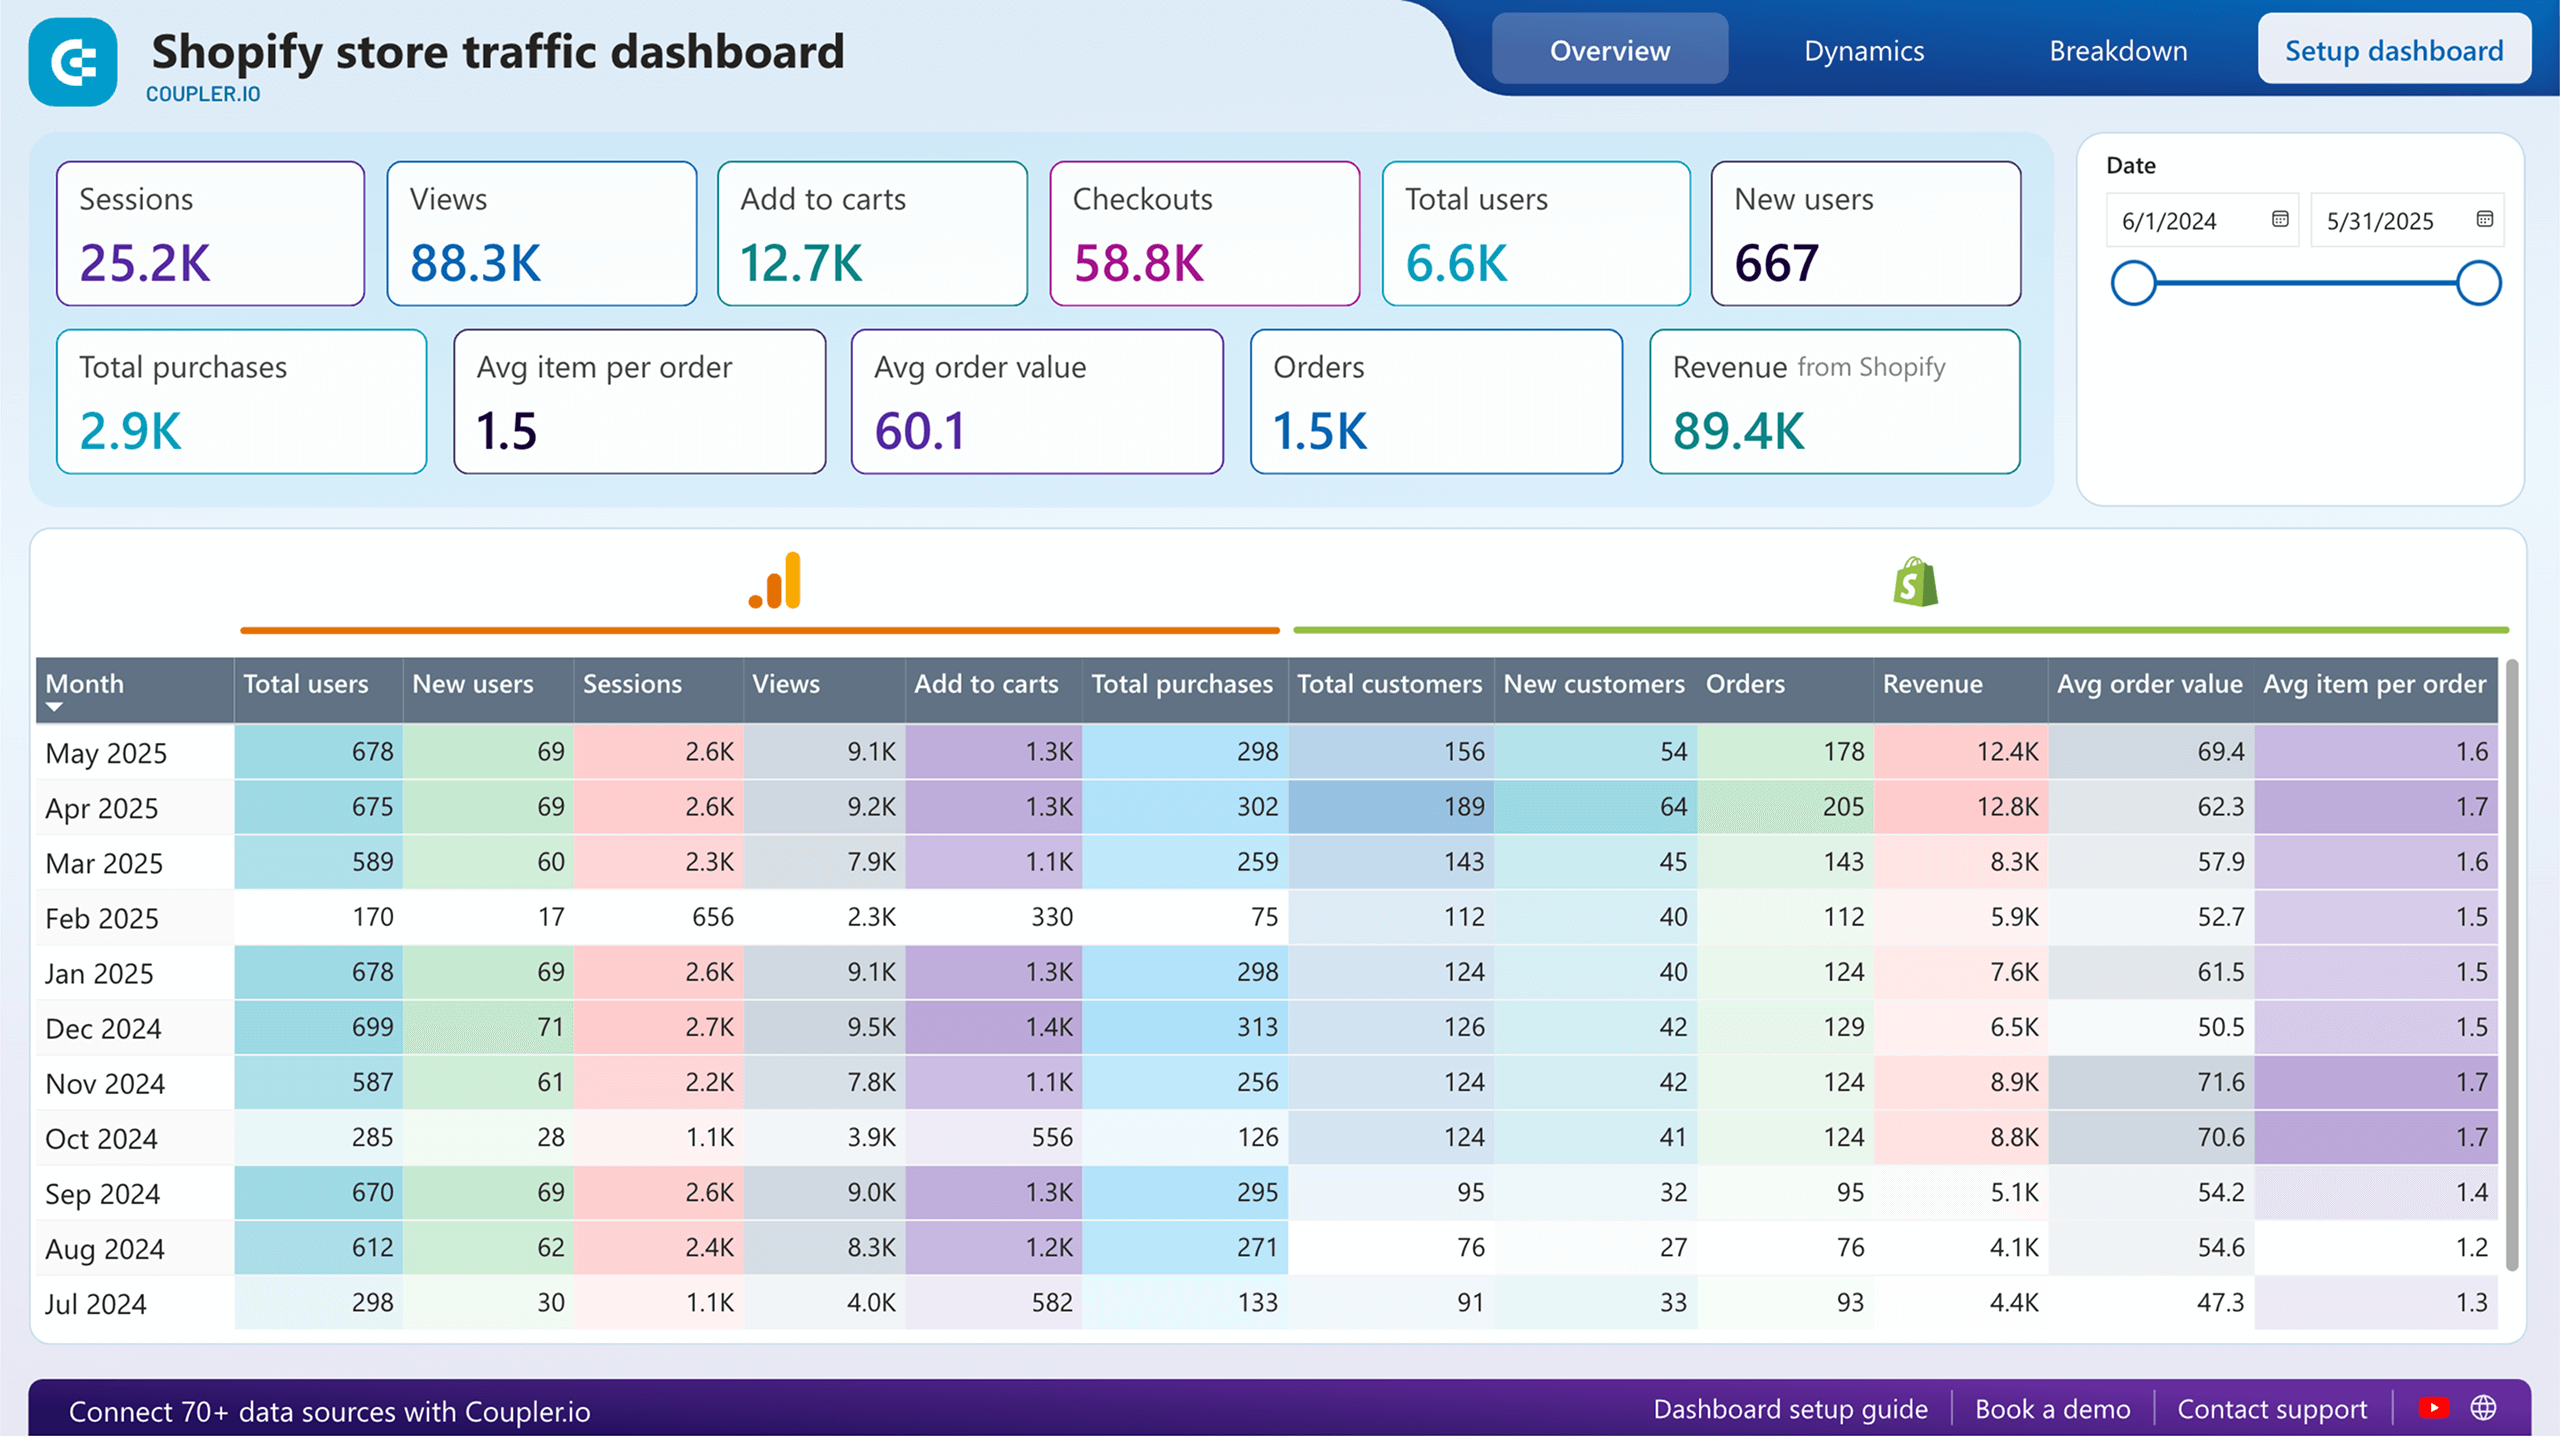
The Shopify store traffic dashboard provides a comprehensive view of your store’s visitor behavior and conversion performance in one place. With automatic data pulls from Shopify and structured visuals across Overview, Dynamics, and Breakdown tabs, it helps you monitor traffic quality, track user engagement trends, and identify conversion bottlenecks.
Shopify store traffic dashboard in Power BI
 Preview dashboard
Shopify store traffic dashboard in Power BI
Preview dashboardWhat insights the dashboard provides:
- High-level traffic and conversion overview: View total sessions, page views, add to carts, checkouts, total users, new users, total purchases, orders, revenue, average order value, and average items per order at a glance for the selected date range.
- Monthly traffic and behavior trends: Analyze how users, sessions, views, add to carts, purchases, new customers, orders, revenue, AOV, and items per order evolve month by month to spot growth patterns, seasonal changes, or declines.
- User acquisition patterns: Track total users vs. new users over time to understand reliance on new traffic and repeat visitor contribution.
- Conversion funnel signals: Monitor progression from sessions and views through add to carts and checkouts to actual orders and revenue, highlighting potential drop-off points in the shopping journey.
- Revenue and order quality metrics: Follow trends in orders, average order value, and items per order to assess customer spending behavior and order profitability over months.
How to use
This Shopify store traffic dashboard is available as a template in Looker Studio and Power BI. Connect your Shopify account once, set the refresh interval you want, then use the included Setup guide to have your data loaded and ready in minutes.
Shopify store traffic dashboard in Looker Studio
Get an overview of the traffic coming to your Shopify store based on information from Google Analytics 4.
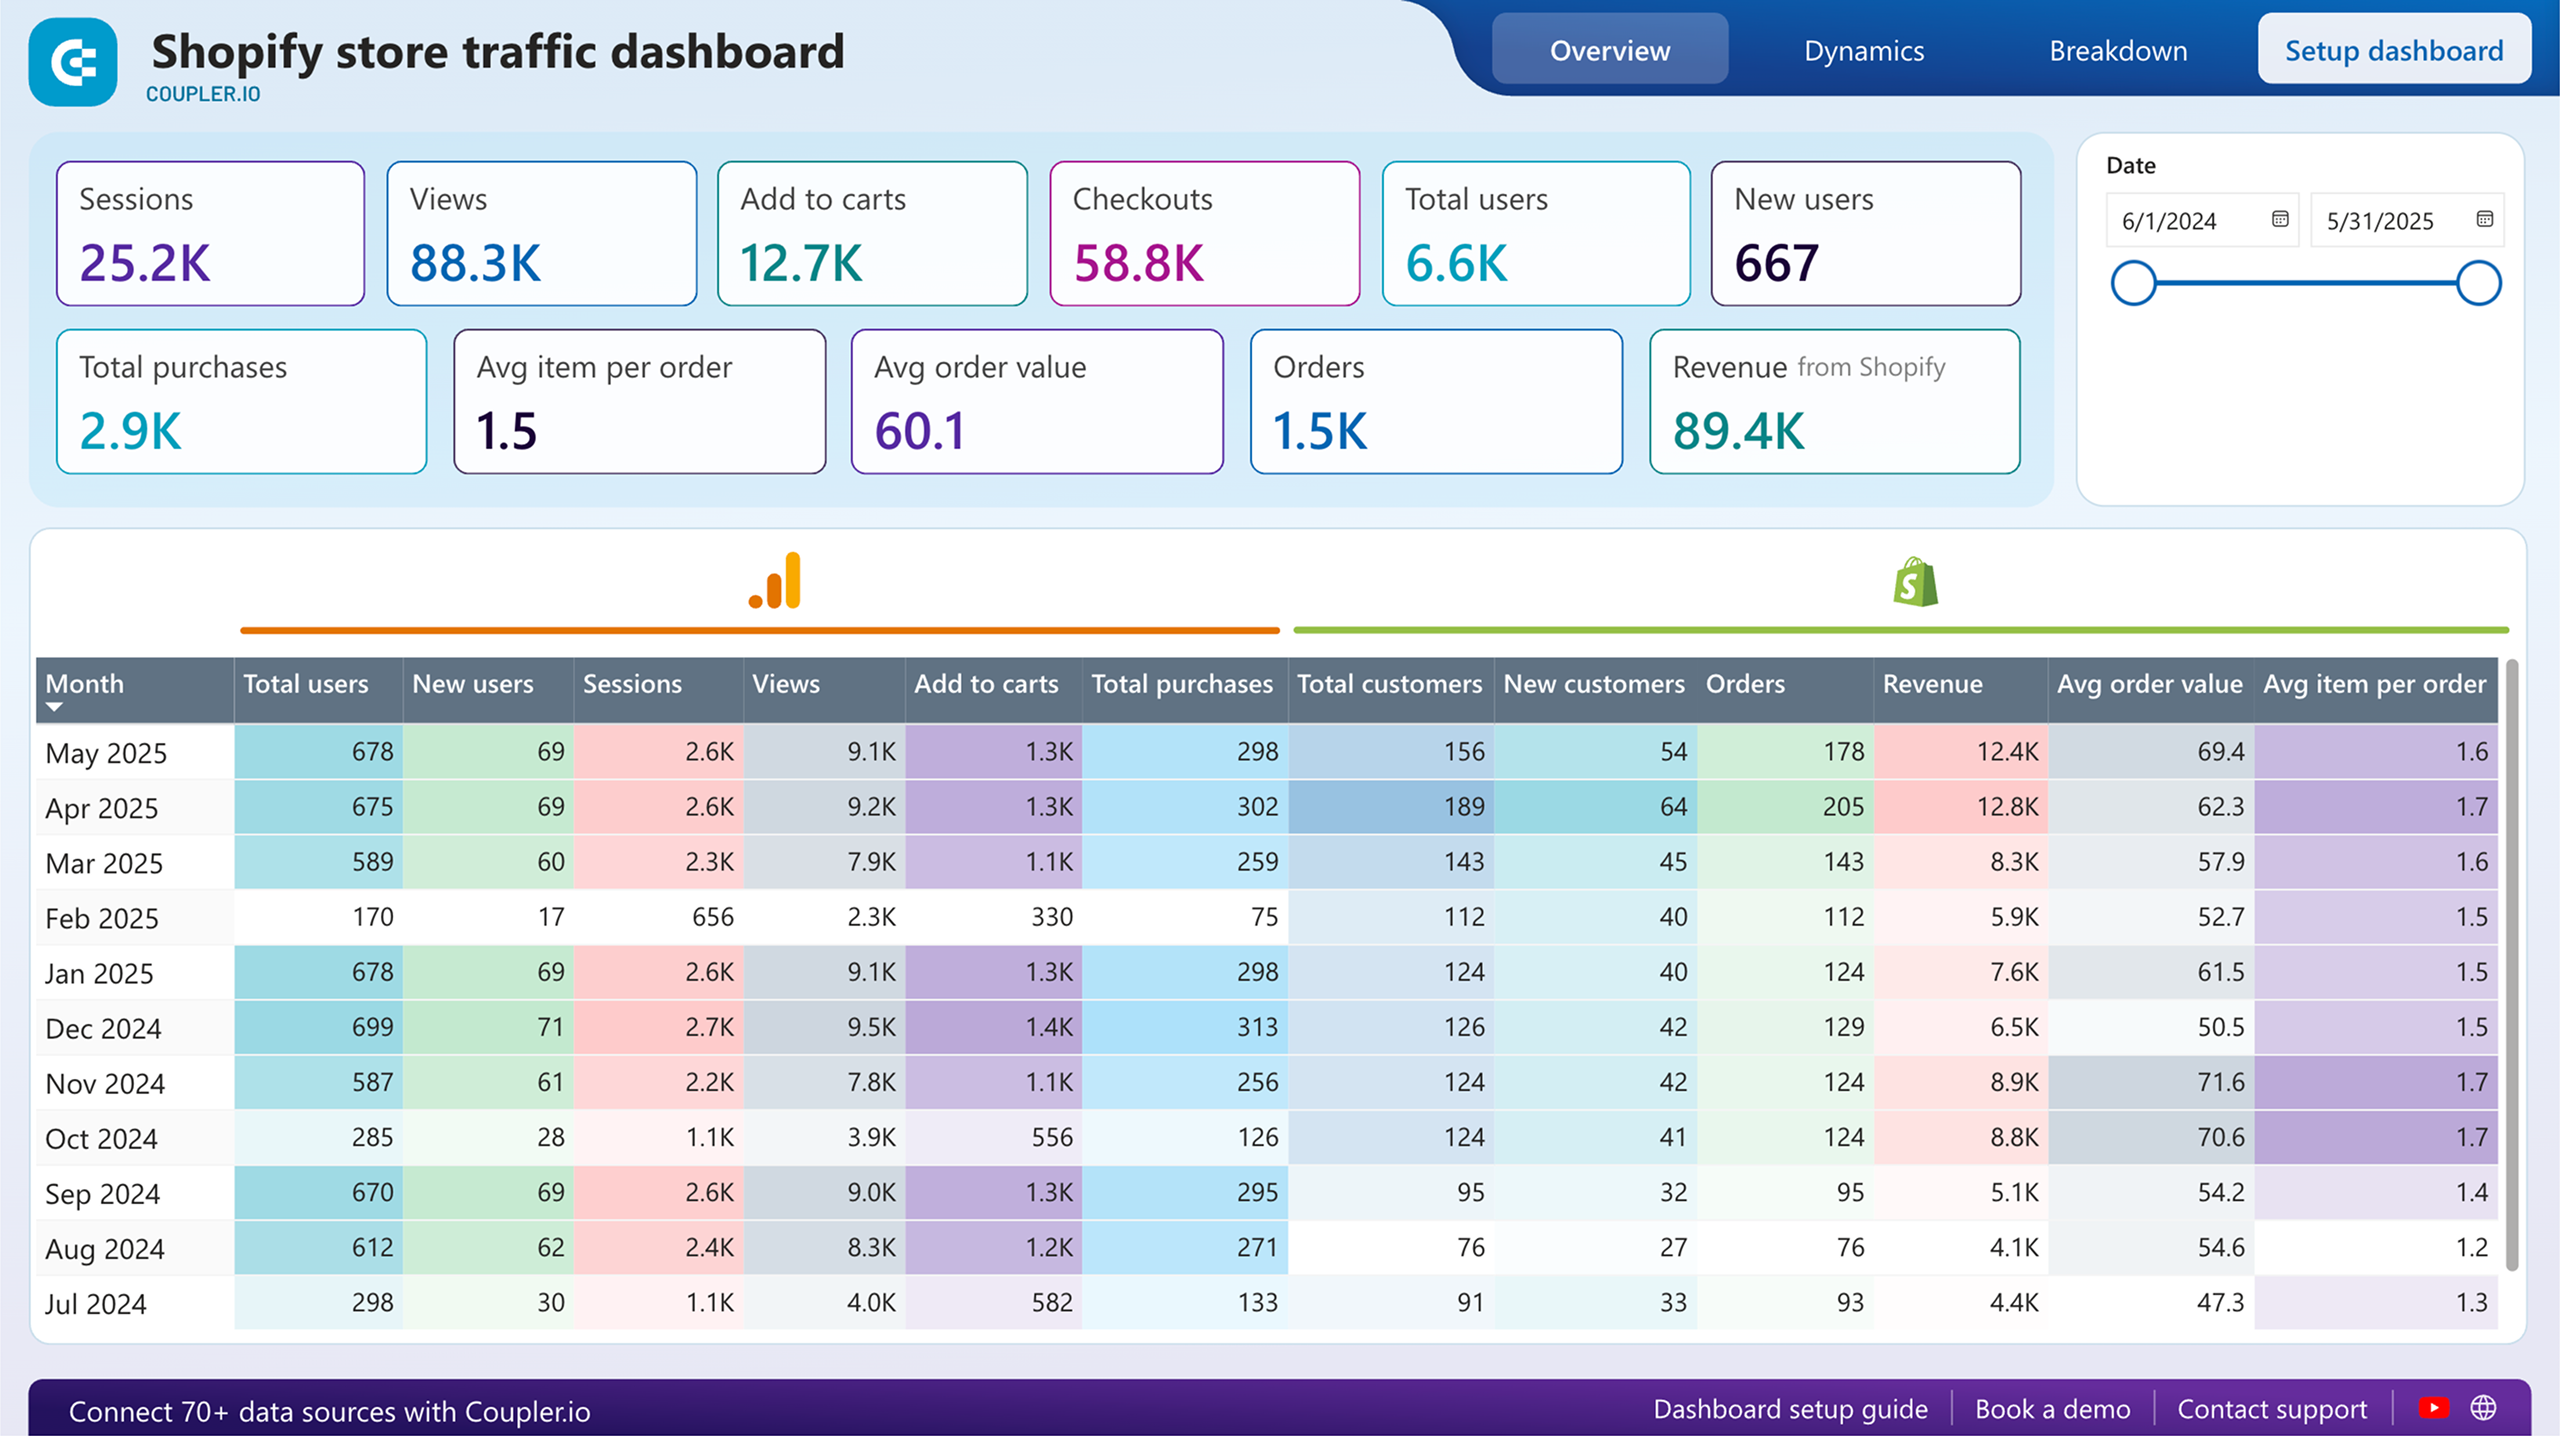
Shopify store traffic dashboard in Power BI
Analyze users’ behavior and conversion pathways for your Shopify store with integrated traffic analytics and sales performance metrics.
Why Shopify’s native reports often fall short for growing stores
Shopify provides a solid set of built-in reports that cover the basics. For small stores or quick check-ins, they’re often enough. But as your business grows and decisions become more data-driven, many Shopify users start to notice clear limitations in native reporting.
Below are the most common challenges merchants and analysts face when they rely solely on Shopify’s built-in reports, and how automation with Coupler.io addresses these issues.
- Limited data depth and granularity: Shopify’s built-in reports only show high-level numbers like total revenue, overall orders, and top products. Filters are pretty basic, and you can’t easily dig into things like customer cohorts (how groups of buyers behave over time), performance by individual SKU, or advanced breakdowns of customer segments.
- No real-time or automated reporting: Reports only update once a day, and there’s no built-in way to schedule automatic exports or get them delivered. During busy times like sales or promotions, the data already feels outdated, and your team ends up manually logging in and downloading files over and over.
- Limited access to historical data: On standard Shopify plans, older data gets hard (or impossible) to access after a while. That makes it tough to compare year-over-year trends, spot seasonal patterns, track customer retention, or build solid forecasts.
- Customization and export constraints: The dashboards and reports are locked into Shopify’s default setup and metrics. If you need something different, you have to export, but exports often have row limits, messy formatting, and require a bunch of manual cleanup before you can even start analyzing.
- Friction caused by recent analytics changes: Shopify’s recent updates to analytics have frustrated a lot of merchants: key reports got buried, moved, or removed; some fields and historical details became hidden or harder to find; extra clicks piled up; and familiar workflows got disrupted.
- No unified view of multi-channel data: Native analytics only covers Shopify sales. If you’re selling on Amazon, Etsy, eBay, in-person via POS, or other platforms, there’s no native way to combine everything. Each channel stays in its own separate bubble unless you stitch it together manually.
Alternative ways to automate Shopify reports
Shopify provides several options for automating reports through third-party applications available in the Shopify App Store. These tools enable merchants to schedule, generate, and deliver predefined or custom reports to destinations such as email, Google Sheets, or cloud storage.
While Shopify’s native analytics include standard dashboards and limited scheduling capabilities, more advanced automation, such as recurring schedules, customized exports, and flexible delivery formats, is typically handled through external reporting applications.
Common report automation tools available in the Shopify App Store include:
| App name | Description | Rating | Number of reviews |
| EZ Exporter: Data Exports | Focuses on scheduled exports of store data to CSV or Excel with delivery to email, FTP, or cloud services. Features Python-based calculated fields for data manipulation. | ⭐ 5.0/5 | 120 |
| Reportgenix | AI-assisted report creation with dashboards, scheduled exports, charting, and Slack integration. Features Genix AI for smart insights and 100+ prebuilt reports. | ⭐ 5.0/5 | 51 |
| Report Pundit: Custom Reports | Advanced custom reporting tool with 150+ prebuilt reports. Analyze order, sales, tax, payout, inventory, fulfillment, and customer behavior reports. Integrates with 30+ payment, shipping, and marketing apps. | ⭐ 4.9/5 | 1,708 |
| BR: Better Reports | Premium reporting & analytics tool offering custom metrics, in-depth data exploration, and scheduled report delivery via email or Google Sheets. Features pivot table-like functionality. | ⭐ 4.9/5 | 1,100 |
| Report Toaster: Custom Reports | Real-time reporting with calculated fields, automated delivery across multiple channels. Features 120+ report templates and multi-store support. | ⭐ 4.9/5 | 191 |


