How to Connect Google Sheets to Google Data Studio (Looker Studio)

Whether you are running an online store, launching marketing campaigns, or keeping track of customer success metrics, it’s essential to analyze the data accumulated by your team. While having your information in a spreadsheet has many benefits, transferring it to a Looker Studio dashboard unlocks a lot of new possibilities.
Visualized data is easier to work with, and having a comprehensive auto-updating dashboard is a great way to have a complete overview of your projects or processes in one place.
In this article, we will explore different ways to connect Google Sheets to Google Data Studio (Looker Studio) and turn your data into compelling visual stories.
How can you link Google Sheets to Google Data Studio (Looker Studio)?
There are two main ways to connect the two apps:
- Native method. As Google Sheets and Looker Studio are both Google products, they can be connected with their native functionality. The main advantage of this method is that it’s both simple and free.
- Using third-party solutions. You can connect Google Sheets to Looker Studio with the help of other apps. Even though adding one more link might seem like an unnecessary in-between step, that’s not quite so. Depending on the solution you choose, you might get access to a much richer functionality, like flexible scheduling settings, transforming your data before visualizing it, and blending datasets from multiple sources prior to loading them to Looker Studio. The latter can be very useful for optimizing performance – it’s well-known that Looker Studio can get slow if it needs to process data before visualizing it, especially if you have multiple apps connected to your dashboard. Third-party solutions can help solve this problem.
Now, let’s explore each of these methods in more detail.
How to use Google Sheets as a data source for Looker Studio – native method
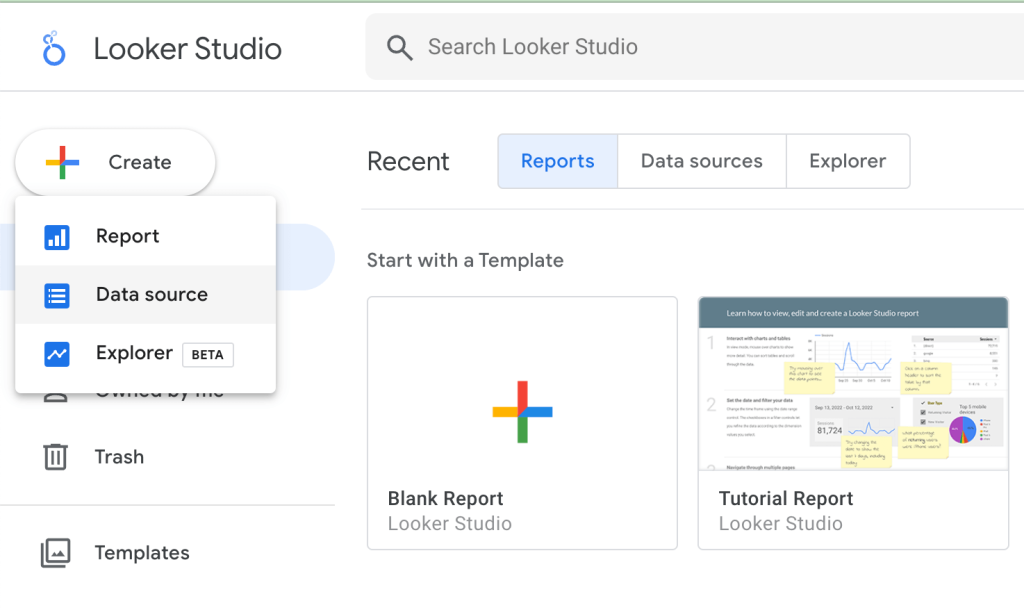
- First, log in to your Looker Studio account. Then, press Create -> Data source.
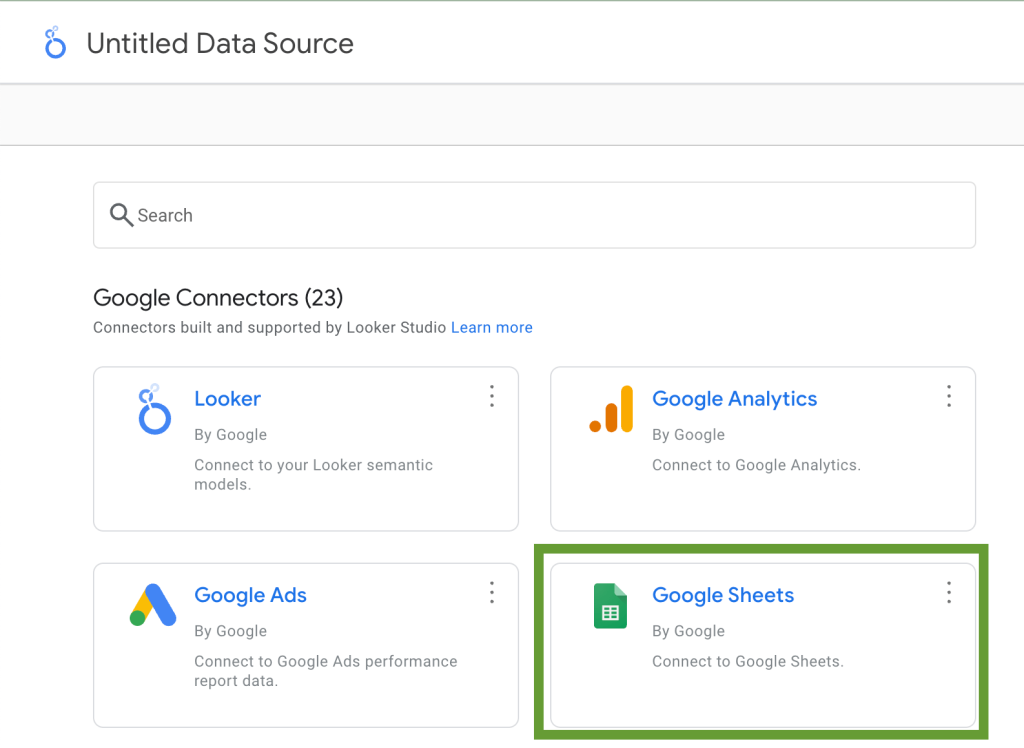
- You will be redirected to the page with listed data sources options. Select Google Sheets and click Connect.
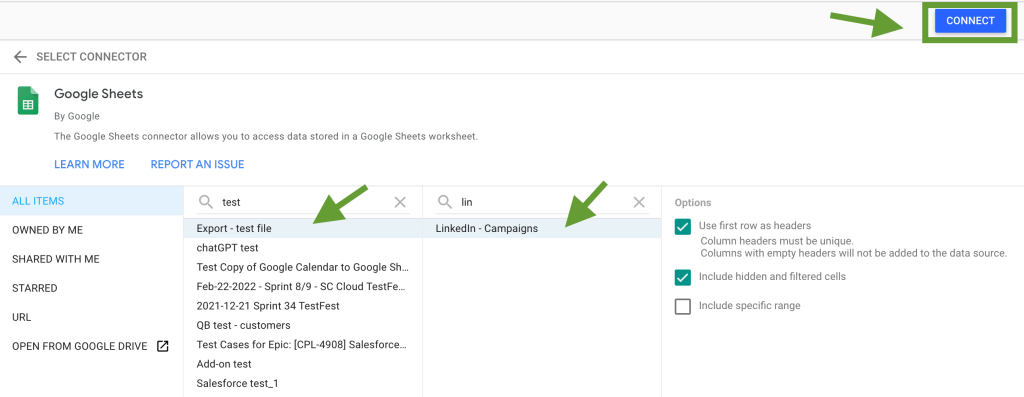
- In the next step, select the worksheet with the data you want to visualize. You can use the search bar to find it faster.
- Next, specify what sheet you want to connect to Looker Studio.
- You can also select some additional settings. For example, you can choose to only include a specific range of columns if you don’t need to transfer all the data on the sheet.
Once this is done, click Connect.
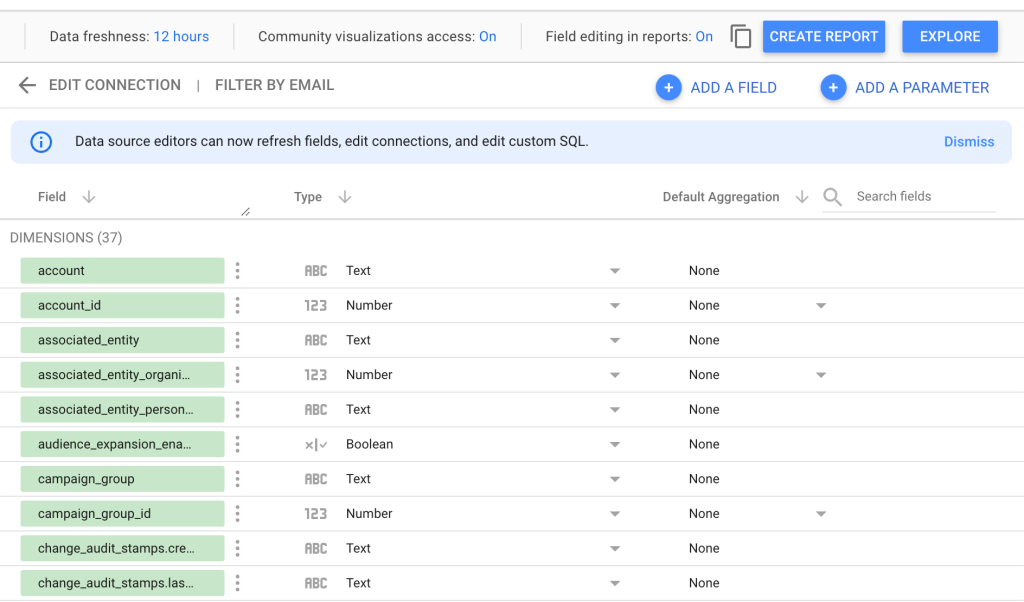
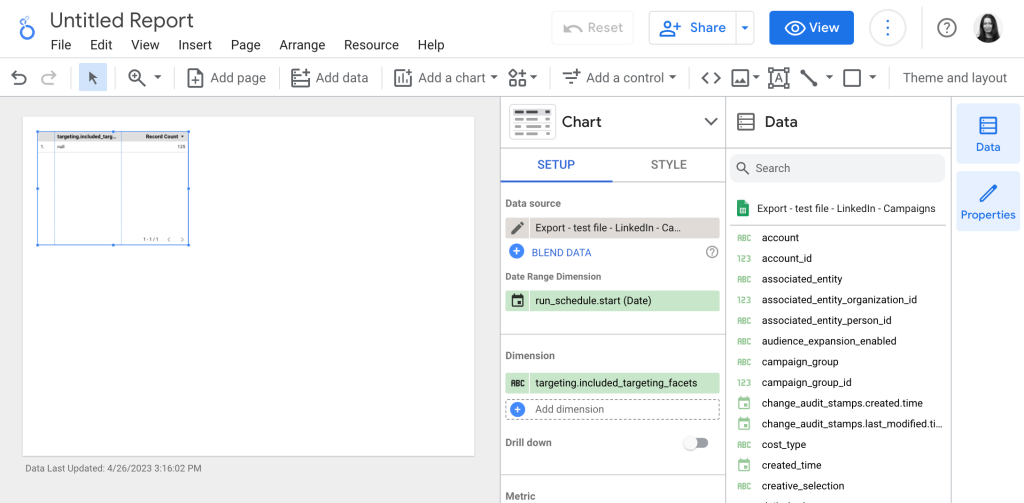
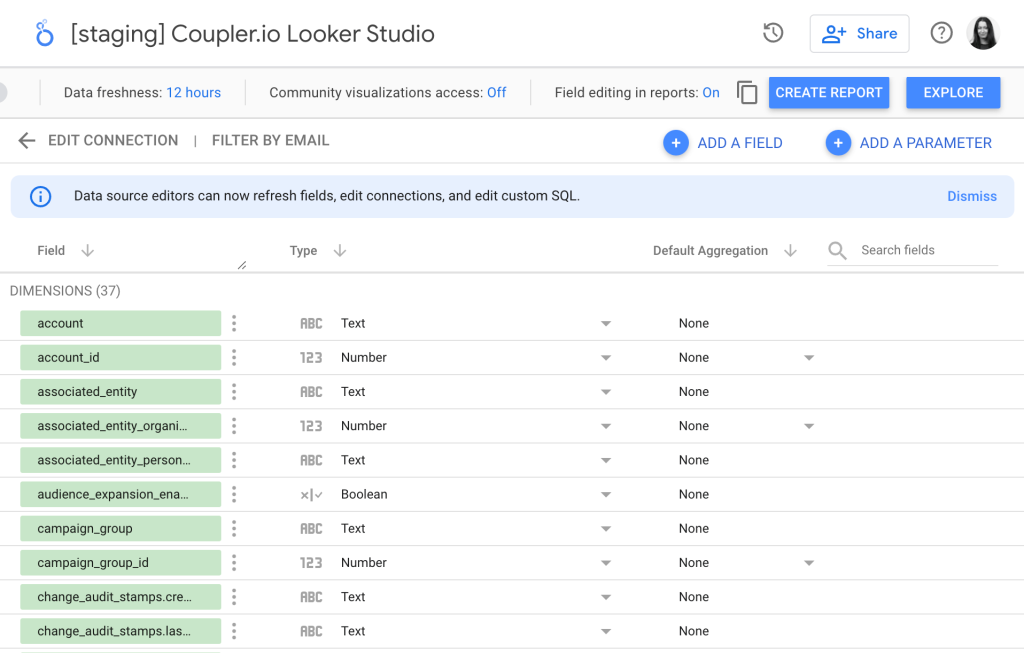
- After this, you can review your data – in our example, it’s the list of dimensions from a LinkedIn Ads report. At this step, you can check that all the fields are assigned the correct data type, such as text, number, or date and time. If something is wrong, you can change the data type manually.
- When everything is ready, click Create report.
- Now, you’ve connected Google Sheets to Looker Studio and can start working on your dashboard.
As you can see, linking the two apps with the native functionality is rather simple. However, we recommend taking a look at the next section, where we will show you how to connect Google Sheets to Looker Studio with a third-party solution. Using this method, you can make your Google Sheets spreadsheet with the source data self-updating, so that it always contains only the latest data to be displayed in your dashboard. Apart from that, this will allow you to conveniently transform and combine data from different sources prior to visualization.
How to connect Google Sheets to Looker Studio with a partner connector – example
Even though the native method has its advantages in many cases, it’s good to have an extended functionality to be able to work with data more efficiently. In this example, we will show you how to connect Google Sheets to Looker Studio with the help of Coupler.io. This data integration platform provides a partner Looker Studio connector to load data from 420+ apps, including Google Sheets, Pipedrive, Salesforce, Shopify, Airtable, Google Analytics 4, WooCommerce, and many others.
This solution also provides other connectors for Google Sheets, Excel, BigQuery, and other destinations. For instance, you can use Coupler.io to import data from one or several apps into Google Sheets, blend, filter, and transform this data, and set up a schedule for automated updates. Then, you can connect this auto-updating spreadsheet with processed data to Looker Studio. As a result, you will get a self-updating dashboard that displays the latest data automatically collected from multiple apps.
Now, let’s see how to connect Google Sheets to Looker Studio with this method.
Part 1. Connecting your data sources to Google Sheets automatically
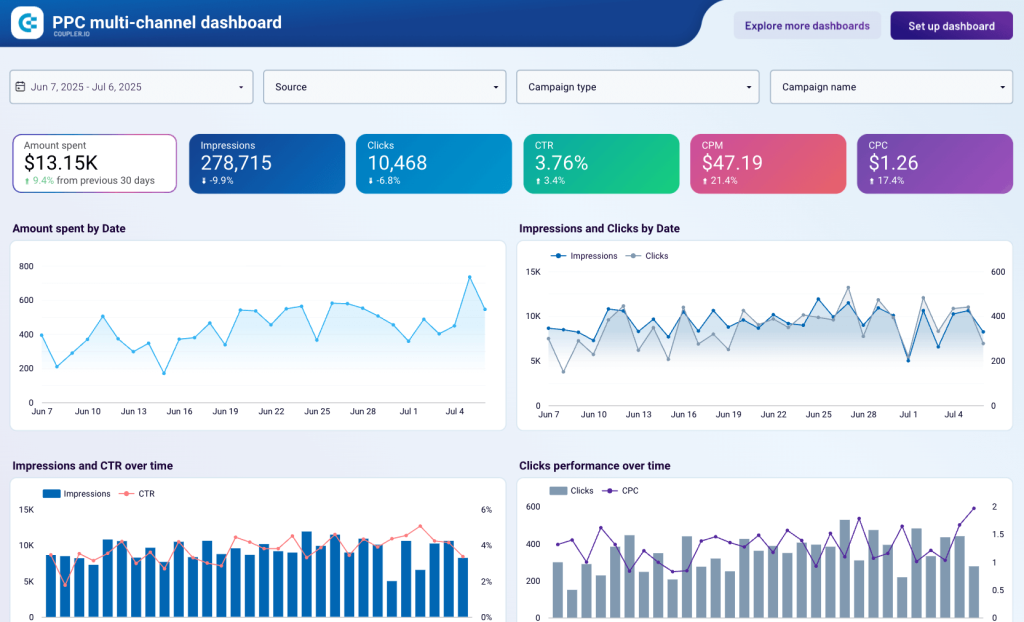
- In this example, we will use Coupler.io to connect LinkedIn Ads to Google Sheets. Then, we will connect this spreadsheet to Looker Studio for visualization. If we repeat the same process for another data source, such as Google Ads, we can build a cross-channel dashboard like the one shown below.
- First, you will need to sign up for Coupler.io. As we are going to work with Google Sheets, it will be more convenient if you sign up using your Google account.
- Then, add a New importer on the Importers tab.
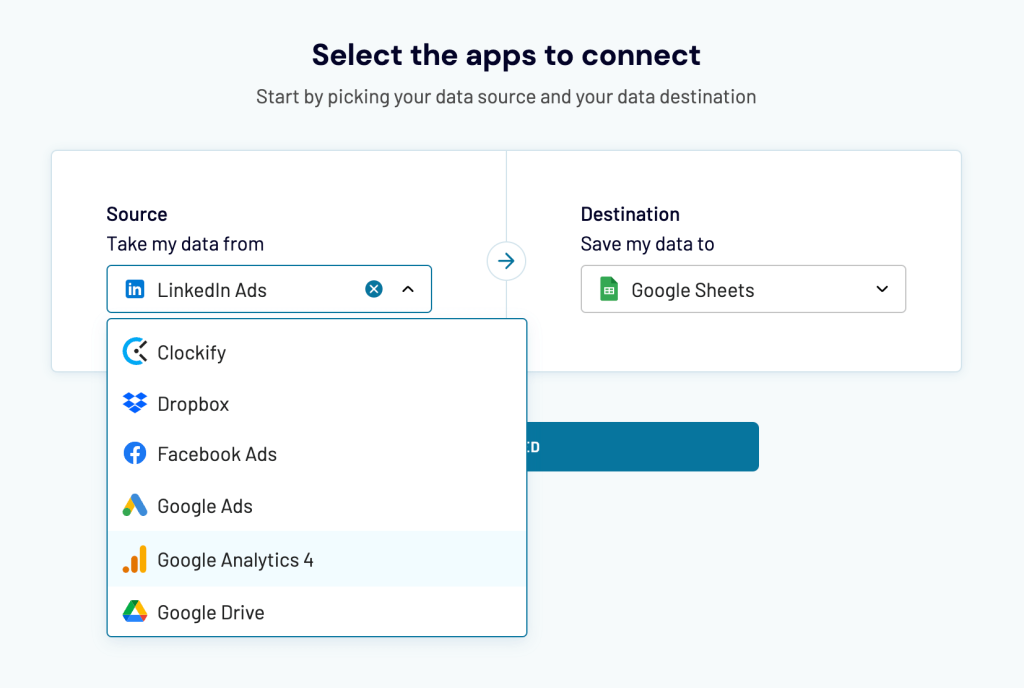
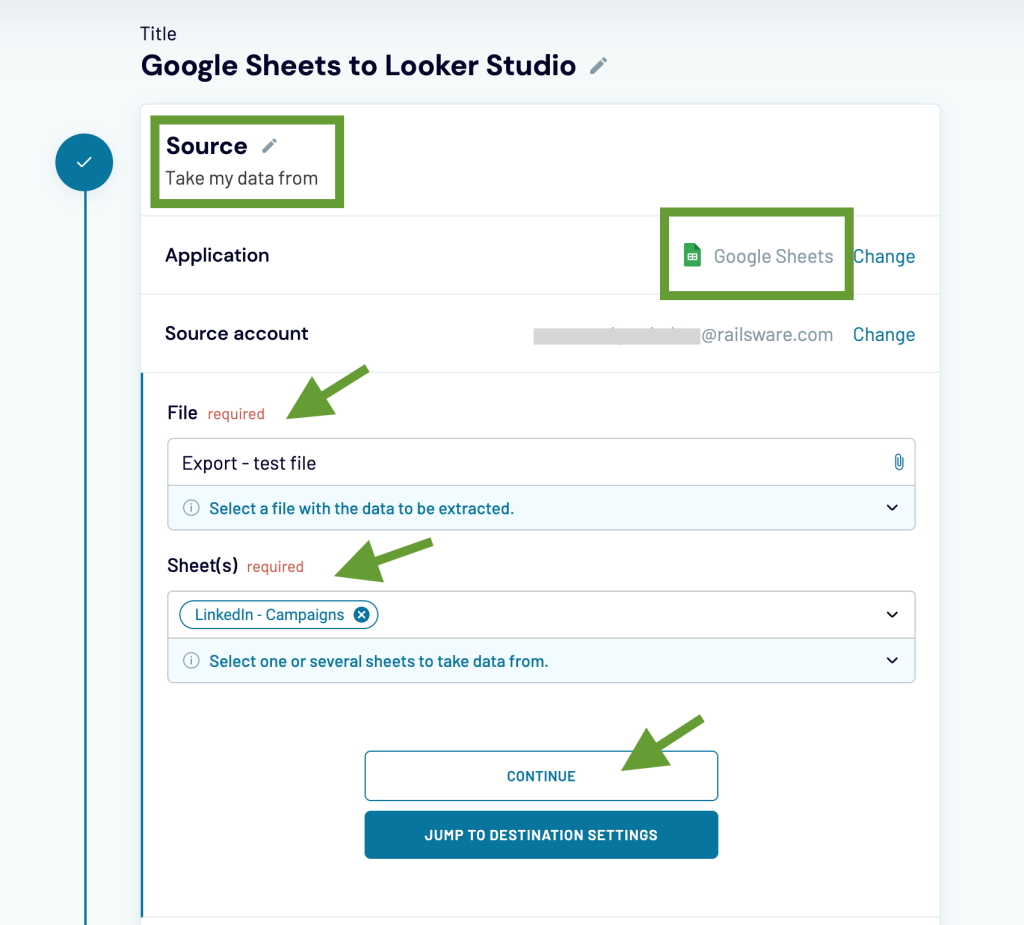
Select your data source and destination – in our example, it’s LinkedIn Ads and Google Sheets. See other available Google Sheets integrations to choose from.
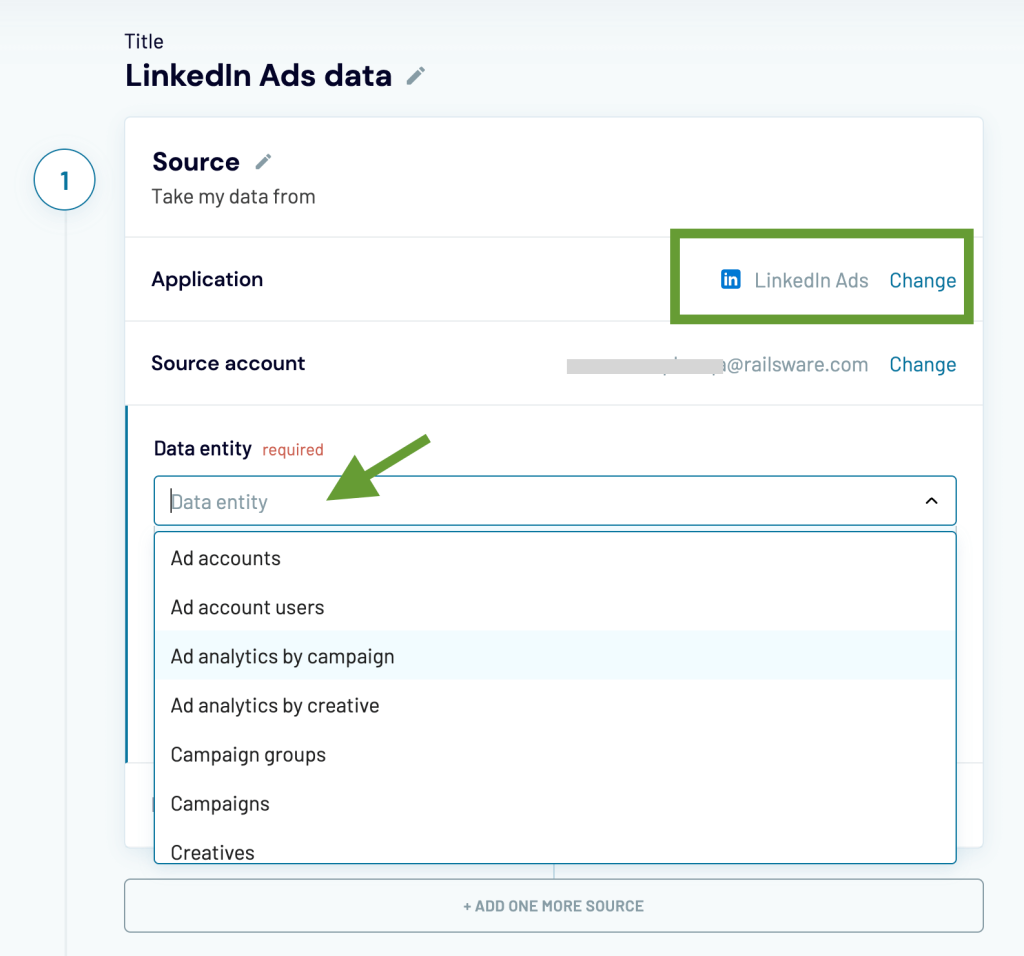
- Connect your data source account and select the data entity you want to export. If you need to extract several data types, you will need to create separate importers for this or just click +Add one more source and add the same source but with a different data entity in settings.
- Then, specify the start date for your report and click Continue.
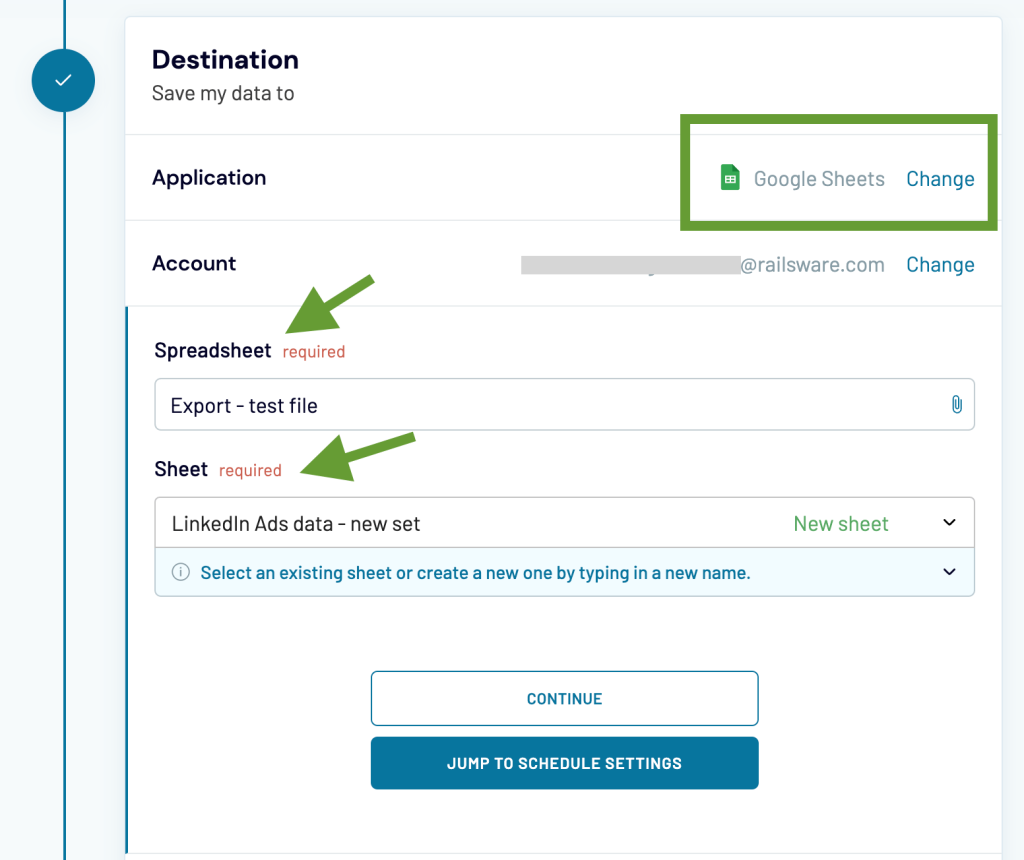
- Next, connect your destination account. If you used your Google account to sign up for Coupler.io, then it should already be connected, so you can just select it from the drop-down menu.
- Specify the worksheet and the sheet where to place your data. You can just type in the name for a new sheet, and Coupler.io will create it for you automatically.
- After this, choose the import mode. As we want to create a self-updating dashboard, it’s better to select the Replace mode for this purpose. In this case, a fresh dataset will replace the old one during each scheduled update. And the Append mode would be a good choice for tracking changes chronologically as it places each new version of the dataset below the previous one.
- Now, you can set up a custom schedule for the updates. We will explain this step in more detail in one of the next sections, How to integrate Google Sheets and Looker Studio in real-time.
- Then you can repeat the steps described above to connect other data sources to Google Sheets.
- There are no limitations on how many sources you can integrate. If you want to calculate custom metrics or make other manipulations with your data before visualizing it, it might be convenient to connect your data sources to the same spreadsheet. Just make sure to specify different sheets in the settings. Otherwise, the imported datasets can be written over with new data.
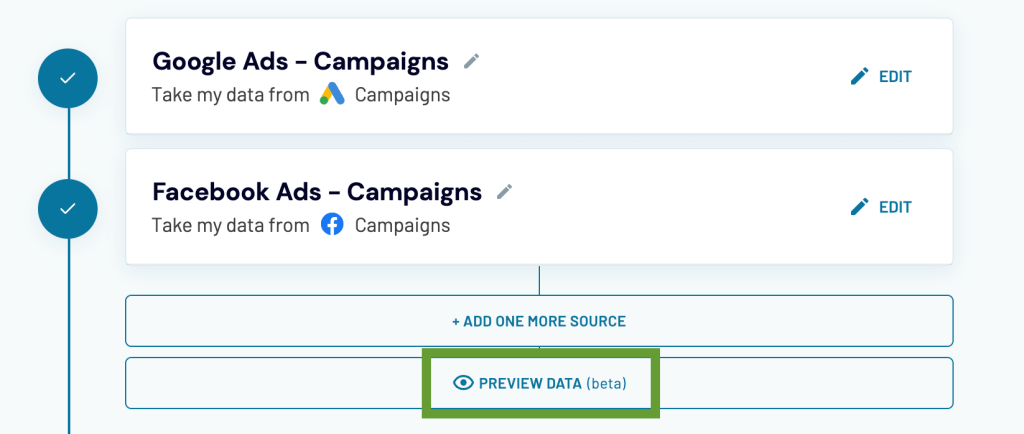
- If you want to blend your data from various apps before visualizing it or transform it in another way, you can use Coupler.io’s Transform module. Let’s say, you want to combine data from Facebook Ads and Google Ads and have already connected both sources to the same importer. Now, you can press Preview data.
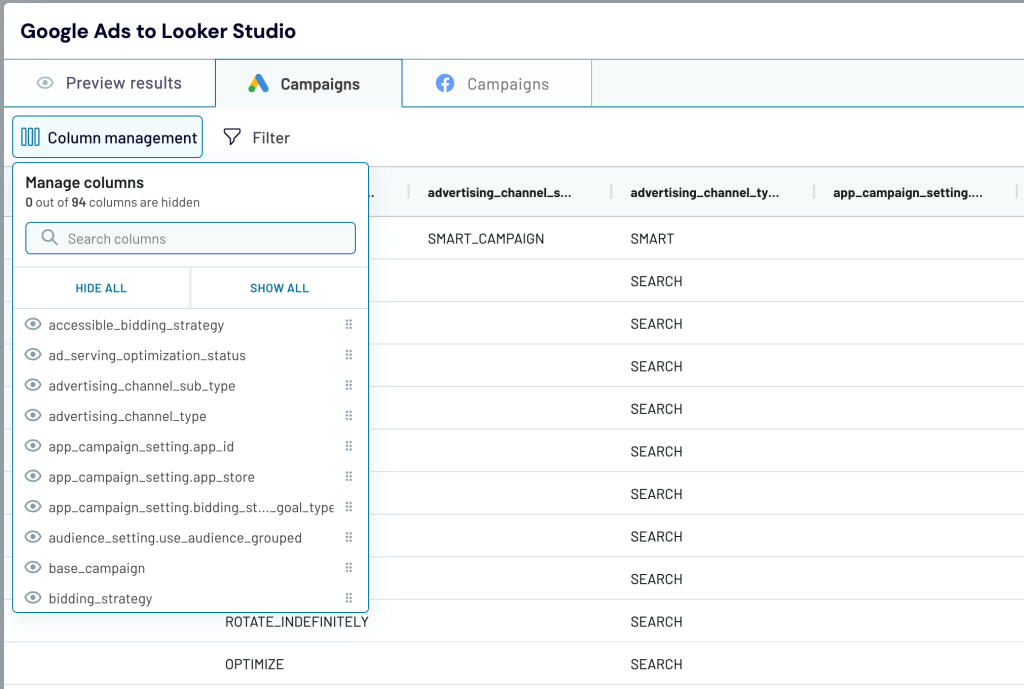
- You will see data previews fetched from both connected apps. At this step, you can rearrange or hide columns, as well as rename them so that you can merge data from different sources. In addition to this, you can filter your data.
As a result, you will get a self-updating spreadsheet with blended, filtered, and transformed data automatically fetched from multiple data sources. Coupler.io will transfer fresh data from your apps to the selected worksheet according to your preferred schedule as often as every 15 minutes. This is a great way to power your dashboard in Looker Studio with always fresh data and avoid performance issues that would occur if Looker Studio were used for data transformation.
Part 2. Connecting Google Sheets to Looker Studio
Now that fresh data flows automatically to your Google Sheets worksheet, you can link it to Looker Studio for visualizing. You can do this using the native method that we’ve already described at the beginning of the article. Alternatively, you can connect Google Sheets to Looker Studio using Coupler.io.
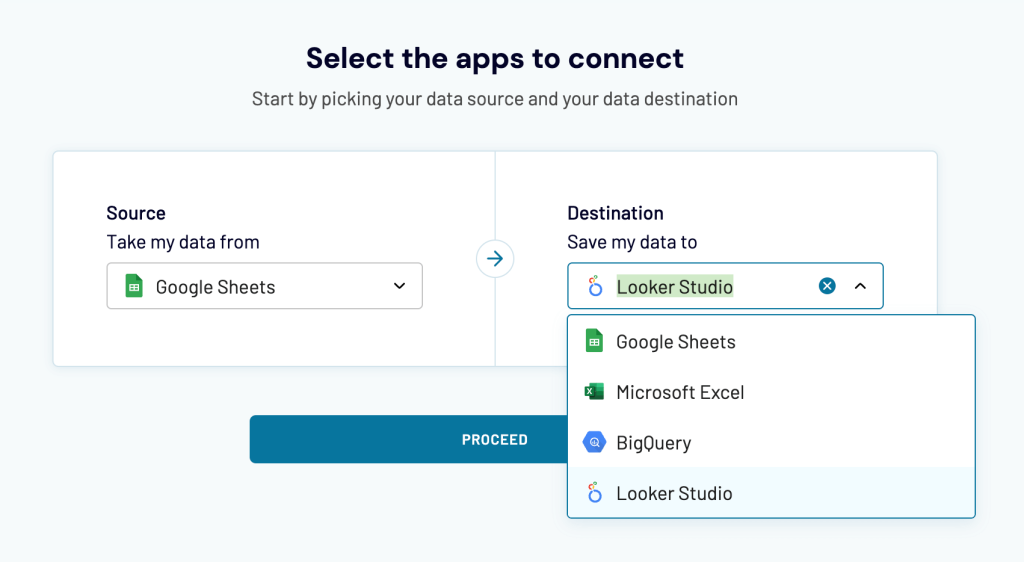
- Create a new importer on the Importers tab and select Google Sheets as a data source and Looker Studio as a destination.
- Then, select the worksheet and the sheet to pull the data from. You can add several sheets at once.
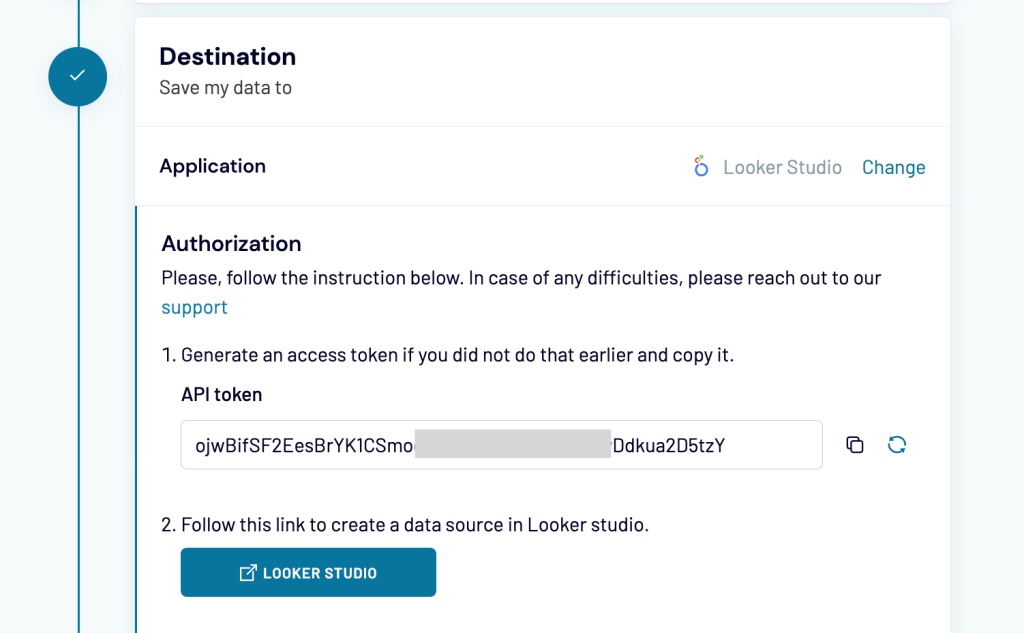
- After this, you will need to connect your Looker Studio account following the instructions in the importer settings. You will only need to do this once. For more details on how to generate an access token and connect your Looker Studio account, please check the Help Center article.
- In the next steps, you can set your preferences for scheduled updates and run the importer.
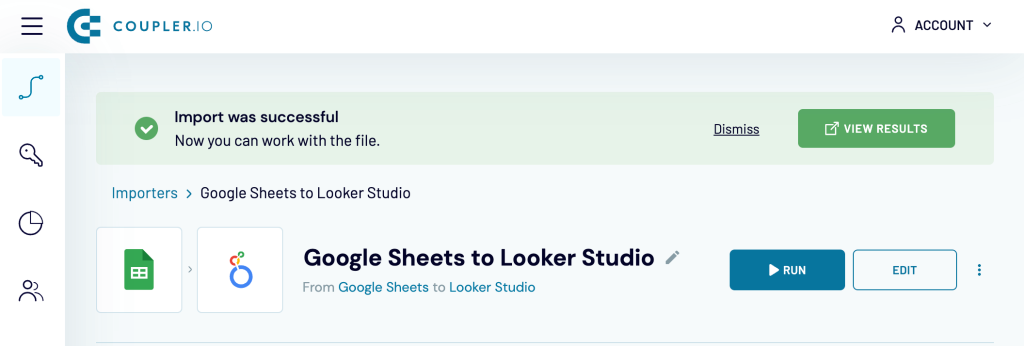
- Press the View results button to quickly navigate to the imported data.
- You will be able to preview and edit the field types and then press Create report to start building your dashboard.
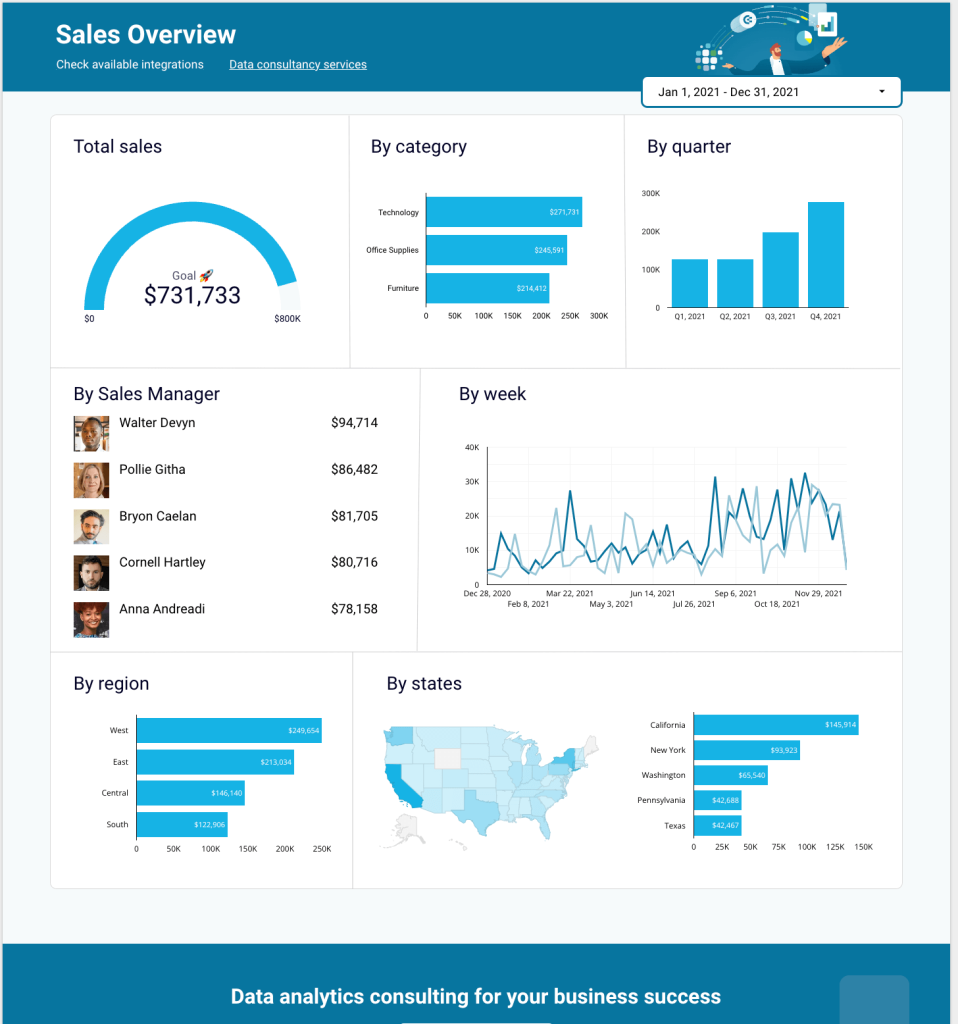
Here’s an example of a ready Sales Overview Dashboard created by Coupler.io’s data professionals. You can build an insightful visualization like this on your own or request assistance from our data analytics consulting team. They can help you with solving any data-related challenges, from building advanced dashboards to automating data flows, streamlining business analytics, or setting up data infrastructure in your organization.
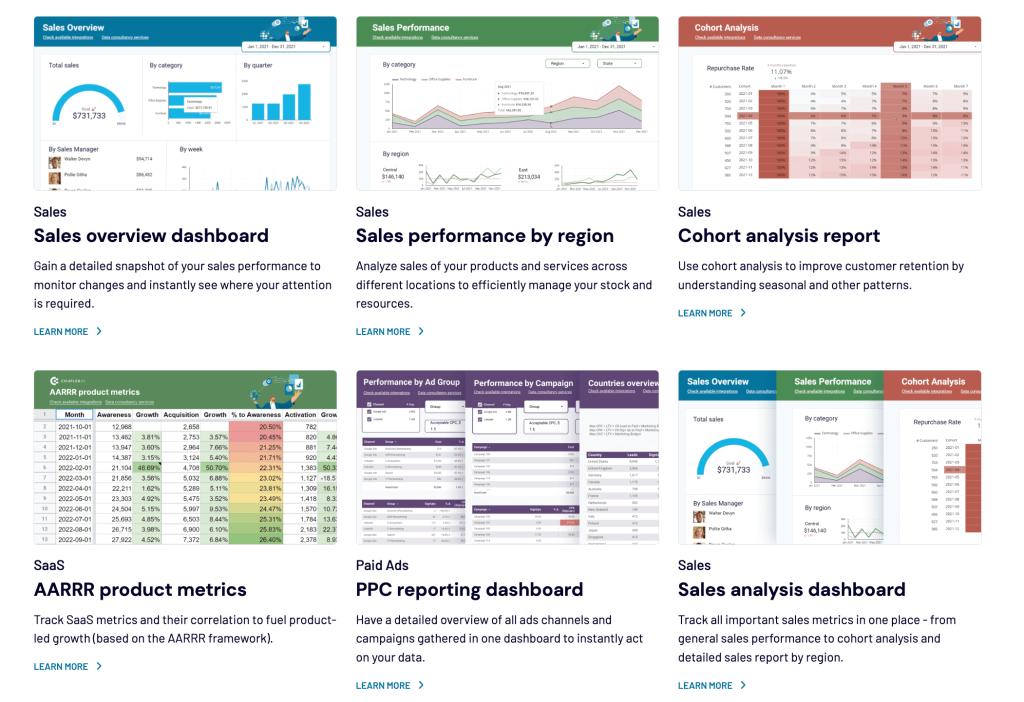
You can find other examples of professional dashboards in the Actionable dashboards section on our website. If you are interested in using these dashboards as templates for your visualizations, please contact us.
How to integrate Google Sheets and Looker Studio in real time
Your dashboard will be more useful and valuable if it always shows the latest data. This gives you an opportunity to closely monitor changes and quickly react to the shifting circumstances.
It’s possible to connect Google Sheets to Looker Studio in a way that allows you to update your visualizations in near real time. The minimal interval for data refreshes is 15 minutes, and it’s capped by Looker Studio’s functionality – this means there’s no way to update your dashboard more often than once every 15 minutes. However, such an interval is enough for monitoring most processes. At the same time, frequent updates could affect performance and slow Looker Studio down, so the optimal recommended interval would be 1h, unless it’s essential to refresh your dashboard more often.
Here’s how to set near real-time updates for your dashboard if you used the native method to connect Google Sheets to Looker Studio.
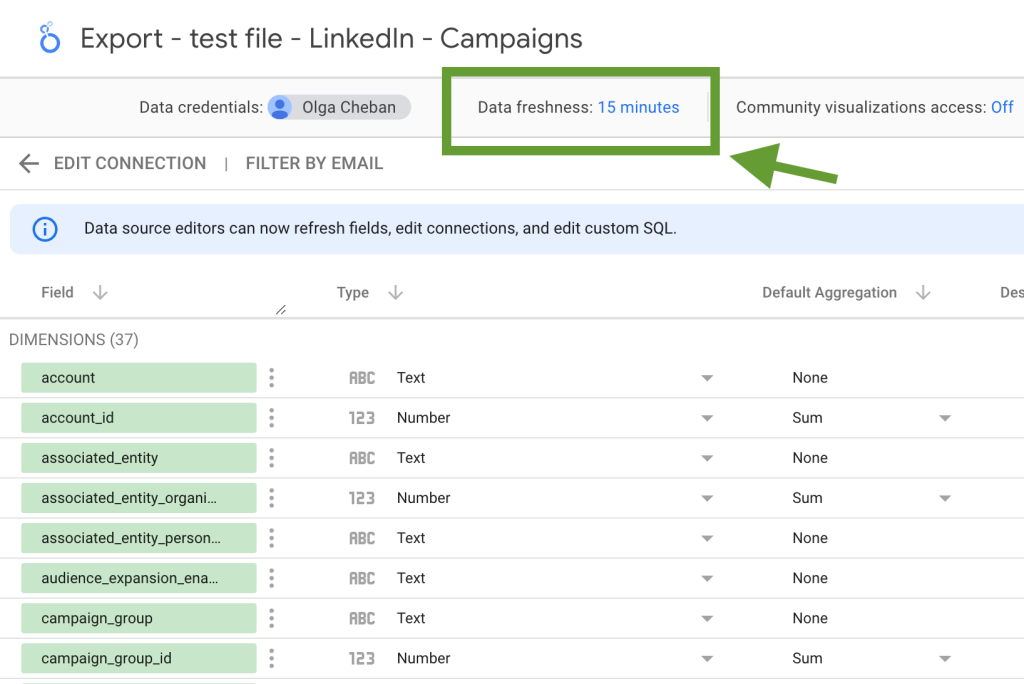
- Once your data is transferred to Looker Studio, find the Data freshness settings in the menu on the top.
- The value should be set to 15 minutes by default. If it’s not, click on it to change the interval.
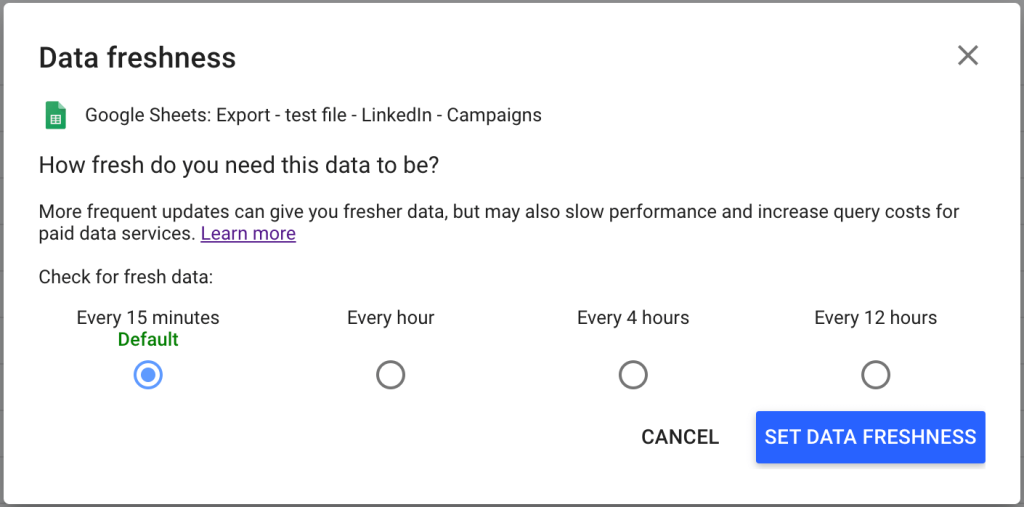
- Then, select Every 15 minutes and press Set data freshness. That’s it! Now Looker Studio will pull your data from Google Sheets at the specified interval.
- However, you need to ensure that the worksheet connected to Looker Studio also receives fresh data every 15 minutes. Otherwise, your dashboard won’t reflect changes in real-time and will just keep fetching outdated information every quarter of an hour.
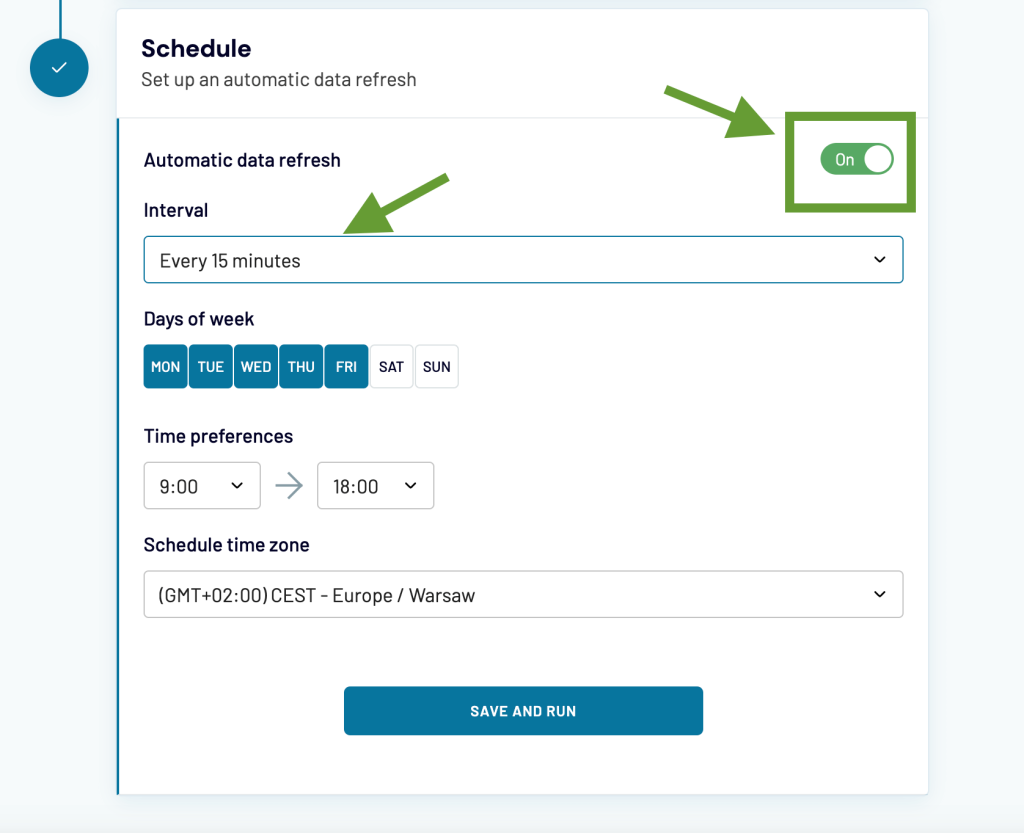
- If you use Coupler.io to automatically channel fresh data into Google Sheets, you will need to set the corresponding schedule for the updates. To do so, go to the Schedule section of your importer and toggle on Automatic data refresh.
- As we want to monitor the metrics in real time, we will need to set the update interval for every 15 minutes. Additionally, you can select the days of the week and the times when you want to have your data refreshed. When it’s ready, press Save and Run.
Now, Coupler.io will collect fresh data in your Google Sheets worksheet every 15 minutes, and then this data will be transferred to Looker Studio at the same frequency, giving you live access to your data.
How long does it take for data to update between Google Sheets and Looker Studio?
If you use the instructions given above and set the update interval to every 15 minutes, then any updates made in Google Sheets will be reflected in Looker Studio during the next scheduled refresh. So, it might take up to 15 minutes to synchronize data between Google Sheets and Looker Studio.
If you need to update your dashboard urgently, you can do so manually.
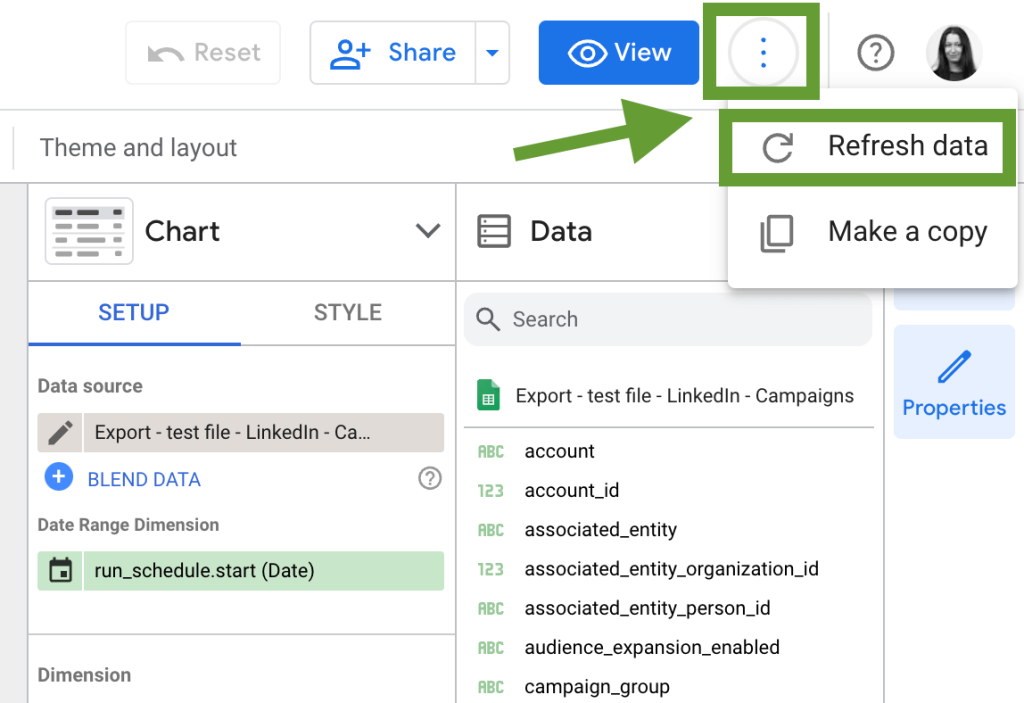
Just go to the report you want to update, click the three dots in the upper right corner, and press Refresh data.
After this, your data in the dashboard should be refreshed more or less instantly, but the actual time may depend on the volume of the dataset, the number of data sources connected, the complexity of queries and filters, and so on. In any case, fresh data should be loaded within minutes.
Connecting Google Sheets to Looker Studio: what to keep in mind
As we’ve already seen from the previous examples, connecting Google Sheets and Looker Studio with native functionality is quite simple. You can easily link the two apps, visualize your data, and set regular updates from every 12 hours to every 15 minutes. However, these automatic updates won’t be of much use if your worksheet with the source data isn’t updated at the same intervals.
To overcome this problem, you can use Coupler.io – which will help you streamline your data flows and automatically collect data from multiple sources in Google Sheets. The solution allows you to set up a flexible schedule for the updates and ensure that the information in your worksheet is always fresh. As a result, you will get a self-updating spreadsheet that will power your dashboard for near real-time monitoring. For more convenience, you can also use Coupler.io to link Google Sheets to Looker Studio without using the native connector. If you need to visualize data from other apps, apart from Google Sheets, check our full list of Looker Studio integrations.
Another thing to keep in mind is general recommendations for visualizing your data. We’ve already blogged about Data Visualization Best Practices, so you can check this article for useful tips and examples.