TikTok’s built-in analytics only lets you download 60 days of data at a time. This means you’re stuck repeating the same manual export every time you need an updated report. If you’re tracking content performance across weeks or months, that gets old fast.
Learn how to set up an automated TikTok data export to Google Sheets, Daеф Studio, Power BI, AI tools, and other destinations using Coupler.io. You’ll also get dashboard templates for TikTok organic analytics and cross-channel PPC reporting, plus a walkthrough of TikTok’s native manual export options.
Let Coupler AI do the data work for you
Tell Coupler AI what you need to know, from which source, and how often. It connects your account, sets up the data flow, keeps it refreshed, and lets you analyze the results inside Coupler.io or another AI tool.
Try for free
How to set up an automated TikTok data export on a schedule?
Coupler.io is a data integration platform and AI analytics solution that automates your TikTok data flow on a schedule. It enables you to load data to spreadsheets, BI tools, data warehouses, and even AI tools for conversational analytics. Let’s see how to do this.
Step 1: Collect TikTok data
In the widget below, TikTok Organic is already preselected as a source. Choose your destination from the dropdown menu and click Proceed.
You’ll be prompted to create a Coupler.io account for free. Then, link your TikTok account and give the necessary permissions.
Next, choose the report type from: Profile audience genders, Profile audience countries, Profile audience hourly activity, Profile insights, Video list top countries, and Video list insights. And specify the report period.
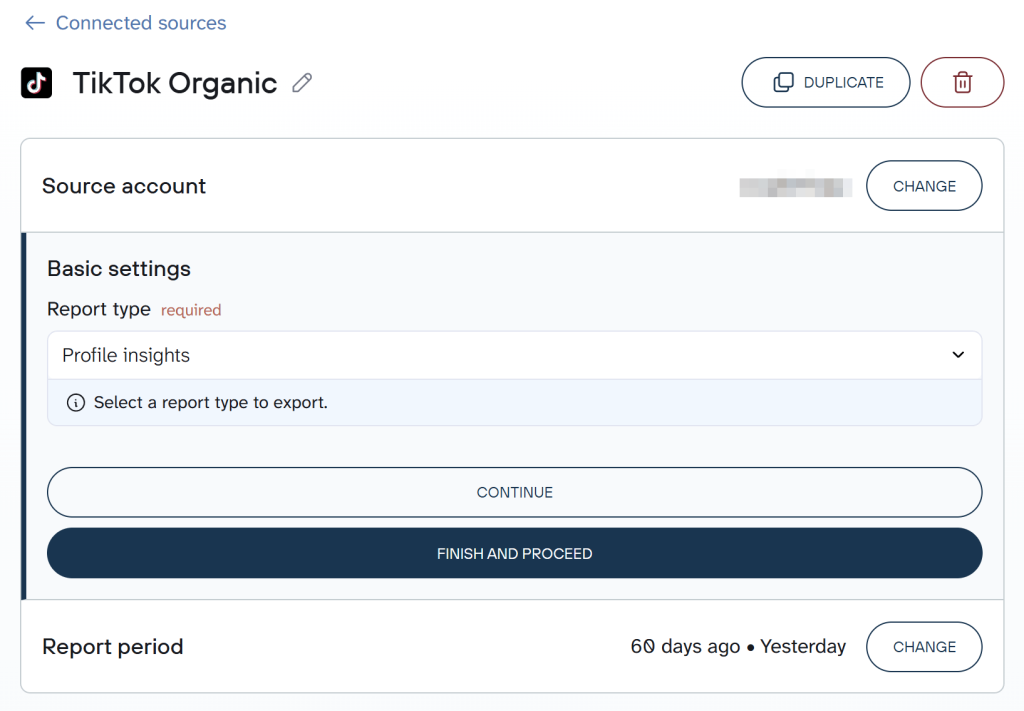
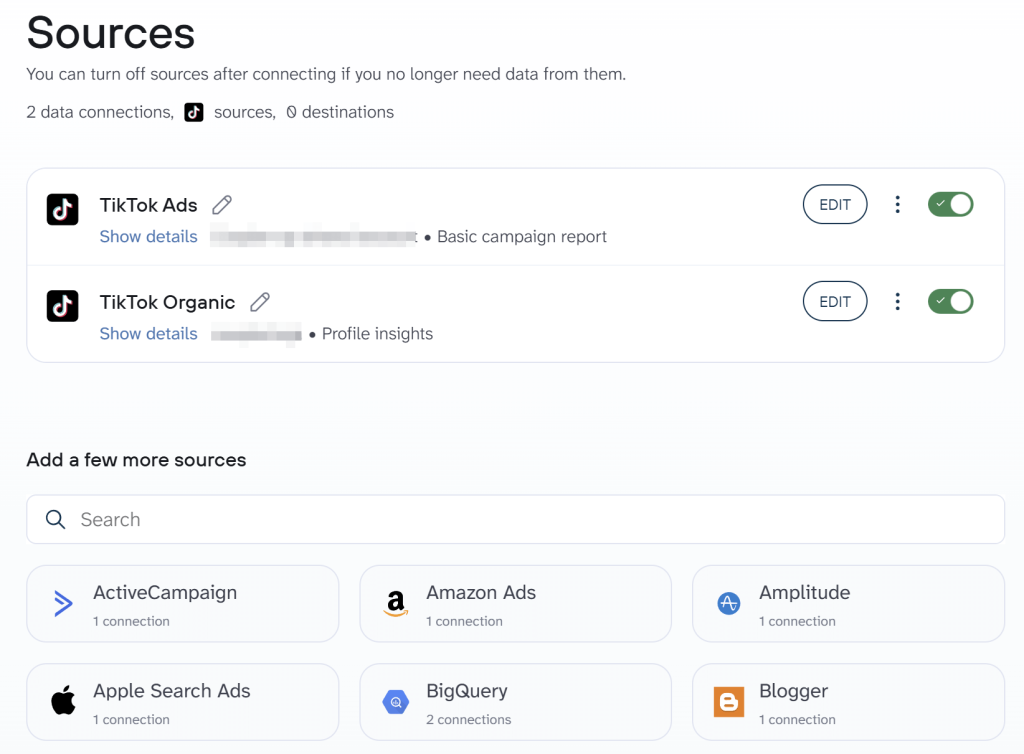
Coupler.io allows you to add more data sources to blend your TikTok data with. Agencies and other users can collect data from multiple TikTok accounts, combine TikTok organic data with information from TikTok Ads, and so on.
Step 2: Organize your data set
Once you’ve configured your source data connection, move on to the step for data set organization. Coupler.io allows you to prepare your data for analysis before loading it to its final destination.
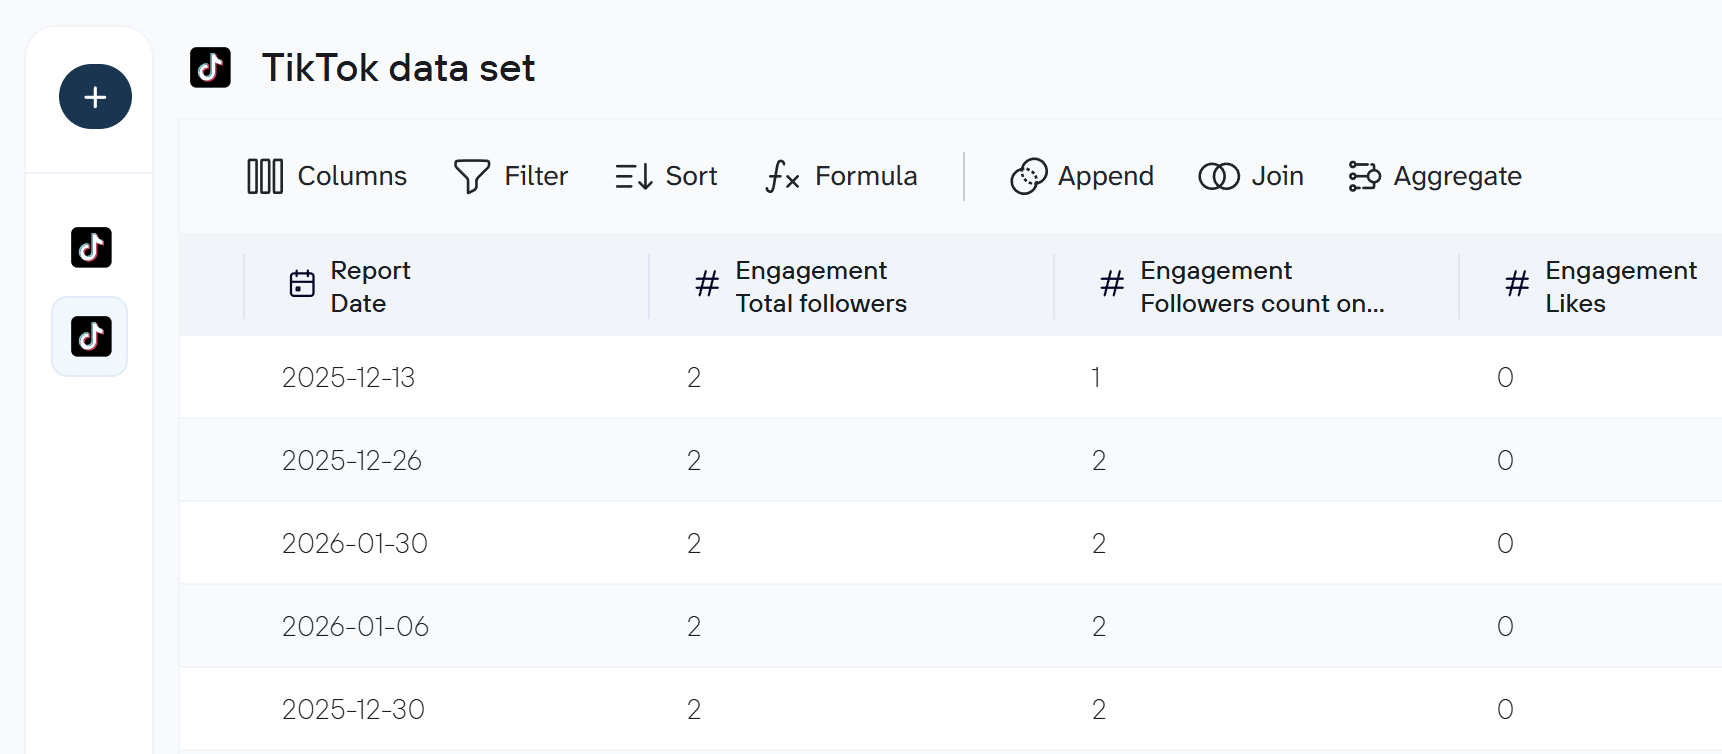
Here’s what you can do:
- Hide columns and keep only those relevant to your analysis.
- Rename columns and adjust your column data types for clarity.
- Apply filters to focus on specific data segments.
- Sort data to identify the highest and lowest-performing content.
- Aggregate TikTok data by performing operations like sum, average, count, min, or max on specific columns.
- Merge TikTok data with information from other social media platforms or data sources
As a result, you get a clean, analysis-ready dataset. This step also matters if you plan to use AI tools later. The columns you keep, hide, or rename here control exactly what reaches the AI layer. Nothing goes to AI that you haven’t reviewed and approved at this stage.
Tip: If you plan to ask AI questions about your TikTok data, add business context in this step. For example, explain what your key metrics mean or how your content categories are structured. This helps AI tools give more relevant answers.
Step 3: Load data and schedule updates
Next, connect to your destination app by following the on-screen instructions. The setup process will differ depending on where you’re importing your data.
Your data flow can send the same TikTok data to multiple destinations at once. So you might load raw data into Google Sheets for ad hoc analysis while also feeding a Google Data Studio dashboard for stakeholder reporting and connecting to an AI tool for conversational analytics. You set this up within the same data flow, not by creating separate ones.
To automate regular TikTok data exports, simply toggle on the Automatic data refresh button. Then, customize the refresh frequency by choosing the interval, days of the week, preferred time, and timezone. For instance, you can set updates to every 15 minutes for real-time insights.
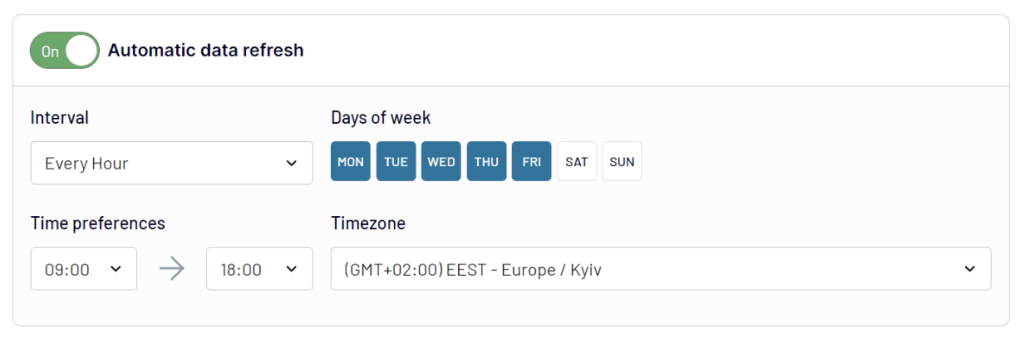
Once you run your data flow, Coupler.io will transfer your TikTok data to your chosen destination. It then automatically refreshes your data according to your pre-set schedule. This ensures you never have to worry about outdated reports.
Bonus step. Analyze TikTok data with AI Agent
Once your TikTok data is flowing, you can go beyond dashboards and spreadsheets and start asking questions about it directly.
Coupler.io’s AI Agent is a conversational analytics tool built into the platform. Ask questions in plain English, such as “Which videos had the highest engagement rate this month?” and get answers based on your actual data. Coupler.io’s Analytical Engine queries the dataset, runs the calculations, and passes only computed results to the AI. The AI doesn’t guess or estimate from raw data. It works with confirmed numbers.
There’s no extra setup. The AI Agent works directly with the data flow you already created in the previous steps.
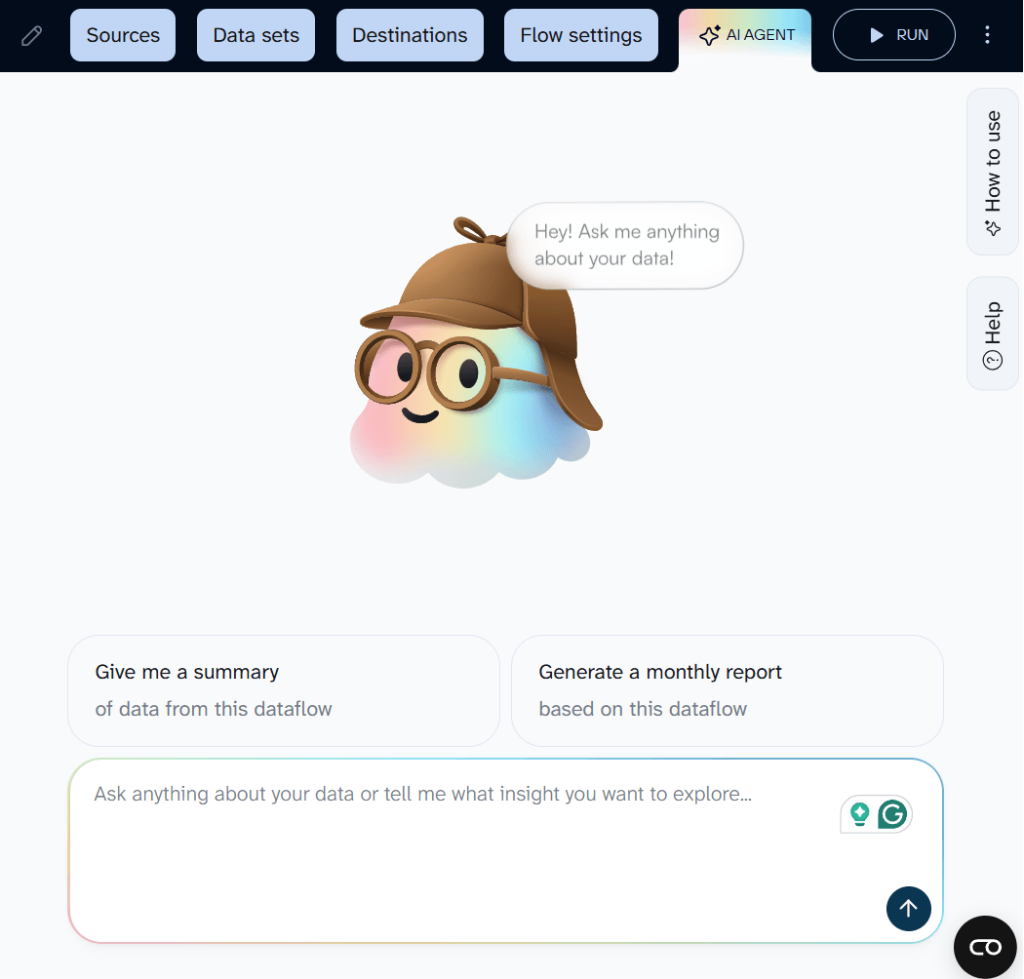
If you prefer to work with external AI tools like Claude, ChatGPT, Gemini, Perplexity, and others. Coupler.io supports that too. AI Integrations let you send your structured TikTok data to any of these tools based on the MCP server.
Learn how to connect TikTok Organic to Claude for AI-powered analysis in the tool you already use.
What data you can export from TikTok with Coupler.io
The pioneer TikTok integration by Coupler.io only allowed you to export two types of TikTok reports – profile data and video stats. Now, you can pull:
- Profile Audience Genders: This report breaks down your follower base by gender demographics. It shows the distribution of your audience across different gender categories. The report is helpful to understand who is engaging with your content.
- Profile Audience Countries: This report details the geographical distribution of your followers. It shows which countries your audience is based in, typically presented as percentages or rankings of top locations.
- Profile Audience Hourly Activity: This report shows when your followers are most active on TikTok throughout the day. It breaks down audience engagement by hour. With this report, you can identify optimal posting times for maximum reach.
- Profile Insights: This report provides comprehensive analytics about your TikTok account’s overall performance. It includes metrics such as follower growth, engagement rates, profile views, and other account-level statistics.
- Video List Top Countries: This report shows the geographical performance of individual videos. It breaks down which countries are generating the most views and engagement for each piece of content you’ve posted.
- Video List Insights: This report provides detailed performance metrics for each video on your account. It includes data such as watch time, completion rates, engagement metrics (likes, comments, shares), and audience retention statistics.
Where can you import TikTok data?
Coupler.io offers data integrations with various destinations, including spreadsheet apps, data warehouses, BI tools, and even AI platforms. Below are the different destination categories and the most frequent use cases.
| Categories | Use cases |
| Spreadsheets | You can export TikTok data to spreadsheet apps (Google Sheets or Microsoft Excel) for quick insights and custom calculations. |
| Data Warehouses | Tools like BigQuery, PostgreSQL, Snowflake, Supabase, and Redshift are good choices to handle large datasets. These platforms offer secure, scalable storage for data analysis. |
| BI tools | To create interactive dashboards and streamline reporting, you can connect with Looker Studio, Power BI, Tableau, and Qlik as destinations. These tools are ideal for tracking long-term performance trends and creating insightful visualizations. |
| AI tools | You can integrate TikTok data with AI tools like ChatGPT, Claude, Gemini, Perplexity, Copilot, OpenClaw, and Cursor for conversational analytics. Simply ask questions like “Which TikTok videos performed best last month?” and get instant, data-driven answers without switching between platforms. AI integrations enable you to explore trends, compare campaigns, and uncover insights through natural language. |
| JSON | You can export TikTok data as a JSON file to use in various applications supporting this format. This allows you to further import your TikTok data into systems not supported by Coupler.io. |
| Project Management Tools | You can directly automate your TikTok data export to Monday.com using Coupler.io. This will help you track the performance of your TikTok videos. |

Automate TikTok data export with Coupler.io
Get started for freeHow to visualize data from TikTok using a dashboard template?
Coupler.io enables you to export data from TikTok to spreadsheets and BI tools where you can visualize it. However, the tool also offers dashboard templates that have predesigned charts and tables and instantly turn your TikTok data into insights. Thanks to the built-in connector, you only need to sign in to your TikTok account and get a ready-to-use dashboard in just a few clicks. Here are the templates you should try.
TikTok analytics dashboard template
The TikTok analytics dashboard by Coupler.io pulls together your key TikTok stats into one view: content performance, audience demographics, and engagement trends.
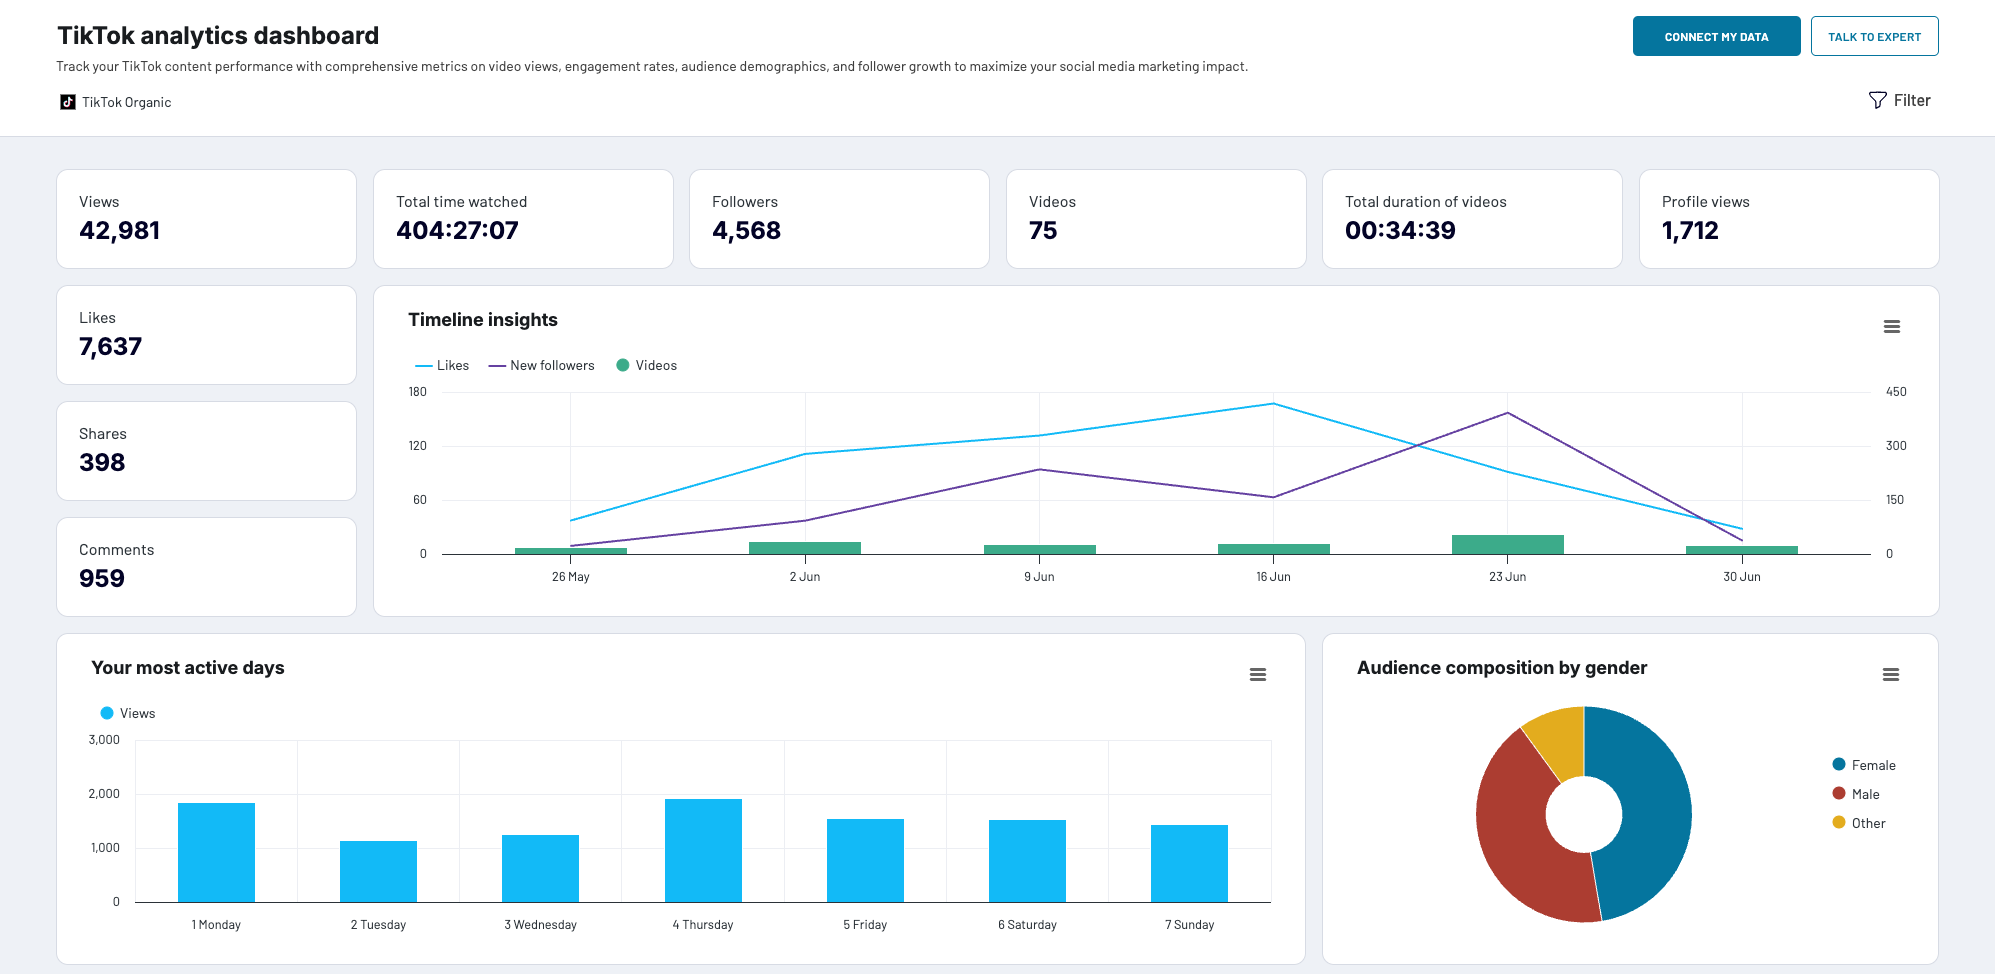
The TikTok analytics dashboard starts with an overview of your TikTok presence. You’ll find your total follower count alongside profile views to display immediate context about your account’s reach and visibility.

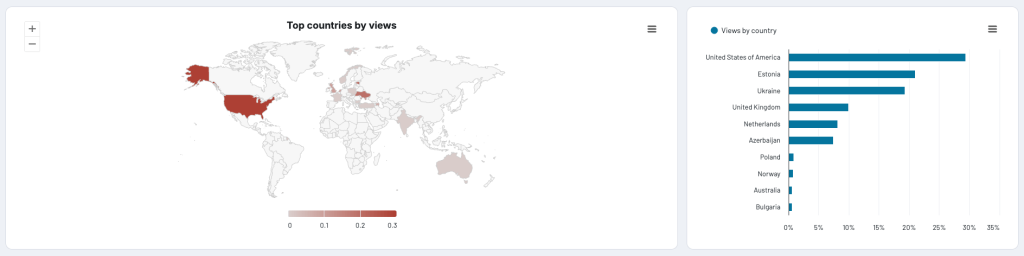
The demographic section breaks down your audience by geography and gender. You can see which countries drive the most views and whether your actual audience matches who you think you’re creating content for.
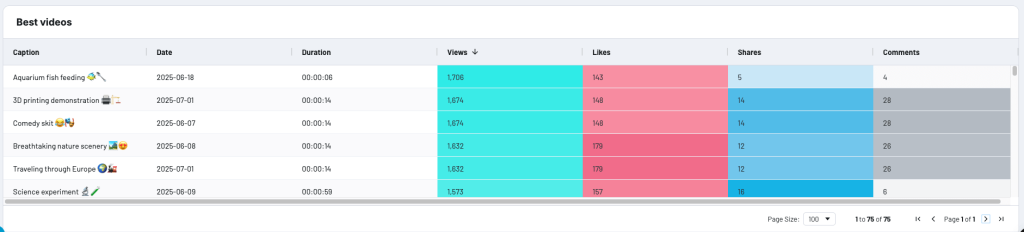
A top-performing videos table lists your best content with engagement metrics for each. Useful for figuring out what to make more of, or for showing a potential sponsor what your channel actually delivers.
The engagement funnel tracks how viewers move from watching to interacting. Views sit at the top, then likes, shares, and comments. This shows you where the drop-off happens and how well your content turns passive viewers into engaged ones.
The dashboard proves especially powerful for two key groups.
- Influencers looking for sponsorships can use it as a portfolio showing their actual performance data.
- Agencies managing TikTok accounts get a clean client-facing report without building anything from scratch.
Thanks to integration with Coupler.io, the dashboard template can be updated automatically on a schedule so that it always displays the latest data. Follow the instructions on the Readme tab to create a copy of the dashboard and populate it with the data from your TikTok account. You can choose from two versions, for Coupler.io or Looker Studio:


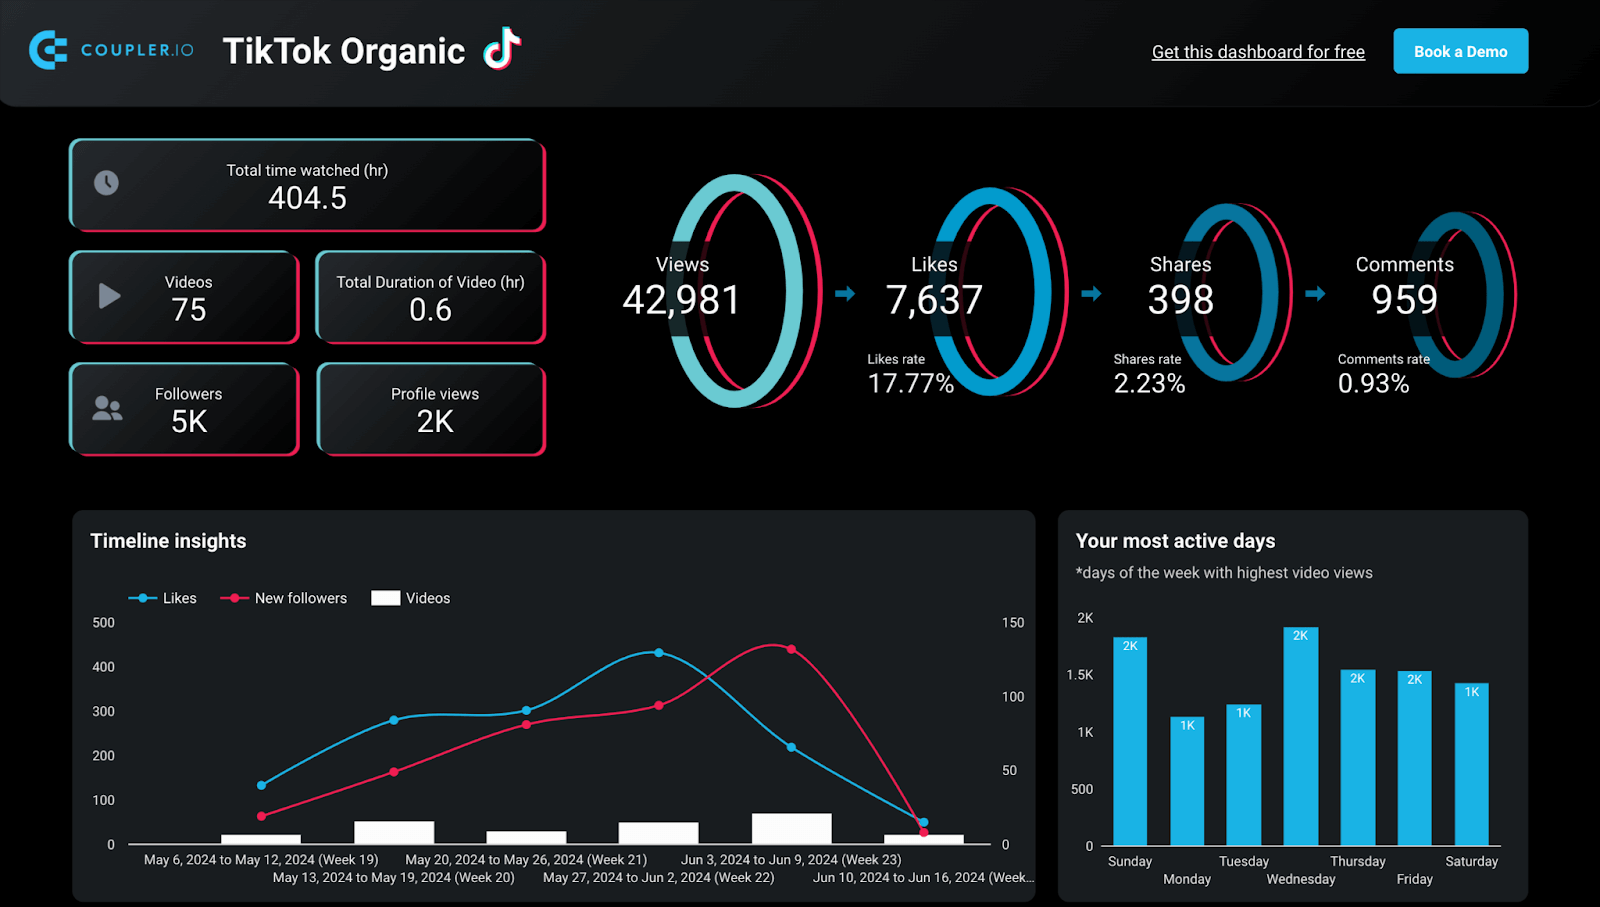

The process is rather simple and requires no special knowledge. For more detailed instructions, watch this video by Coupler.io Academy.
Analyze TikTok Ads data vs other video advertising platforms
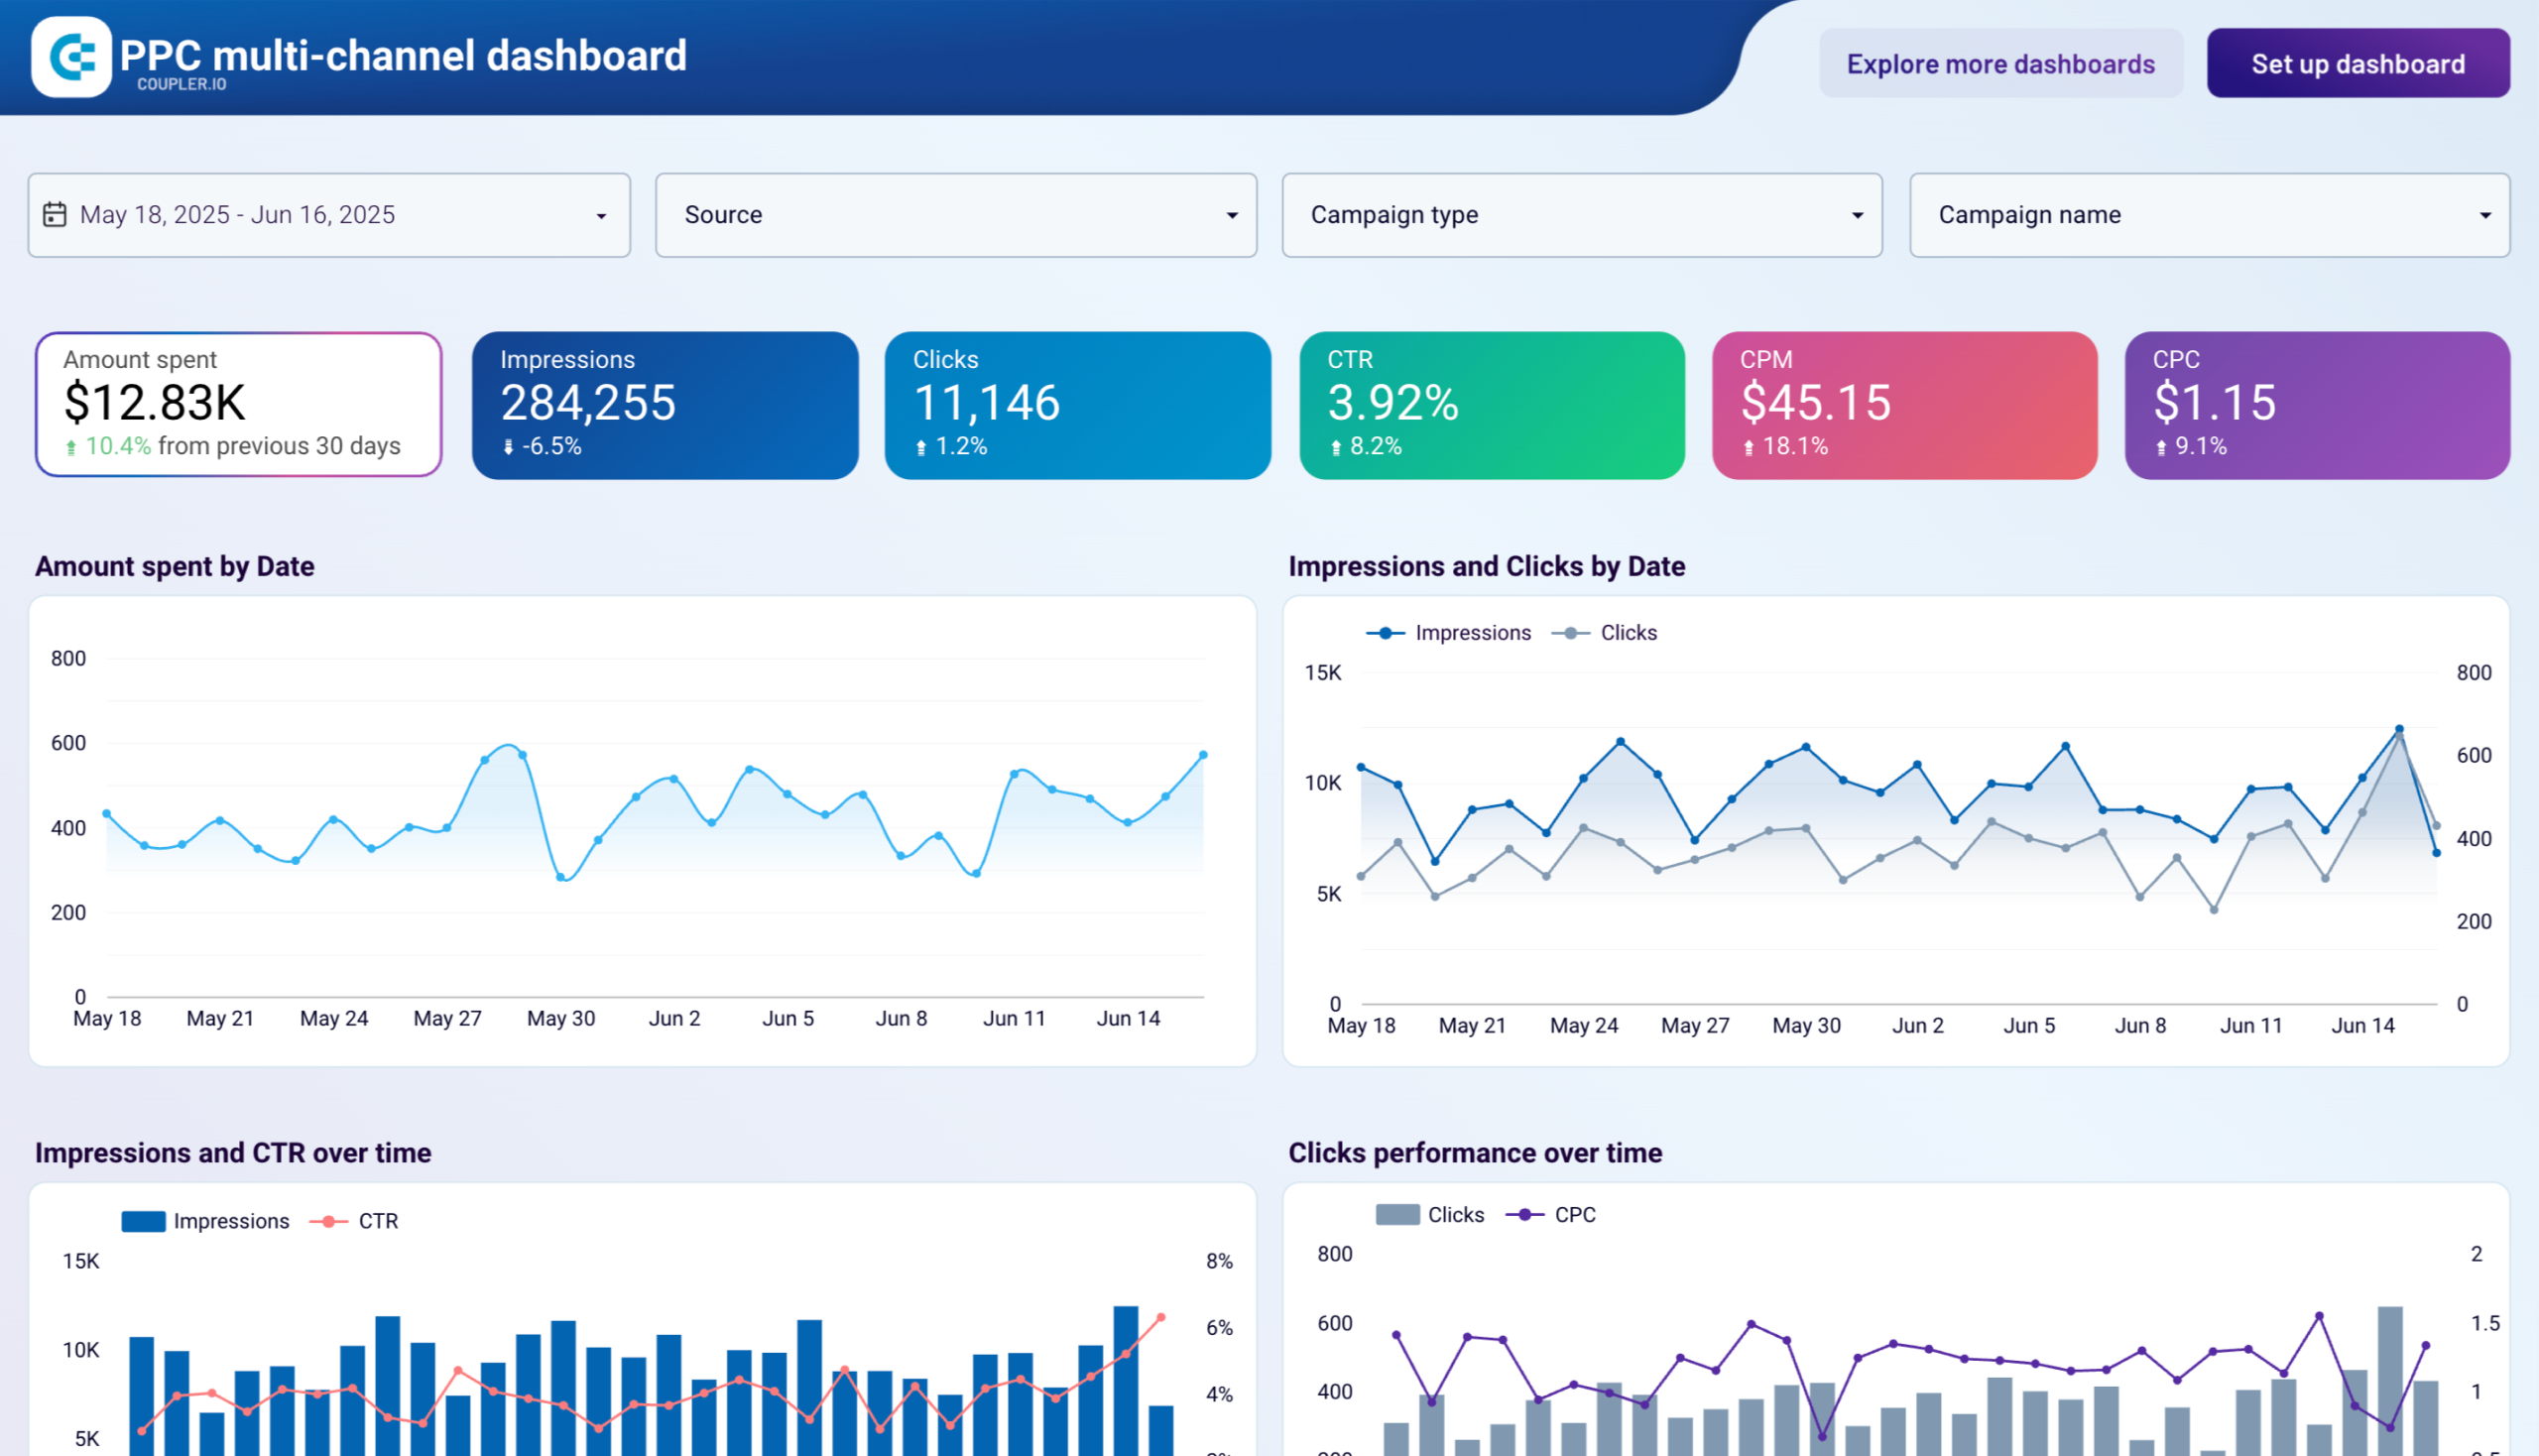
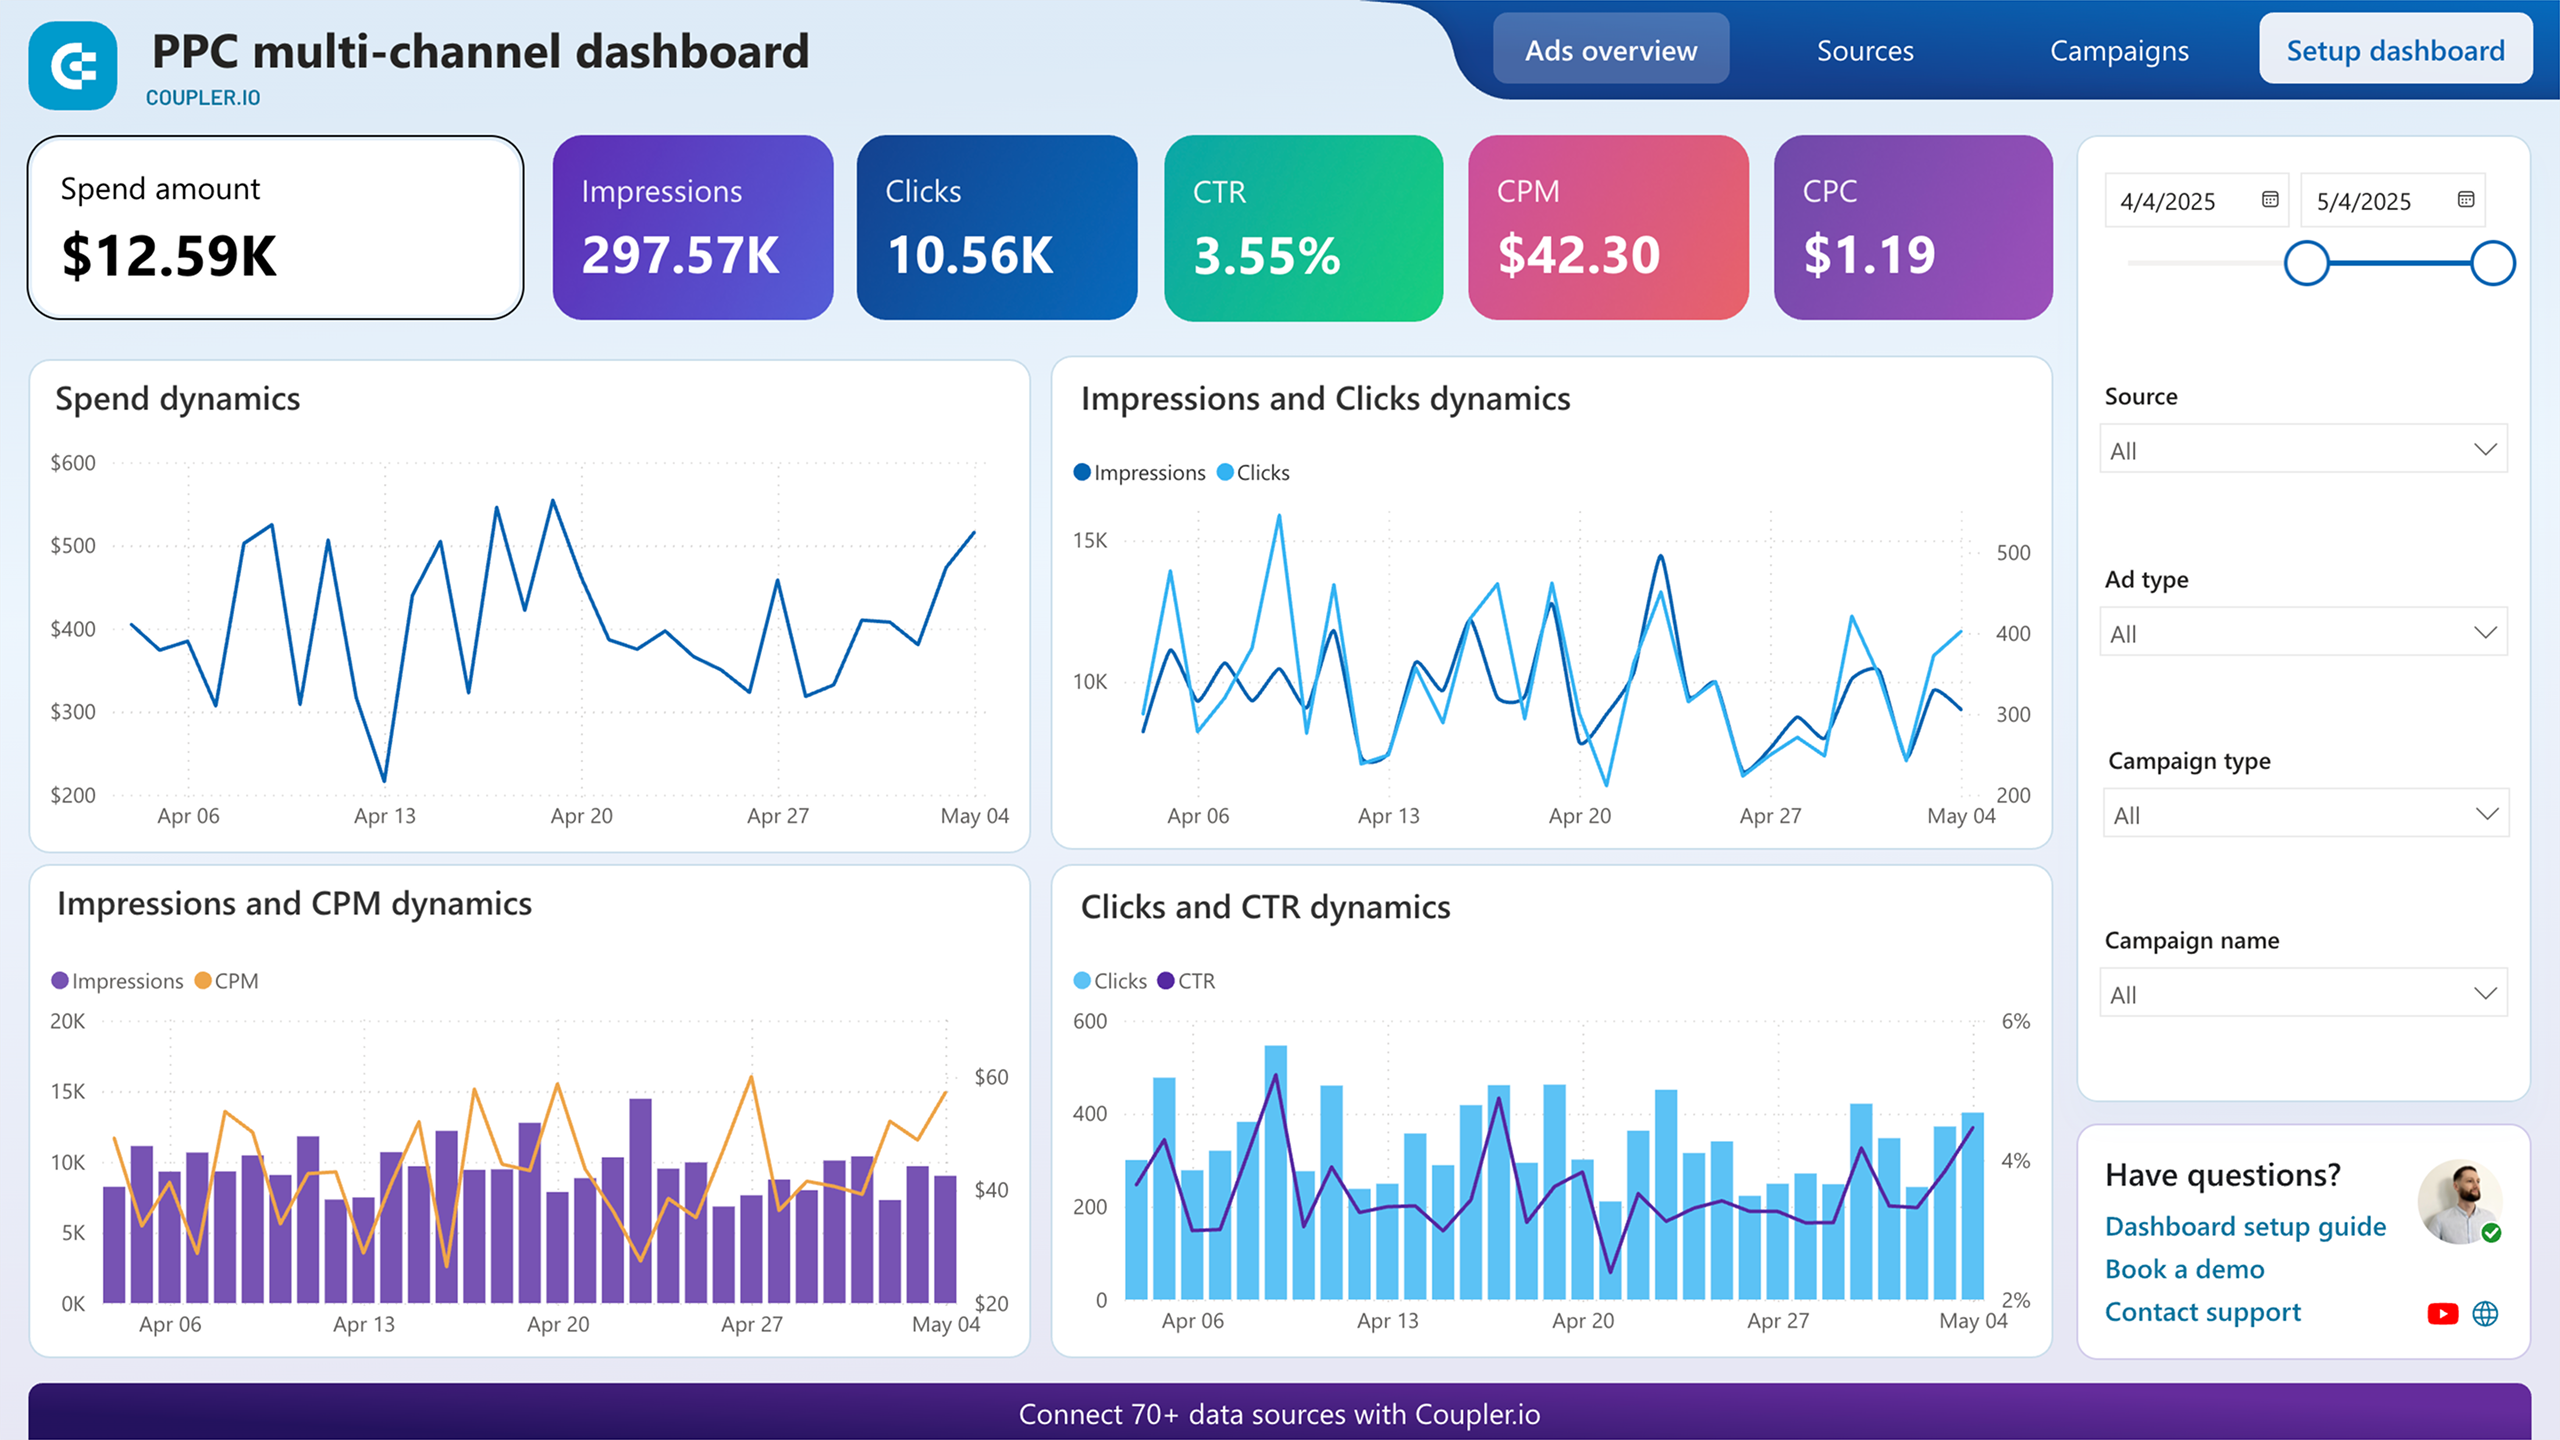
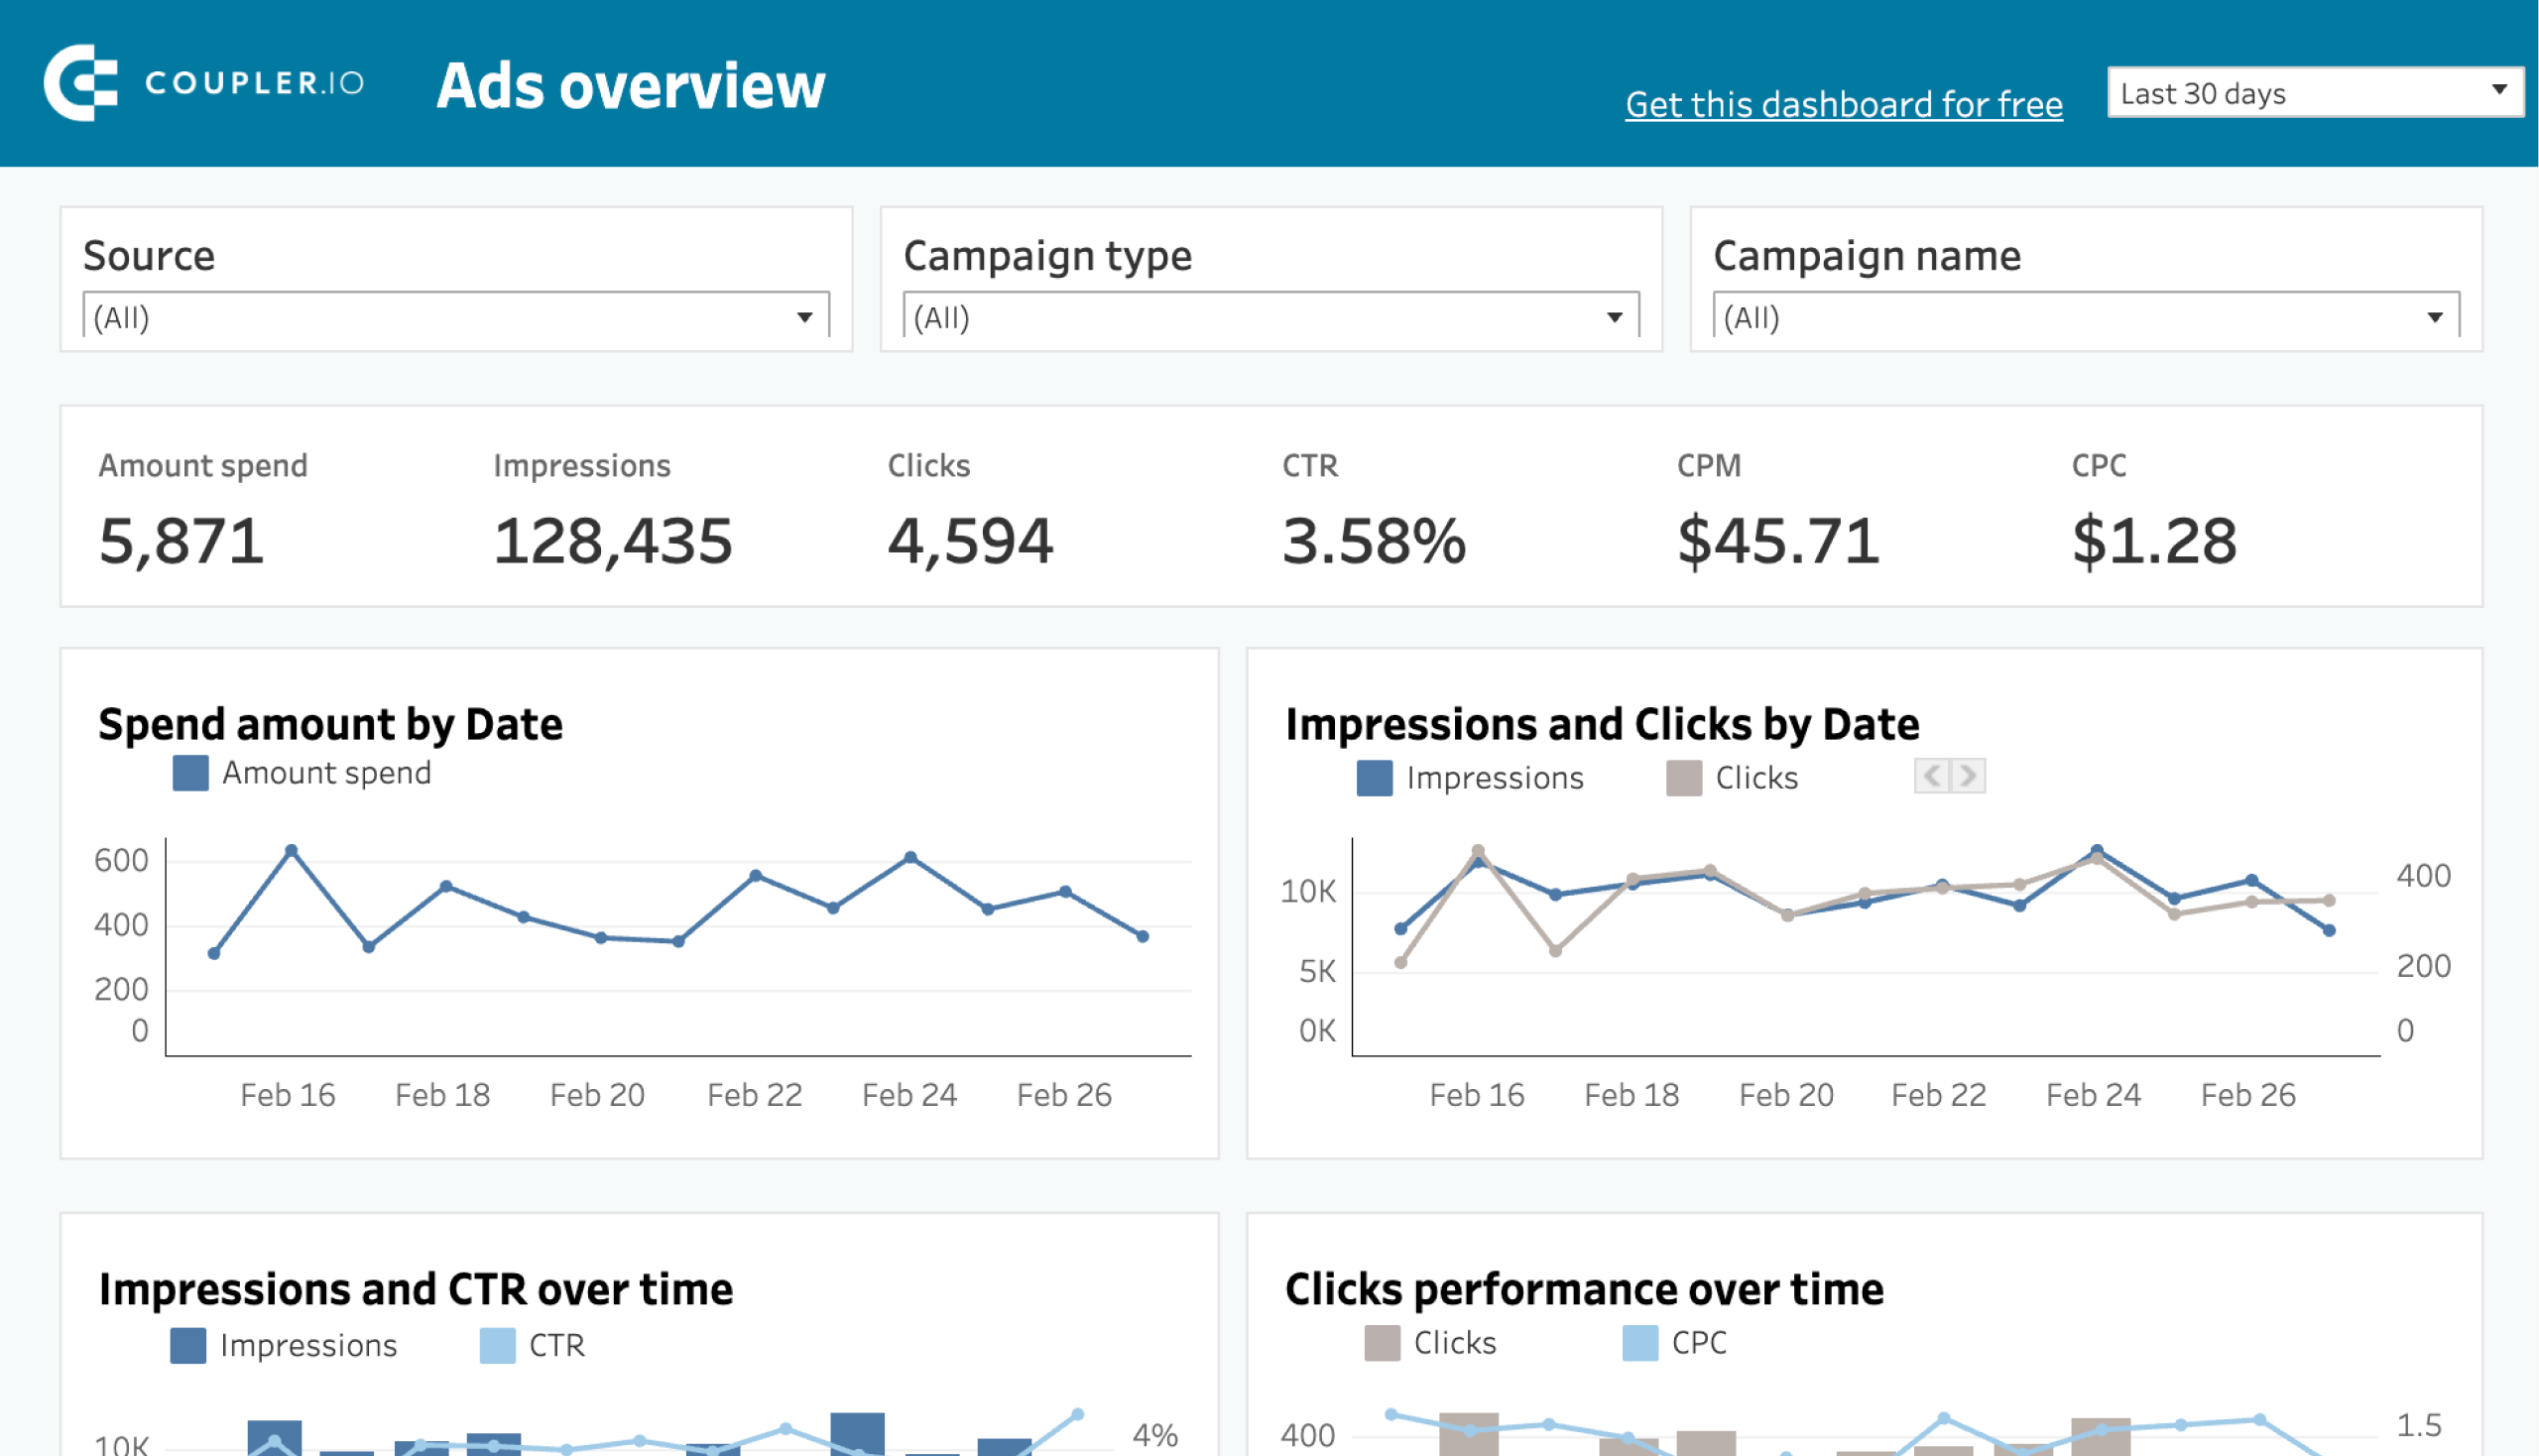
If you use TikTok for advertising campaigns, our multi-channel PPC dashboard lets you analyze your TikTok Ads performance alongside other video advertising platforms like Facebook Ads, Google Ads, LinkedIn Ads, Microsoft Ads, and others. As a result, you can compare what works best and what underperforms.
This is particularly useful when you run similar video ad campaigns across TikTok, Instagram, and YouTube – you can directly compare which platform delivers better results for your video content.
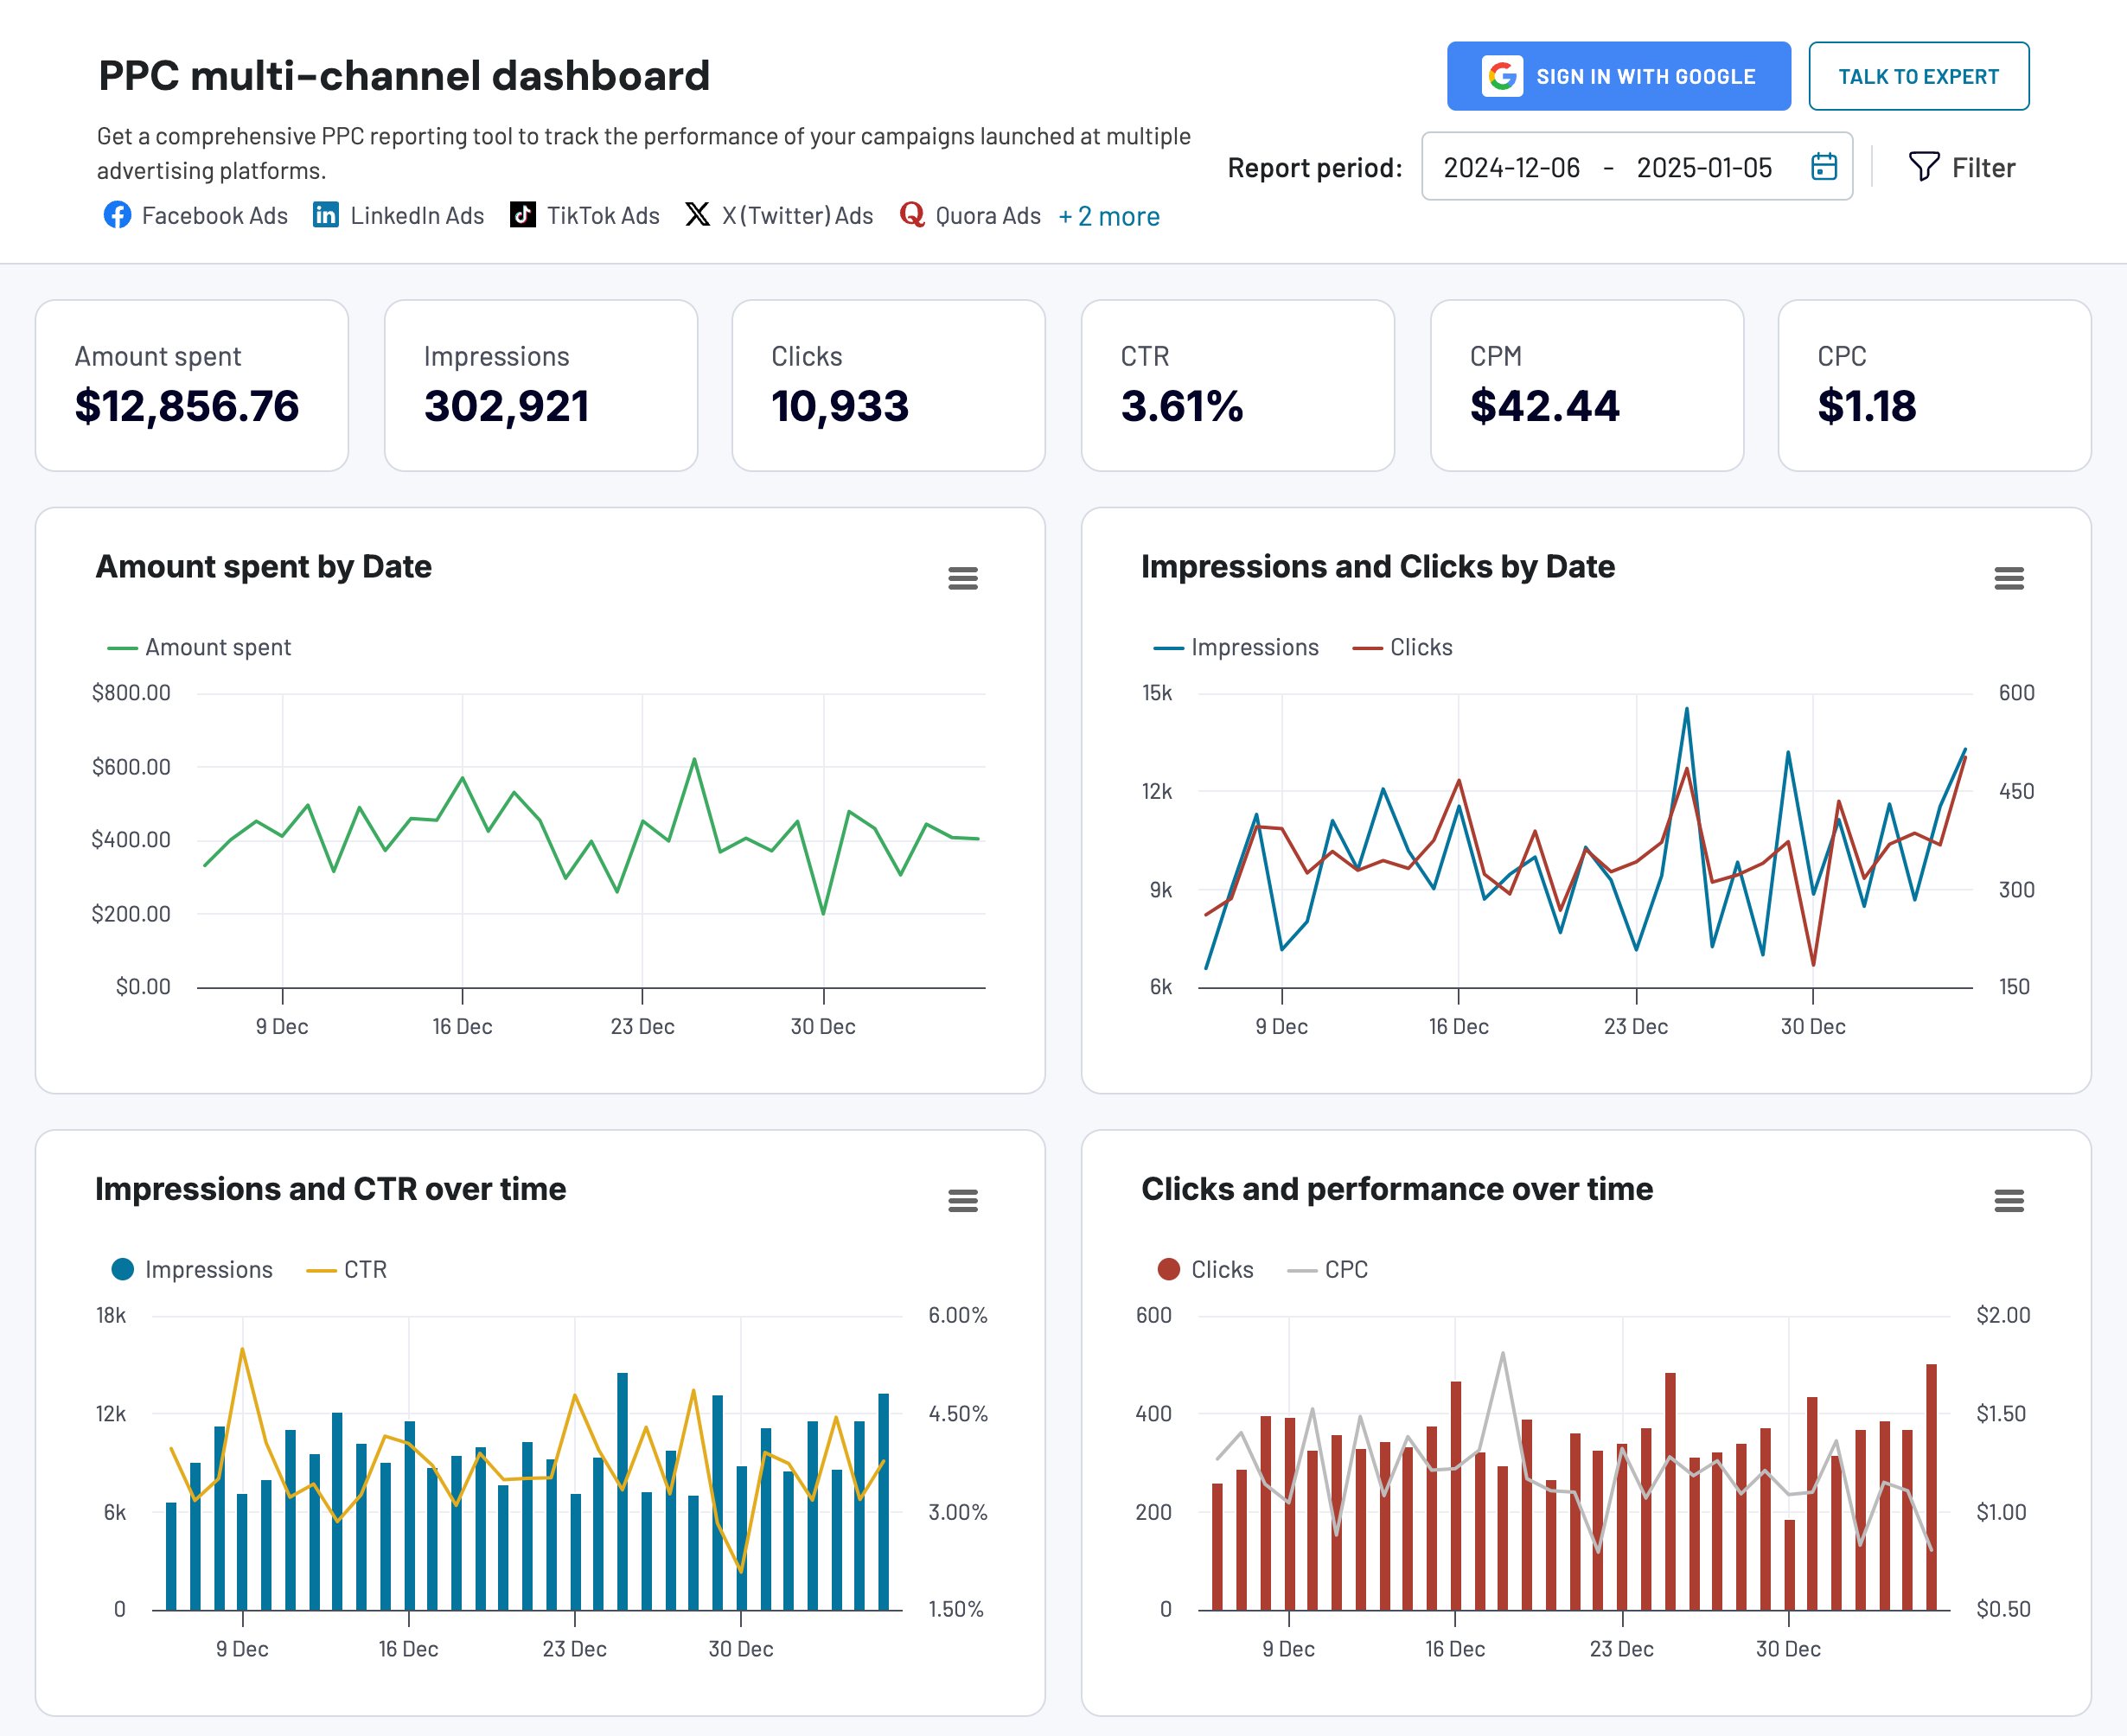
The dashboard helps you answer key questions about your TikTok Ads performance:
- How do your TikTok video ads compare to similar content on Instagram and YouTube in terms of cost per view?
- Which platform gives you better engagement rates for the same video ad?
- Are your TikTok ads more cost-effective than video campaigns on other platforms?
- How do conversion rates differ between TikTok and other social media platforms?
Instead of switching between TikTok Ads manager and other platform interfaces, you can access all your video campaign data in one place. The dashboard lets you:
- Filter performance data by date to track daily or annual trends
- Monitor specific metrics like cost per click, cost per impression, and cost per action
- Compare TikTok campaign costs and results with your other video ad channels
- Analyze combined performance across all your video advertising platforms
The dashboard is also available as a template for Google Sheets, Looker Studio, Power BI, and Tableau. If you’re interested in any of those, pick the one you would like to get started. Select the template you need and check its Readme tab to see how to use it.
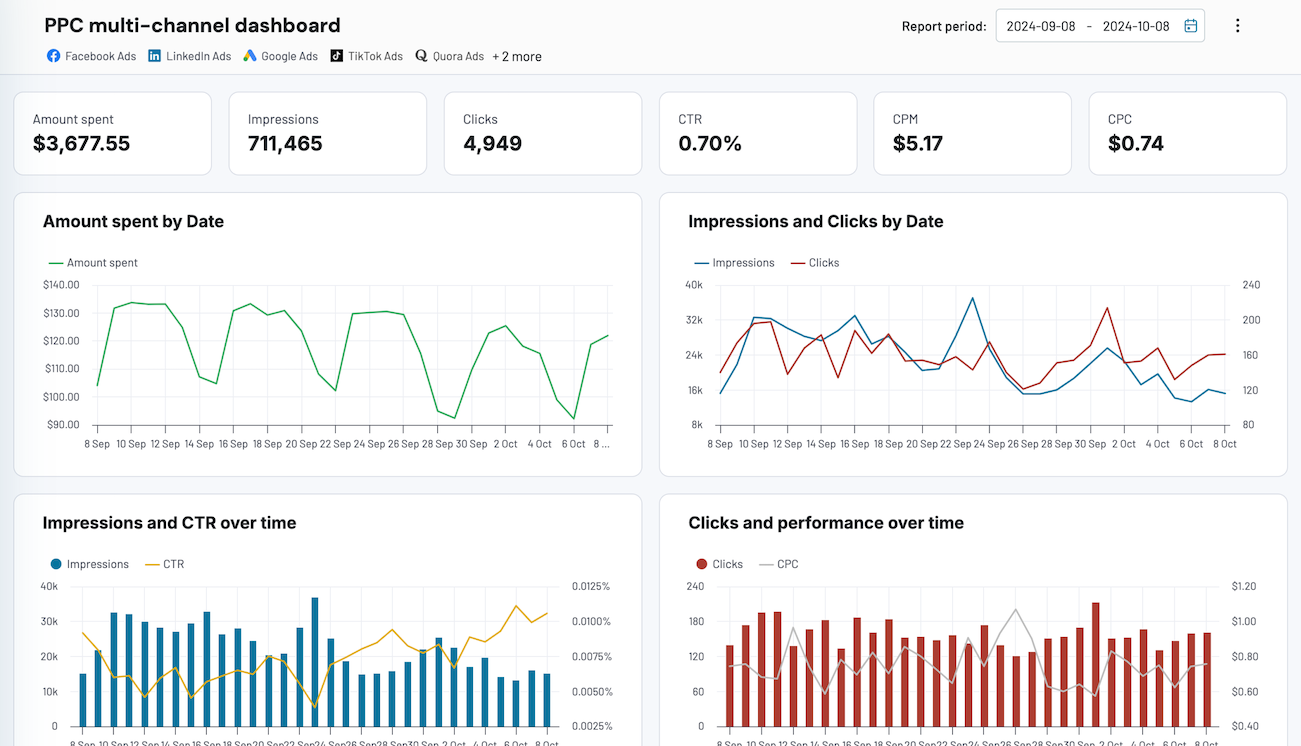


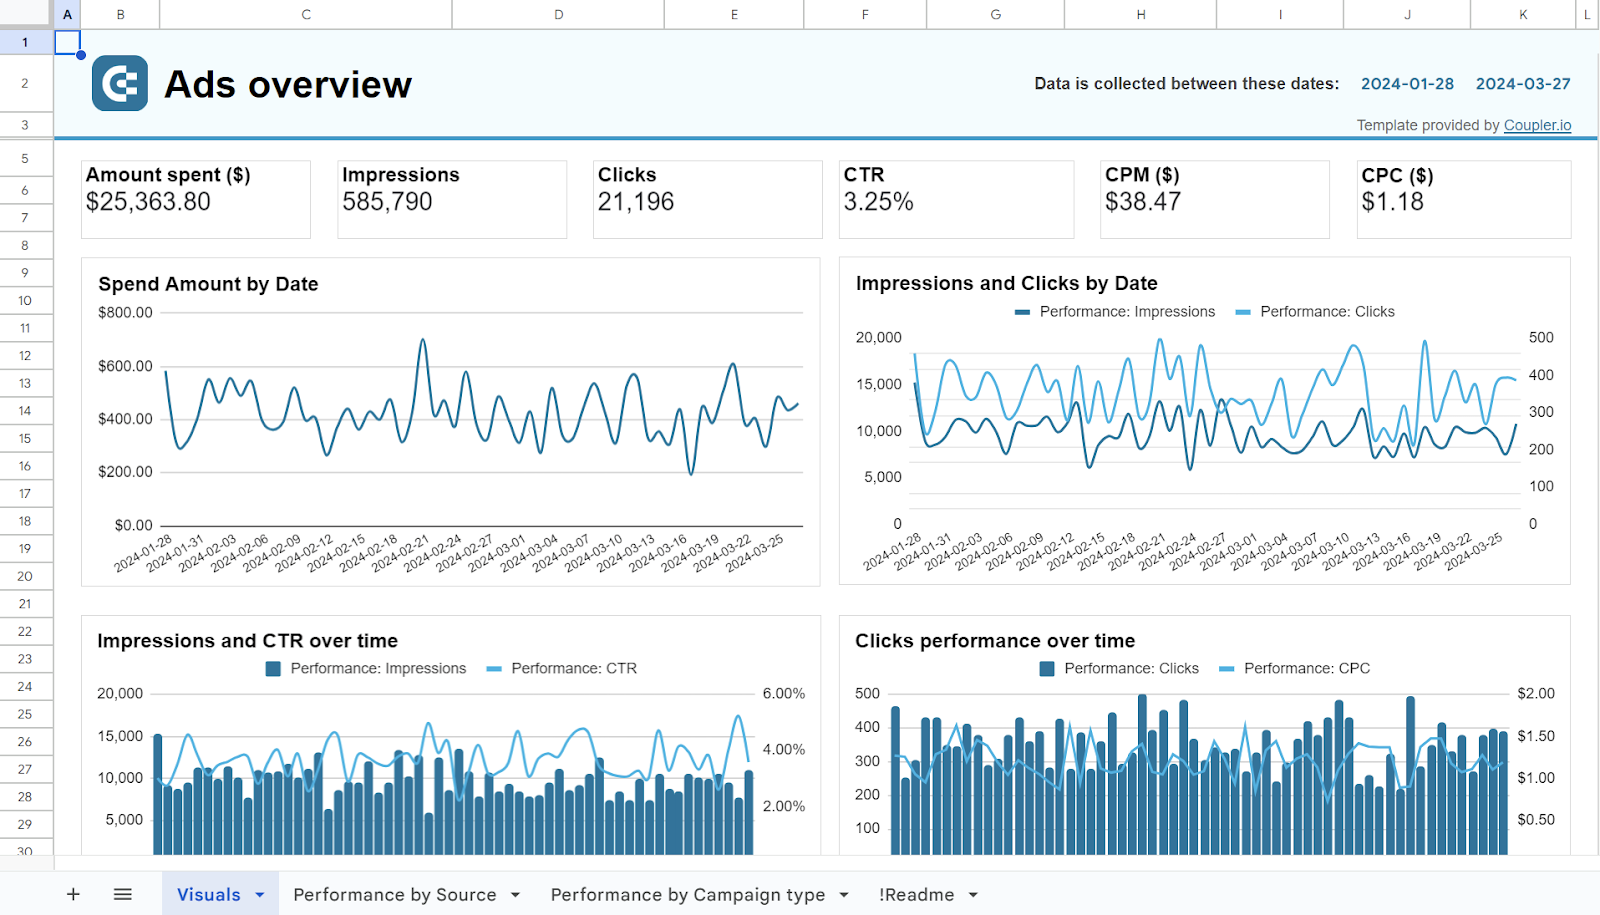




For more on this topic, have a look at our article about TikTok reporting templates.
Why you should automate data flows rather than manually export TikTok data
TikTok’s native analytics tools come with significant constraints that can hinder your long-term content strategy and performance tracking. TikTok’s View Analytics section only allows you to download data for the past 60 days. This creates serious challenges:
- Historical data beyond 60 days becomes inaccessible
- Long-term performance comparisons are impossible without manual tracking
- Seasonal content insights require you to manually collect data every month
- Year-over-year reports demand constant manual exports before data disappears
When you create data flows from TikTok in Coupler.io, it continuously pulls your TikTok data and preserves it indefinitely. As a result, you build a comprehensive historical dataset that goes far beyond TikTok’s 60-day window. You can analyze trends from months or even years ago without worrying about data loss.
You set up the data flow once, schedule the refresh, and your TikTok metrics land wherever you need them without any manual work. Reports update themselves, and if you’ve connected AI tools, you can ask questions about the latest data at any time. You focus on content creation instead of report maintenance.
Automate TikTok data analysis and reporting with Coupler.io
Get started for freeHow to manually request data export on TikTok
Coupler.io handles the connection, scheduled refresh, data transformations, and AI analytics for you. That’s the path for any recurring TikTok reporting. But if you need a quick one-time download of your TikTok data, here are the two native options:
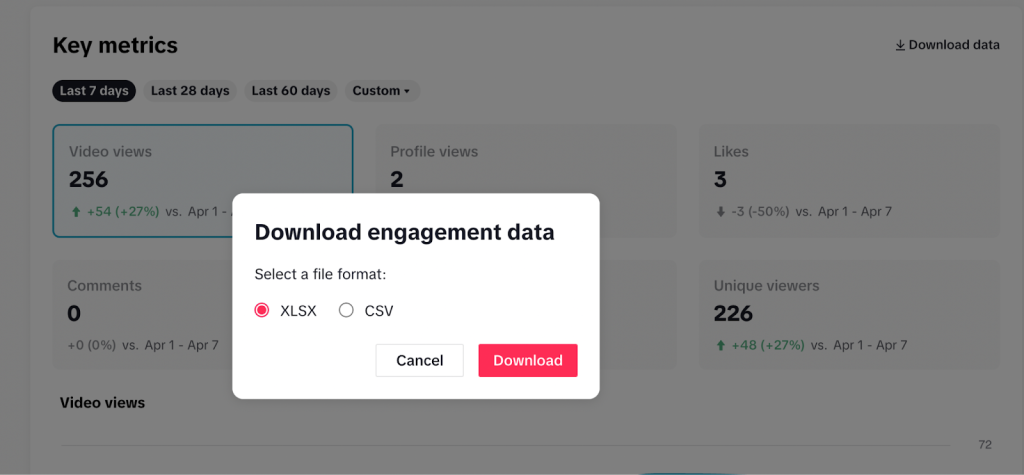
Method 1: Download analytics from the web version (60-day limit)
The web version provides quick access to recent performance data. This option gives you data on video views, profile views, comments, and other key metrics for the past 60 days. Once data ages beyond this window, it’s no longer accessible through this method.
Method 2: Request TikTok data through the mobile app
Alternatively, you can request your data through the mobile app. The Request Data feature provides a comprehensive file that includes all your profile details and activity logs, extending beyond the 60-day window. However, processing this request can take a few days, and the data often comes in JSON format, which may need further tools for analysis. Here’s how you can request your TikTok data:
- In the TikTok app on your Android and Apple devices, click Profile at the bottom.
- Click the Menu button at the top right corner, then click Settings and Privacy.
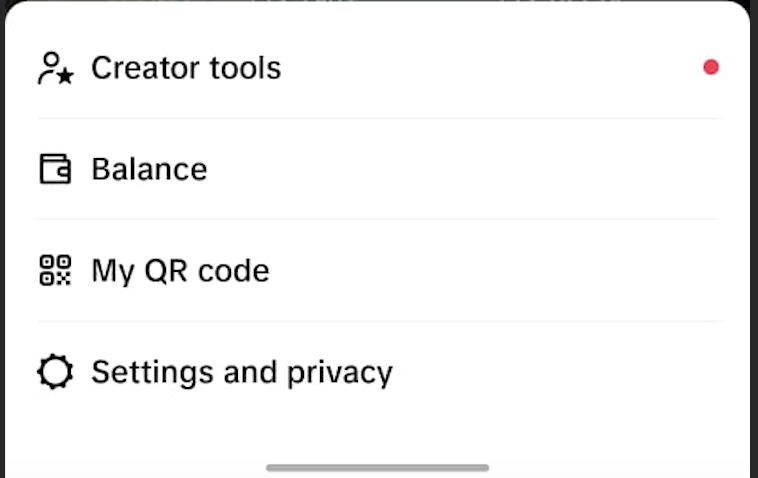
- Tap Account, then Download your data.
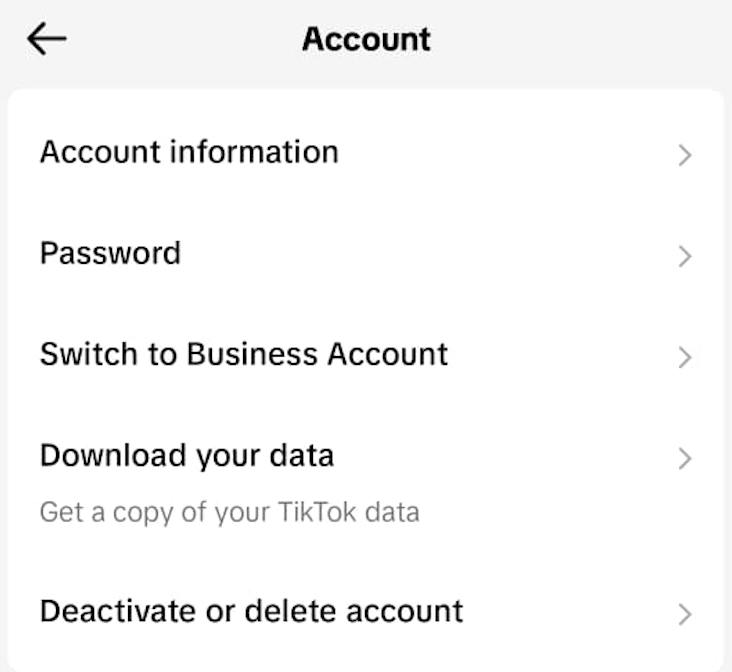
- Select the data to download. You can choose all information associated with your account, such as comment history, privacy settings, chat history, etc. or select specific data categories.
- Select the file format, either TXT or JSON, and tap Request data.
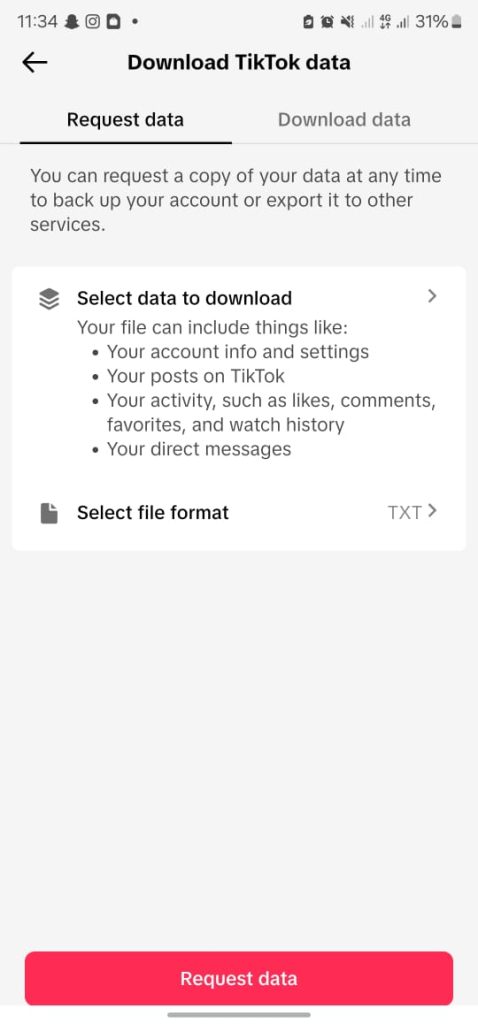
TikTok will process your request and make the data file available through the Download data tab. This typically takes several days.
Since report generation isn’t automated, you’ll need to manually create and download reports whenever needed. While this method might be suitable for occasional reports, it’s not ideal for continuous monitoring of content performance on TikTok. Automation is crucial for this purpose.
Setting up the automated export is step one. The real value comes from what you do with the data afterward. Use dashboard templates to track performance visually, connect spreadsheets for custom analysis, or ask AI Agent questions about your TikTok data in plain English. Coupler.io keeps the data flowing on schedule so you can spend time on content, not on exports.
Automate reporting with Coupler.io
Get started for free