Ten minutes from now, you’ll have a self-updating Google Ads report that covers spend, keyword health, conversions, and other metrics you need. And yes, with Coupler.io, it’s as straightforward as it sounds. Let’s build it.
Step 1: Connect Coupler.io and ask for your report
The quickest way in is Coupler.io’s built-in AI Agent, which works right on your data with nothing extra to set up.
To get started, create a free Coupler.io account, open the AI Agent, and start the conversation (ask for the report you want).
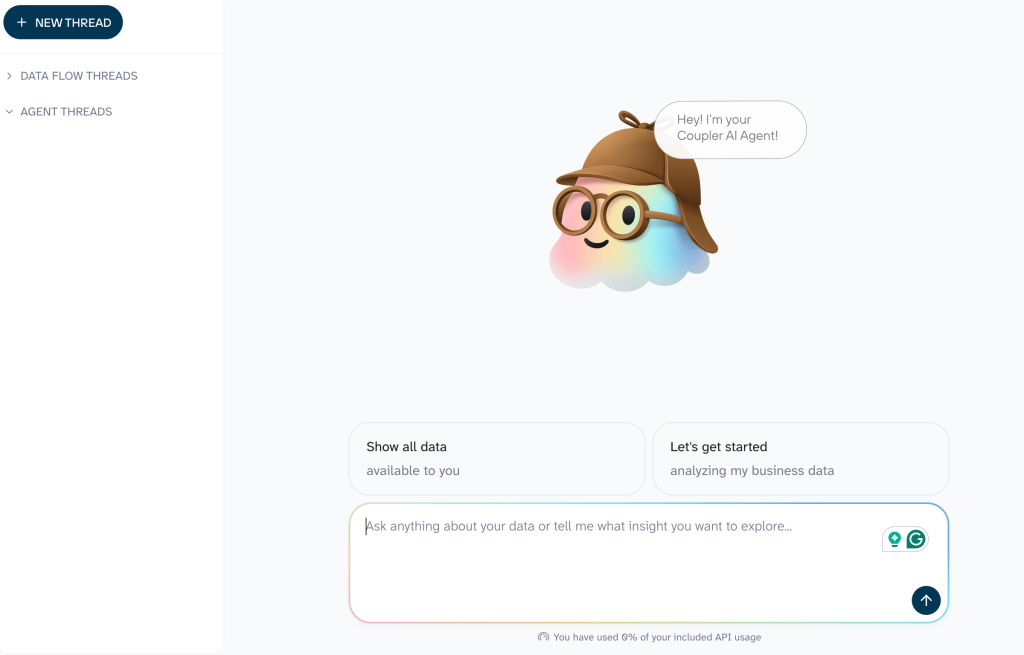
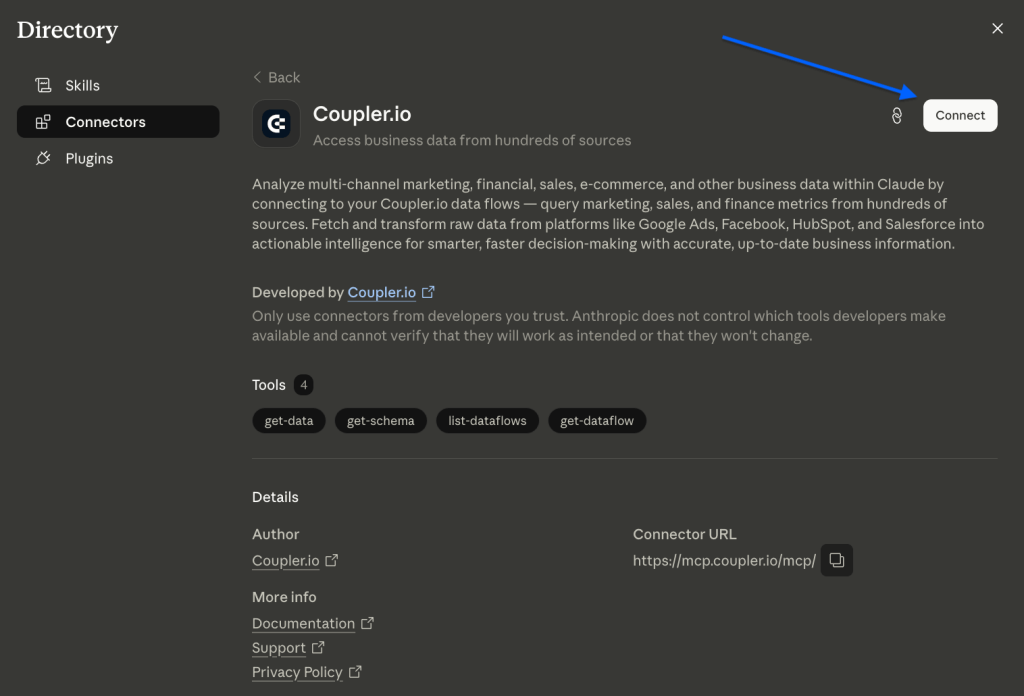
Prefer to stay in the AI tool you already use? Link Coupler.io to Claude or ChatGPT (on the AI’s Connectors page), or to another LLM instead, and ask there through the same account.
Step 2: Describe the report you want
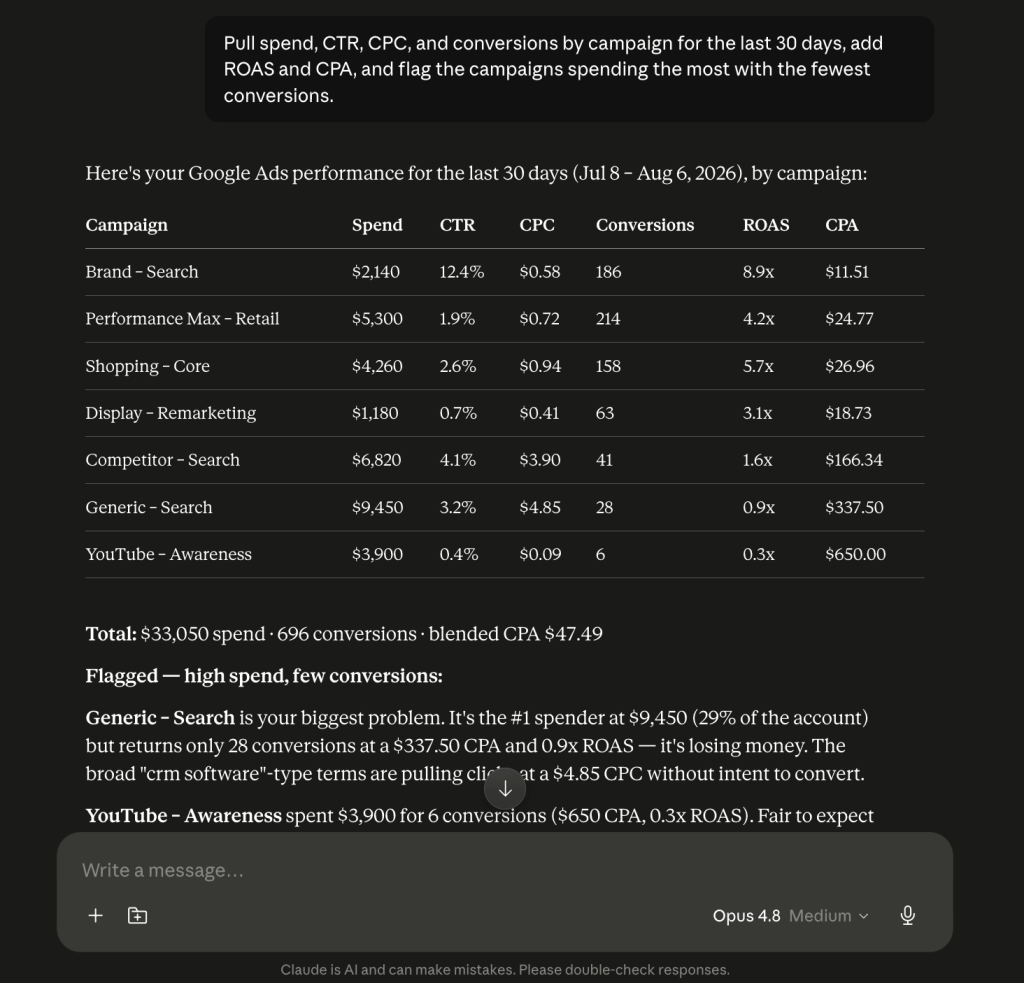
Say what you’re after, for example: “Pull spend, CTR, CPC, and conversions by campaign for the last 30 days, add ROAS and CPA, and flag the campaigns spending the most with the fewest conversions.”
Coupler.io checks whether your Google Ads account is already connected. If it isn’t, it asks you to authorize your account first. You link each data source yourself, so you’re always in control of what’s connected. Then it pulls the data and answers: it ranks, flags, and compares whatever you asked about, with Coupler.io’s Analytical Engine running the actual math so the numbers are calculated, not guessed.
| Why not just connect Google Ads straight to your AI tool? You can, and for a single account it works fine. But one Coupler.io connection covers Google Ads plus 400+ other sources through the same chat, so adding the next one later is one more line in the conversation instead of another setup. The data also arrives structured (you can use the available data management features) and refreshes on a schedule. One more key differentiator is the business context Coupler.io allows you to add to your data: what your target CPA is, what counts as a conversion. So when you ask which campaigns are underperforming, the AI judges them against your real benchmarks. |

See performance measured against your real targets
Get started for freeStep 3: Keep asking: that’s the “every question” part
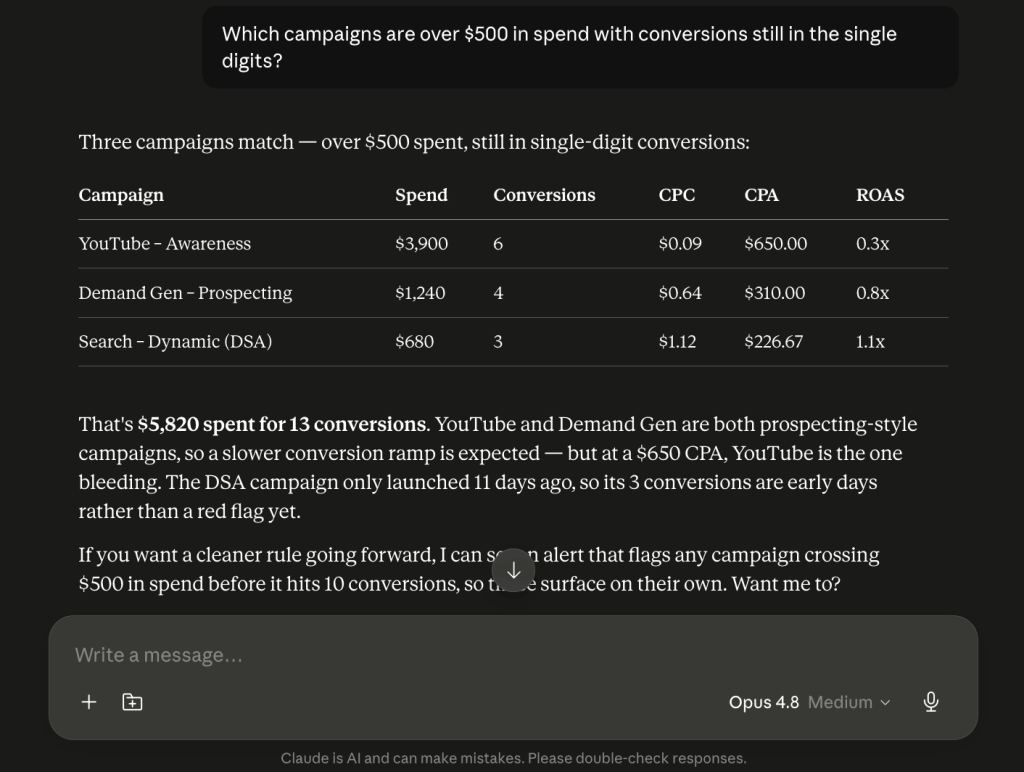
Because your live Google Ads data now sits behind the AI, one report really does answer everything. You keep asking in plain language: which campaigns are over $500 in spend with conversions still in the single digits, how this week’s ROAS by campaign compares with last week’s, etc. Every answer comes from the latest sync, not a stale export, so what you read Monday morning already reflects the weekend.
Need the numbers laid out without opening a chat, or a live view to hand a client who won’t? Ask Coupler.io to send the same report to Google Sheets, Google Data Studio (formerly Looker Studio), and 20+ other reporting tools and data warehouses.
Get Google Ads answers in minutes with Coupler.io
Get started for freeThe setup is as easy as 1-2-3. However, if you encounter any roadblocks along the way, feel free to book a demo to get all your questions answered.