A seamless integration between Klaviyo and Power BI lets you build reports that update on a schedule, share campaign performance with stakeholders, and do much more than Klaviyo’s built-in reporting.
You can also use the same data pipeline for conversational analysis of your email marketing data in AI tools. Learn how to connect Klaviyo to Power BI with Coupler.io for versatile reporting and analytics needs from dynamic dashboards to AI-powered insights.
Set up a Klaviyo to Power BI integration by Coupler.io
Power BI does not have a built-in way to connect to Klaviyo. However, Coupler.io offers a Power BI connector to over 400 business data sources, including Klaviyo. This data integration platform also supports AI analytics to complement your Power BI dashboards. It only takes a couple of steps to set up a Klaviyo Power BI integration.
Click Proceed in the form below, where we’ve preselected Klaviyo as a source and Power BI as a destination. You’ll be prompted to create a Coupler.io account for free with no credit card required.
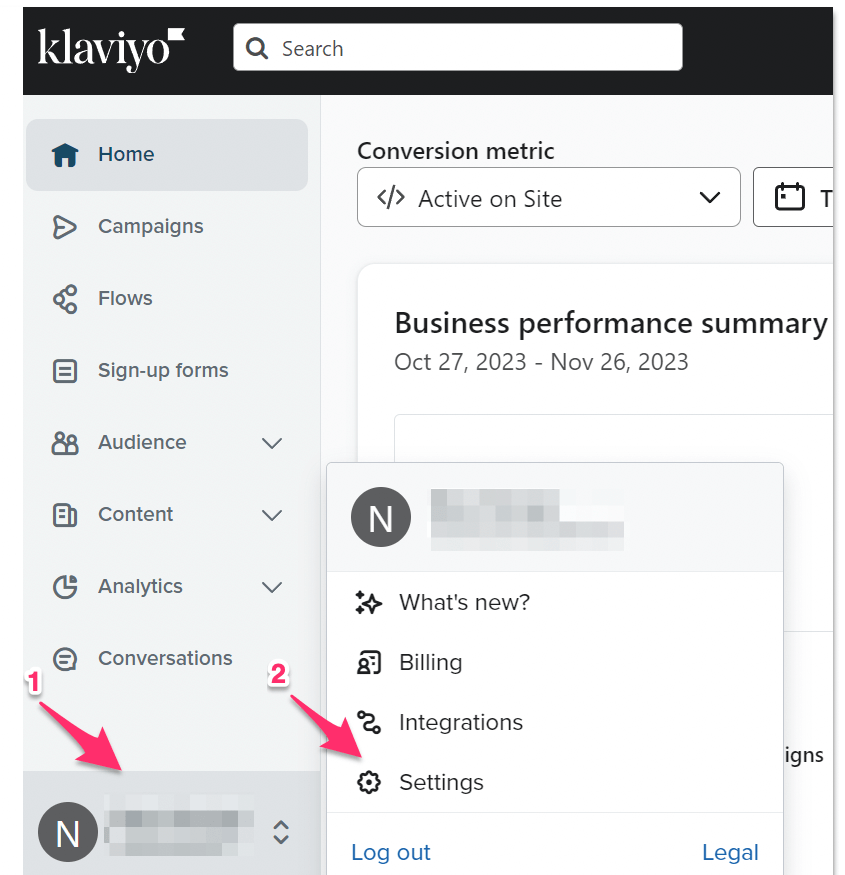
Step 0: Connect your Klaviyo account
- First, you need to connect your Klaviyo account with Coupler.io. This requires the private API key label and private API key secret. Go to the Settings of your Klaviyo account.
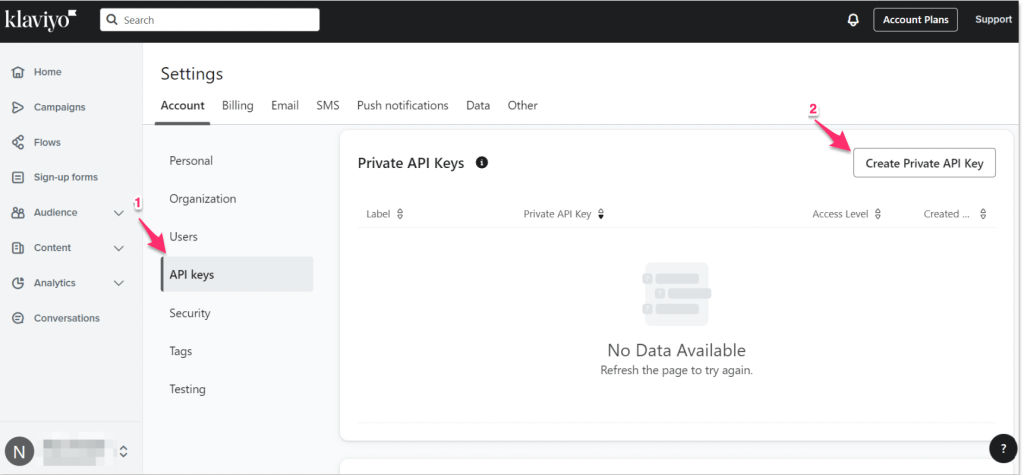
- Click API keys in the Accounts tab. Under the Private API Keys section, click Create Private API Key.
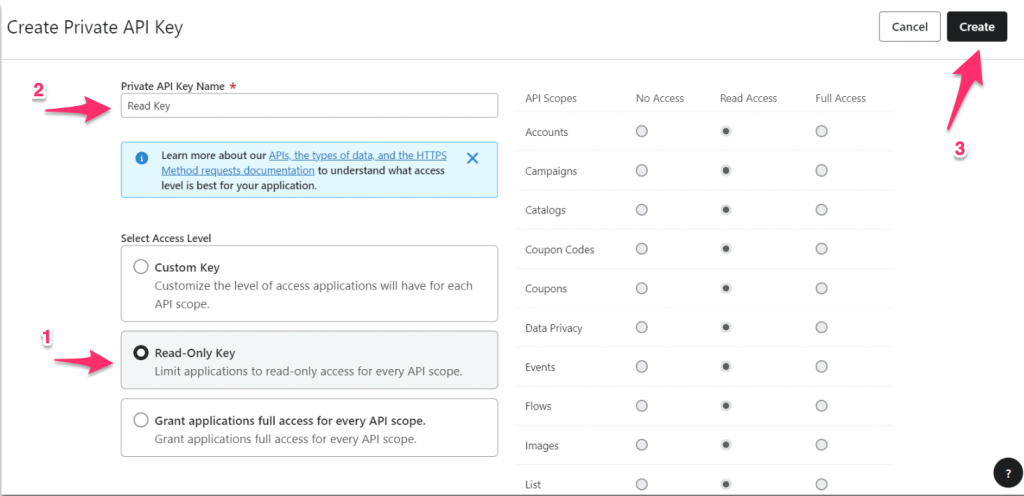
- Select the access level for your private API key. We are going with the Read-Only Key access level for this example. The Private API Key Name box is to give it a label, so don’t forget to do that. And finally, click Create.
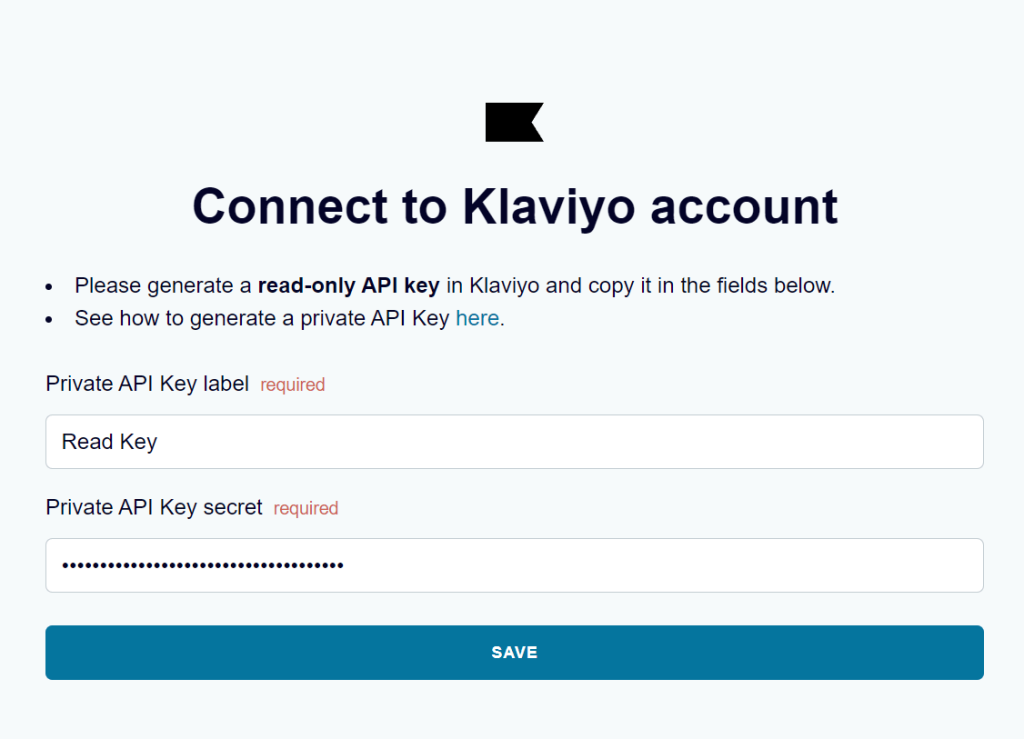
- Your Private API key is ready. Copy it and go to Coupler.io to insert the Private API Key label and Private API Key secret you just created, and click Save.
Step 1: Collect data from Klaviyo
Coupler.io and Klaviyo are now connected. It’s time to select a data entity that you wish to export from Klaviyo. For the Report, you’ll also need to specify start/end dates and metrics to include in the report.
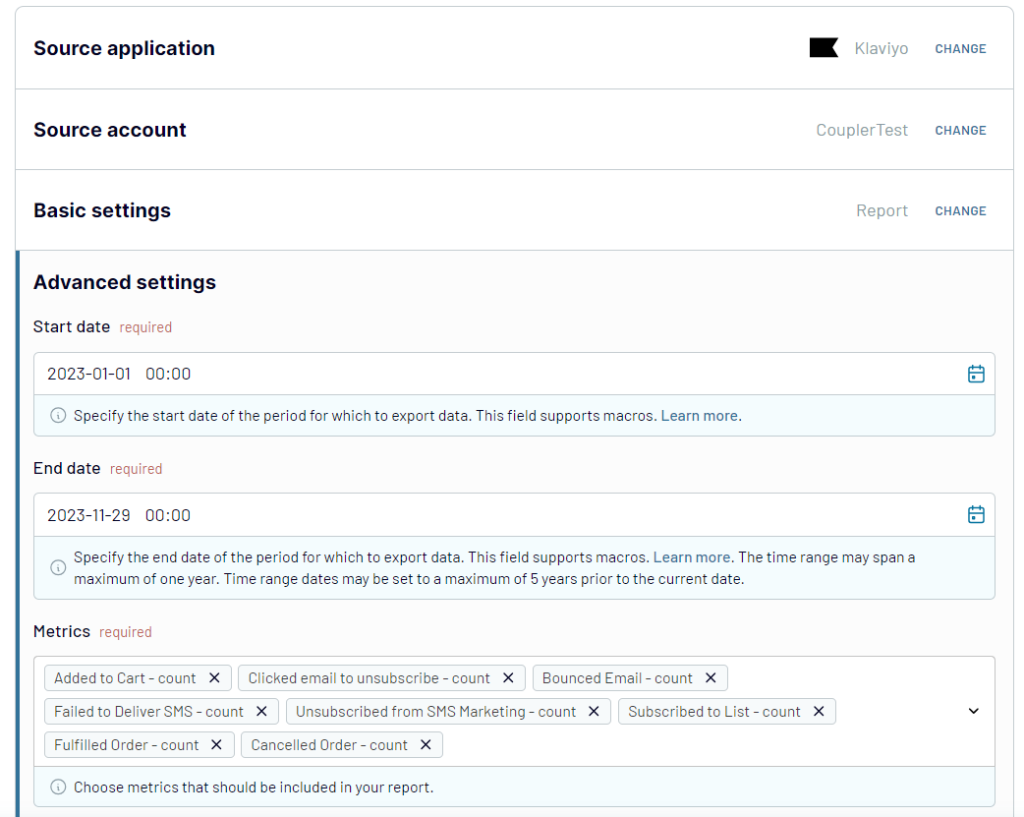
You can also add more sources to the same data flow if you need to combine data from multiple Klaviyo accounts or from other apps entirely.
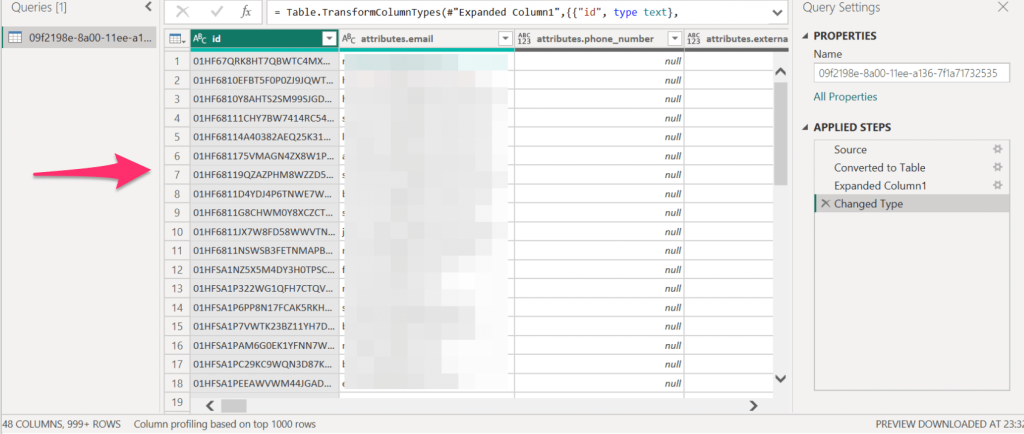
Step 2: Transform Data
Now that our source is ready, it’s time we transform our data and make changes as per our data analysis needs:
- Column management: Manage any hidden, shown, grouped, and ungrouped columns.
- Filter: Filter your selection based on AND/OR conditions (one condition or multiple).
- Sort: You can sort your selected column data in a desired order.
- Formula: You can also have computable formulas to give a value based on existing data. Please read our guide on Adding formula-based custom columns.
- Aggregate: Group and summarize your data, for example total revenue by campaign or average open rate by segment.
- Blend data: Combine datasets from multiple sources or accounts into one table before it reaches Power BI.
If you plan to use AI tools with this data set later, these settings also control what AI can see. Columns you hide and rows you filter out stay excluded from AI queries.
Step 3: Load data and schedule refresh
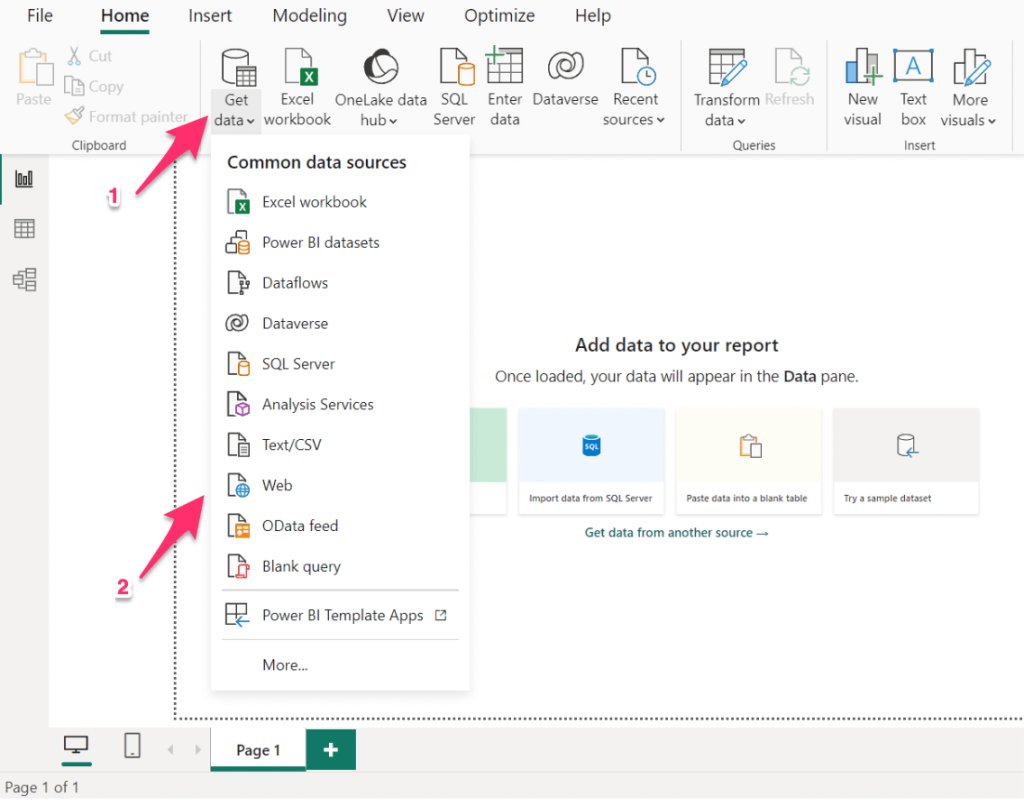
Follow the in-app instructions to load data from Klaviyo to Power BI. You’ll need to generate and copy the integration URL and use it in Power BI desktop app – go to Get data > Web
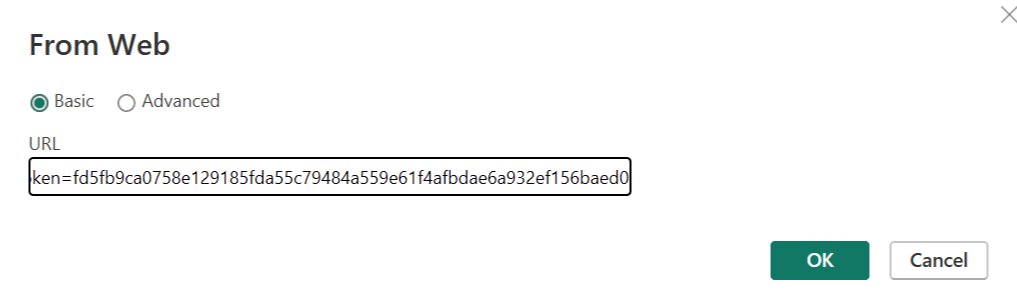
- Paste the Klaviyo Power BI integration link in the dialog box and click OK.
- When done, you will have a new query in the Power Query Editor with the export list, i.e., the Profile list from Klaviyo.
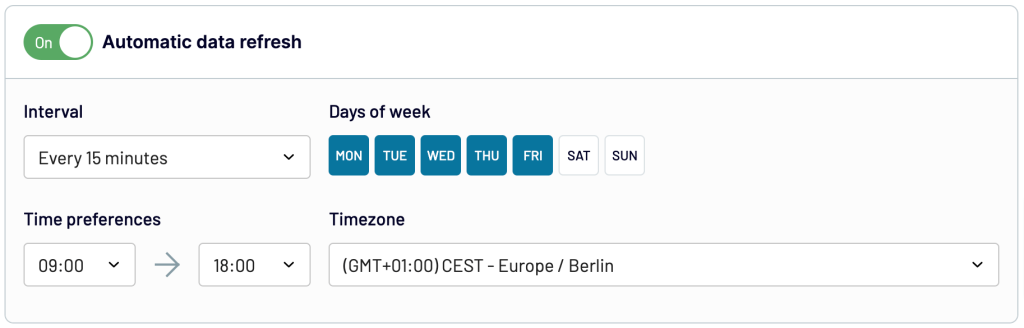
- Get back to Coupler.io and turn on the Automate Data Refresh button. You can schedule data exports at intervals of up to 15 minutes.
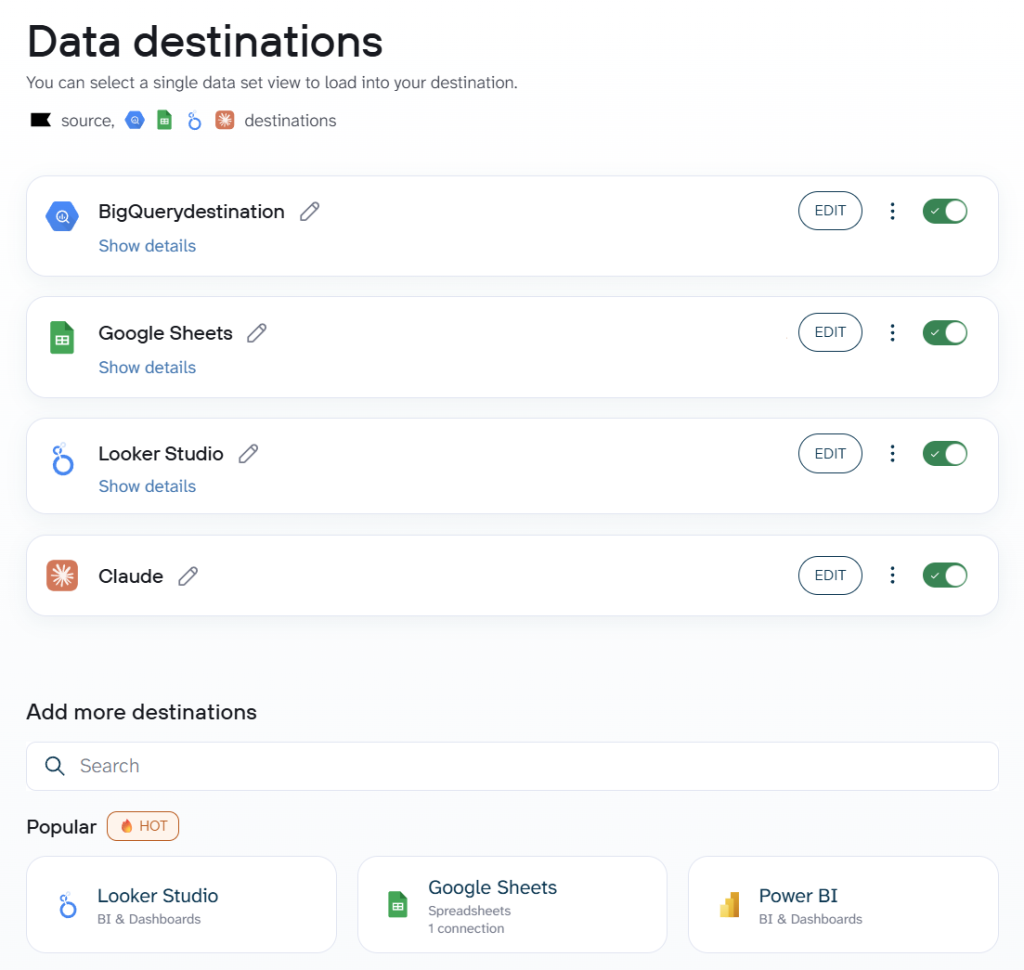
That’s it! The entire process of connecting Klaviyo to Power BI took around 2 minutes. The same data flow can also send Klaviyo data to other destinations at the same time (Google Sheets, Looker Studio, BigQuery, Claude, etc.)
Apart from Klaviyo, with Coupler.io, you can automatically collect data from many other ad and marketing apps. For example, GA4, Google Ads, Mailchimp, LinkedIn Ads, Instagram, Facebook Ads, and others. This means you can easily automate all marketing reporting in your organization with one comprehensive solution.

Connect Klaviyo to Power BI with Coupler.io
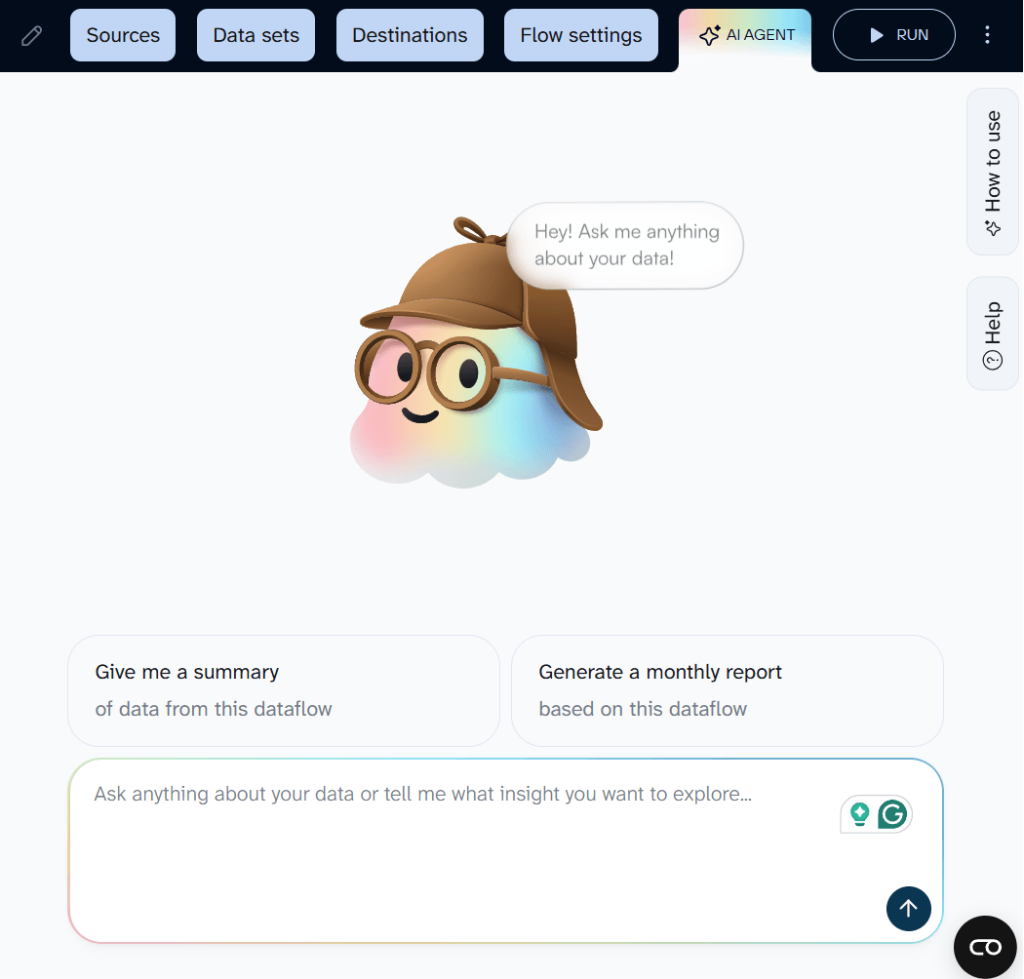
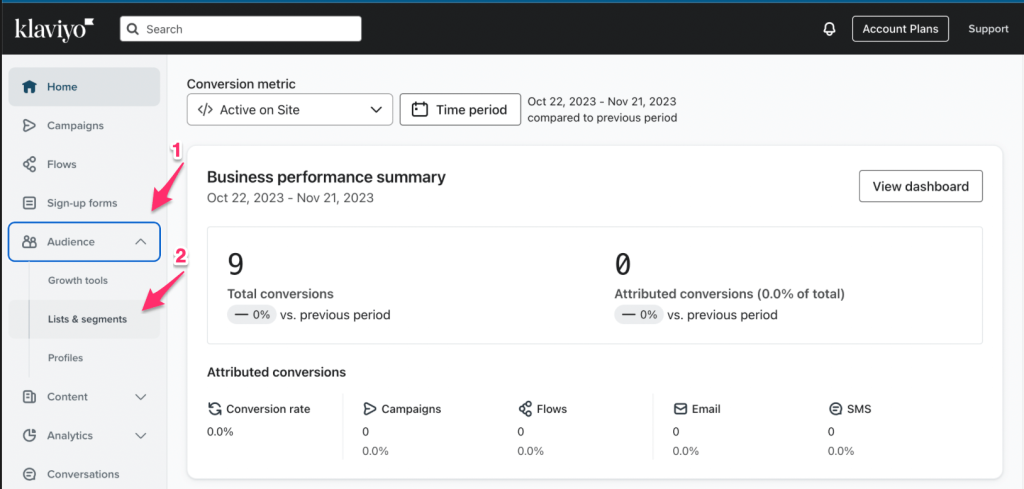
Get started for freeBonus step: Analyze your Klaviyo data with AI Agent
Power BI is good for structured dashboards and DAX-based calculations. However, it won’t provide you with a quick answer to a specific question like which campaign had the best click-to-order rate last quarter, or whether your welcome flow is cannibalizing other automations. But AI will and you do not necessary need to use an external AI tool for that.
Coupler.io has a built-in AI Agent that works on the same data flow you just set up. Click the AI Agent tab and type your question. The Analytical Engine runs the query against your dataset, does the math, and passes confirmed numbers to the AI.
What data you can load from Klaviyo to Power BI
When you set up a data flow, you pick a data entity that determines which dataset lands in Power BI. There are two groups:
- Reports – aggregated performance data over a date range
- Core entities – raw records you can filter and transform
Reports
| Name | Description |
|---|---|
| Metrics analytics | Account-wide event data (counts, sums, unique users) for events like “Placed Order,” “Opened Email,” or “Clicked SMS.” A good starting point for DAX measures and time-series visuals. |
| Campaign performance report | Delivery, opens, clicks, conversions, and revenue per campaign. Feeds campaign comparison tables and period-over-period trend charts. |
| Segment performance report | Member counts, additions, removals, and net changes per segment with hourly through monthly breakdowns. Useful for audience growth visuals and segment-level slicers. |
| Flow performance report | Delivery, opens, clicks, and conversions per automated flow over a date range. Lets you build flow performance comparisons in Power BI. |
| Forms performance report | Views, submits, submit rate, and closures per sign-up form. Good for tracking lead generation across forms in a single report. |
Core entities
| Name | Description |
|---|---|
| Campaigns | One-time email sends with message content, recipient estimates, send status, and channel settings. Use this when you need a raw campaign log to model in Power BI rather than pre-aggregated stats. |
| Profiles | Subscriber records with contact info, predictive analytics (churn risk), consent history, and push tokens. Feeds subscriber-level breakdowns, RFM models, or segmentation slicers. |
| Flows | Automated journey configurations (welcome series, abandoned carts, post-purchase sequences) with automation logic and individual messages. Useful for auditing or comparing flow setups. |
| Segments | Dynamic audience groups with their conditions and rules. Gives you a reference table for targeting criteria alongside performance data. |
| Forms | Sign-up form configurations, targeting rules, and submission data. Lets you compare acquisition forms in one Power BI report. |
Turn Klaviyo data into insights with our dashboard templates
While Power BI templates for Klaviyo are not yet available, Coupler.io offers several ready-to-use Klaviyo dashboards in Looker Studio. Each one showcases the metrics, charts, and analysis approaches that work well for email marketing reporting. If you’d like any of these as a Power BI template, let us know.
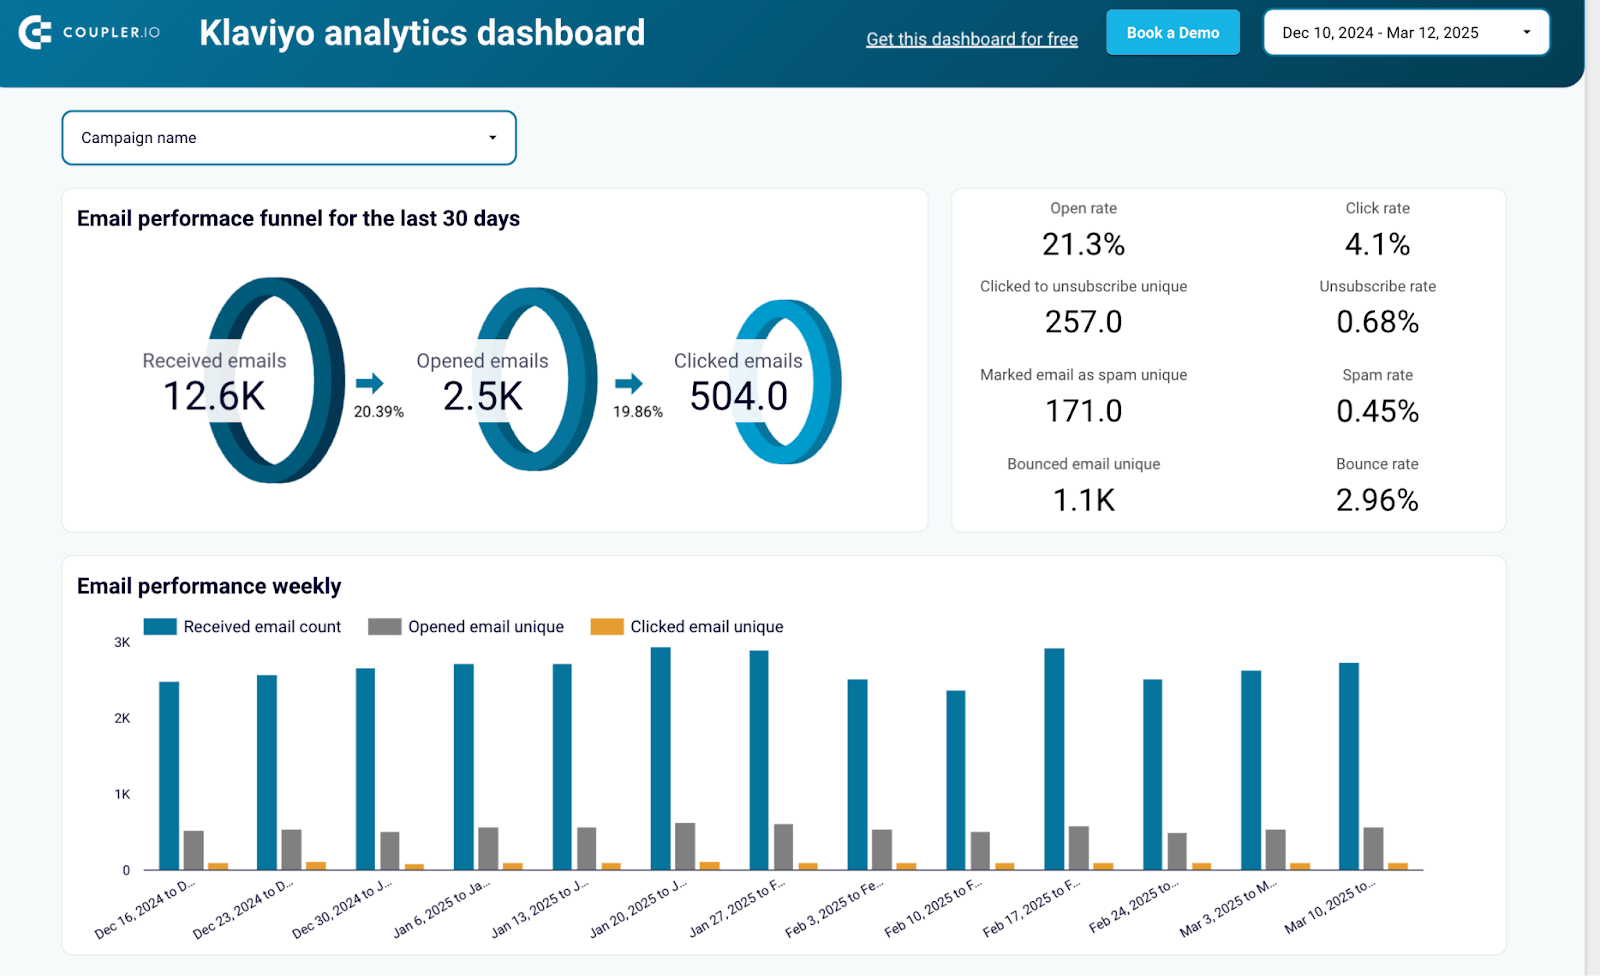
Klaviyo dashboard template
Track your email funnel from delivery to clicks, compare campaign performance side by side, and spot the best days to send based on weekly engagement patterns. A subscriber profile page gives you a demographic overview of your audience.
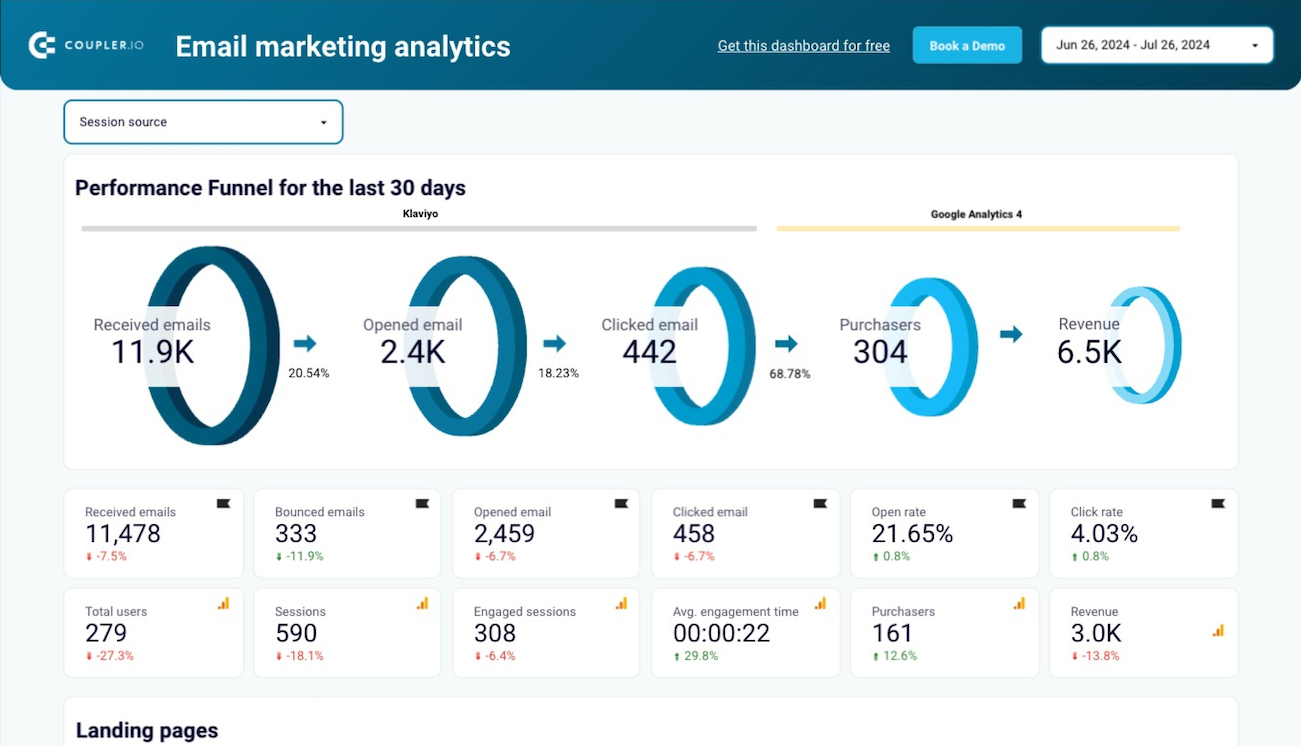
Email marketing analytics dashboard template for Klaviyo
This dashboard combines Klaviyo campaign data with GA4 website analytics. It shows which emails generate not just clicks but actual site engagement, purchases, and revenue. Landing page performance breakdowns help you identify where email traffic converts and where it drops off.
Klaviyo email marketing analytics dashboard
 Preview dashboar
Klaviyo email marketing analytics dashboard
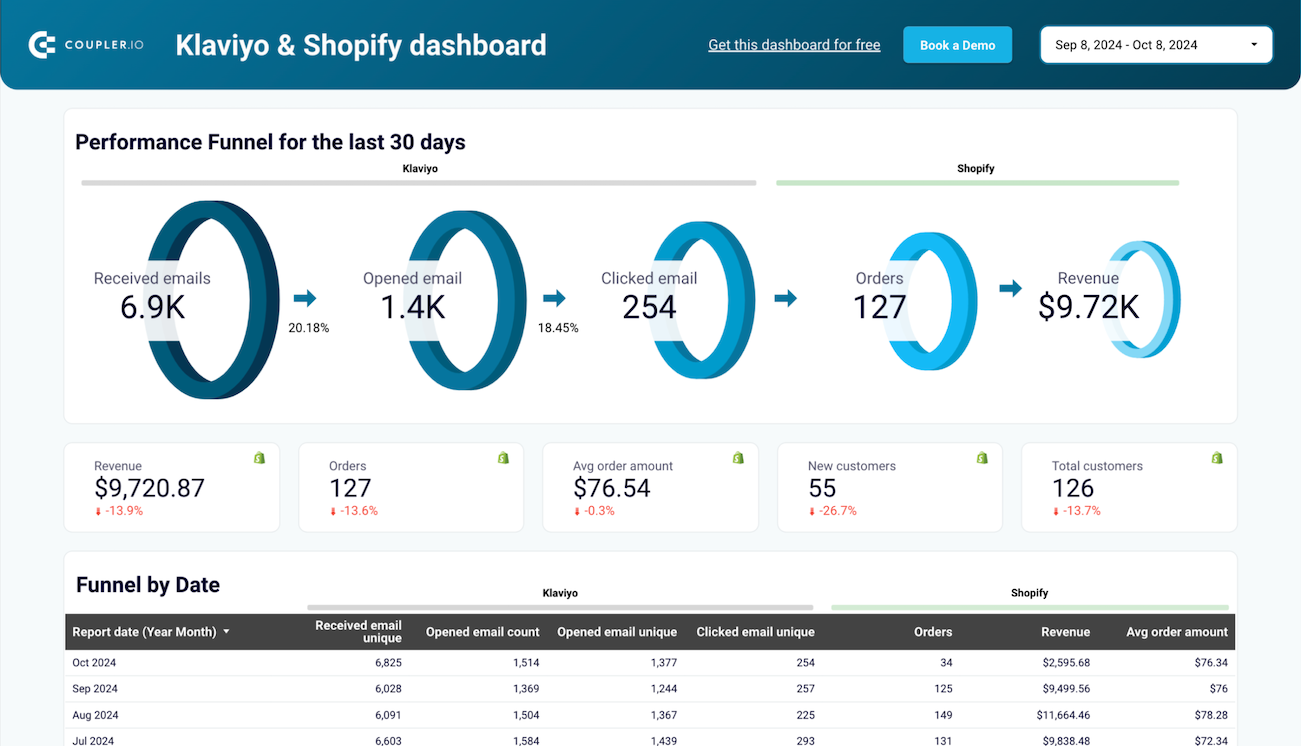
Preview dashboarKlaviyo email performance dashboard for Shopify
Built for Shopify stores running Klaviyo campaigns. It pairs email engagement metrics with order data to show which campaigns produce revenue and which products sell best through email. Monthly trend tables let you compare engagement and sales performance across periods.
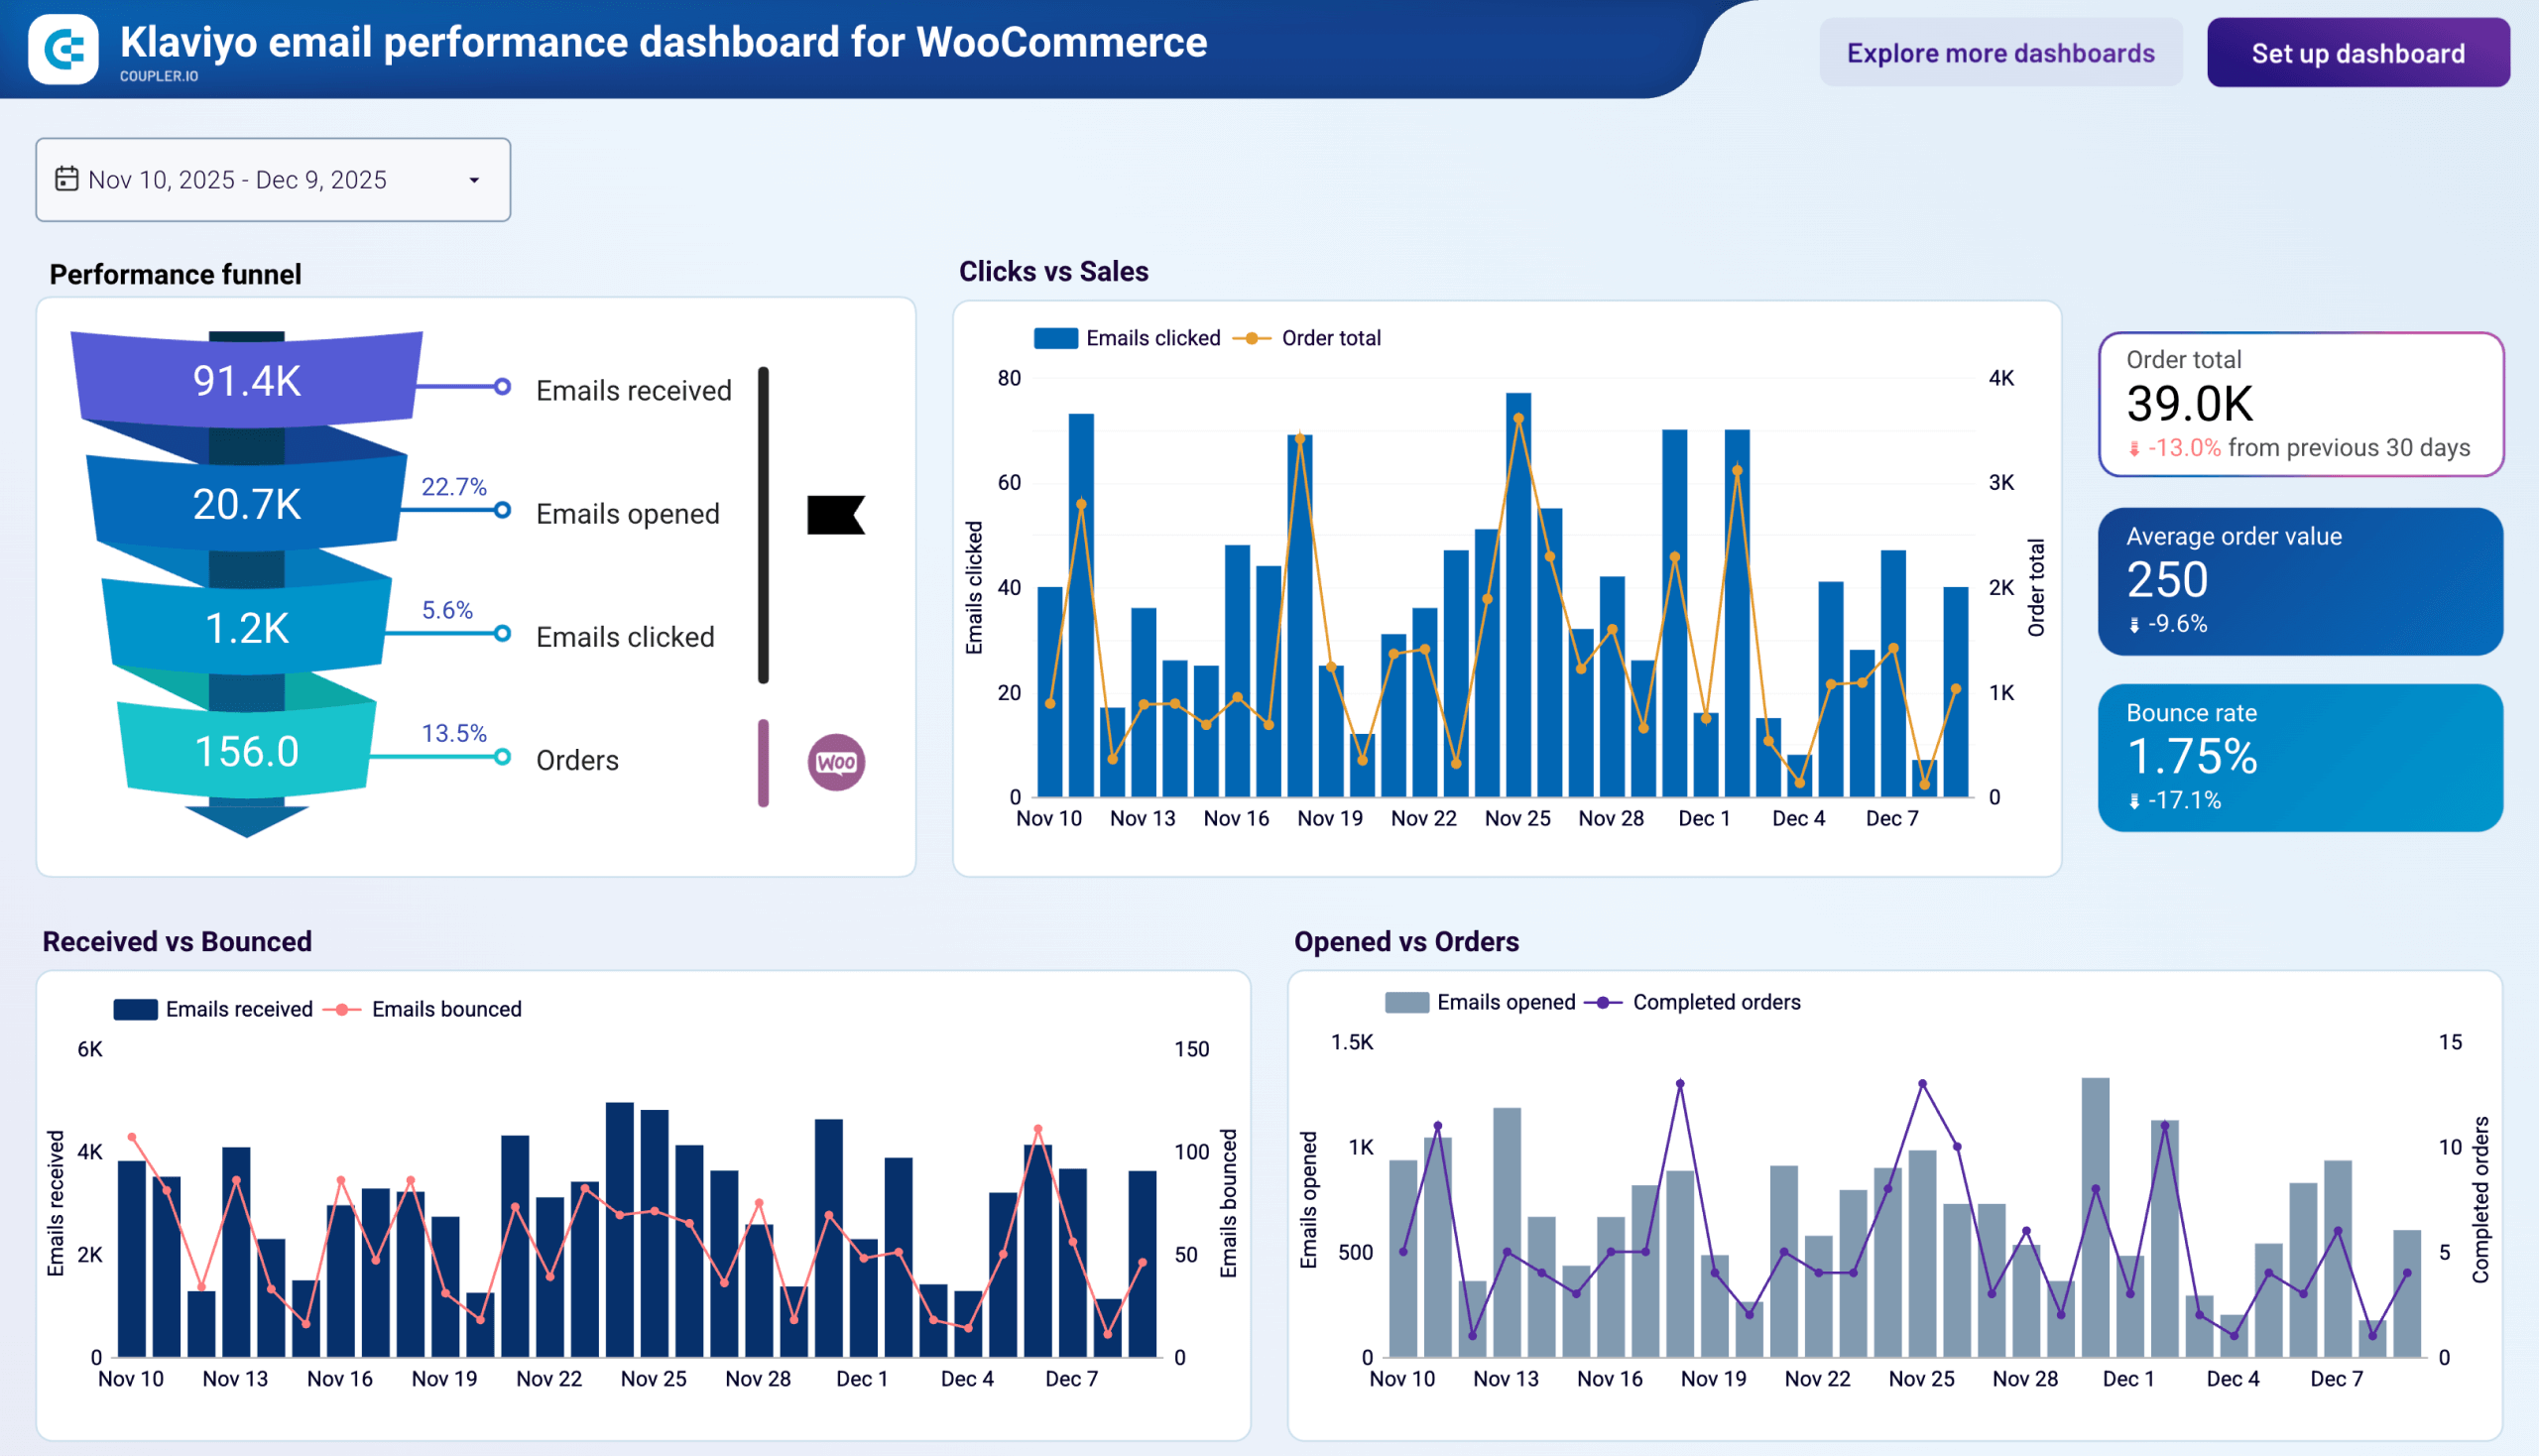
Klaviyo email performance dashboard for WooCommerce
 Preview dashboard
Klaviyo email performance dashboard for WooCommerce
Preview dashboardKlaviyo email performance dashboard for WooCommerce
The WooCommerce version connects Klaviyo email activity with store order data. It tracks where recipients drop off between delivery and purchase, flags bounce rate increases that could hurt sender reputation, and shows whether high-click days actually translate into orders or just traffic.
Klaviyo email performance dashboard for Shopify
 Preview dashboard
Klaviyo email performance dashboard for Shopify
Preview dashboardUnlock email marketing excellence and more with our all-in-one marketing dashboard
This is a Power BI dashboard that covers more than just Klaviyo. It pulls email marketing data alongside organic search, social media, and paid ads into one report, so you can compare channel performance in a single view.
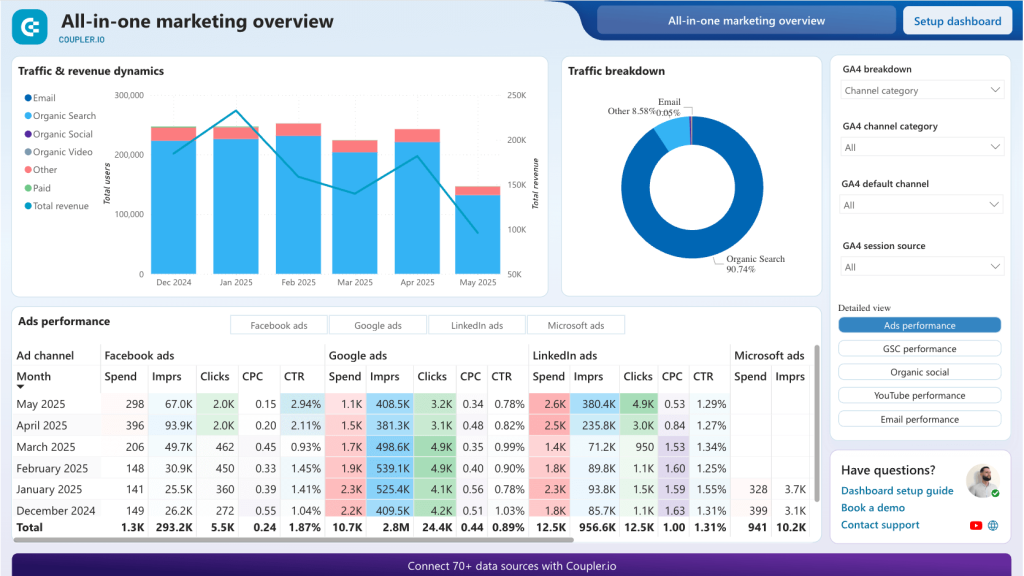
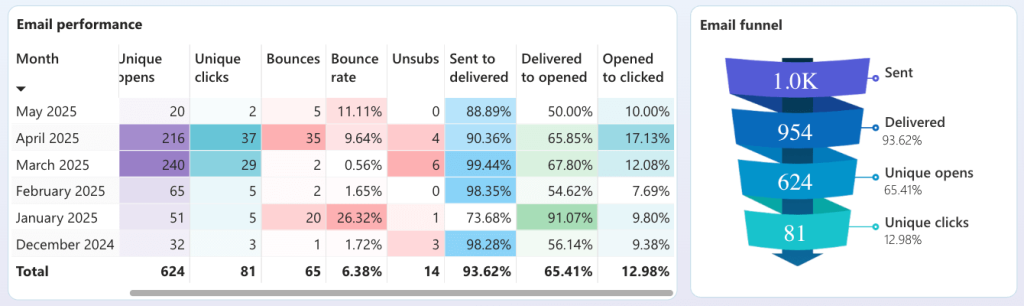
The email marketing section shows the full funnel: emails sent, delivered, unique opens, unique clicks, bounces, and unsubscribes. You can see where recipients drop off and compare performance across campaigns.
Click the button below to open the dashboard in Power BI. Next, click Setup dashboard to start simple configuration. Once you’ve created a free Coupler.io account (no credit card required), you’ll be able to connect your Klaviyo email analytics plus all your other marketing data sources.
Other ways to connect Klaviyo to Power BI
The Coupler.io connector is the most direct route, but there are other ways to get Klaviyo data into Power BI depending on your technical setup and preferences.
Power Query (Klaviyo API directly)
Power BI’s built-in Power Query editor can call the Klaviyo REST API through the Web.Contents function in M code. Most Klaviyo endpoints (profiles, lists, campaigns, segments) use GET requests, which are relatively straightforward to set up. The Metrics Aggregate endpoint is the exception as it requires POST requests. Power Query only sends POST when you manually define a request body in M code, which gets verbose fast. Authentication goes in the request header as Klaviyo-API-Key pk_xxxxx. No third-party tools needed, but you’ll be maintaining M code whenever the API changes.
ODBC drivers
CData and Devart both provide ODBC drivers that let Power BI treat Klaviyo as a database. You install the driver, configure a DSN (data source name) in Windows, then use Get Data > ODBC in Power BI Desktop. From there you can write SQL-like queries against Klaviyo data. These are paid commercial products with separate license fees.
Python script in Power BI
Power BI has a built-in Python data source. You write a script that calls the Klaviyo API using the requests library, processes the JSON response into a pandas DataFrame, and Power BI imports the result. This requires Python installed on the machine running the report and works best for one-off or lightly automated scenarios. Scheduled refresh through the Power BI Service with Python scripts has its own set of limitations.
How to export data from Klaviyo to Power BI manually
Apart from the methods to connect Klaviyo to Power BI, you might simply need to get a one time data export. This manual option can be useful for reports that don’t need to be updated often. If you are planning to prepare a report just once, or if it’s enough to update it once a month or so – then transferring data manually can work well. However, if you need to closely monitor progress or work with your Klaviyo data in Power BI often, it’s better to use automation. Although the manual method is rather straightforward and simple, repeating the export-import steps repeatedly can become very time-consuming.
If you decide you don’t need automation, let’s see how to get your Klaviyo data into Power BI manually.
Note: Only accounts with owner, admin, and analyst roles can export lists and segments.
- From the left navigation menu, go to Audience > Lists & Segments.
- Click on the list or segment that you wish to export.
- If you don’t have one already, go to the top right corner on the same page. Create one by clicking on Create List / Segment.
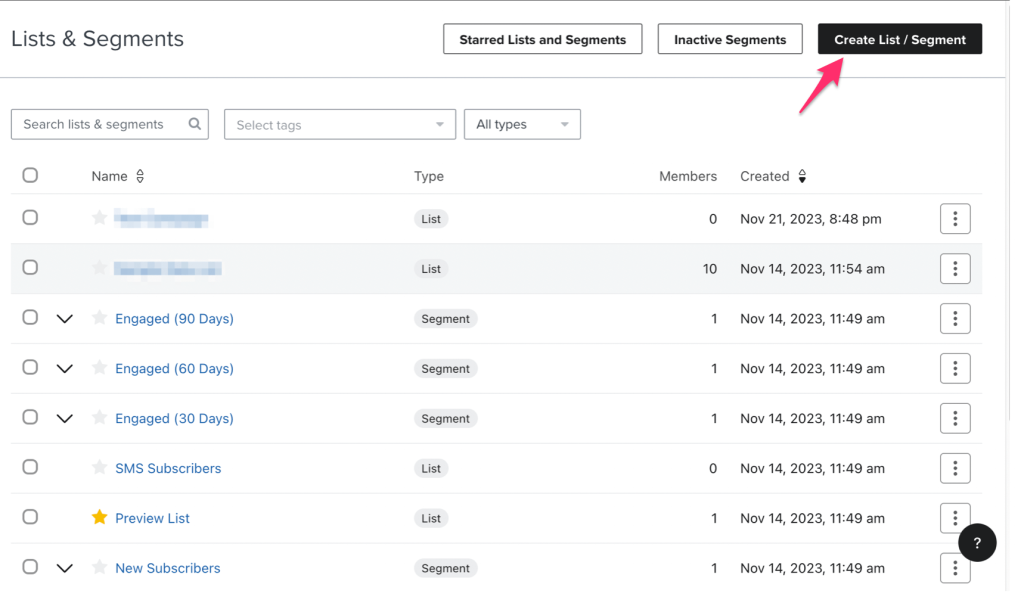
- When you have the list or segment opened, from the top right corner, click on Manage List > Export List to CSV.
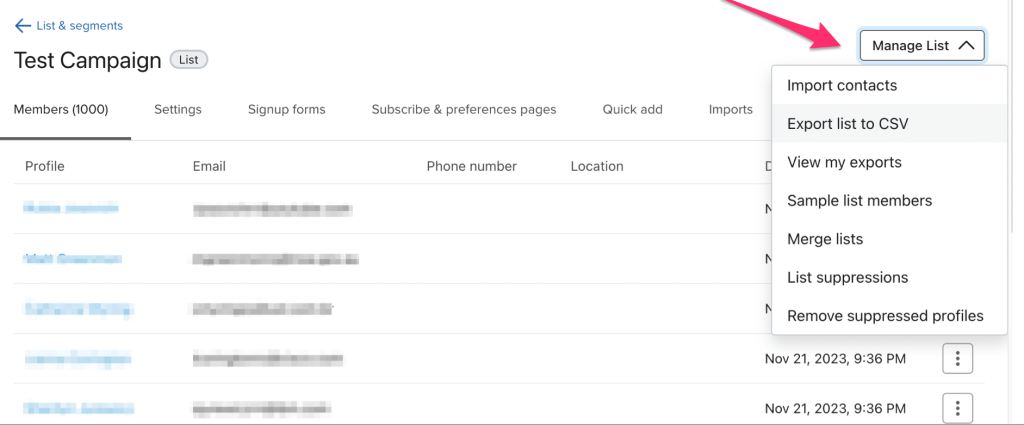
- On the Export Review page, you can select the properties you wish to export and start exporting.
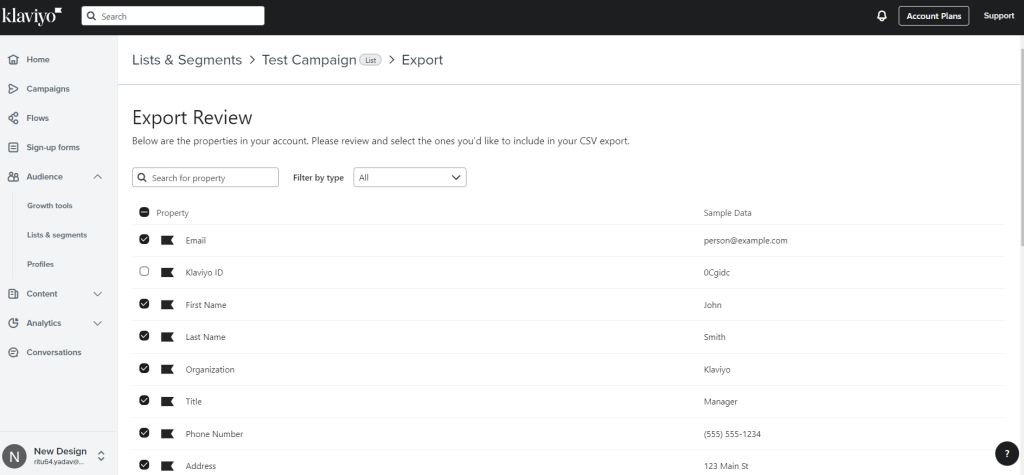
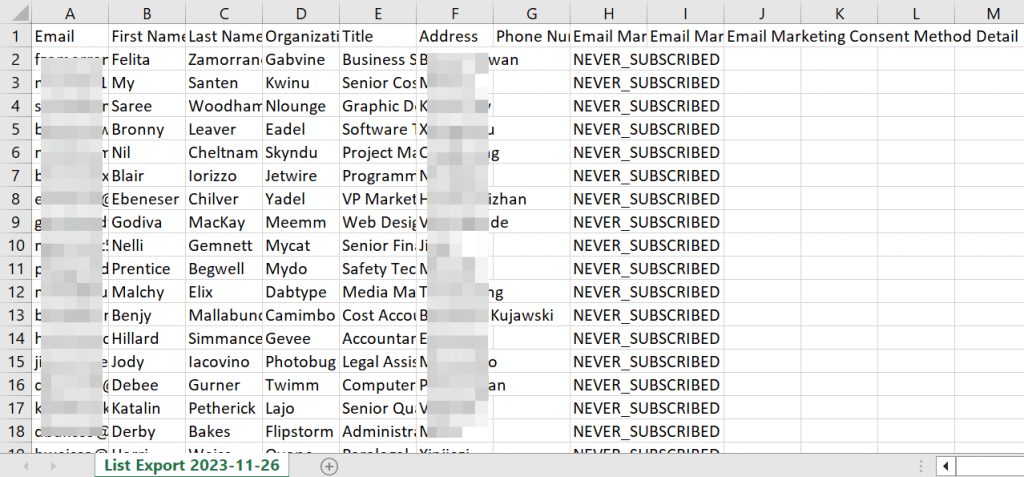
- Save the CSV export to your computer. I’ve exported a list with 10 columns.
- Now, go to Power BI and click Get data > Text/CSV.
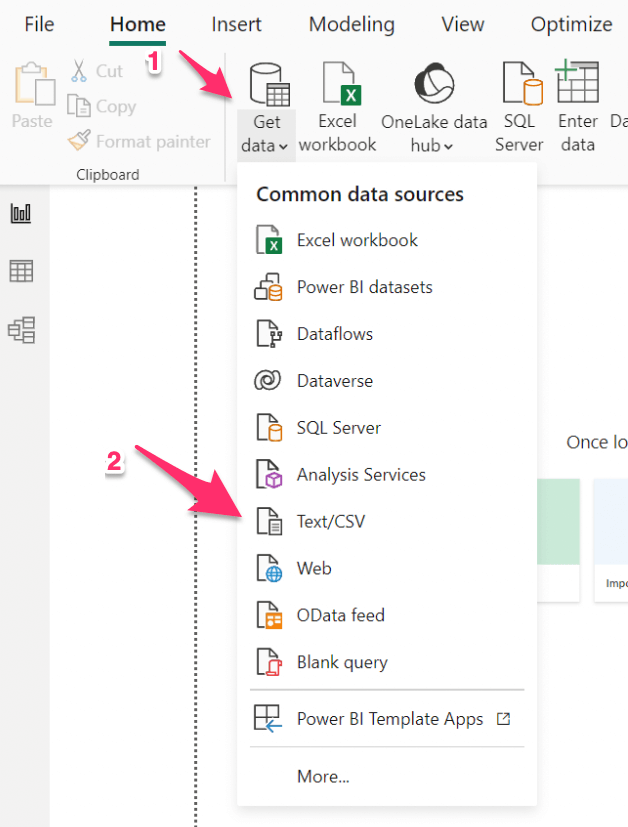
- Select the exported CSV file and click OK. You can now get started and load or transform your data in Power BI.
Why should you use Coupler.io to connect Klaviyo to Power BI?
Coupler.io is not the only option on the market to connect Klaviyo to Power BI. However, it stands out for several reasons:
- No code required. The entire connection runs through a visual interface. No M code, no Python scripts, no ODBC drivers to install.
- Over 400 sources. Beyond Klaviyo, you can pull data from GA4, Google Ads, Mailchimp, Shopify, Salesforce, HubSpot, and hundreds of other apps into the same Power BI report.
- Multiple destinations per data flow. The same Klaviyo data can go to Power BI, Google Sheets, Looker Studio, BigQuery, or AI tools like Claude and ChatGPT at the same time.
- Scheduled refresh up to every 15 minutes. Set it once, and the data stays current without manual exports.
- Data transformation before it reaches Power BI. Filter rows, hide columns, add formula-based columns, aggregate, and blend data from multiple sources. All this happens before the data lands in your report.
- Built-in AI Agent. Ask questions about your Klaviyo data in plain language. The Analytical Engine runs calculations on the dataset and returns confirmed results.
- Ready-to-use templates: You can access our reporting templates and dashboards. They are all pre-designed with built-in Power BI connectors for immediate use. Each time you use a new connector, you can save time by using our templates. Currently, we do not have a template report for Klavio, but you can request it, and we’ll have it ready for you.
There’s no need to have many Power BI connectors to get data from all your sources. Our extensive list of source apps makes it an all-in-one solution for data integration. With Coupler.io, you can connect Klaviyo to Power BI within minutes. Use the time to analyze your data and build processes to improve your marketing efforts.
Automate data export with Coupler.io
Get started for free