Mastering LLMs for Data Analysis in Marketing: Real Results from Leading AI Models

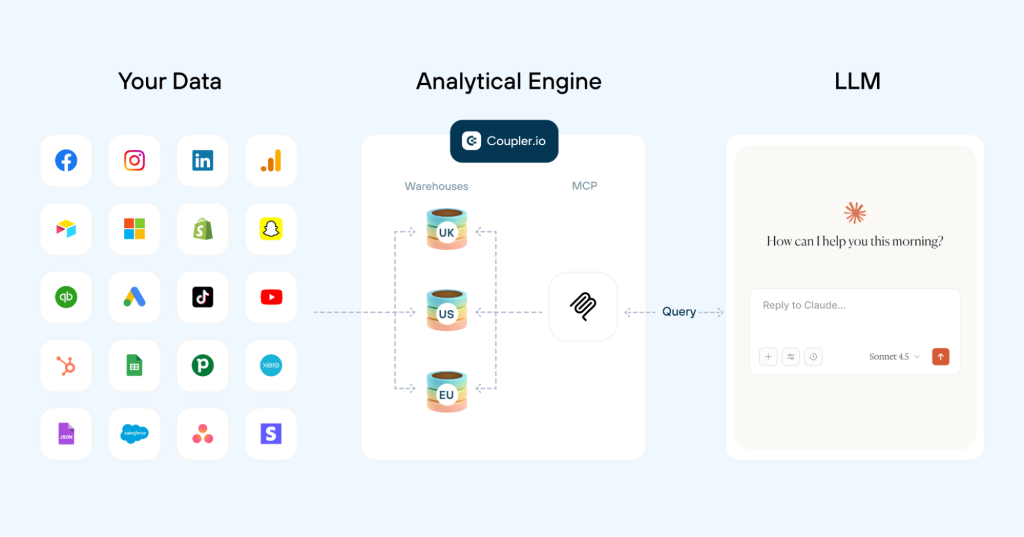
Good marketing reacts to reports, but great marketing predicts the next win. It’s all about using clear data to make faster, smarter decisions. Coupler.io handles the first part: it automatically consolidates your scattered marketing metrics into a single, live table and connects your external apps to AI models. The LLM handles the second part: it answers your questions using the data you supply. To find the gold standard, we put ChatGPT and Claude head-to-head on the same marketing datasets. Here’s what we found, and how you can build the ultimate workflow for AI-powered data analysis.
LLM for data analysis: Why manual uploads are not enough
LLMs like ChatGPT or Claude are already a standard part of marketing data analytics workflows. The typical process involves CSV exports from platforms like GA4, Meta Ads, LinkedIn Ads, and Mailchimp, followed by manual uploads to an LLM for data analysis. It looks efficient on paper. In practice, it creates several problems that quietly undermine your results.
Challenge #1: Time-consuming data preparation and uploading
Before large language models can do anything useful, someone on your team needs to pull exports from multiple sources, clean them in a spreadsheet, and trim the dataset to fit token limits like ChatGPT’s context window. For multi-channel campaigns, that work alone can eat hours before a single insight has been produced. Eventually, there’s almost no time left for strategic thinking that the LLM output is supposed to support.
Solution with Coupler.io: Connect all your data sources (with different data types) once through Coupler.io’s 400+ integrations. The platform handles data consolidation, structure, and calculation automatically, then routes the output directly to your chosen LLM for data analysis. Marketing analytics insights are ready as soon as you ask.
Challenge #2: Data volume and token limitations
Even the strongest LLM models for data analysis hit walls with large, raw datasets. Context window constraints force users to upload partial data, which fragments the analysis and makes a complete view of campaign performance across channels like Google Ads or Microsoft Ads nearly impossible. The result is often incomplete or skewed insights.
Solution with Coupler.io: Coupler.io runs the heavy calculations before anything reaches the LLM. It sends only the aggregated results to the model. This way you keep the token usage low (which directly influences the model’s pricing) and give the AI exactly what it needs to produce accurate, comprehensive analysis.
Challenge #3: Inaccurate calculations and hallucinations
LLMs are language models, not calculators. They can produce errors in basic math or fabricate details when they encounter complex metrics like cost per acquisition or cross-channel attribution. Manual verification of every output adds work that defeats the purpose.
Solution with Coupler.io: Coupler.io handles all data transformations before the AI sees anything. When a user asks a question, the AI identifies the right data structure to query, Coupler.io executes the calculation, and returns the precise result. The AI interprets reliable numbers in plain language, with no math errors and no hallucinations.
Challenge #4: Stale and outdated data
A manually uploaded file is a static snapshot, and it quickly becomes outdated in dynamic marketing environments. A campaign optimized on last week’s data is a campaign chasing trends that have already shifted.
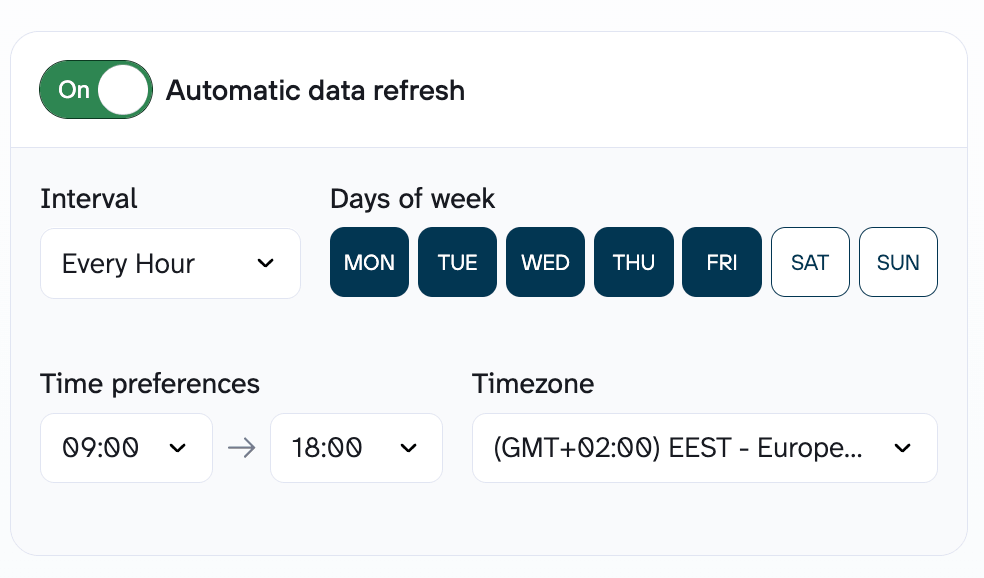
Solution with Coupler.io: Automatic data refreshes give LLMs access to up-to-date performance metrics. You can conduct timely bid adjustments and budget shifts through natural language queries in your integrated AI tool without coding.
The real bottleneck in LLM-powered marketing analysis is the work required to get clean, accurate, multi-source data in front of them without spending your entire afternoon on CSV files. Once that foundation is solid, the analysis and data visualization take care of themselves. The sections ahead cover the most efficient approach to AI-powered marketing analysis, the top use cases, and a direct comparison of how the leading LLMs handle each one.
Go from raw data to deep AI insights
Try Coupler.io for freeHow to use LLM for data analysis with Coupler.io
In 2026, the competitive edge in marketing belongs to teams that can act on the data they already have, faster than anyone else. You don’t need to be a data scientist to run advanced cross-channel analysis. With Coupler.io AI integrations, anyone on the team can get data insights through plain-language questions.
Simple step-by-step setup with Coupler.io
Here’s how to use LLM for data analysis with Coupler.io in 4 simple steps:
- Connect your platforms via Coupler.io: select the necessary data sources from 400+ options.
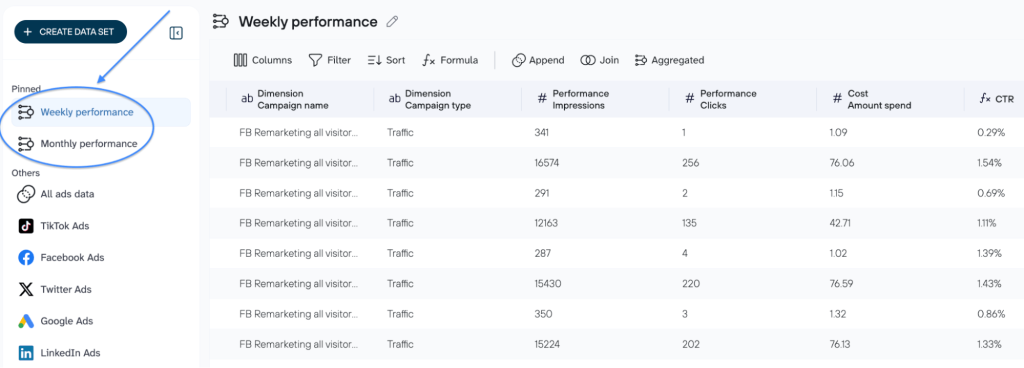
- Organize your dataset: rearrange, rename, or filter columns as needed; add formulas or use data blending to customize the merged data before asking the LLM to analyze it.
- Connect the AI tool: select the LLM model for data analysis from the list of available AI destinations and follow the setup instructions.
- Start the conversation with AI: Now that your dataset is connected to the LLM, ask questions in simple language (no SQL or Python required) to get the insights or create dashboards you need instantly.
To keep analysis as seamless as the integration, you can use the platform’s built-in LLM agent for data analysis. It delivers verified insights directly within your workflow, with no need to export data to external platforms. Coupler.io’s AI agents process information as it gets structured, so there is zero latency between data readiness and the first insight. The LLM agent for data analysis chats with your marketing data and understands the specific context of your filters and aggregations, which means you can spot trends or anomalies while the data pipeline is still being configured.
Get accurate marketing insights in seconds
Try Coupler.io for freeLLM model for data analysis in action: Real-life marketing workflows using Coupler.io
Which model actually outperforms the rest when the goal is to optimize marketing spend, automate data analysis, and grow revenue? We’ve mapped the most in-demand use cases to reveal which model consistently delivers faster, sharper, and more monetizable recommendations.
Performance marketing: analysis and budget allocation suggestions
A wasted budget and a successful month can look identical in the data until it is too late to act. Manual analysis across ad managers and CRM platforms slows every decision down. That fragmentation hides what actually matters: which campaigns drive ROI and which ones just spend.
Scenario: A mid-market e-commerce brand has been running a multi-channel campaign for the first 10 days of the month. The Marketing Director needs to know:
- Which campaigns are actually driving high-intent engagement?
- Which segments are silently draining your budget?
- How should the remaining March budget be reallocated to maximize ROI?
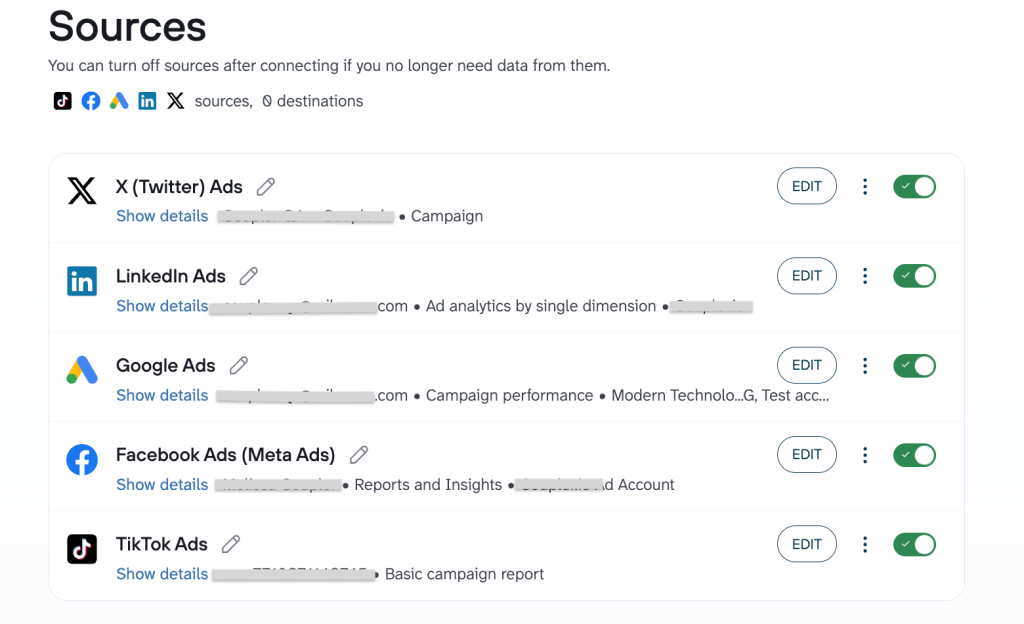
Data sources: The marketing manager created a data flow in Coupler.io and added the relevant data sources (LinkedIn Ads, Google Ads, etc.). Coupler.io handles data cleaning and preparation before the AI sees anything. When a question is asked, the AI points to the right data, Coupler.io runs the math, and the AI translates the results into plain language with reliable metrics.
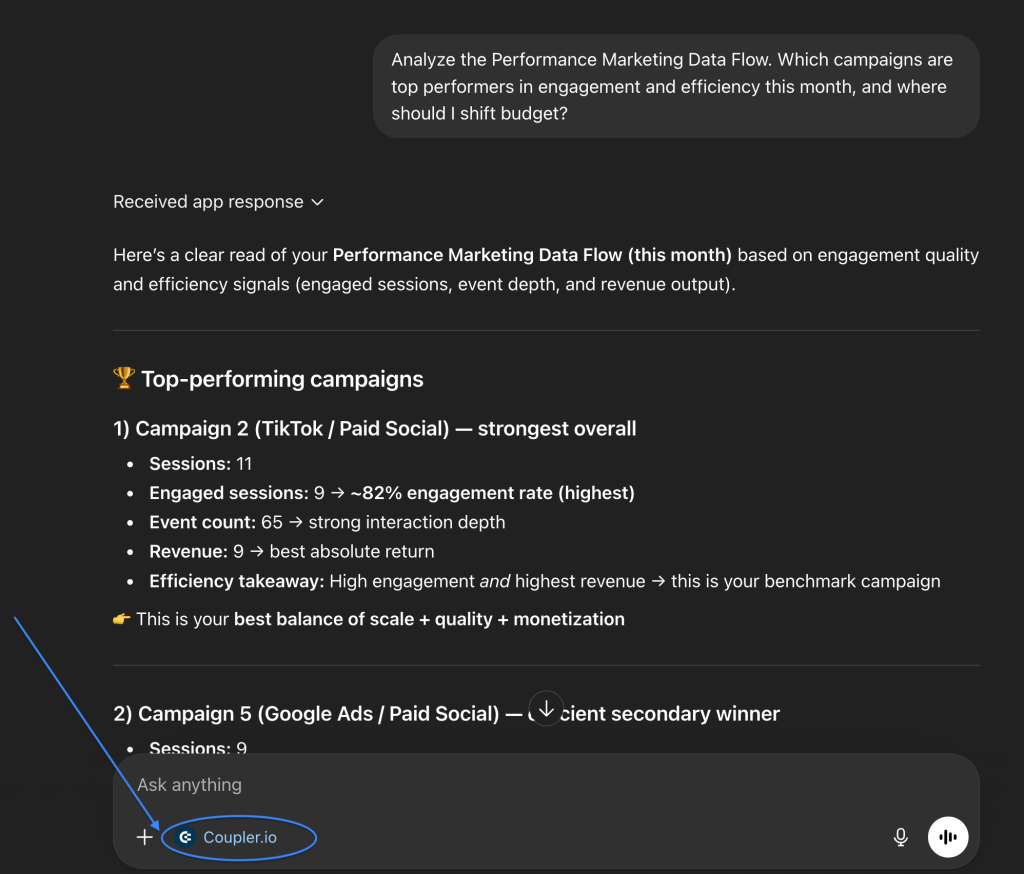
Prompt: “Which campaigns are top performers in engagement and efficiency this month, and where should I shift budget?”
Claude’s marketing campaign analysis and budget allocation suggestions
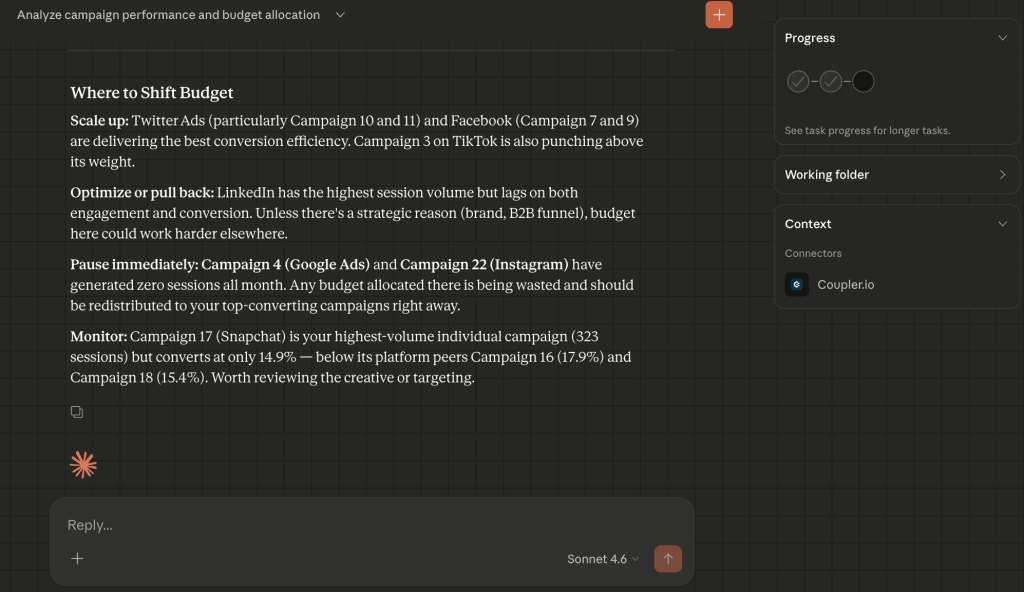
Claude prioritizes efficiency ratios and brand health metrics.
- Efficiency over volume + engagement prototyping: Claude identified the campaign with the hardest-working budget and noted that its 18.5% conversion rate significantly outpaced the 15% field average. It created a “Sweet Spot” category and flagged several campaigns as the healthiest mix of attention (engagement) and action (conversion).
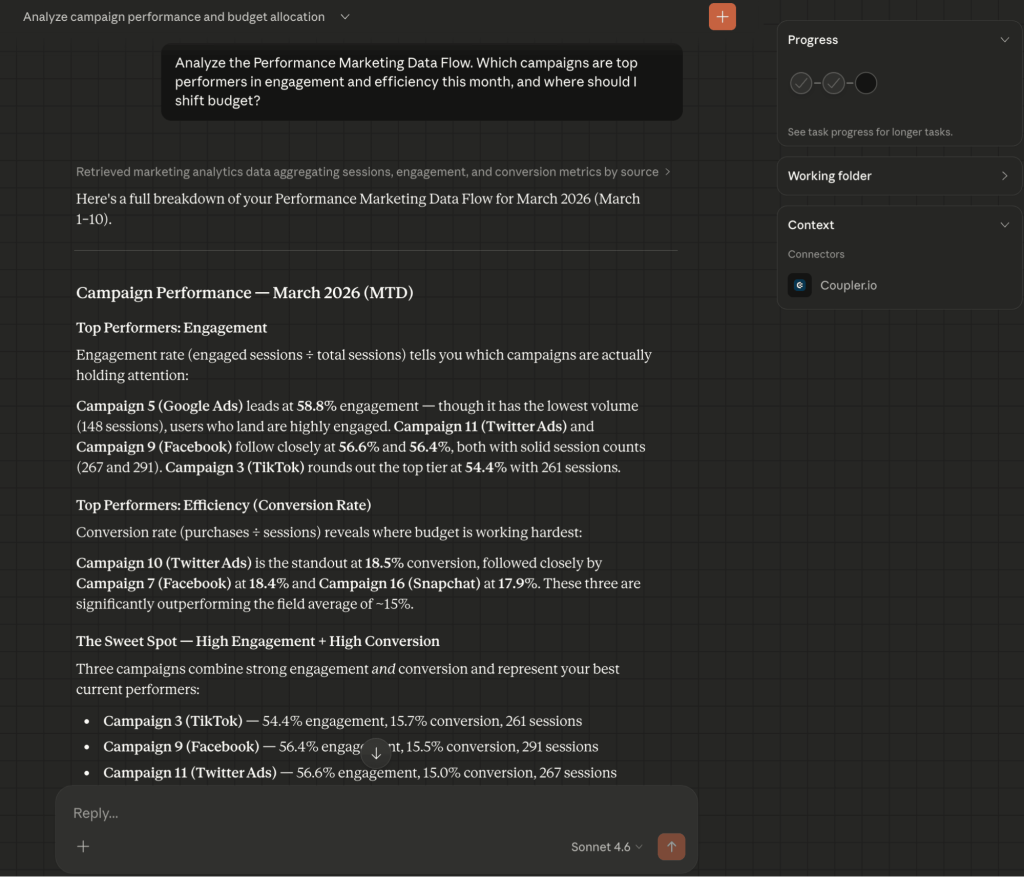
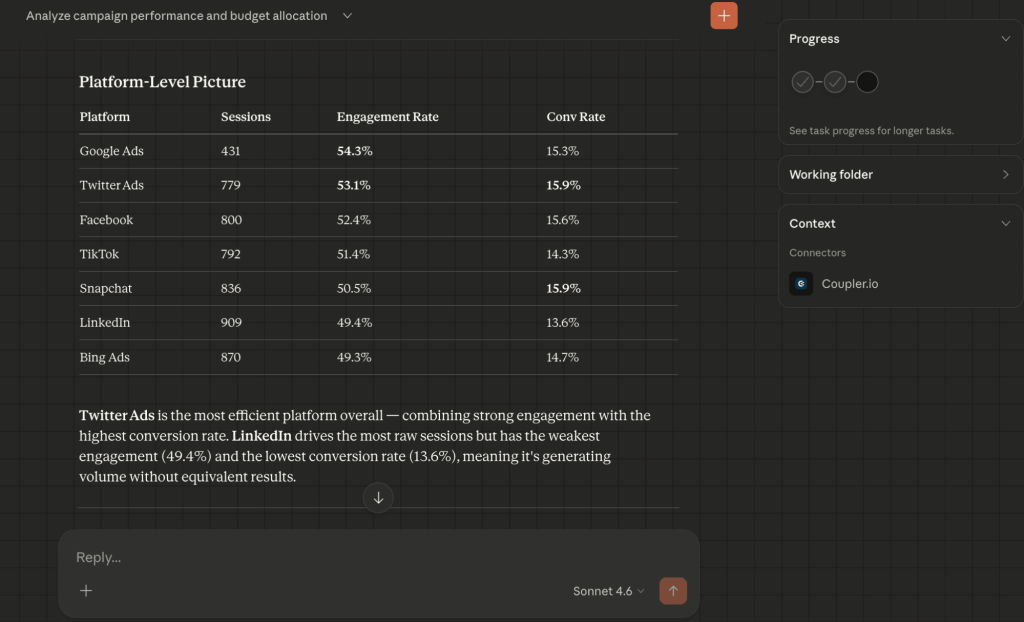
- The “noise” filter: Claude flagged LinkedIn as a low-value volume driver (the highest raw session count but the weakest engagement at 49.4%) and recommended a quality-over-quantity shift.
- Budget reallocation recommendations + immediate waste cleanup: Claude provided specific guidelines on which campaigns are scalable, which to optimize or pause immediately, and which to monitor.
ChatGPT’s marketing campaign analysis and budget allocation suggestions
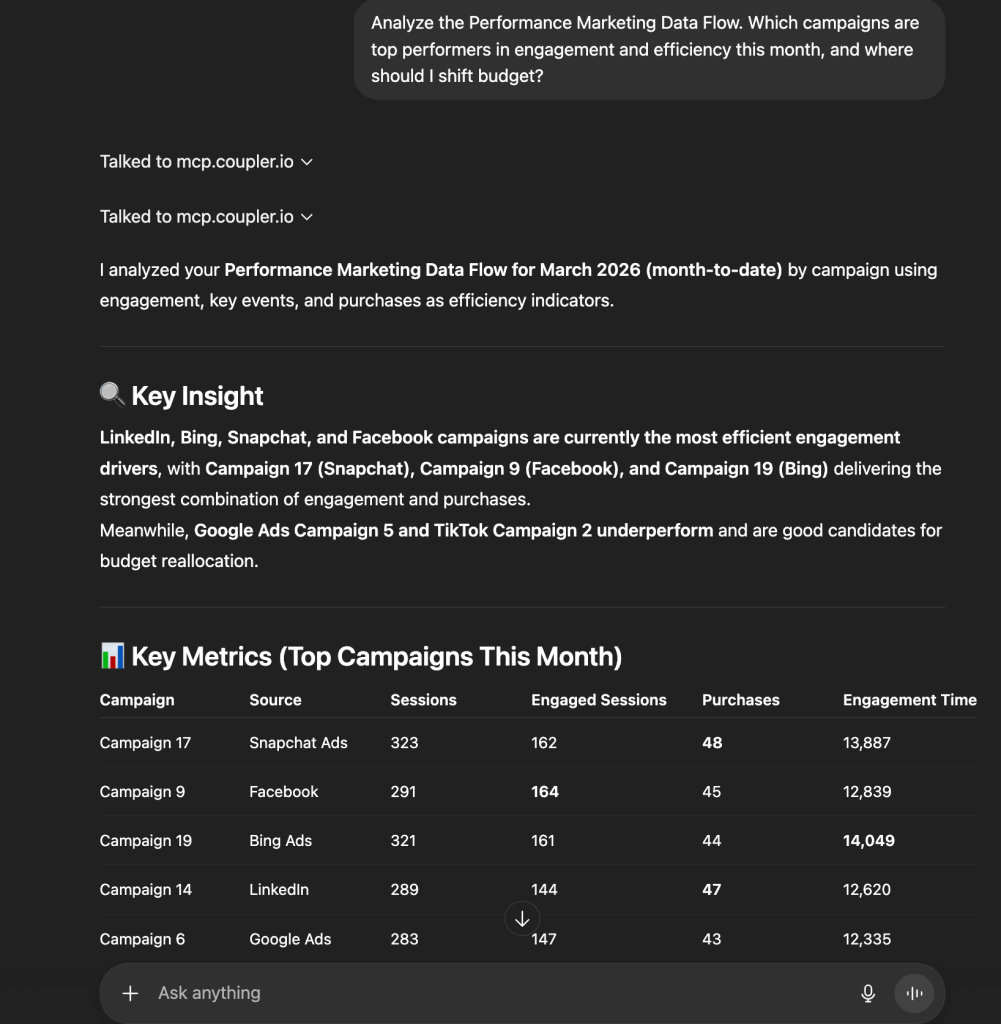
ChatGPT focuses on scale, volume, and rapid execution.
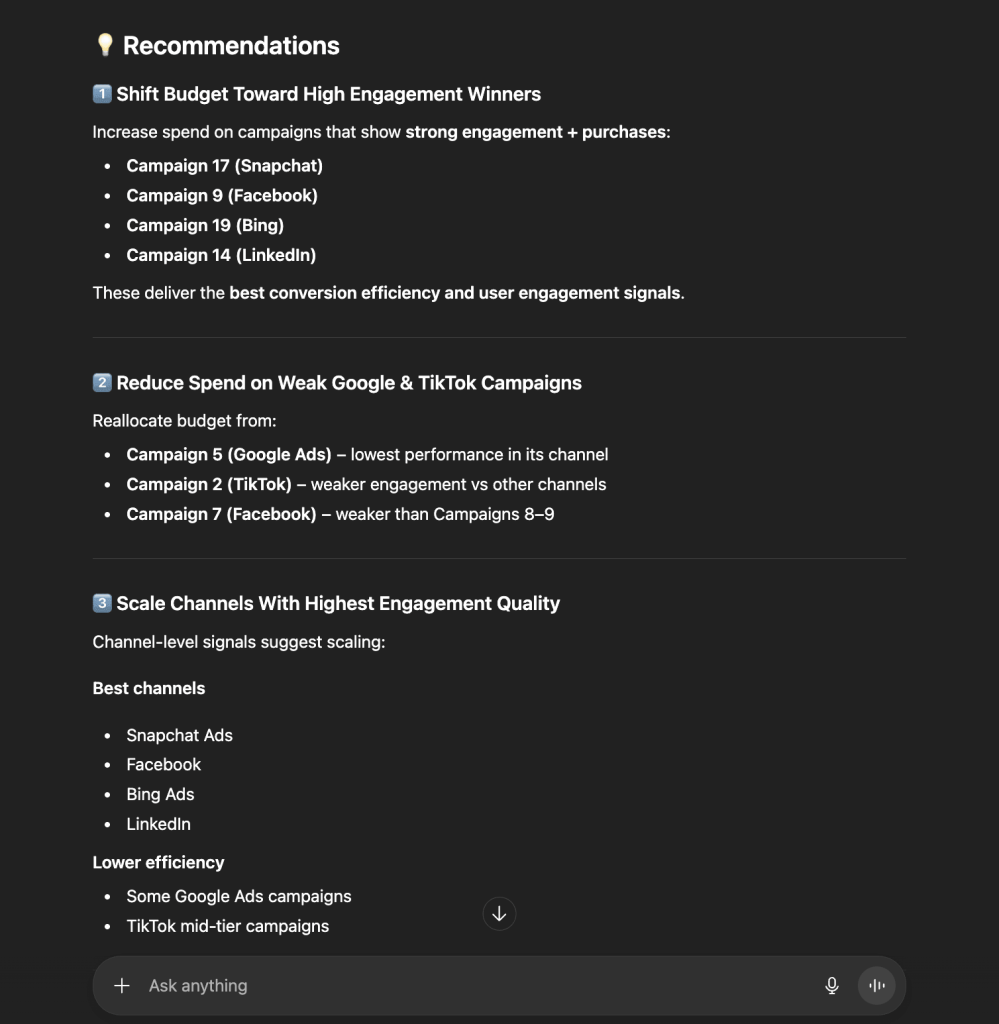
- Volume winners + granular performance table: GPT focused on the campaign that achieved the highest volume (323 sessions) and maintained a strong purchase count. It also produced a clear metric-by-metric breakdown (sessions vs. purchases vs. engagement time) to justify its ranking.
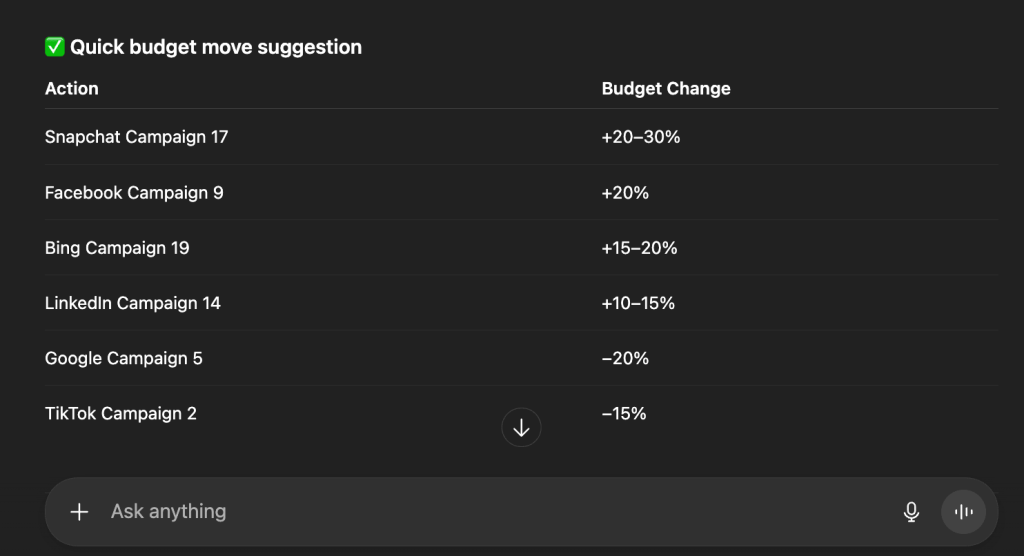
- Predictive budgeting: GPT provided a “Quick budget move” table with specific percentage increments (e.g., +20–30% for Snapchat C17), where Claude offered qualitative guidance.
- Channel-level analysis: It grouped findings by “Signal quality”. Snapchat and Facebook were marked as the most reliable channels for scaling spend.
Comparison: Claude vs ChatGPT for performance marketing analysis
| Claude | ChatGPT | |
| Analytical lens | Strategic & ratio-based: Focuses on engagement % and “The Sweet Spot.” | Operational & volume-based: Focuses on purchases and raw scale. |
| Underperformer logic | Found “inefficient” spend (e.g., LinkedIn’s low engagement). | Found “low-performing” spend (e.g., Google/TikTok low conversion). |
| Output style | Narrative, contextual, and nuanced. | Tabular, actionable, and percentage-driven. |
| Top recommendation | Optimize LinkedIn; Scale Twitter/TikTok efficiency. | Aggressively scale Snapchat (C17) and Facebook (C9). |
| Best for | Identifying high-quality cohorts and creative effectiveness. | Executing rapid budget shifts and scaling winners. |
Content marketing: content performance analysis
High traffic often masks poor performance. A single viral article can inflate top-of-funnel numbers yet contribute zero signups. This use case explores a Quarterly content audit, using AI to identify which content categories are true revenue drivers and which are merely “traffic traps”.
Scenario: A SaaS blog has published hundreds of articles across categories like Tutorials, Competitor comparisons, and How-to guides. The blog attracts nearly 200,000 users, but total signups remain flat. The content manager needs to:
- Identify why traffic is declining despite consistent publishing.
- Determine which specific content formats (e.g., Comparisons vs. Tutorials) convert best.
- Bridge the “onboarding gap” where users sign up but fail to activate.
Data source: The content manager connects Google Analytics to Coupler.io, which automatically transforms event data and session metrics into a clean, structured table. Key performance indicators are calculated upfront, so the LLM works from precise inputs and instantly delivers actionable insights.
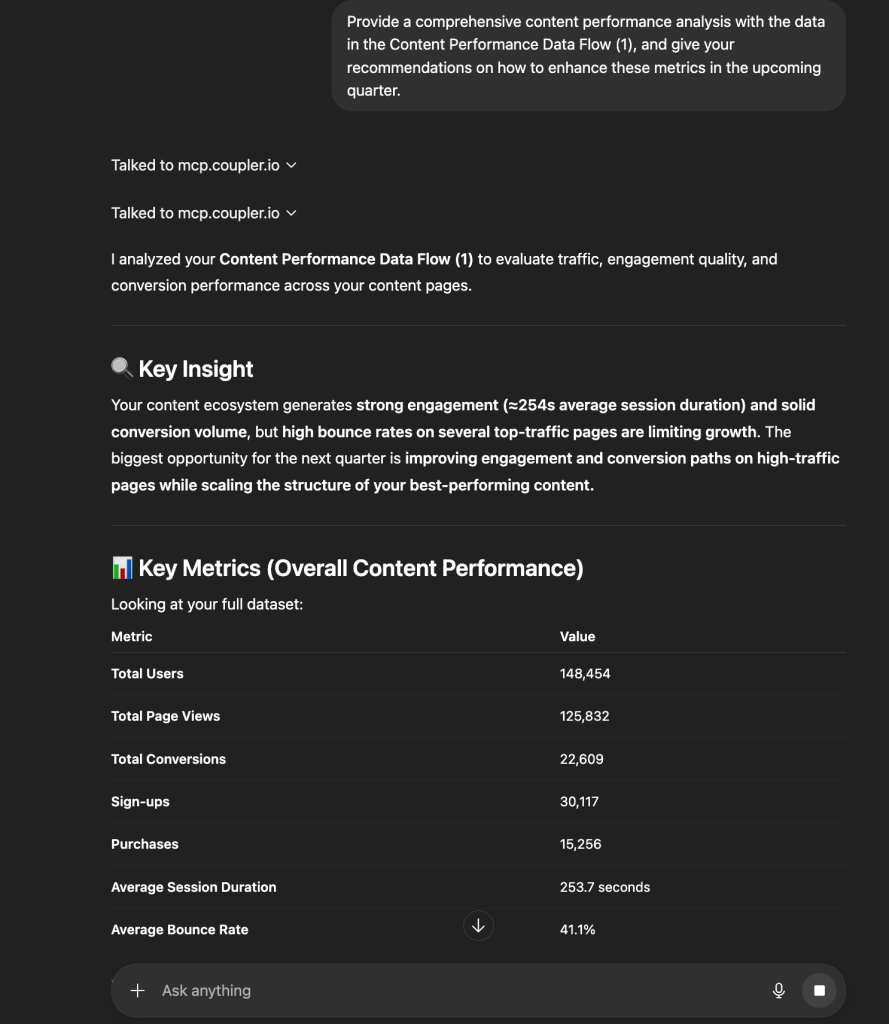
Prompt: “Provide a comprehensive content performance analysis with the data in the Content Performance Data Flow and find optimization opportunities to improve the number of conversions of the top traffic-generating articles.”
Claude’s content performance analysis
Claude treats the data as a business health report and focuses on the funnel integrity.
- The “traffic trap” discovery: Claude identified that “Tutorial” content drives 53% of all traffic but has a 0.24% signup rate. It labeled this as a massive over-investment.
- High-intent winners: It isolated Competitor comparisons (4.20% conv) and Branded tutorials (22.22% conv) as the highest ROI categories, despite having the lowest volume of pages.
- The activation crisis: Claude identified a broken bottom-of-funnel and noted that only 4.8% of signups successfully activate. The recommendation shifted focus from producing more content to fixing onboarding.
- International arbitrage: It found that German (2.49%) and Indonesian (1.61%) content vastly outperforms English content in efficiency and suggested an aggressive localization strategy.
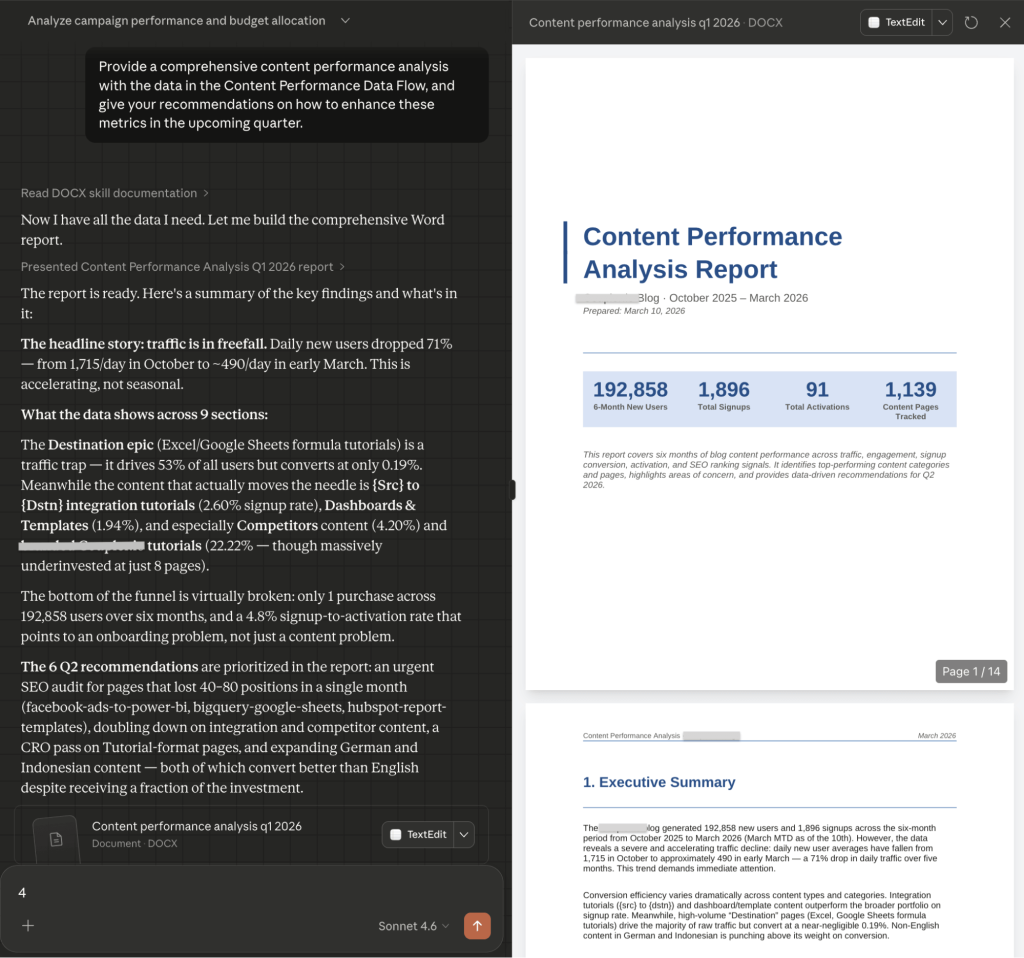
Additionally, Claude generated a well-structured, downloadable, 14-page content performance report in .docx format.
ChatGPT’s content performance analysis
ChatGPT uses a bit different approach and treats the data as a blueprint for user experience and search dominance.
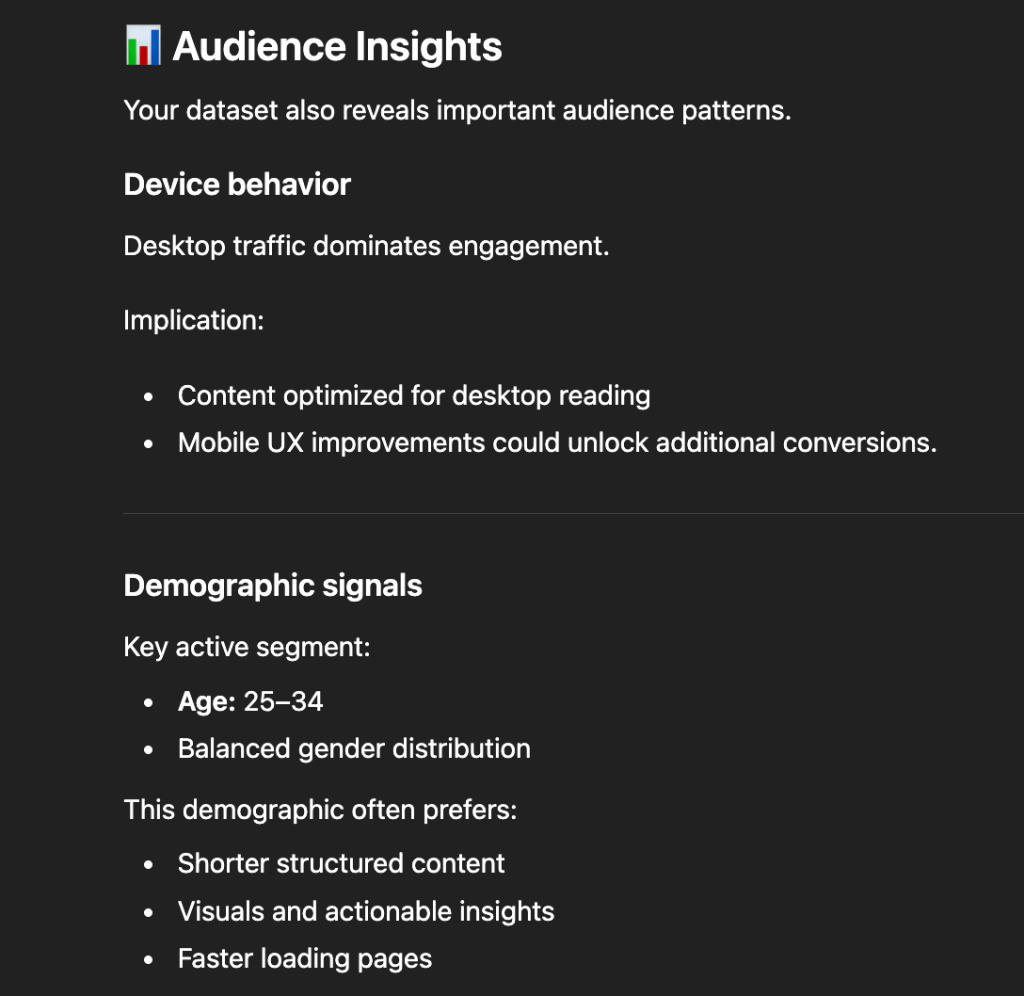
- Engagement archetyping: GPT identified a “key pattern” for success: pages with over 300 seconds of engagement and multiple views per session are the only ones driving a balanced signup/purchase mix.
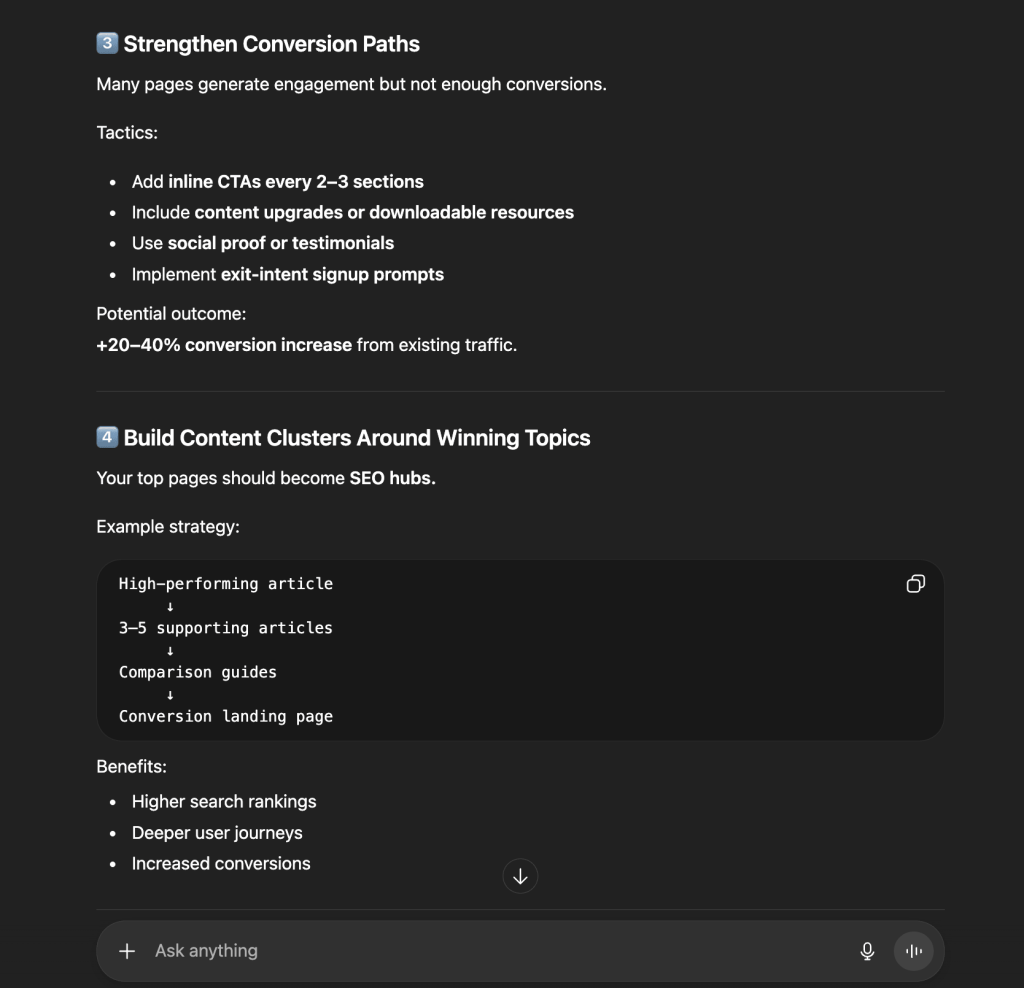
- Conversion path tactics + implementing the hub-and-spoke strategy: It provided a granular “Tactics” list, including inline CTAs every 2–3 sections and exit-intent prompts to recapture the 41.1% of users who bounce. ChatGPT also proposed a content cluster model, which takes high-performing articles and surrounds them with 3–5 supporting pieces to grow SEO authority.
- Audience & device optimization: GPT flagged that desktop users dominate engagement and recommended improving the mobile UX to unlock hidden conversions.
Comparison: Claude vs ChatGPT for content marketing performance analysis
| Claude | ChatGPT | |
| Primary insight | Structural flaws: Identified that traffic is in “freefall” (-71%) and the funnel is broken. | Optimization levers: Focused on reducing bounce rate (<35%) and increasing session time. |
| Format strategy | Recommends freezing “Tutorial” production to focus on high-conversion “Comparisons.” | Recommends turning top-performing pages into “Content Templates” for replication. |
| Market focus | Shift resources to high-performing non-English markets. | Focus on the 25–34 age segment with “shorter, structured content.” |
| Conversion focus | The “Why”: Analyzes the intent difference between “task-oriented” and “education-seeking” readers. | The “Where”: Specific UI/UX fixes like above-the-fold messaging and visual summaries. |
| Tone | Urgent, strategic, evaluative. | growth-oriented, tactical, instructional. |
SEO: CTR optimization opportunities
A page-one ranking is necessary but not sufficient. Plenty of domains earn strong positions and still see weak click-through rates: trusted by search engines, skipped by users.
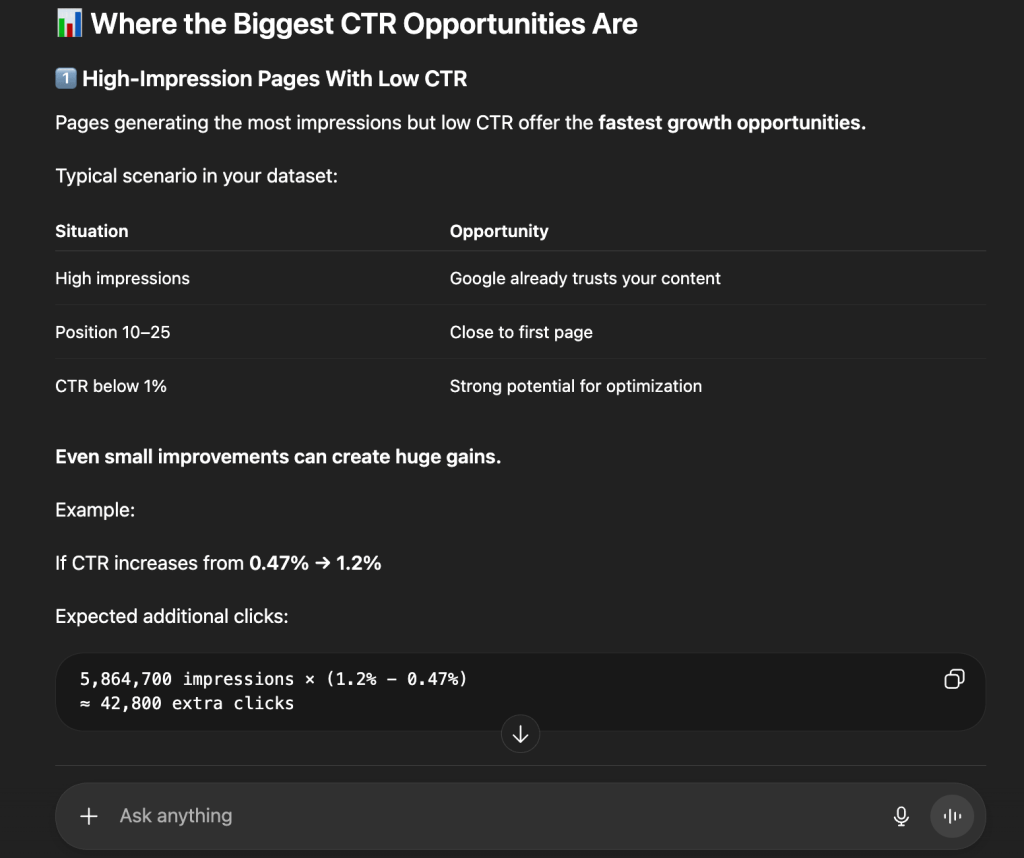
Scenario: A company’s organic search visibility has improved significantly (the average positions moved from 25.3 to 12.0). But CTR sits at 0.47%, well below the 2–5% industry benchmark for those positions. The SEO manager needs to:
- Identify why improved rankings are not producing more traffic.
- Isolate pages that Google trusts but users skip.
- Give the content team a specific roadmap to capture an estimated 42,000+ missing clicks.
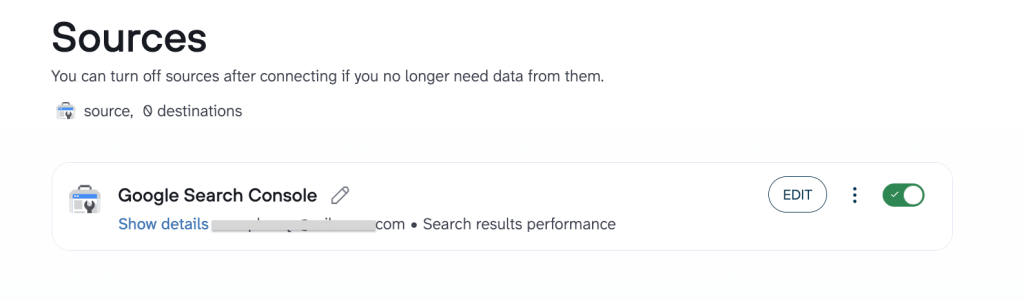
Data source: The SEO manager uses Coupler.io to transform raw Google Search Console data into a clean, analysis-ready table. Data prep happens upfront. When a question is asked, the AI identifies what it needs and Coupler.io executes the calculations (e.g., measuring growth). The AI focuses on ranking opportunities rather than data formatting.
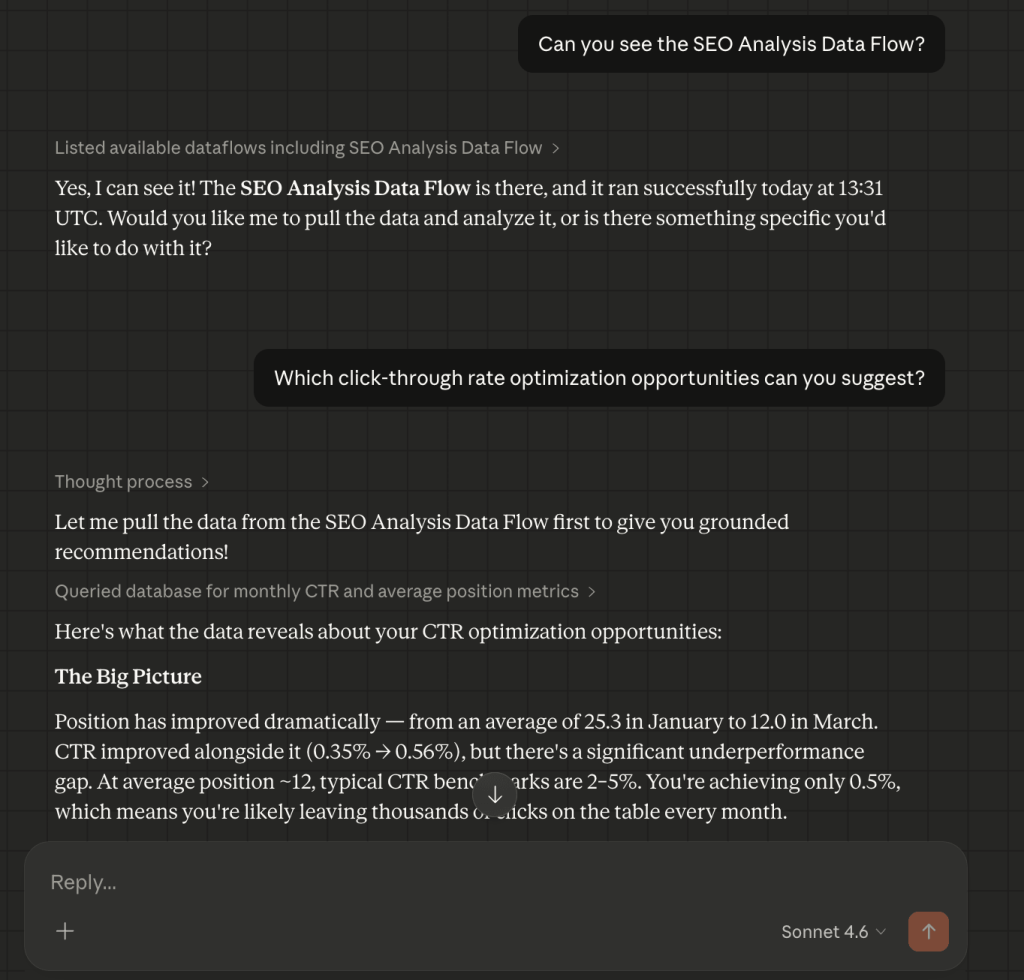
Prompt: “Which click-through-rate optimization opportunities can you suggest?”
Claude’s CTR optimization analysis
Claude focuses on the psychology of the searcher and the structural anomalies in the data.
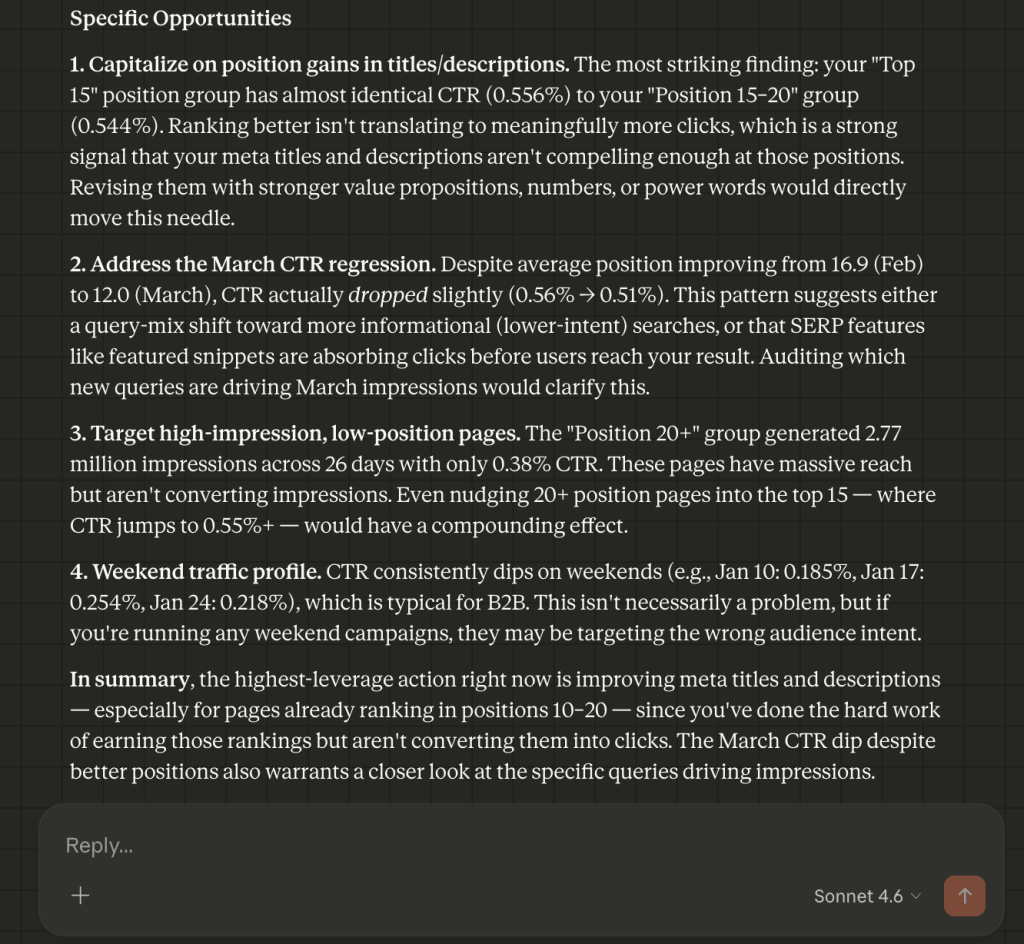
- The underperformance gap: Claude noted that while positions moved from ~25 to ~12, CTR only moved from 0.35% to 0.56%, and identified this as a value proposition failure in the meta titles.
- The “March regression” catch + compounding effect logic: Claude spotted a trend where CTR dropped (0.56% to 0.51%) even as positions improved, and suggested a shift to informational intent queries where Featured Snippets are stealing clicks. It also isolated the “Position 20+” group (2.77 million impressions) as the highest potential lever and noted that even a nudge into the top 15 would have a compounding effect on traffic. It also flagged a weekend traffic dip and suggested weekend-targeted content may not be worth the investment.
ChatGPT’s CTR optimization analysis
ChatGPT focuses on immediate ROI and specific technical execution.
- The math of opportunity: GPT calculated that increasing search CTR from 0.47% to 1.2% would yield 42,800 extra monthly clicks.
- Metadata blueprints: GPT provided before-and-after examples of title tags and recommended emotional triggers and “2026” timestamps to increase clickability by up to 70%.
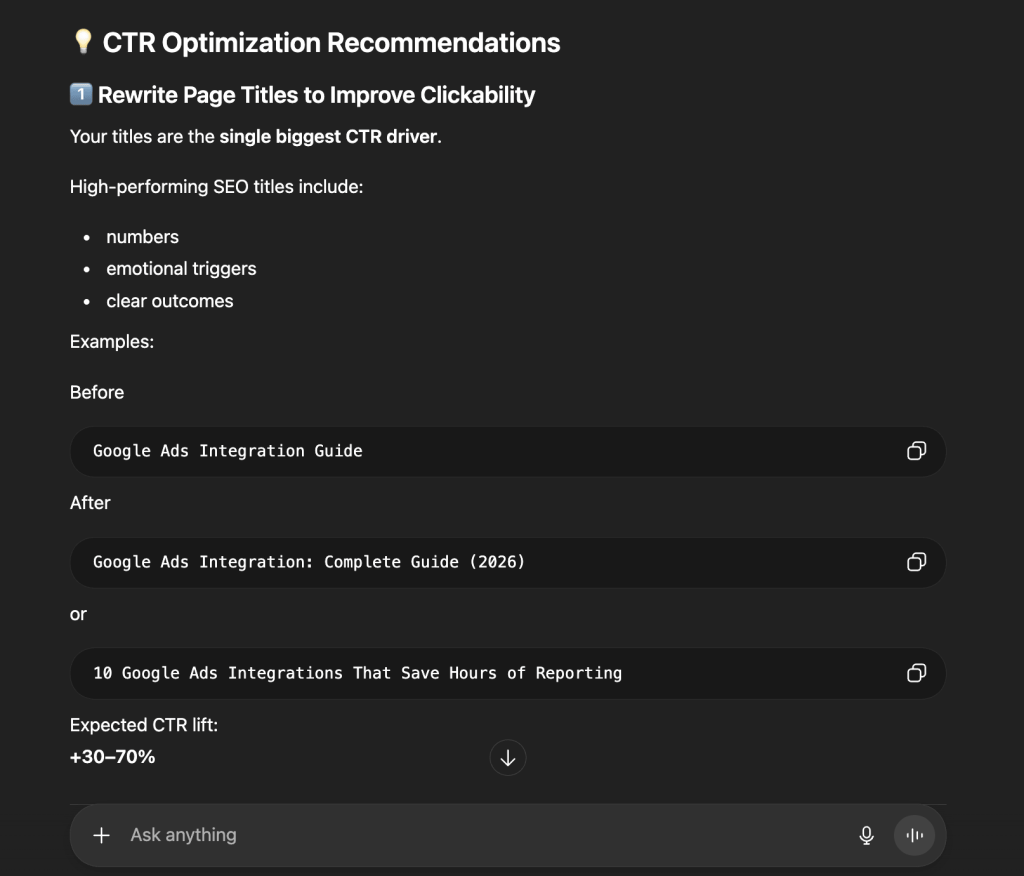
- The “Page 2” hunter: It prioritized pages in positions 11–20, labeled them “striking distance” pages, and recommended FAQ schema and internal links to push them onto Page 1.
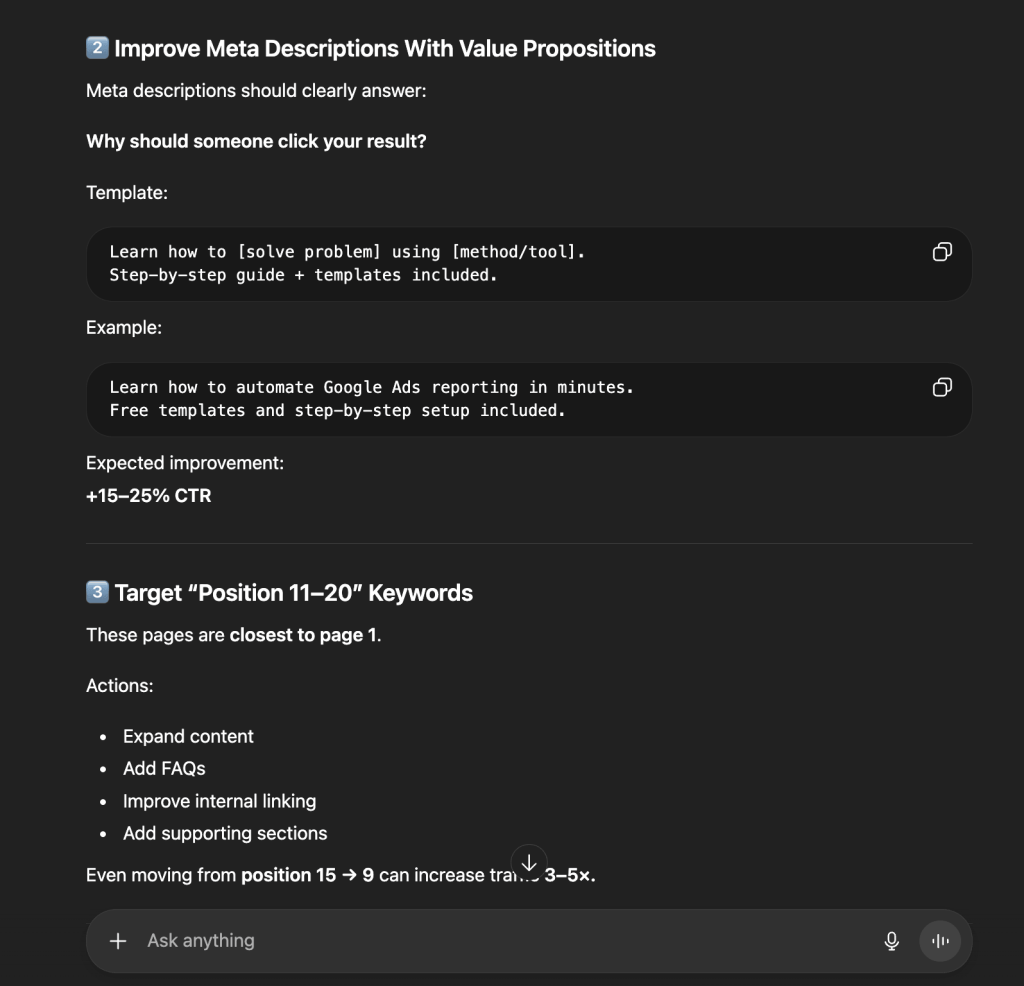
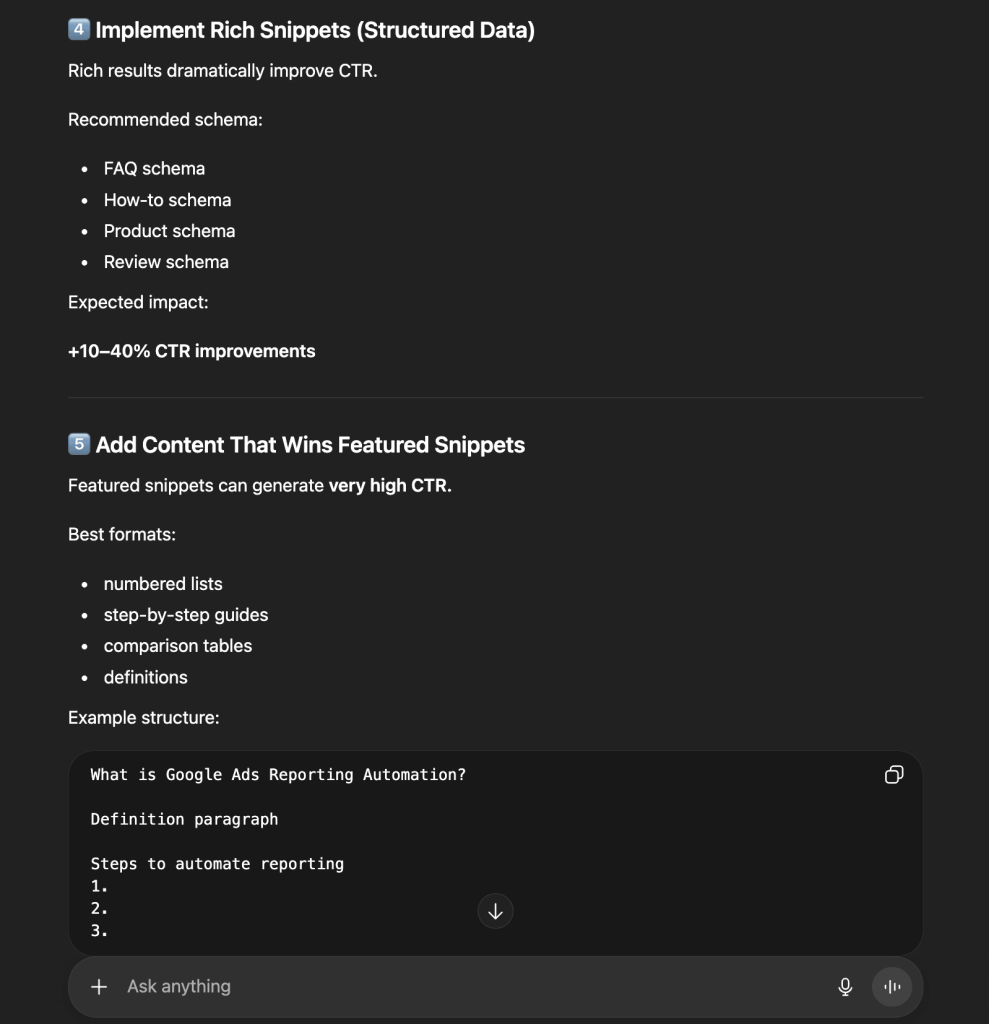
- Structured data roadmap: It recommended a specific schema rollout (FAQ, How-to, Review) to “own” more SERP real estate through Rich Snippets.
Comparison: Claude vs ChatGPT for CTR optimization opportunities
| Claude | ChatGPT | |
| Organic lens | The message failure: Titles aren’t compelling enough to beat competitors at current ranks. | The math failure: Huge impression volume is being wasted; CTR must double. |
| Key insights | Intent mismatch: Noted a CTR drop in March despite better ranks and suggested a shift to informational queries. | The “Nudge” effect: Moving from Position 15 to 9 can increase traffic by 3–5x. |
| Growth projection | Focuses on the compounding effect of moving position groups. | Provides a clear target: +30k to +100k clicks per month. |
| Primary advice | Immediately validate the email list and audit meta-descriptions. | Rewrite titles and implement Schema across high-impression pages. |
Email marketing: Email campaign performance data analysis
In email marketing, strong engagement on a handful of top campaigns can mask a list that is quietly going stale. Soft bounces that go unaddressed become hard bounces, which damages sender’s reputation and routes future emails straight to spam.
Scenario: A marketing team has been running a series of product announcements and test emails over several months. Two content-driven emails saw nearly 100% engagement, while four other campaigns hit 0% activity due to technical bounces. A recent check-in email triggered a 50% unsubscribe rate. The email manager needs to:
- Diagnose the source of the mass bounce events.
- Understand why users are opting out at unsustainable rates.
- Build a segmentation and content roadmap to stabilize the audience before the next major launch.
Data source: The email manager connects Mailchimp to Coupler.io, which automatically organizes fragmented metrics into a clean, structured table. When a question is asked, the AI identifies what it needs and asks Coupler.io to run the calculations (e.g., open-to-click ratios). This ensures the AI provides high-signal insights based on verified math.
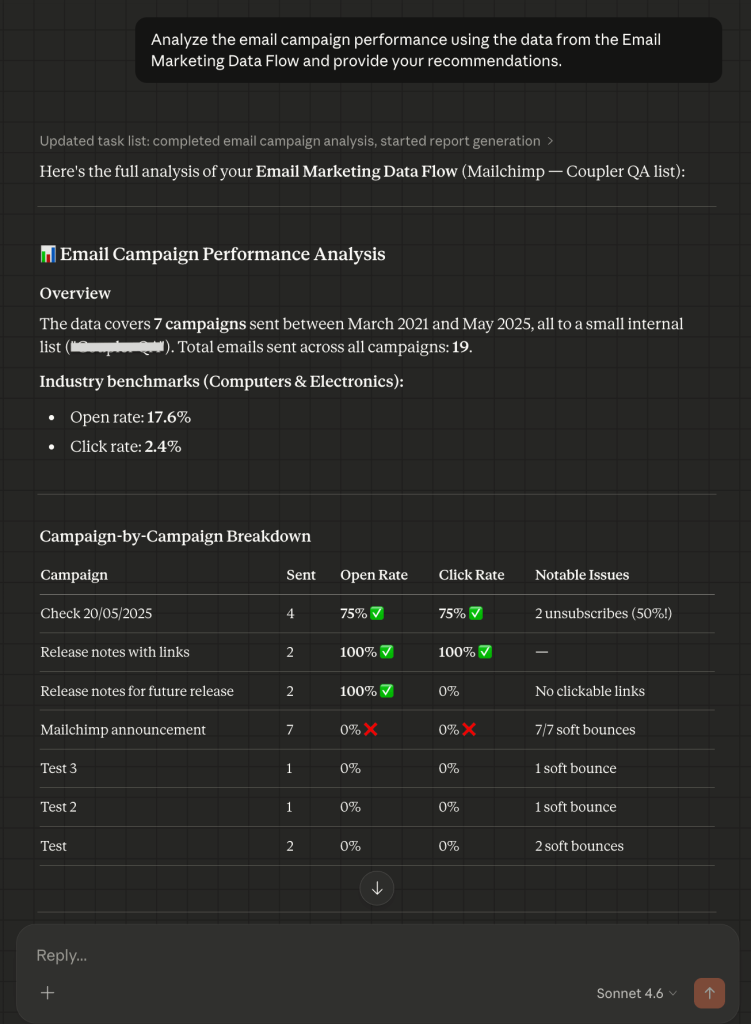
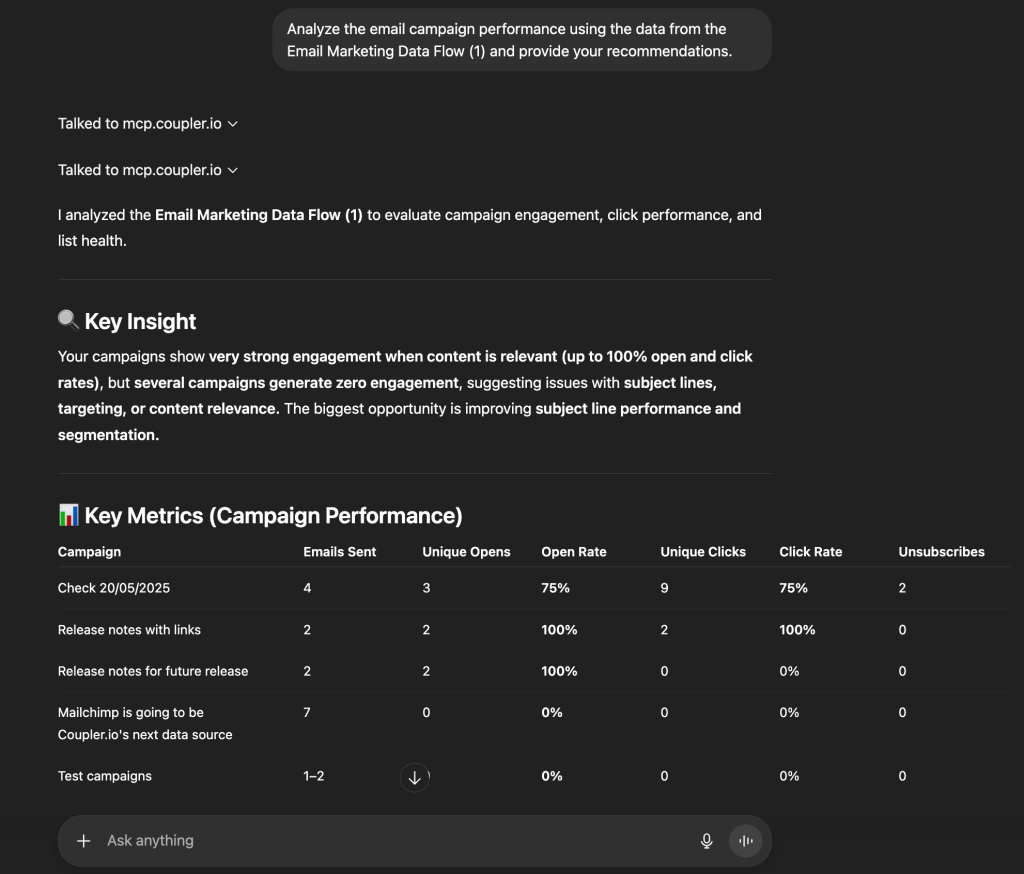
Prompt: “Analyze the email campaign performance using the data from the Email Marketing Data Flow and provide your recommendations.”
Claude’s email campaign performance analysis
Claude’s approach to the task is a “risk assessment” with a focus on list integrity and funnel leaks.
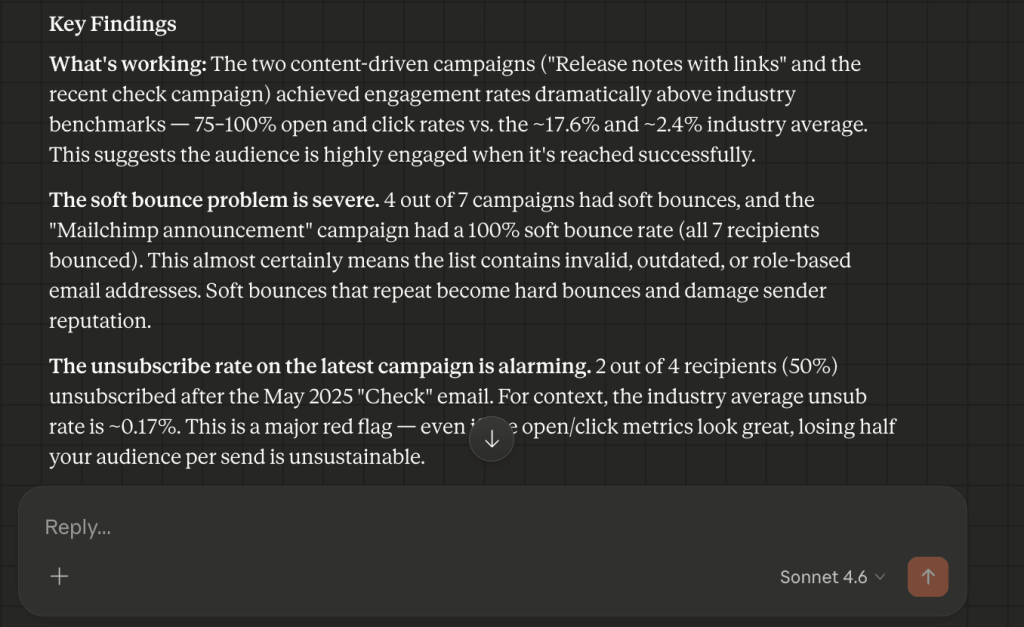
- The deliverability red flag + the “ghost engagement” fix: Claude identified that 4 out of 7 campaigns had a soft bounce problem. It flagged that the Mailchimp announcement campaign had a 100% bounce rate, a sign the list contains invalid or role-based addresses. It also caught a Release notes campaign with 100% opens and 0% clicks and diagnosed the cause: the email had no clickable links.
- The unsubscribe alarm: Claude isolated a recent campaign where 50% of recipients unsubscribed and labeled it a major red flag. Claude’s suggestion was that the content was either unexpected or sent to a misaligned segment.
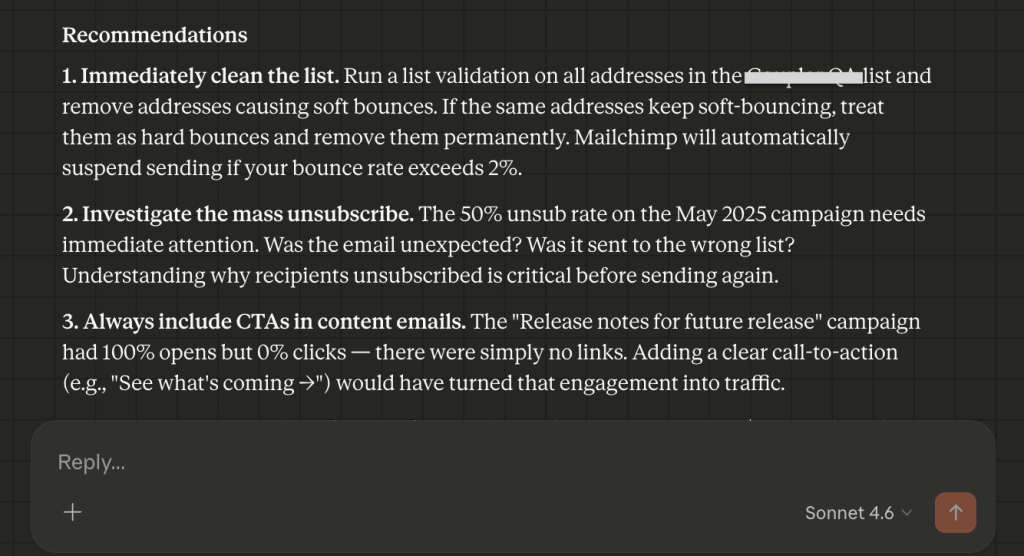
- Next steps: Claude recommended removing soft-bouncing addresses, investigating the unsubscribe trend before the next send, and adding CTAs to all content emails.
ChatGPT’s email campaign performance analysis
ChatGPT treats the data as a conversion blueprint and focuses more on subject lines and send-time optimization.
- The high-impact strategy: GPT identified that product updates with links drive the strongest engagement and recommended this format as the primary growth lever.
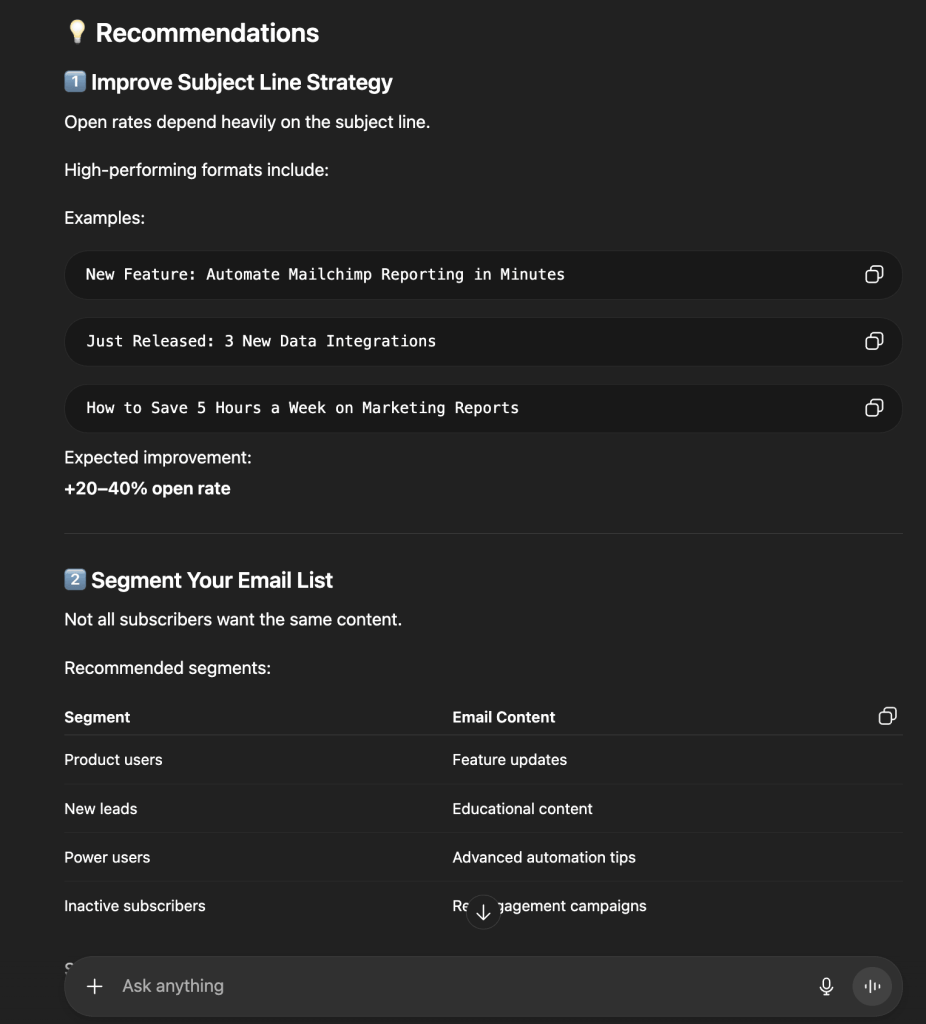
- Subject line engineering: It mapped out a roadmap for open rate improvements of 20–40%, with specific formats like “How to Save X Hours” and “New Feature: [Solution].”
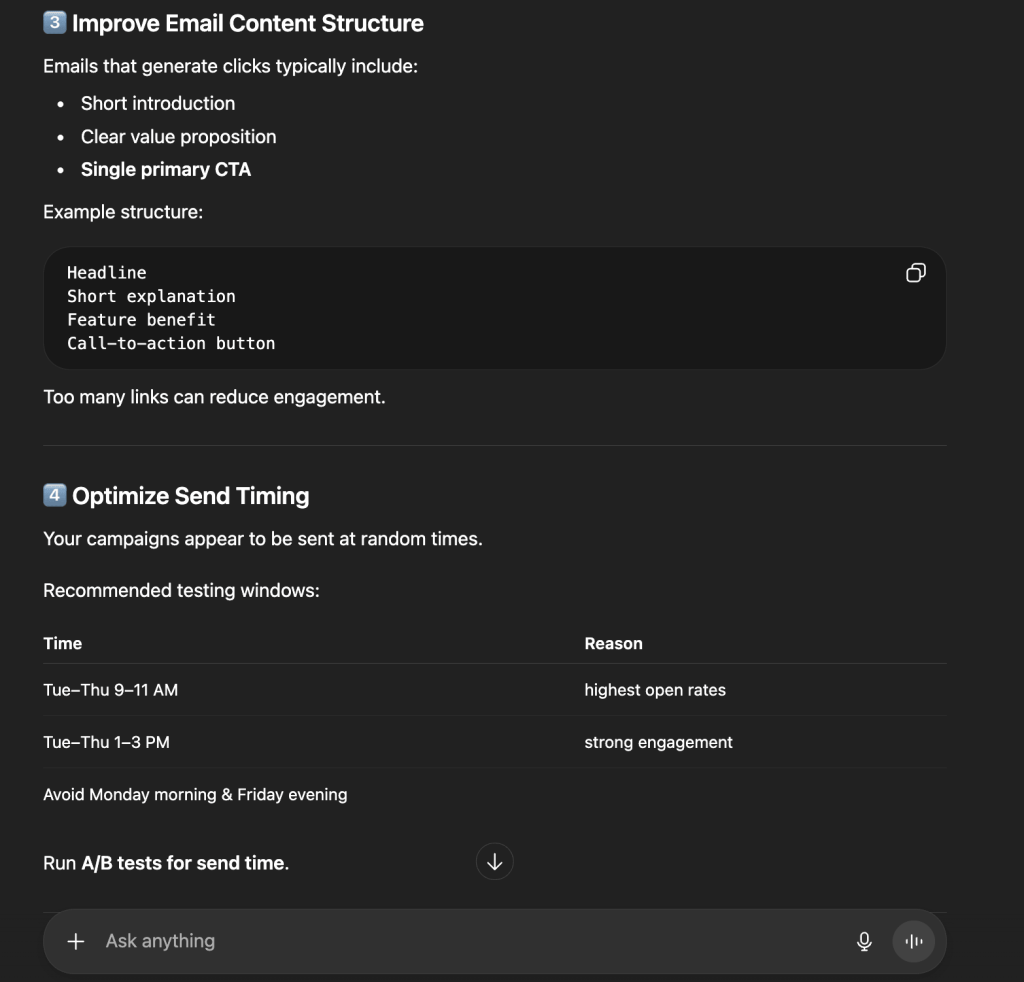
- Send-time intelligence: GPT analyzed the inconsistent send schedule and recommended specific testing windows (Tues–Thurs, 9–11 AM) based on predicted engagement patterns.
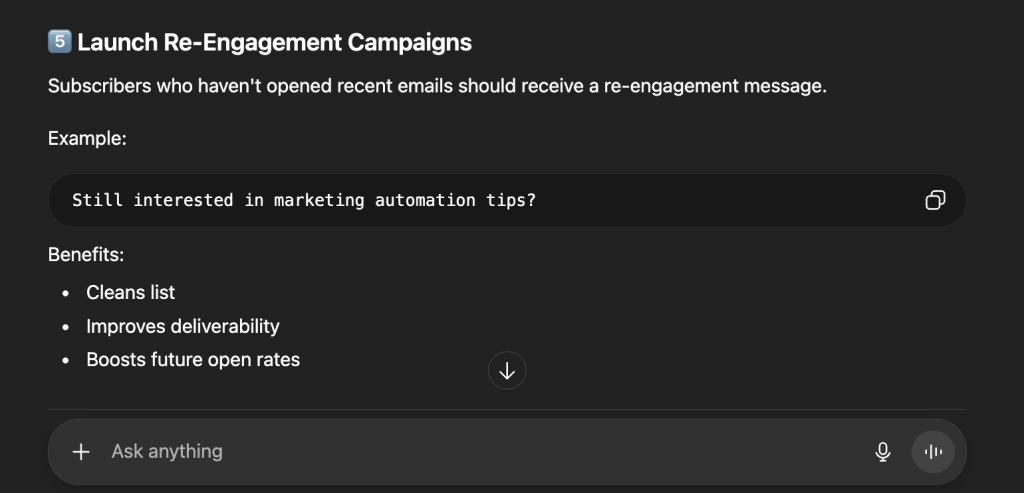
- Re-engagement protocol: ChatGPT suggested a specific “Still interested?” automated campaign to clean inactive subscribers off the list and protect future deliverability.
Comparison: Claude vs ChatGPT for email marketing analysis
| Claude | ChatGPT | |
| Primary lens | Risk management: Focuses on bounce rates and unsubscribe “red flags.” | Conversion lift: Focuses on subject lines and send-time testing. |
| Deliverability logic | Recommends immediate validation of soft-bouncing addresses. | Recommends a specific campaign to wake up inactive users. |
| Content advice | Noted that 0% clicks usually mean a “missing link” error. | Recommends a specific “Headline → Benefit → CTA” layout. |
| Tone | Forensic, cautionary, protective | Strategic, actionable, prescriptive |
Important:
Important:
Always verify AI-generated insights against your source data. Even the best LLM for data analysis can occasionally hallucinate or misinterpret complex data patterns; use AI to accelerate your thinking, not replace your final review.
Test the results on your own marketing datasets
Try Coupler.io for freeWhich LLM is best for data analysis?
The right answer depends on your workflow. Claude and ChatGPT have distinct analytical personalities that produce two very different lenses on the same marketing data.
Additionally, it’s important to note that if you compare LLMs vs dashboards, the former cannot be a complete replacement for the latter.
Claude is the Chief Strategy Officer you bring in when you have a 100-page performance report and need someone to find the “why.” It reads marketing data as a living ecosystem to spot risks like deliverability red flags or brand-voice drift and evaluate funnel integrity with an eye on long-term brand health.
ChatGPT is the Growth Lead you call when you need to move the needle by tomorrow morning. It is highly mathematical and tactical, quickly identifies “missing click” opportunities, and produces specific before-and-after blueprints for immediate action. It goes beyond data analysis tasks and delivers a high-velocity roadmap to scale what is already working.
The core distinction can be summarized as follows:
- Claude suits the Marketing Director who needs to understand the “why” and make sure every dollar is pulling its weight strategically.
- ChatGPT suits the Growth Lead who needs to know “how much” and “how fast” to move resources for maximum immediate conversions.
Best LLM model for data analysis in 2026
| Use case | Claude models (Anthropic) | ChatGPT models (OpenAI) |
|---|---|---|
| Deep research | Opus 4.6 (Best for complex audits) | GPT-5.4 Pro (Best for high-stakes math) |
| Daily analysis | Sonnet 4.6 (Balanced & smart) | GPT-5.4 Thinking (Detailed logic) |
| Quick tasks | Haiku 4.5 (Fast & cheap) | GPT-5.4 Mini (Quick summaries) |
| Main strength | Context: Connects dots in huge files. | Action: Tells you exactly how to scale. |
Ready to put these insights to work?
Get started for free


