Reporting is the only agency deliverable that multiplies with every account you win. The work doesn’t get harder, there’s just more of it, and none of those hours go into strategy or campaigns.
The data export step is the obvious thing to automate, but it isn’t the only one. Data preparation, delivery, refresh, and the analysis you’d otherwise do before a client call can all run without manual work. Below: I’ll show you where the hours actually go, what to report for each service line, and how to automate marketing agency reporting with Coupler.io.
What manual client reporting costs your agency
Building a client report is assembly work. The same sequence repeats every cycle:
- Exporting from each platform, whether that’s a CSV download or a copy-paste into a shared sheet
- Capturing screenshots for anything that won’t export cleanly
- Dropping the exports into an AI tool for a summary, then checking the numbers it hands back
- Writing context around each number so the client knows what changed and why
- Formatting all of it into a document or a slide deck
None of it requires judgment, and all of it requires someone’s afternoon. In our own survey of B2B marketing professionals and leaders, 22% named reporting one of the most time-consuming parts of their job.
Assembly costs accuracy too, and a wrong number in front of a client is expensive in a way a late report is not. Formatting drift does its own damage, since a report that looks different depending on who built it reads as carelessness.
It’s worth spending your hours on what the report says instead. Aaron Whittaker of Thrive Agency put their reporting on the client’s business outcomes rather than campaign activity:
[In our experience,] effective reporting directly impacts client retention through demonstrated value. After implementing business-outcome reporting frameworks showing marketing’s contribution to the sales pipeline, our client retention increased significantly. This approach helps our clients understand marketing’s impact on their business goals rather than just activity metrics.
AI mostly gets pointed at that third step in the manual process. Reporting is now where agencies see the most value from it, at 42% in AgencyAnalytics’ 2026 benchmarks report. But a model handed a raw export can’t tell a test campaign from an active one. Inaccuracy is the most common negative consequence of AI use, according to McKinsey’s State of AI survey.
A managed data layer fixes that, and that’s what Coupler.io handles before anything reaches a report. You can connect a client’s accounts, organize the data, and keep the report refreshed, whether that’s a dashboard, a spreadsheet, or a data set feeding a BI tool at the same time. Your team can also ask questions of that prepared data in plain language.

Get every client's data report-ready with Coupler.io
Book a demoHow to automate marketing agency client reporting with Coupler.io
Coupler.io handles the whole reporting cycle in one place: the account connections, the data preparation, the report itself, and the analysis on top of it. Setting it up takes one pass per client, and the next client with the same platform mix takes less.
Step 1: Connect the client’s accounts and shape the data
Tell Coupler.io’s AI Agent what the report has to show and which accounts it should pull from. For example: “Set up a weekly paid media report for Client X covering Google Ads and Meta Ads, with spend, conversions, and cost per conversion by campaign.” Coupler.io connects data from 400+ business apps, so any of the client’s accounts can go in the same request.
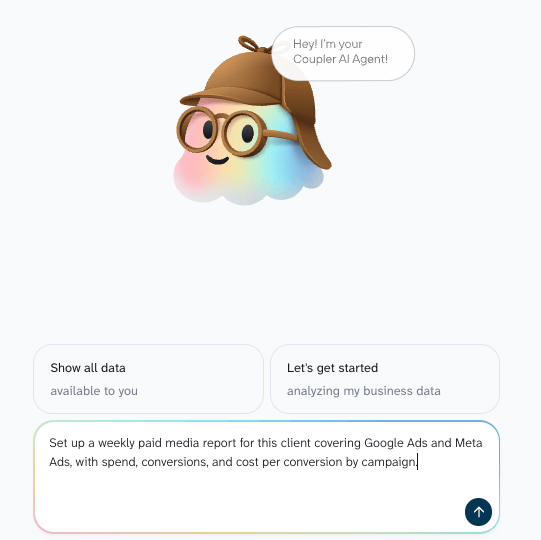
Shaping happens in the same conversation. Ask it to drop the branded campaigns, roll daily rows up to weeks, standardize campaign naming, or bring Search Console in alongside the paid data. That way you’re working with clean, complete data from the start.
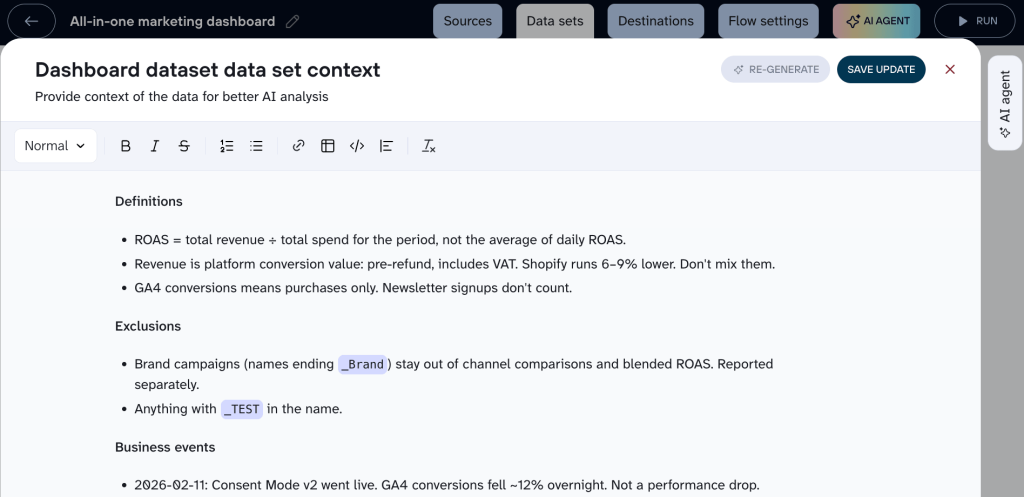
What the numbers mean for this client, like how they define a qualified lead, gets written into the data set’s context outside the chat. Write it once and it carries into every dashboard and answer built on that data.
Step 2: Deliver it where the client looks
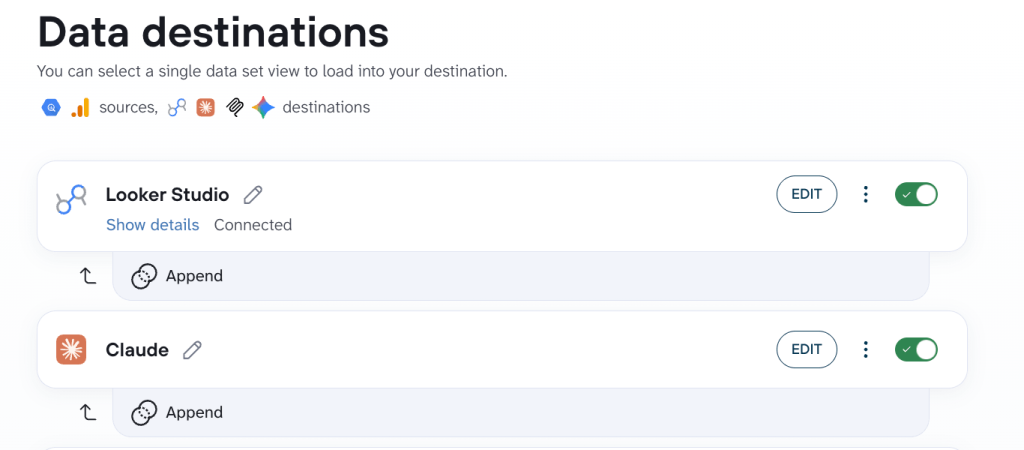
Ask the AI Agent to send the data to the client’s preferred tool. Again, one flow carries several destinations at once, so the dashboard your account manager works from and the spreadsheet the client checks run off the same data.
The prepared data set can go to Google Sheets, Excel, a BI tool like Data Studio or Power BI, a warehouse like BigQuery, or AI tools like Claude and ChatGPT.
For a quicker start, use one of the free templates I linked earlier covering the standard cross-channel and funnel views.
That said, not every client wants a shared dashboard. When they want a file, export comes from the BI tool rather than Coupler.io: Data Studio can email a PDF on a schedule, and Power BI exports to PowerPoint for a deck. The numbers in it are already up to date, so you just check it before it goes out.
Finally, ask the AI Agent to turn on automatic refresh and set the interval cadence. Tie it to the send date: a report going out Monday morning refreshes Sunday night. Intervals run from monthly up to every 15 minutes depending on your plan, and daily covers most client reporting.
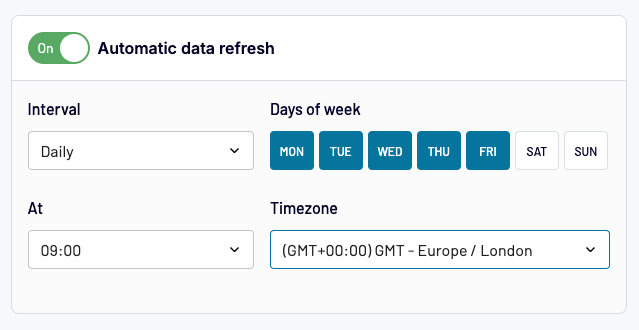
One schedule covers every destination you connected, so they all update together. You can also manually trigger a run yourself when a client asks for figures ahead of the cycle.
Bonus: Analyze the data with AI
When a client emails mid-month about their cost per lead, put the question to the AI Agent and answer it that day:
"Which campaigns spent more this month than last but produced fewer conversions?""Compare cost per qualified lead by channel against the previous quarter."The answer comes back with the figures and the breakdown behind them, so the client gets a detailed reply:
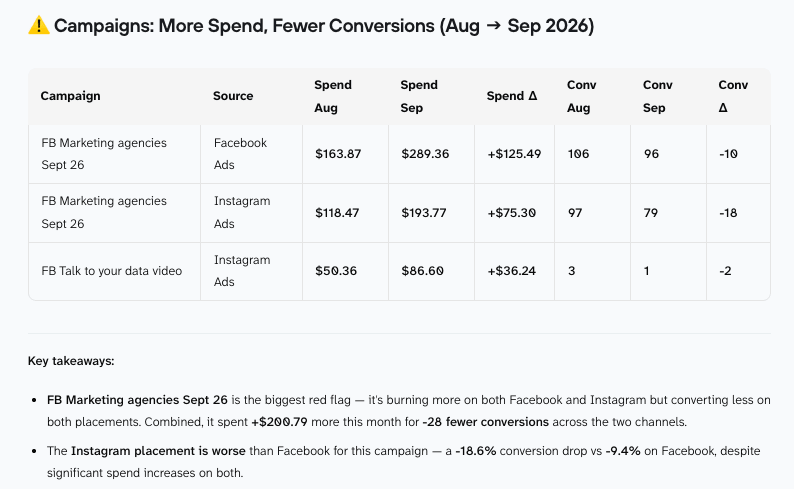
You might usually do this by pasting client data into your AI tools, but that brings two problems: the file you share is a snapshot, and the model has to do the maths itself. Coupler.io’s Analytical Engine runs the calculation against the client’s connected accounts, applying your definitions, so the figure isn’t an AI guess – it matches what’s in the client’s dashboard.
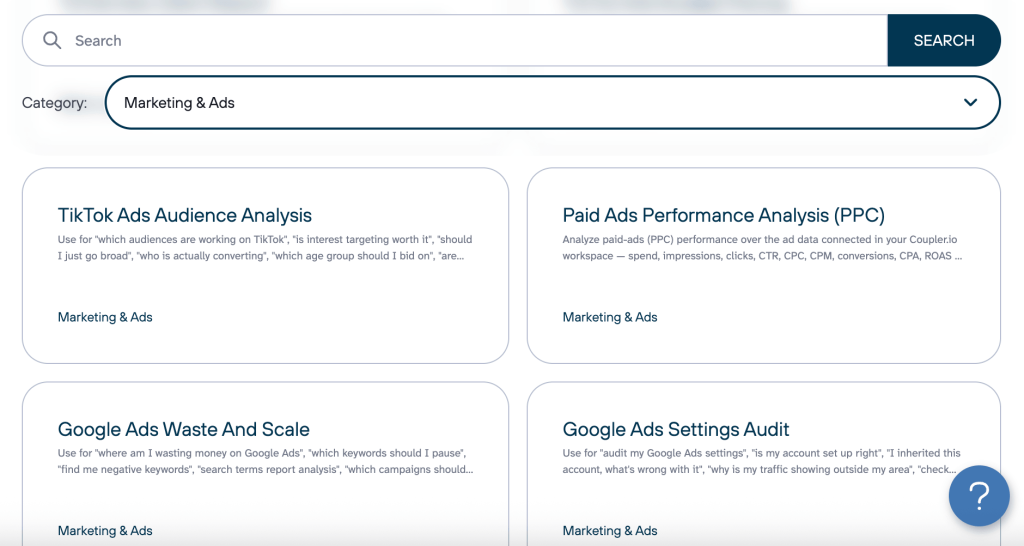
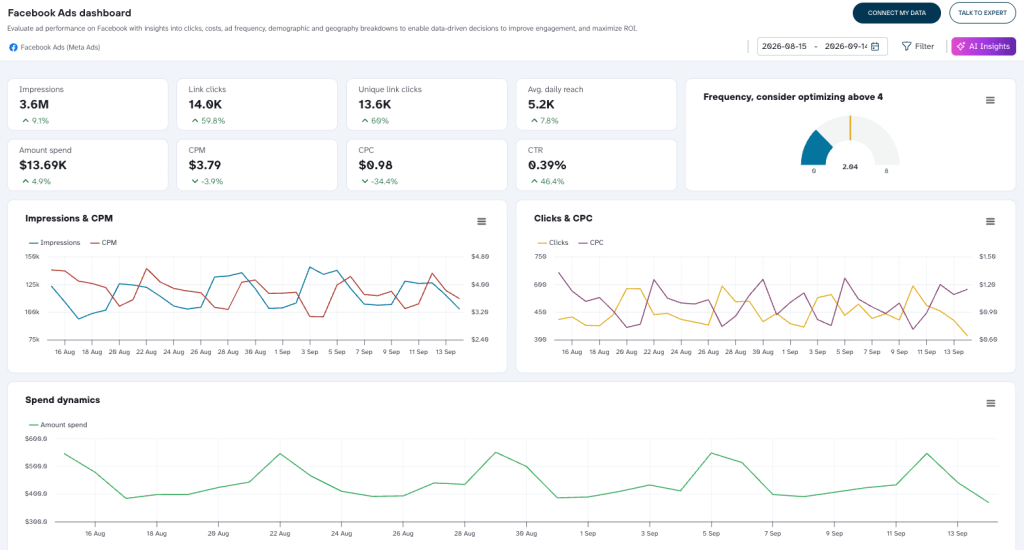
For the reviews you run monthly on every account, pick one of 30+ pre-built AI Skills for marketing so the analysis follows the same method each time. As examples, Facebook Ads Client Report skill writes up last month’s performance for a client deck, and the Paid Ads Performance Analysis (PPC) covers the entire cross-channel view.
Answer client questions between reporting cycles with Coupler.io
Book a demoWhat clients want from a report
Client preferences have split rather than shifted. In the benchmarks data above, 35% of clients prefer static reports, 35% prefer a call or meeting, and 27% prefer a dashboard they can open themselves. Internally it isn’t close: 59% of agency teams work from dashboards for their own review.
So build for your team and deliver in the client’s format. One prepared data set in Coupler.io can populate multiple destinations: the dashboard your marketing analyst works from, a spreadsheet for a client, and a performance breakdown in an AI tool, without anyone rebuilding the report three times.
Ask two things at kickoff: how they want to receive the report, and what decision it informs each month. Beyond that, expectations are consistent:
- The numbers that matter at the top of the page
- The same layout every month, so this cycle can be compared against the last
- Enough context that a figure doesn’t need a follow-up email
Khan Muhammad Imran, Founder & CEO of Brand Ignite marketing agency, described how they handled clients who expected long reports “filled with vanity numbers”:
We [built] what we call the ‘Decision Trigger Report’. Instead of handing over long documents with endless KPIs, we give clients one report with three core insights tied directly to decisions they need to make next month. For example, rather than showing ad impressions, we show them which creative drove the most pipeline-ready leads and recommend whether to scale or pause it.
The report should also look like it came from your agency. Coupler.io’s dashboard templates are white-label, so you set the logo, colors, and layout before anything reaches a client. Build one branded version and clone it per client, since inconsistency between accounts is what makes reporting look outsourced.
How to choose KPIs for each client
Every ad platform gives you fifty metrics to choose from. Pick from that list and you end up with a report about the platform rather than about the client.
Think: what does this client decide each month? Usually it’s a budget question. Raise the paid spend, hold it, move some to another channel, or stop funding one that isn’t working. Every metric on the report should help answer that.
That makes the set specific to the account, even for clients buying the same service:
- An ecommerce brand deciding whether to raise spend needs ROAS by channel, blended CAC, and how much revenue comes from new customers versus returning ones.
- A B2B client choosing which channels keep their budget needs cost per qualified lead, lead-to-opportunity rate, and pipeline value by source. Lead volume on its own says nothing about quality.
- A local service business wants calls, form fills, and cost per booked job.
- An SEO retainer wants qualified organic sessions, page-level conversions, and position for the terms that bring in buyers.
Keep the set small enough that the client can remember it. Four to six main KPIs usually work well.
Some agencies use the same set for everyone instead. Daniel Thompson, Founder of Salt Water Digital agency, cut his reports back after working out what they cost him:
We used to send out longer 5-6 page reports each month but we found our time was better spent working on the clients campaigns than reporting on them. [So] we’ve taken the less popular route of keeping our reports short and concise. We have 3-4 KPIs we track for every client and unless they specifically ask, those are the KPIs they receive – traffic, conversions, & keyword tracking.
That works when the accounts are similar. With a mixed roster, keep the layout the same for everyone and let the metrics follow what each client is deciding.
Write the set down once it’s agreed, and check it every quarter. What a client decides in month one is rarely what they decide in month nine.
Types of marketing agency reports
Each service a client buys answers a different question, and the format follows from that.
| Report type | What it answers | Typical cadence |
|---|---|---|
| Cross-channel overview | Where the budget went and what came back | Monthly |
| PPC/Paid media | Which campaigns and creatives deserve more | Weekly |
| SEO and organic search | Whether visibility and qualified traffic are improving | Monthly, with a quarterly trend view |
| AI search traffic | Whether AI assistants send traffic and whether it converts | Monthly |
| Social media | Which platforms and posts hold attention | Monthly |
| Email marketing | Whether campaigns drive revenue, not just opens | Per campaign, rolled up monthly |
| Leads and revenue | Which channels produce pipeline rather than clicks | Monthly, reviewed quarterly |
| Internal | Where the team’s hours go and how much time each client costs | Monthly |
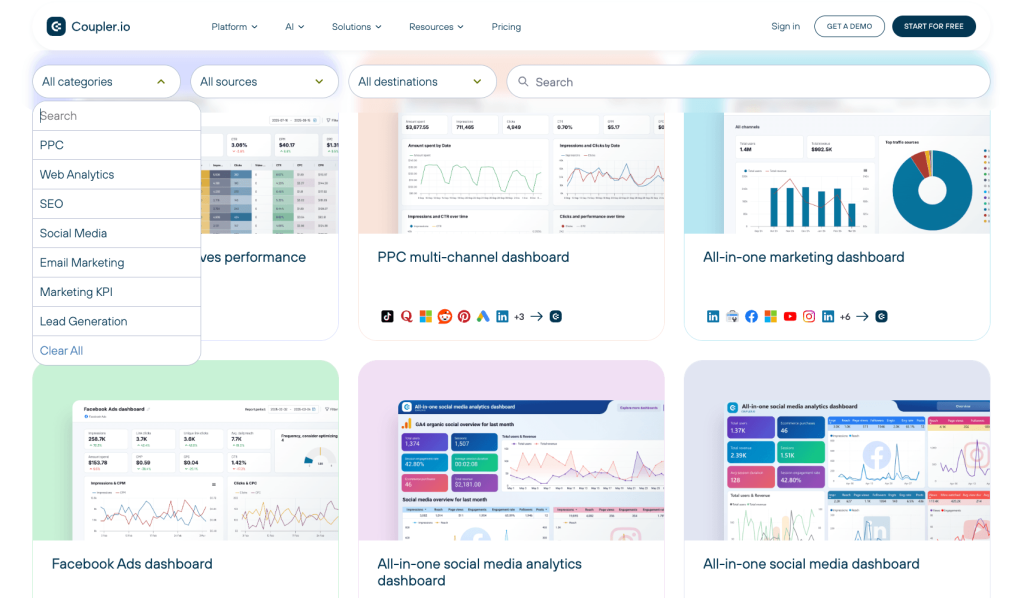
Which of these a client gets depends on their budget. A client running everything through Meta wants platform depth: frequency, placement, creative detail, and audience splits. A client spread across six channels wants the roll-up first, with the detail a click behind it. Most of these views already exist as 150+ marketing reporting templates in Coupler.io, so building one is a matter of connecting the accounts.
Cross-channel overview reports
The report a founder or CMO opens first, and often the only one they open. Total spend and total return on one page, channel detail underneath, and it answers the retainer question: what the budget produced, and which channels are carrying it.
Common KPIs:
- Total spend against total revenue or conversions
- Cost per acquisition across all channels
- Revenue by channel and by source/medium
- Sessions and users, split by channel group
- Month-on-month change on each of the above
Examples of pre-built cross-channel overview reports:
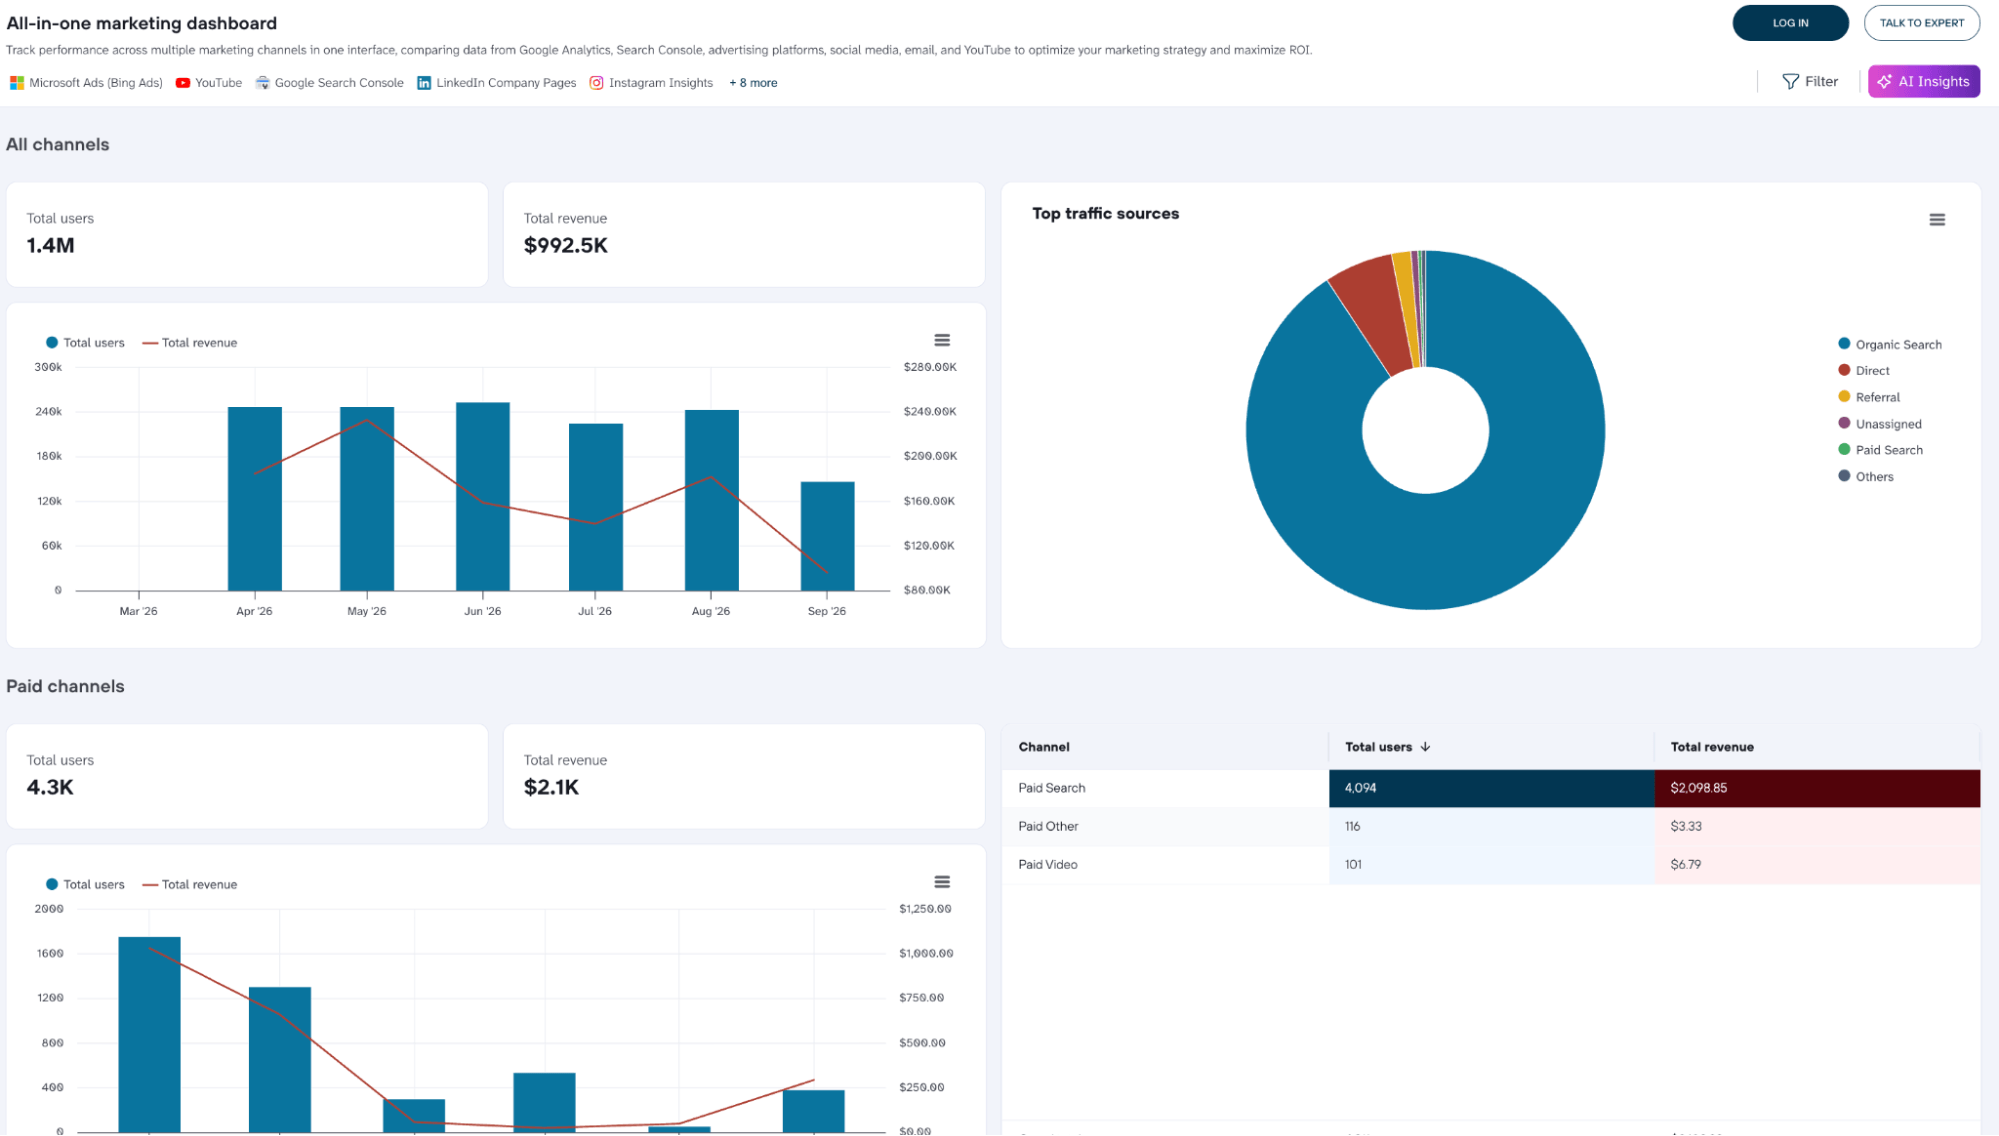


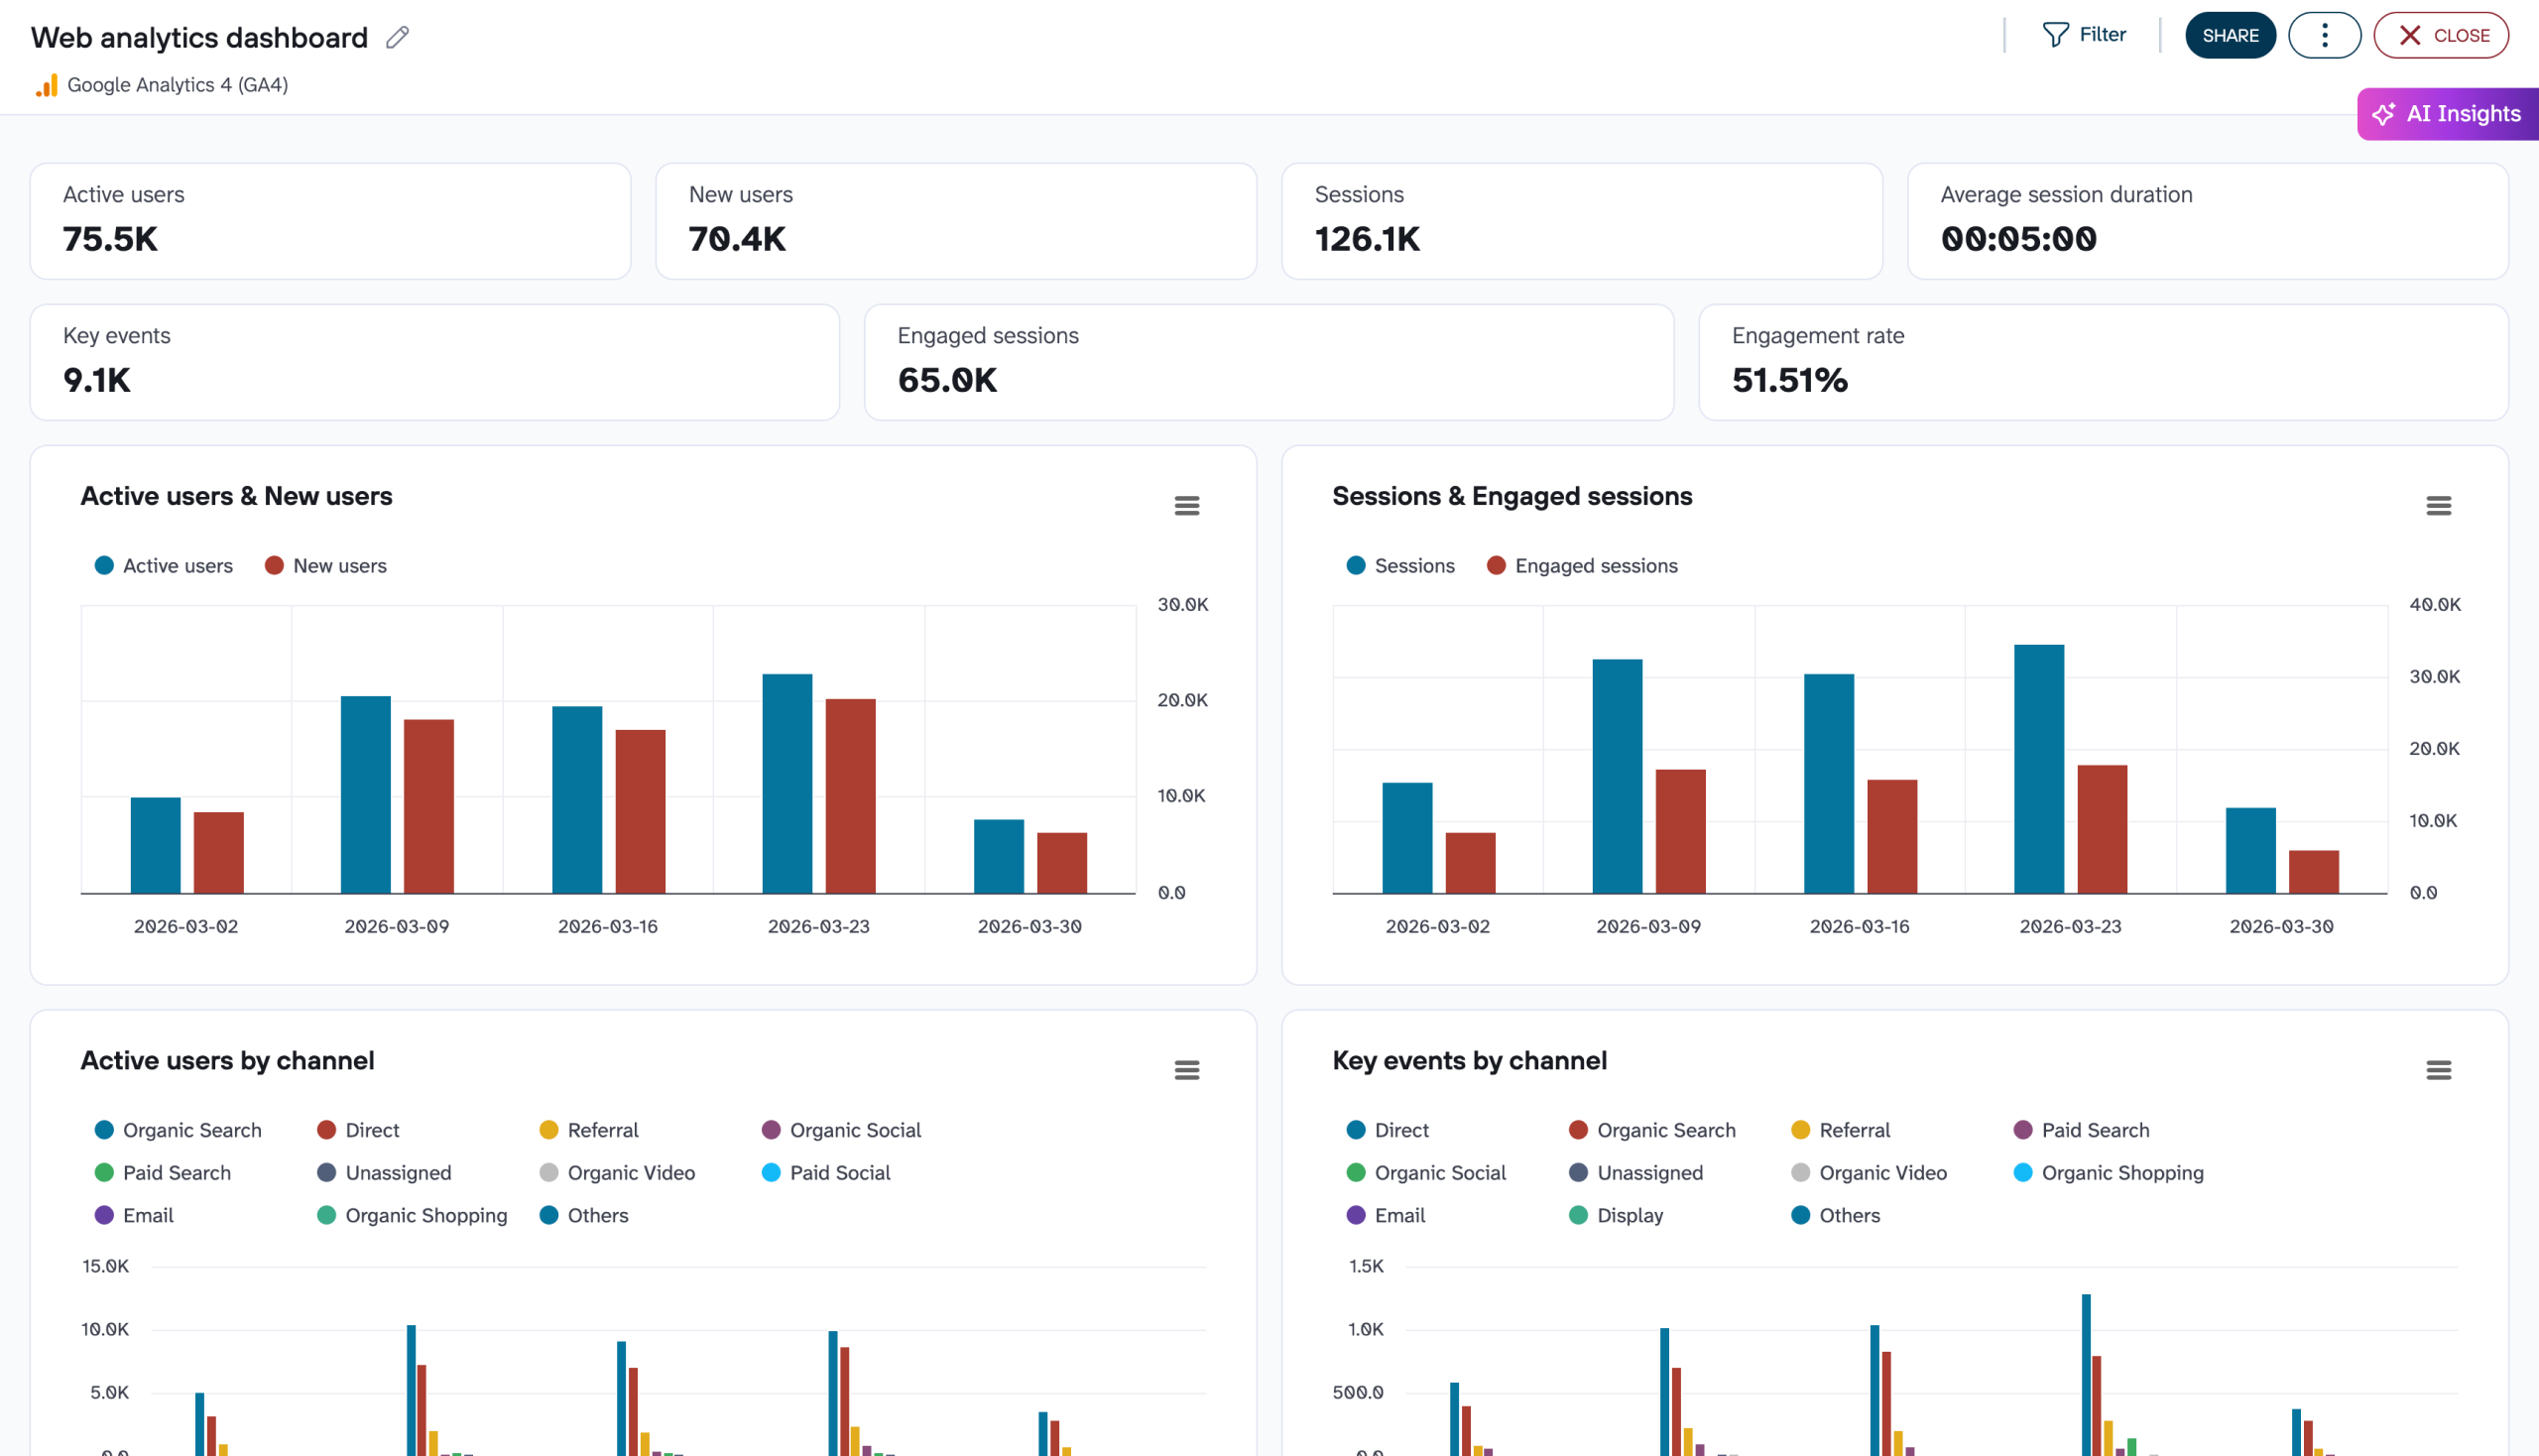
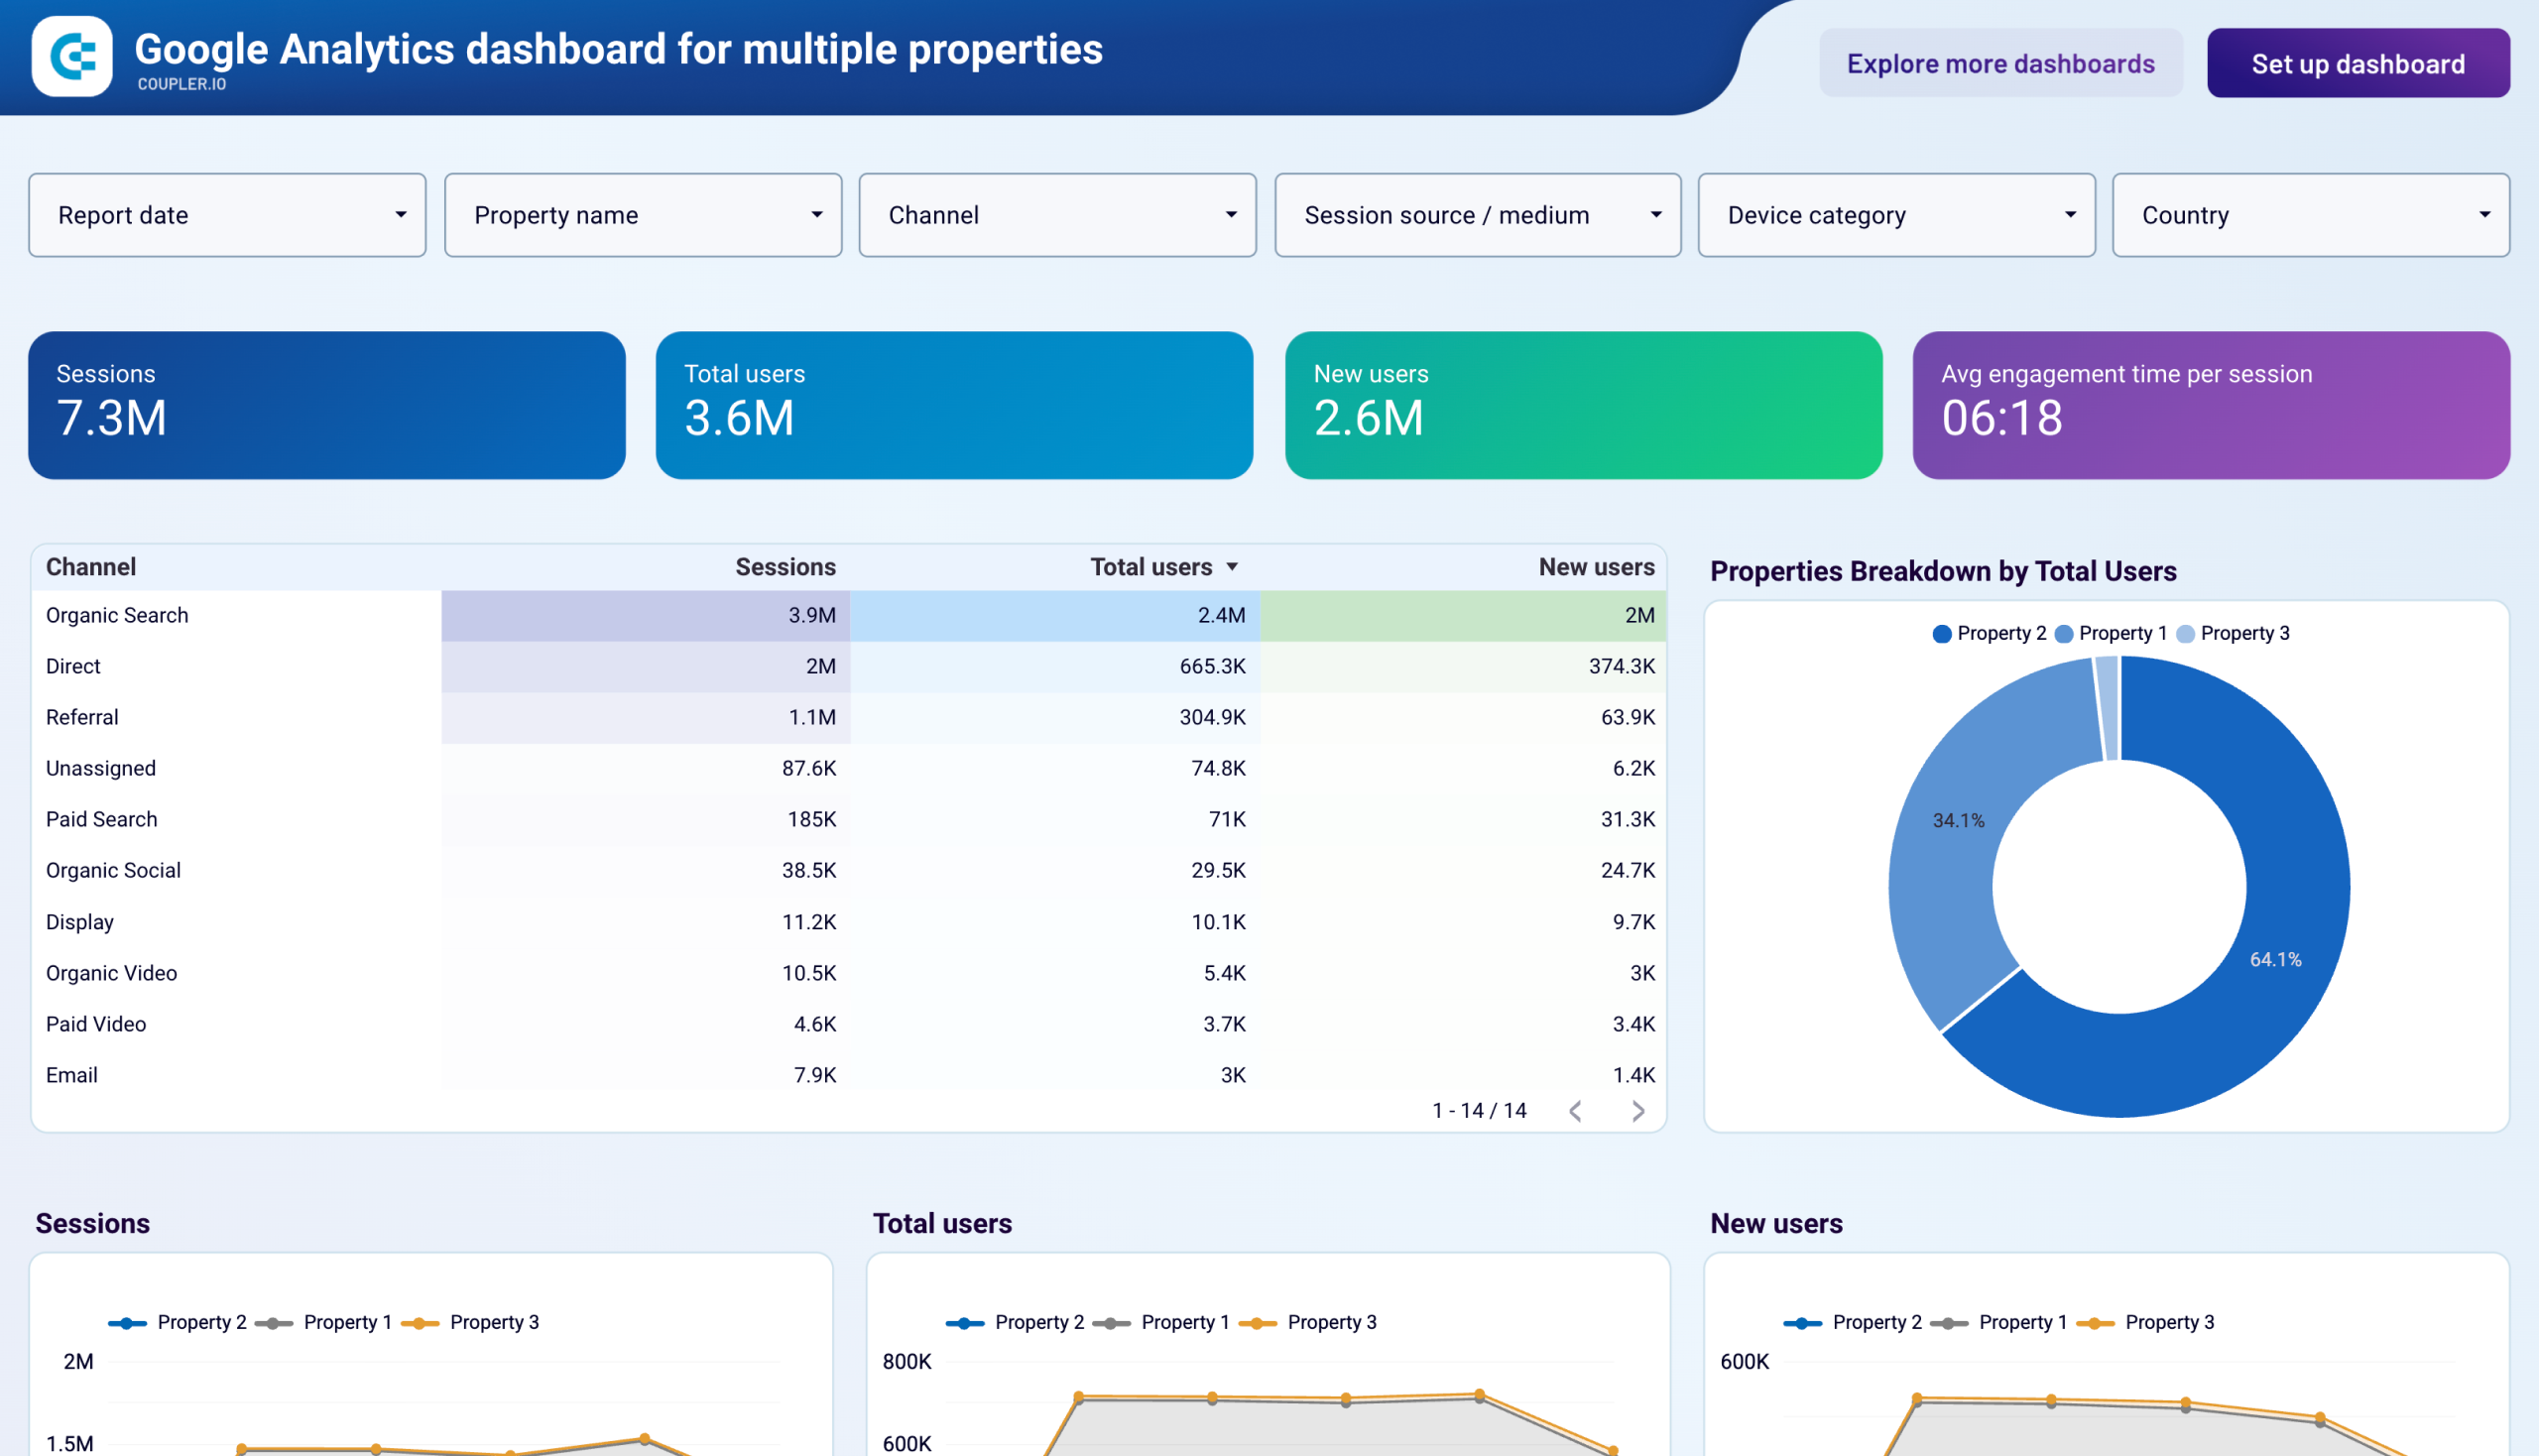
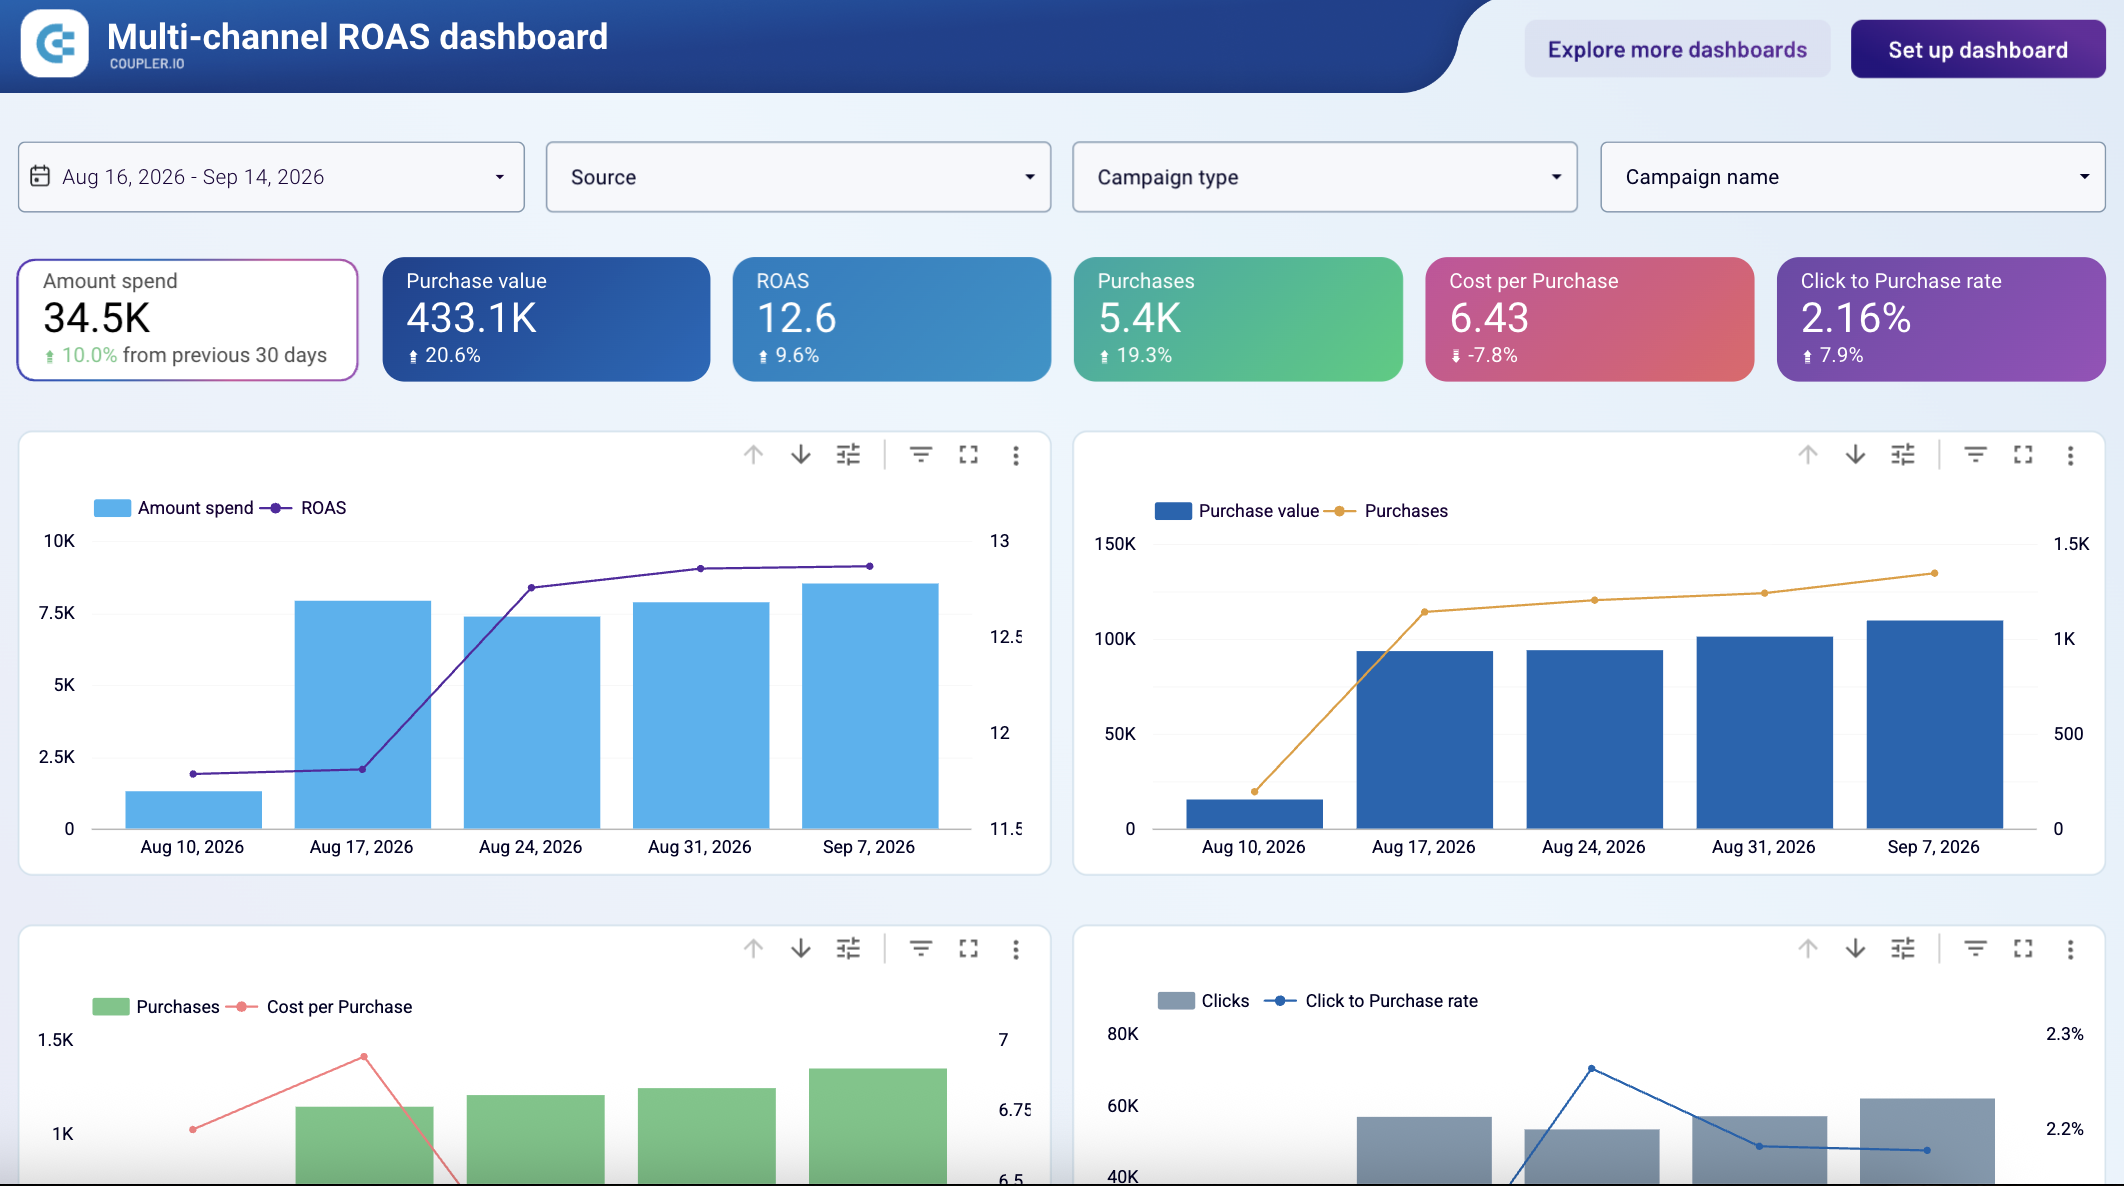

Reporting on a client’s separate GA4 property takes some setup. GA4 for agencies covers how to get it right the first time.
Paid media reports
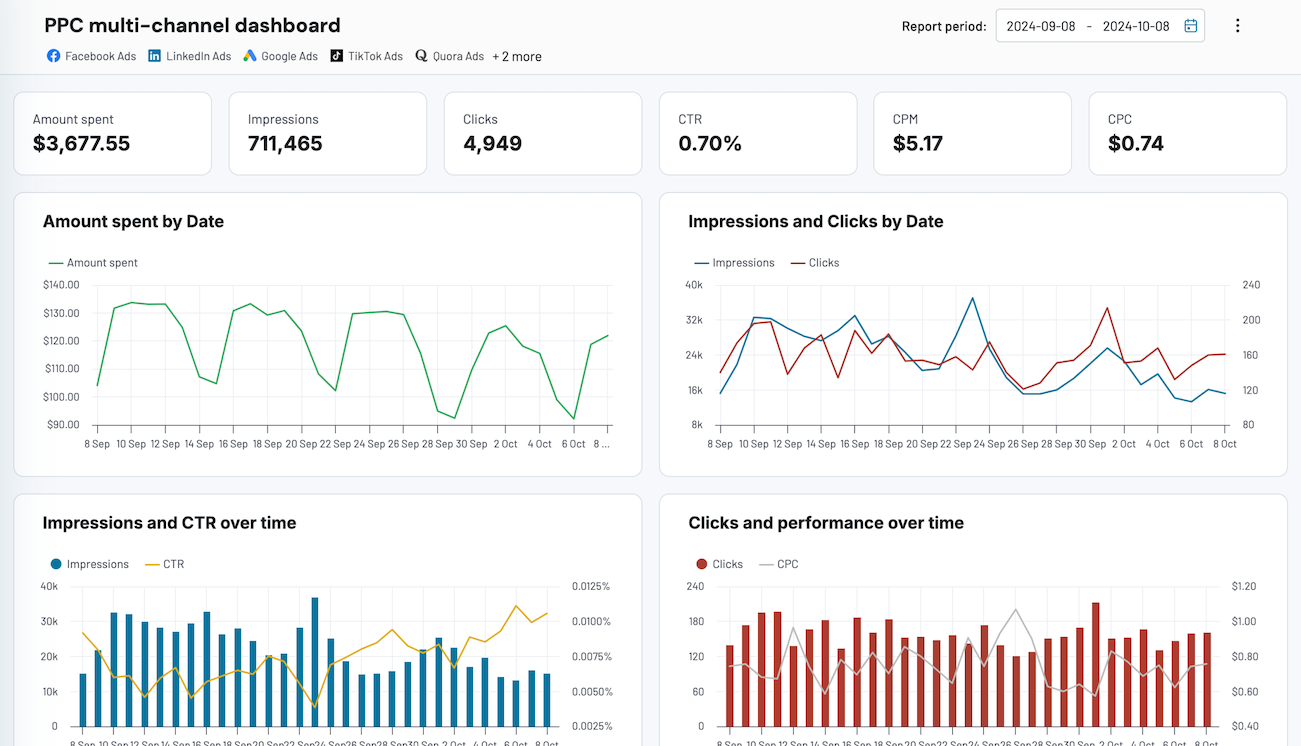
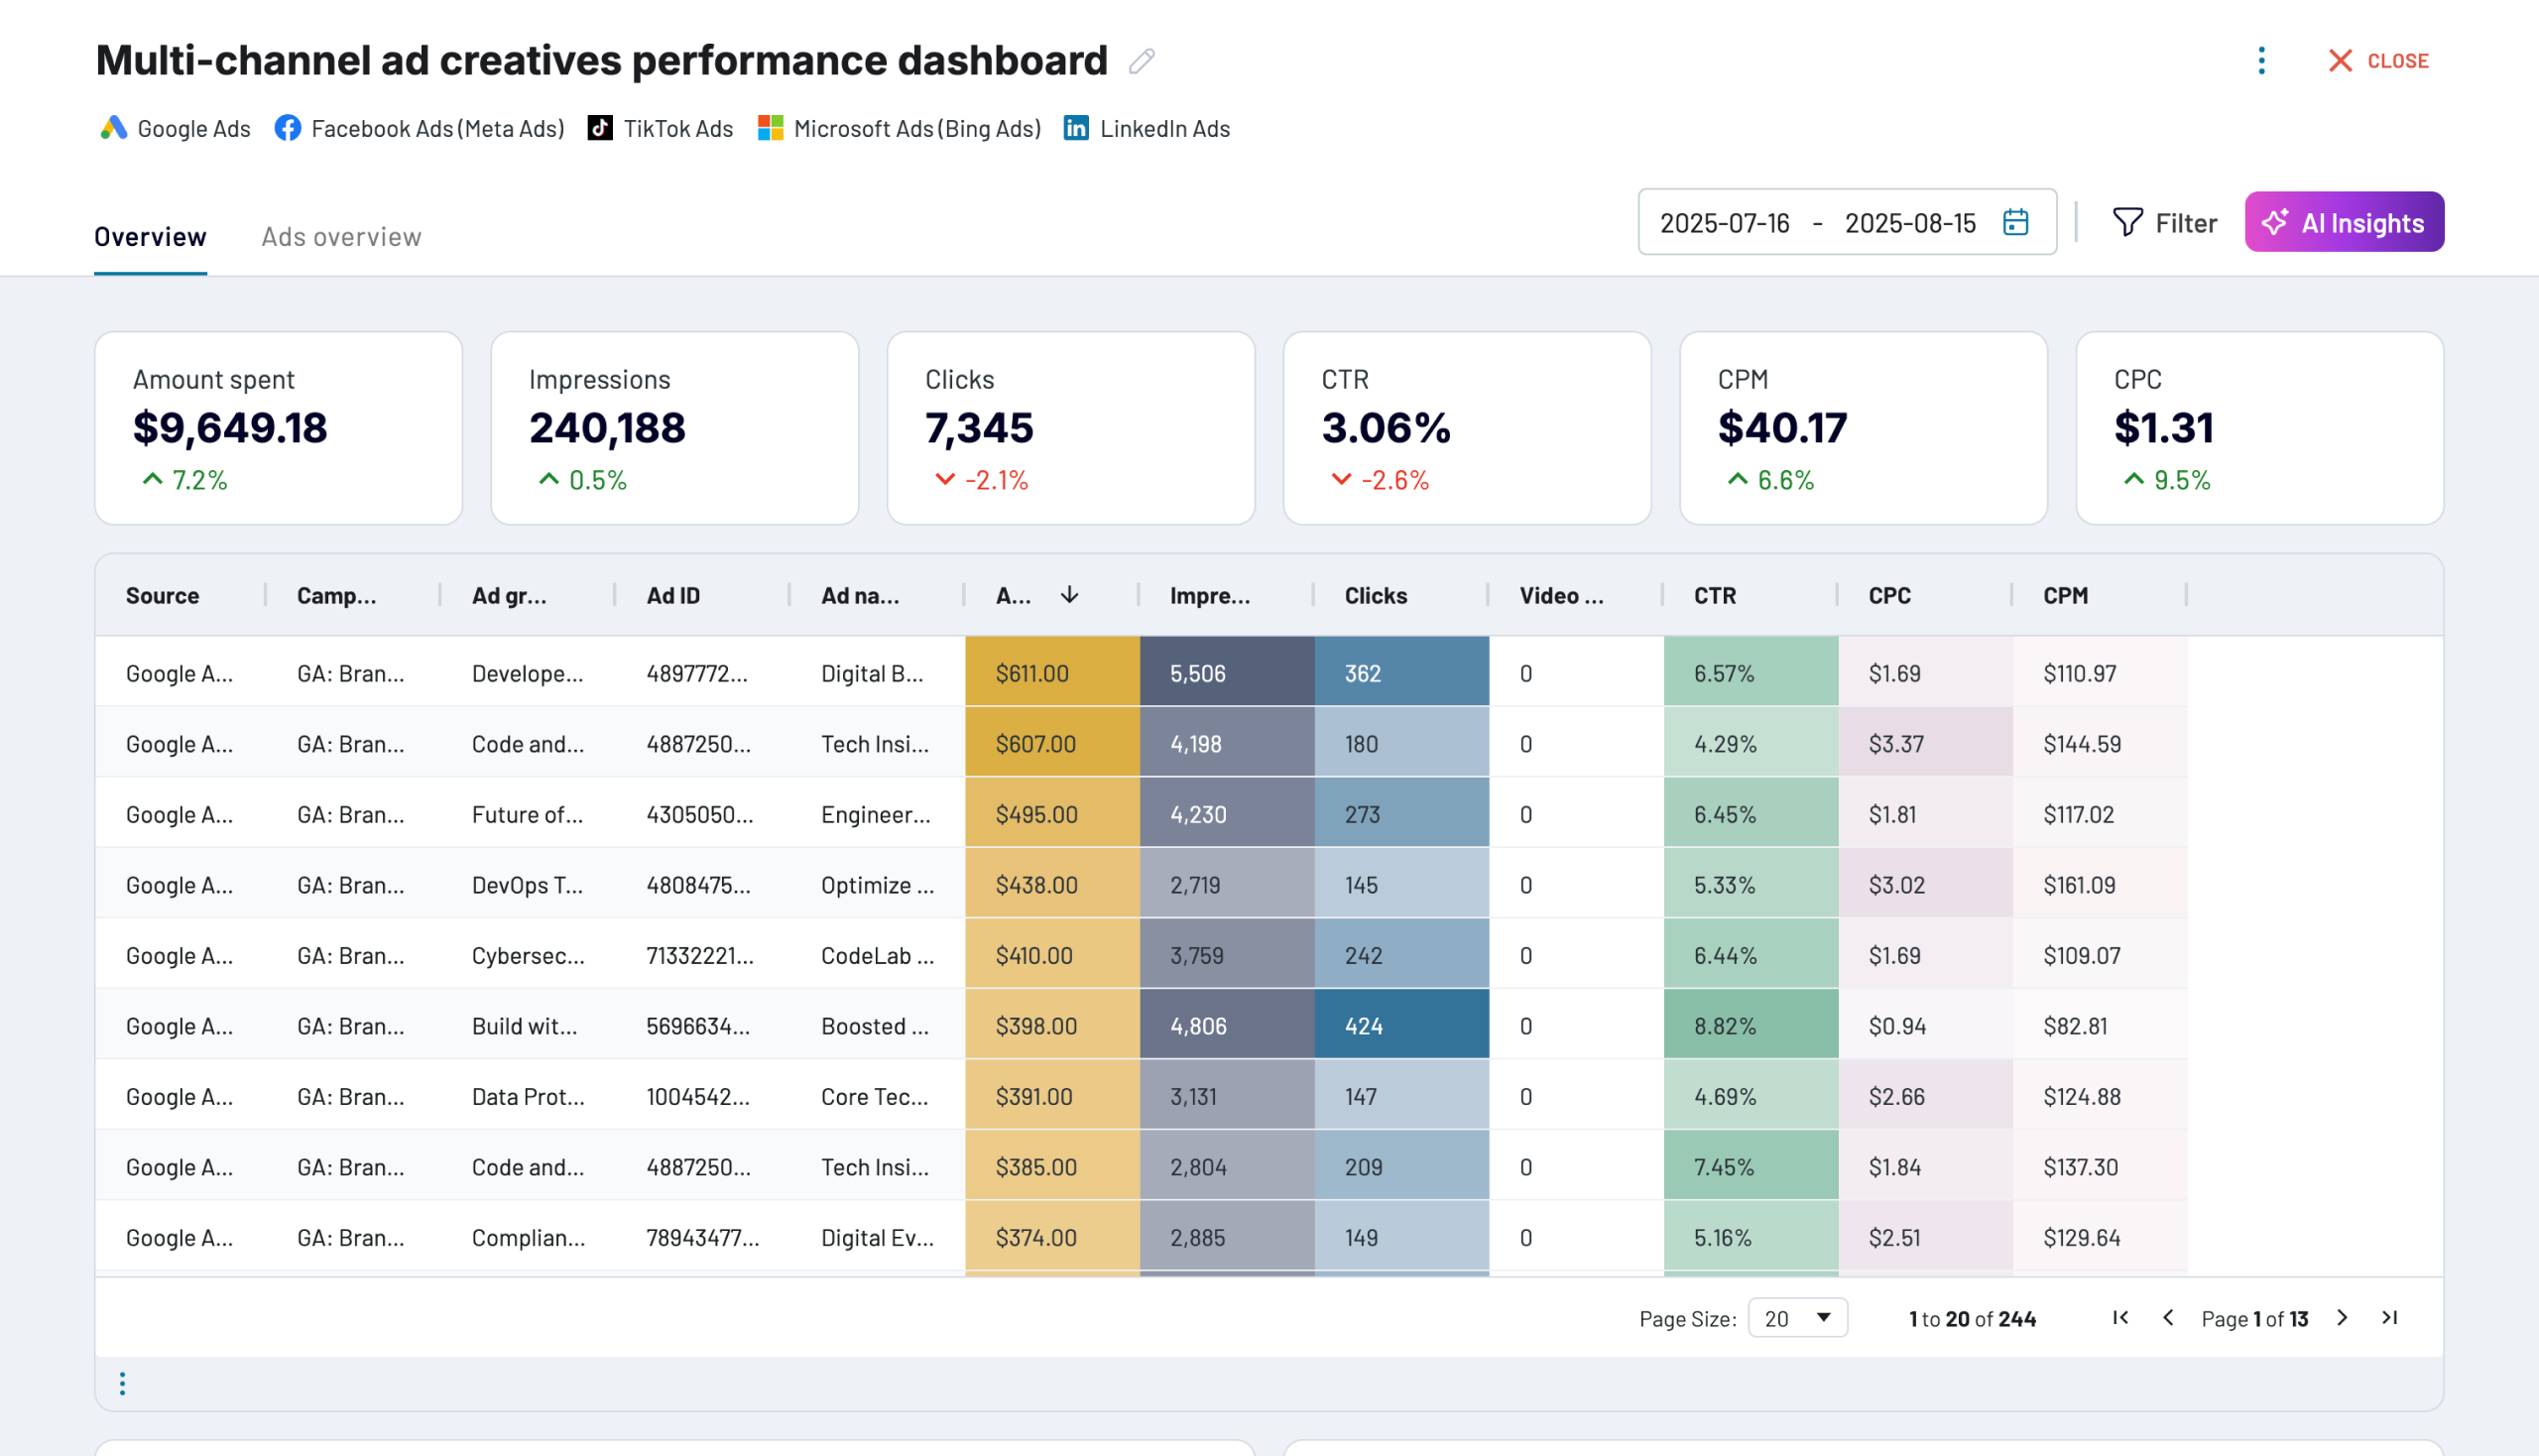
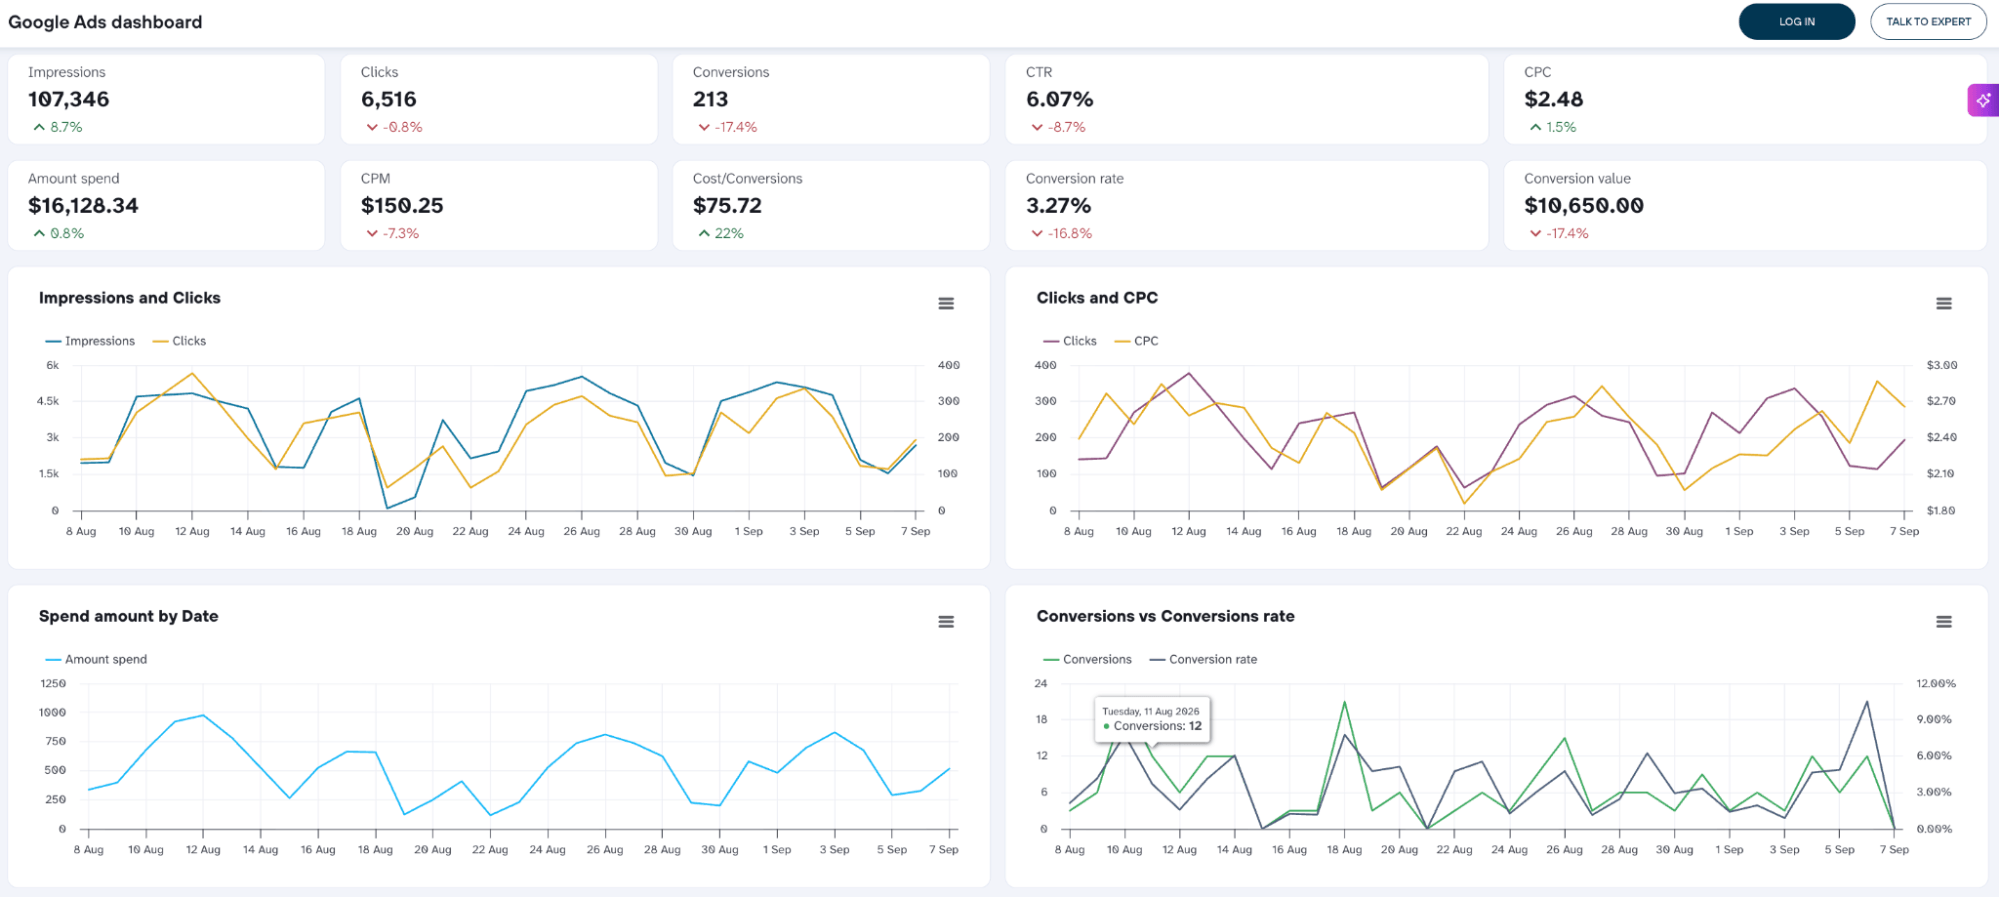
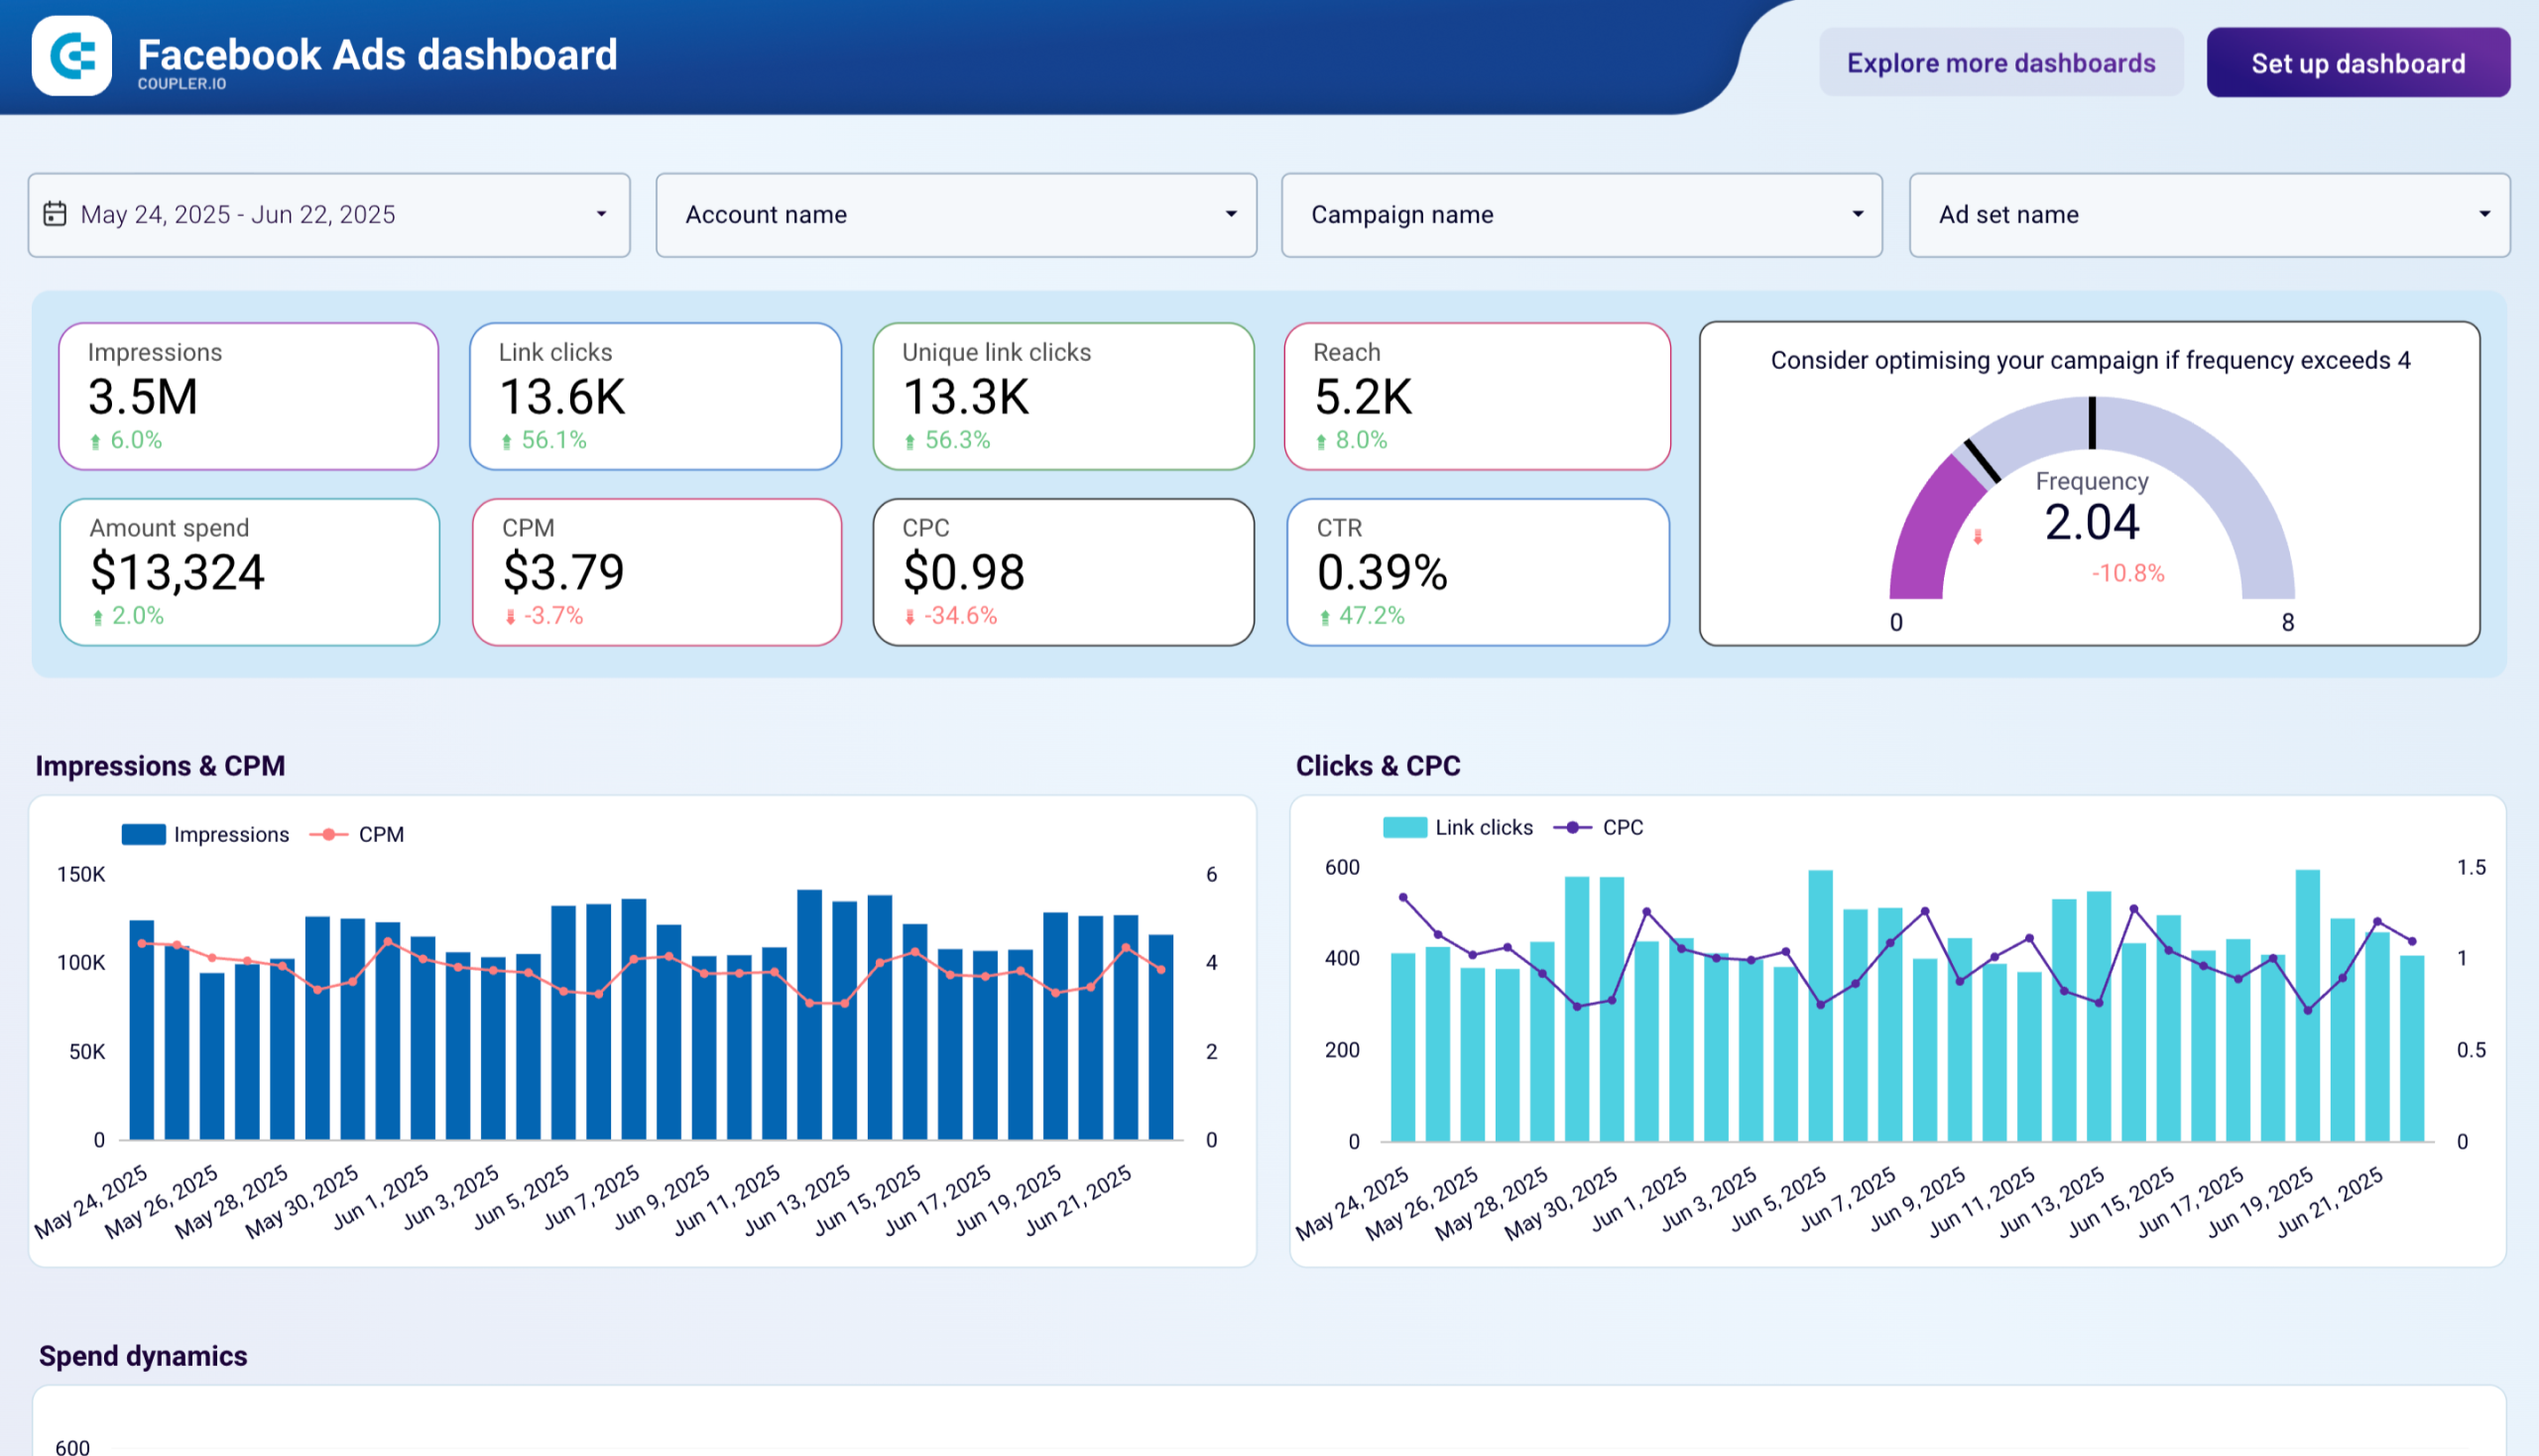
Paid clients are deciding what to fund next month, not reviewing how last month went, so this needs campaign and creative detail rather than channel totals.
Common KPIs:
- Spend, impressions, clicks, and CTR by platform
- ROAS or cost per conversion by campaign
- CPM and CPC trends
- Creative performance, including frequency and time since launch
- Pacing against monthly budget
Examples of pre-built paid media reports:


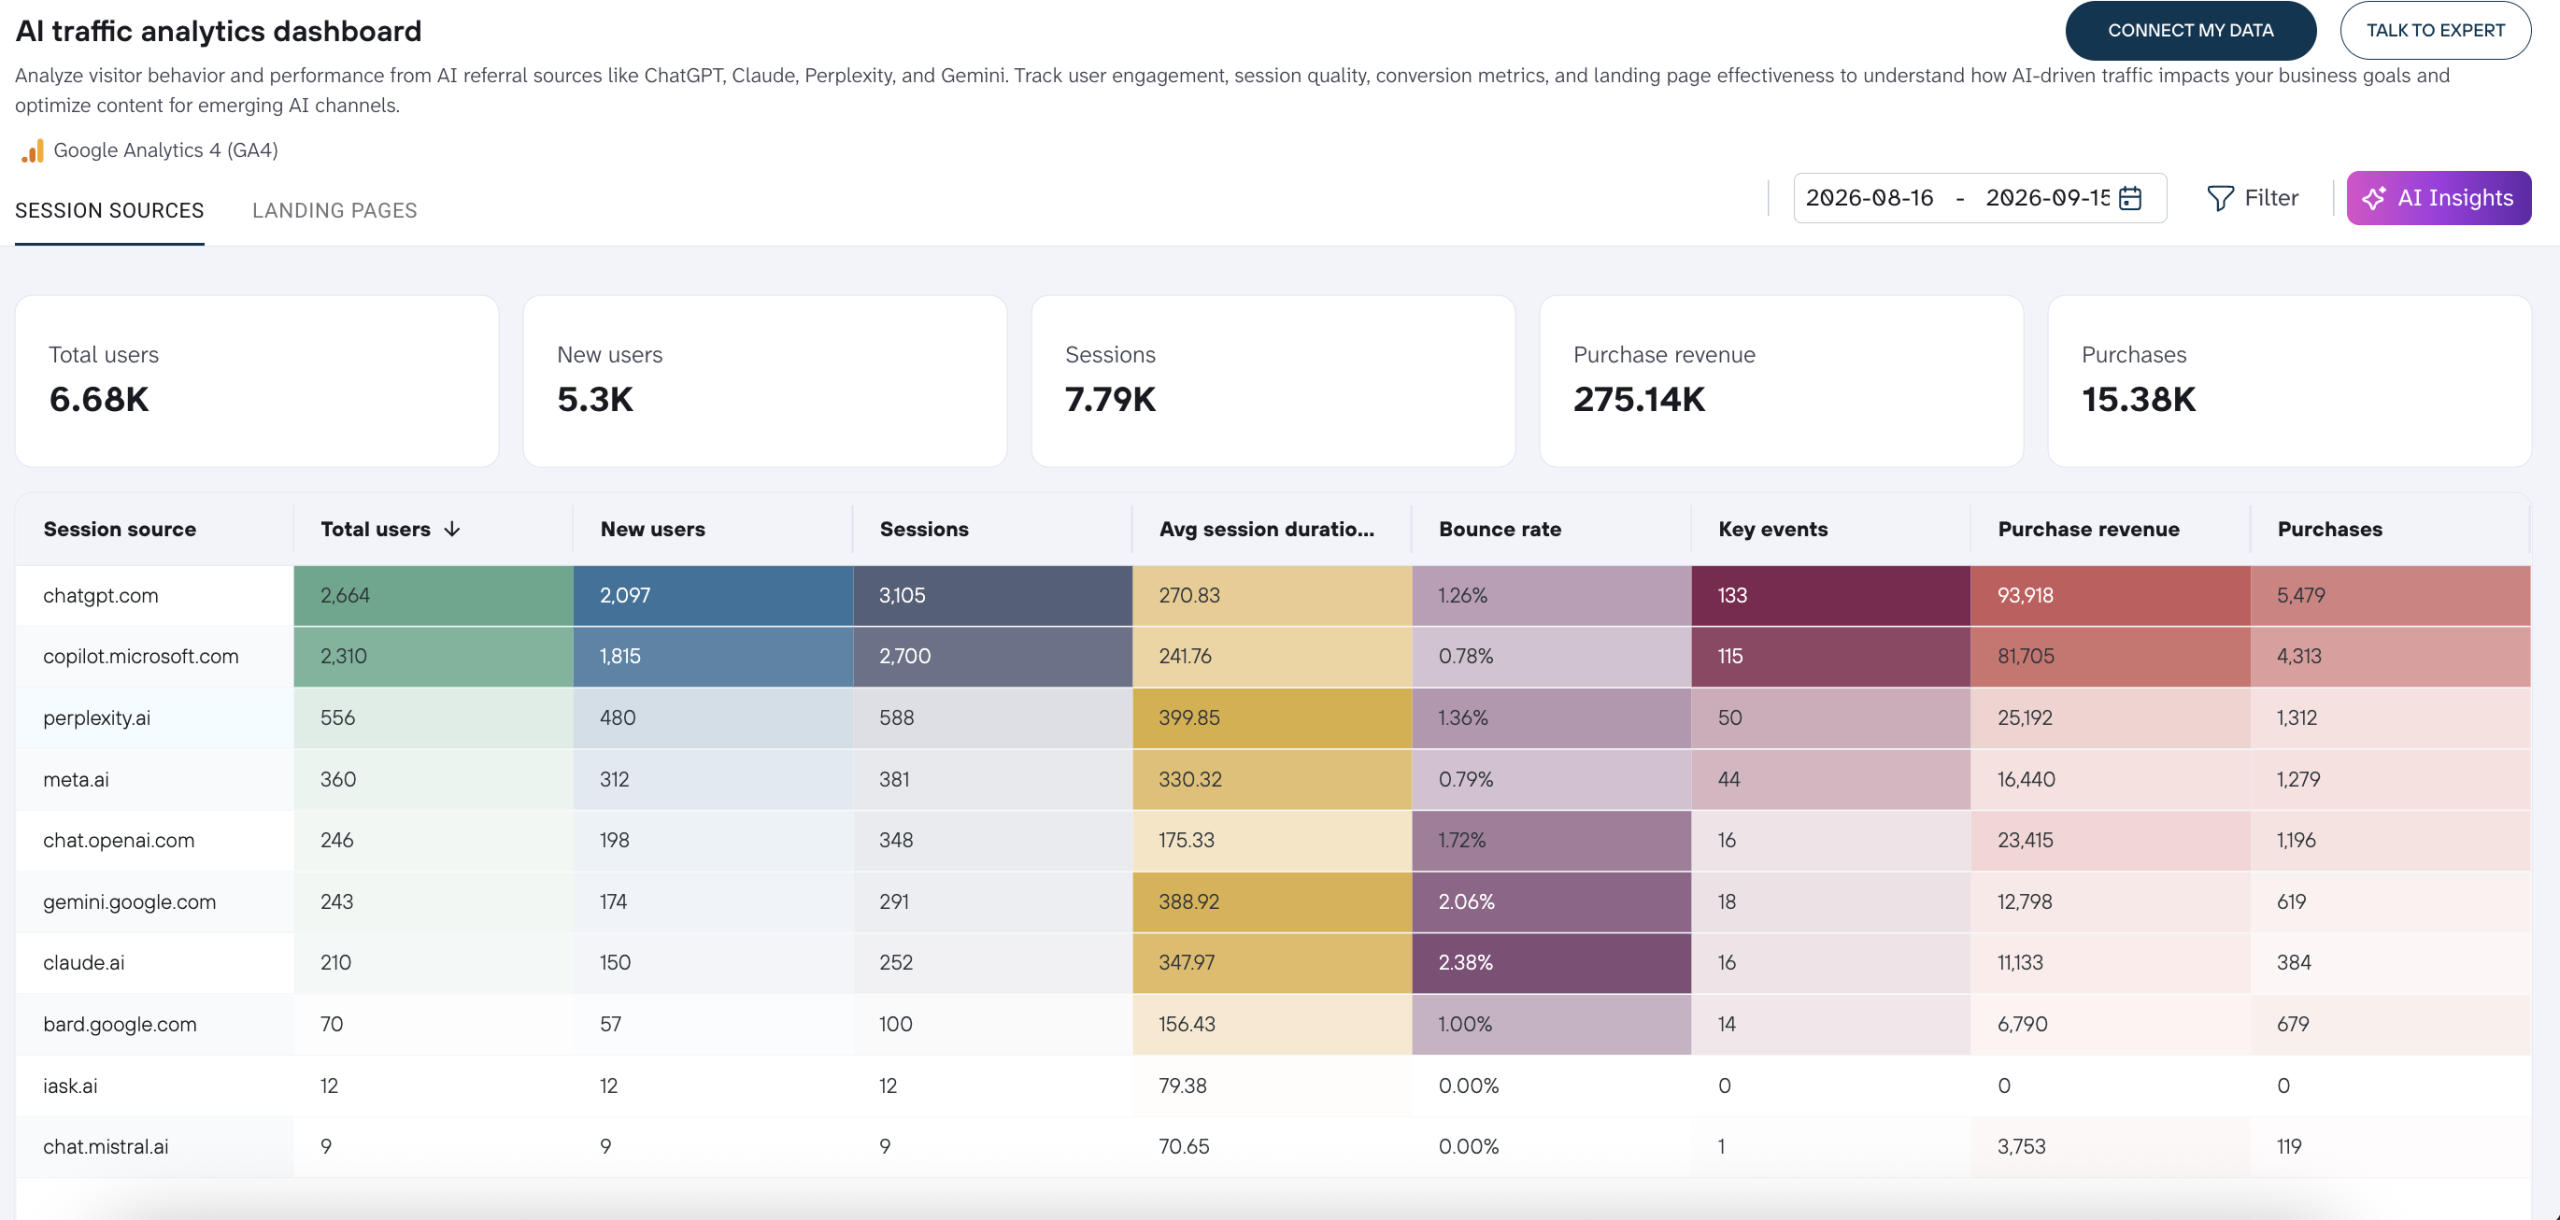
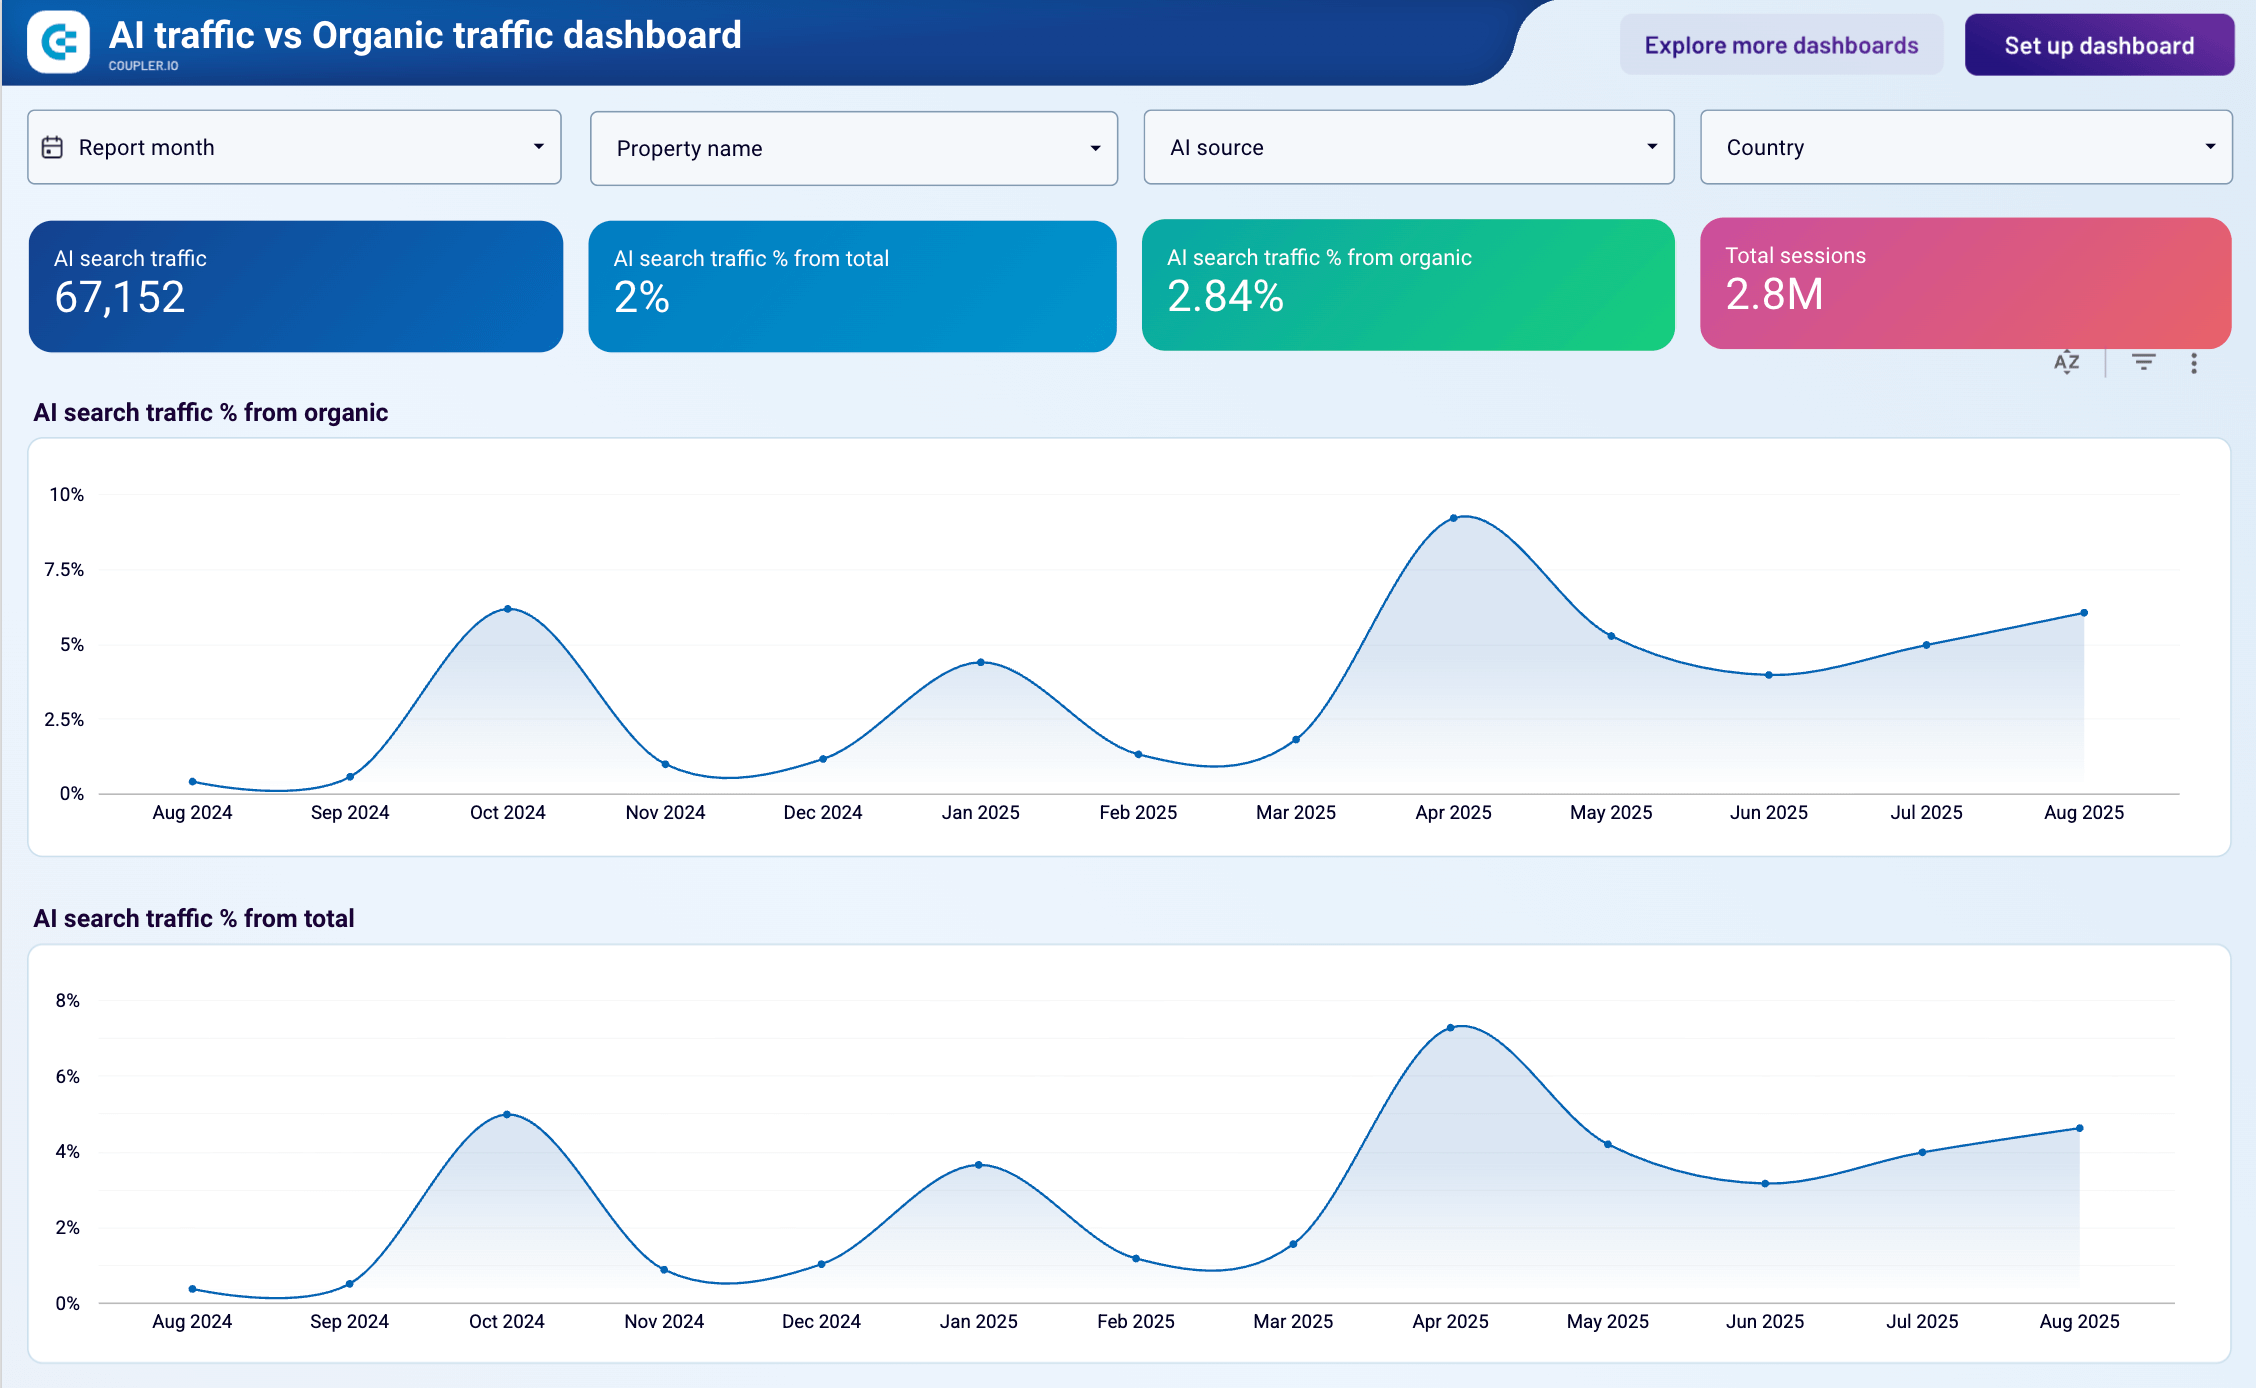
AI search traffic reports
The newest thing clients ask about, and the hardest to answer with existing reports. Demand for AEO and SEO aimed at AI search hit 66% in the 2026 benchmarks survey, the top new service request of the year, and nearly half of agencies say they can’t track users arriving through AI tools at all.
Common KPIs:
- Sessions from AI assistant referrals, by source
- Conversion rate for AI traffic against conventional organic
- Purchase revenue from AI referrals
- Engagement metrics for those sessions
Set one boundary before clients assume otherwise: this covers traffic that has already arrived. Whether they get cited inside AI answers needs a dedicated visibility tool.
Examples of pre-built AEO reports:
SEO and organic search reports
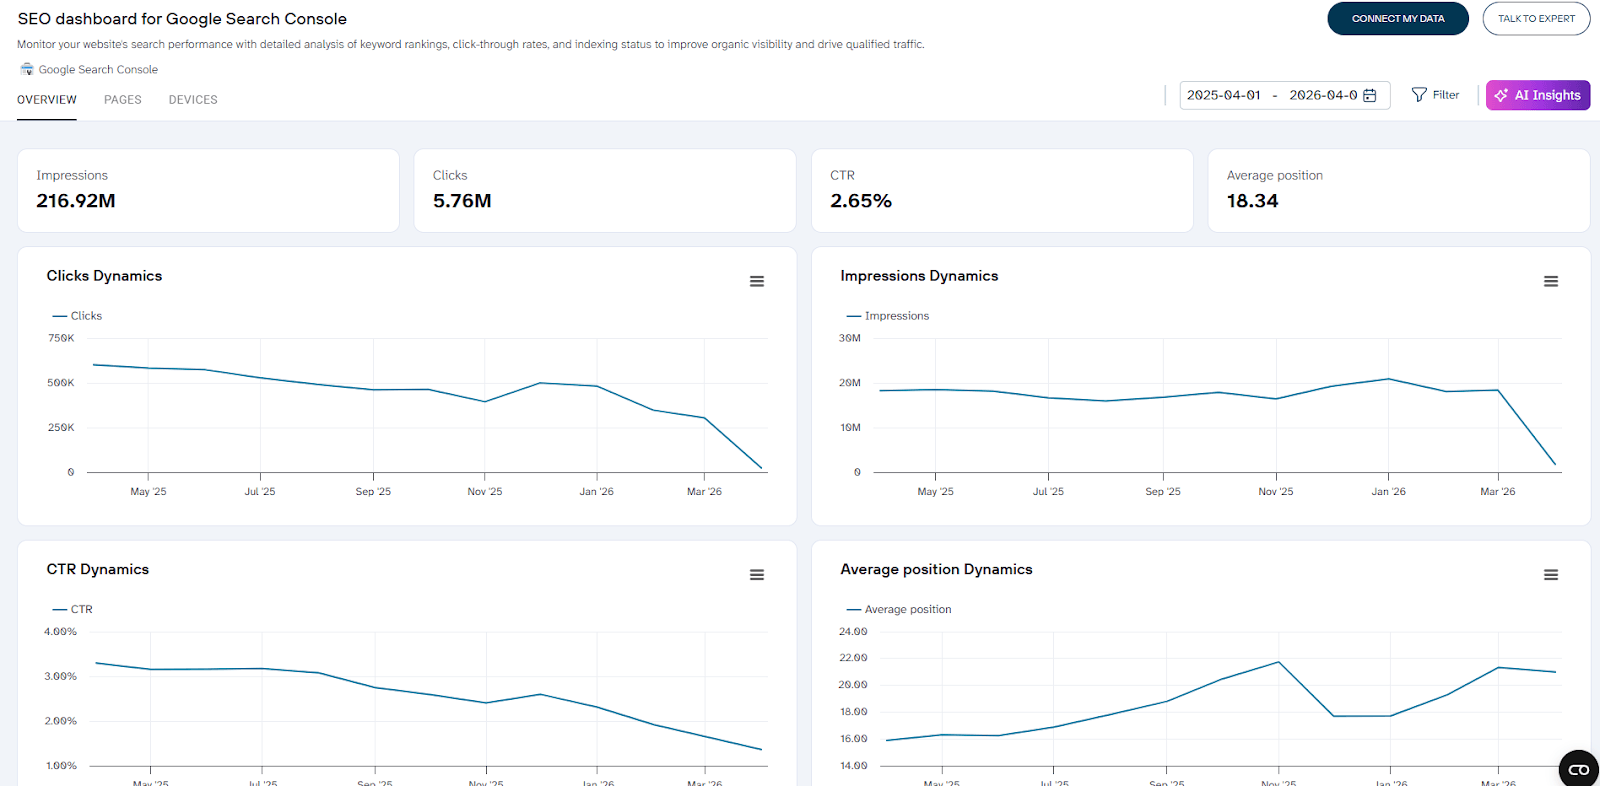
SEO reporting has a pacing problem. The work compounds over months while the client checks weekly, so the report has to show direction rather than week-to-week noise.
Common KPIs:
- Impressions, clicks, CTR, and average position
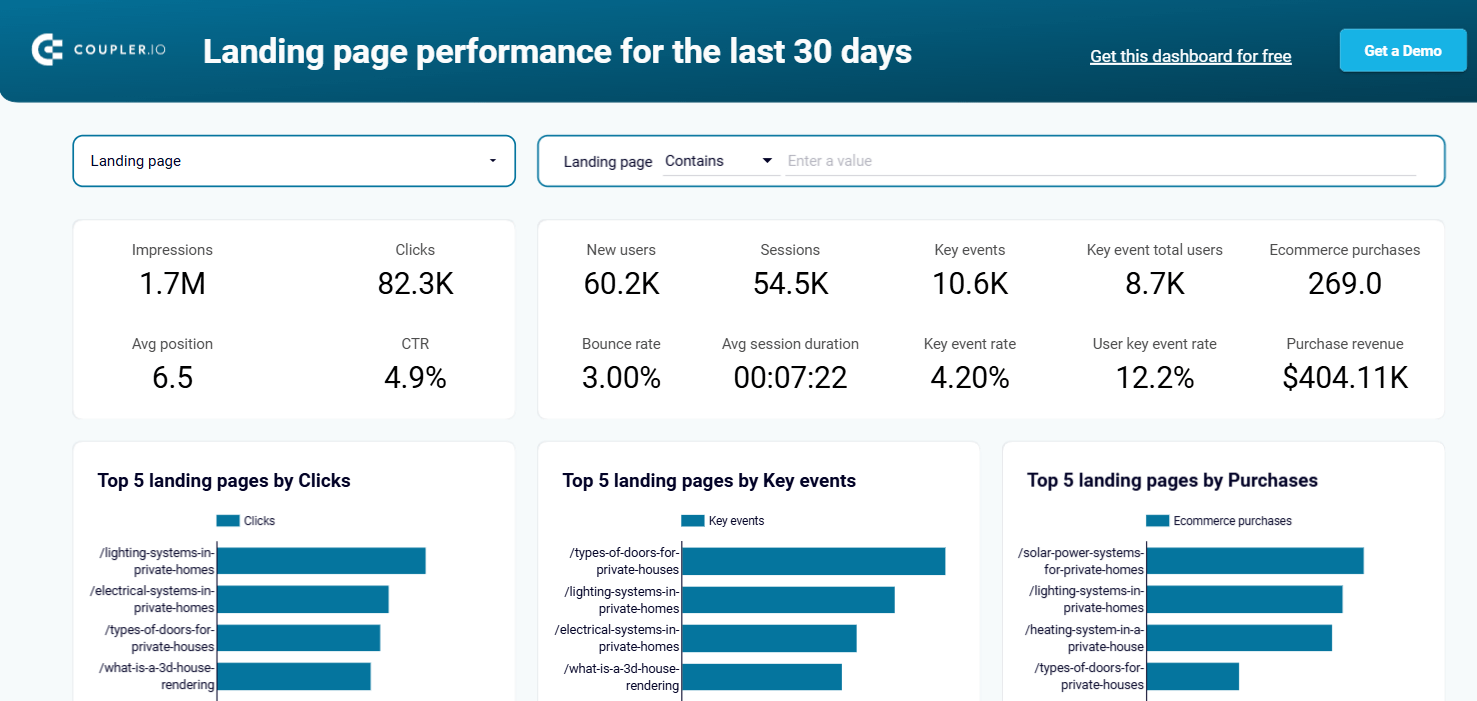
- Organic sessions and conversions by landing page
- Keyword position for commercial terms
- Branded against non-branded traffic
- Indexing and crawl issues, for technical reports
Blend Search Console with what visitors do after landing, page by page. A page that ranks well and converts badly reads as a win in Search Console and as a problem anywhere else, and SEO budget gets allocated per page rather than per site.
Examples of pre-built SEO reports:

Social media reports
Organic social is where vanity metrics do the most damage. Impressions and follower growth tell a client nothing about whether the channel deserves continued investment.
Common KPIs:
- Sessions and conversions from social, by platform
- Engagement rate per post and per platform
- Reach and impressions, as context rather than headline
- Follower growth against referral traffic
- Paid against organic performance on the same channel
That last one matters on B2B accounts, where the budget conversation is usually about shifting spend between paid and organic rather than adding more of both.
Examples of pre-built social media reports:
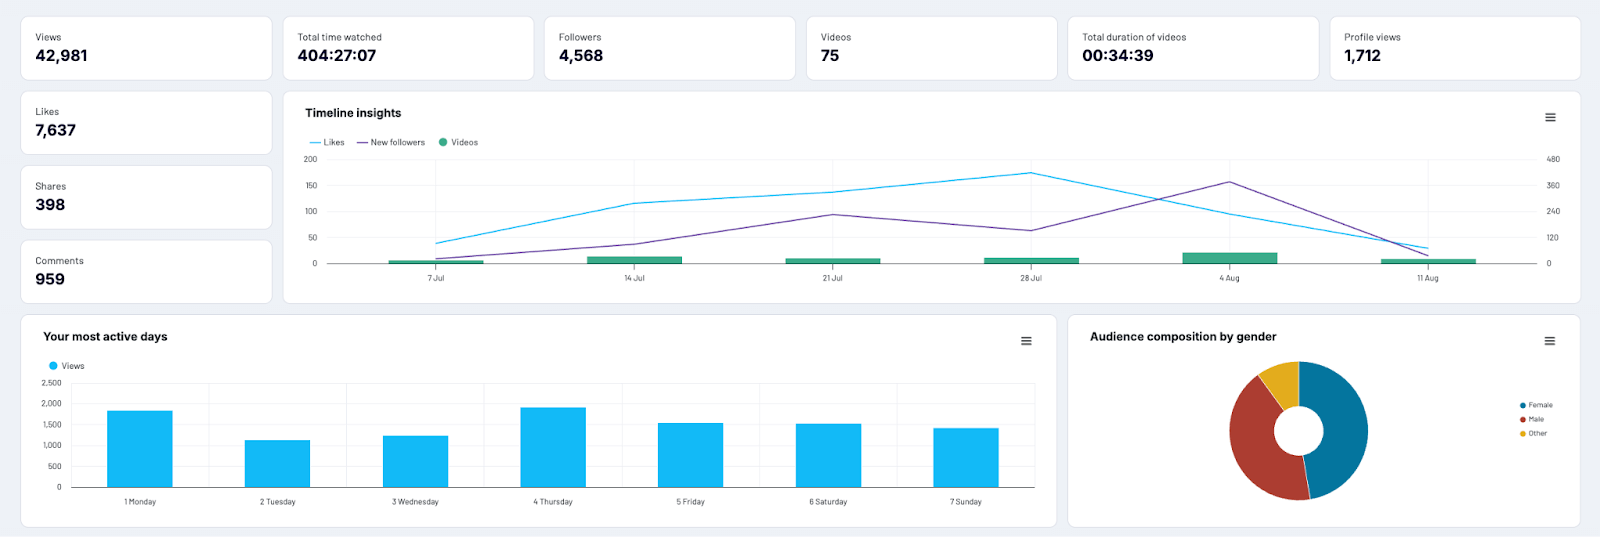
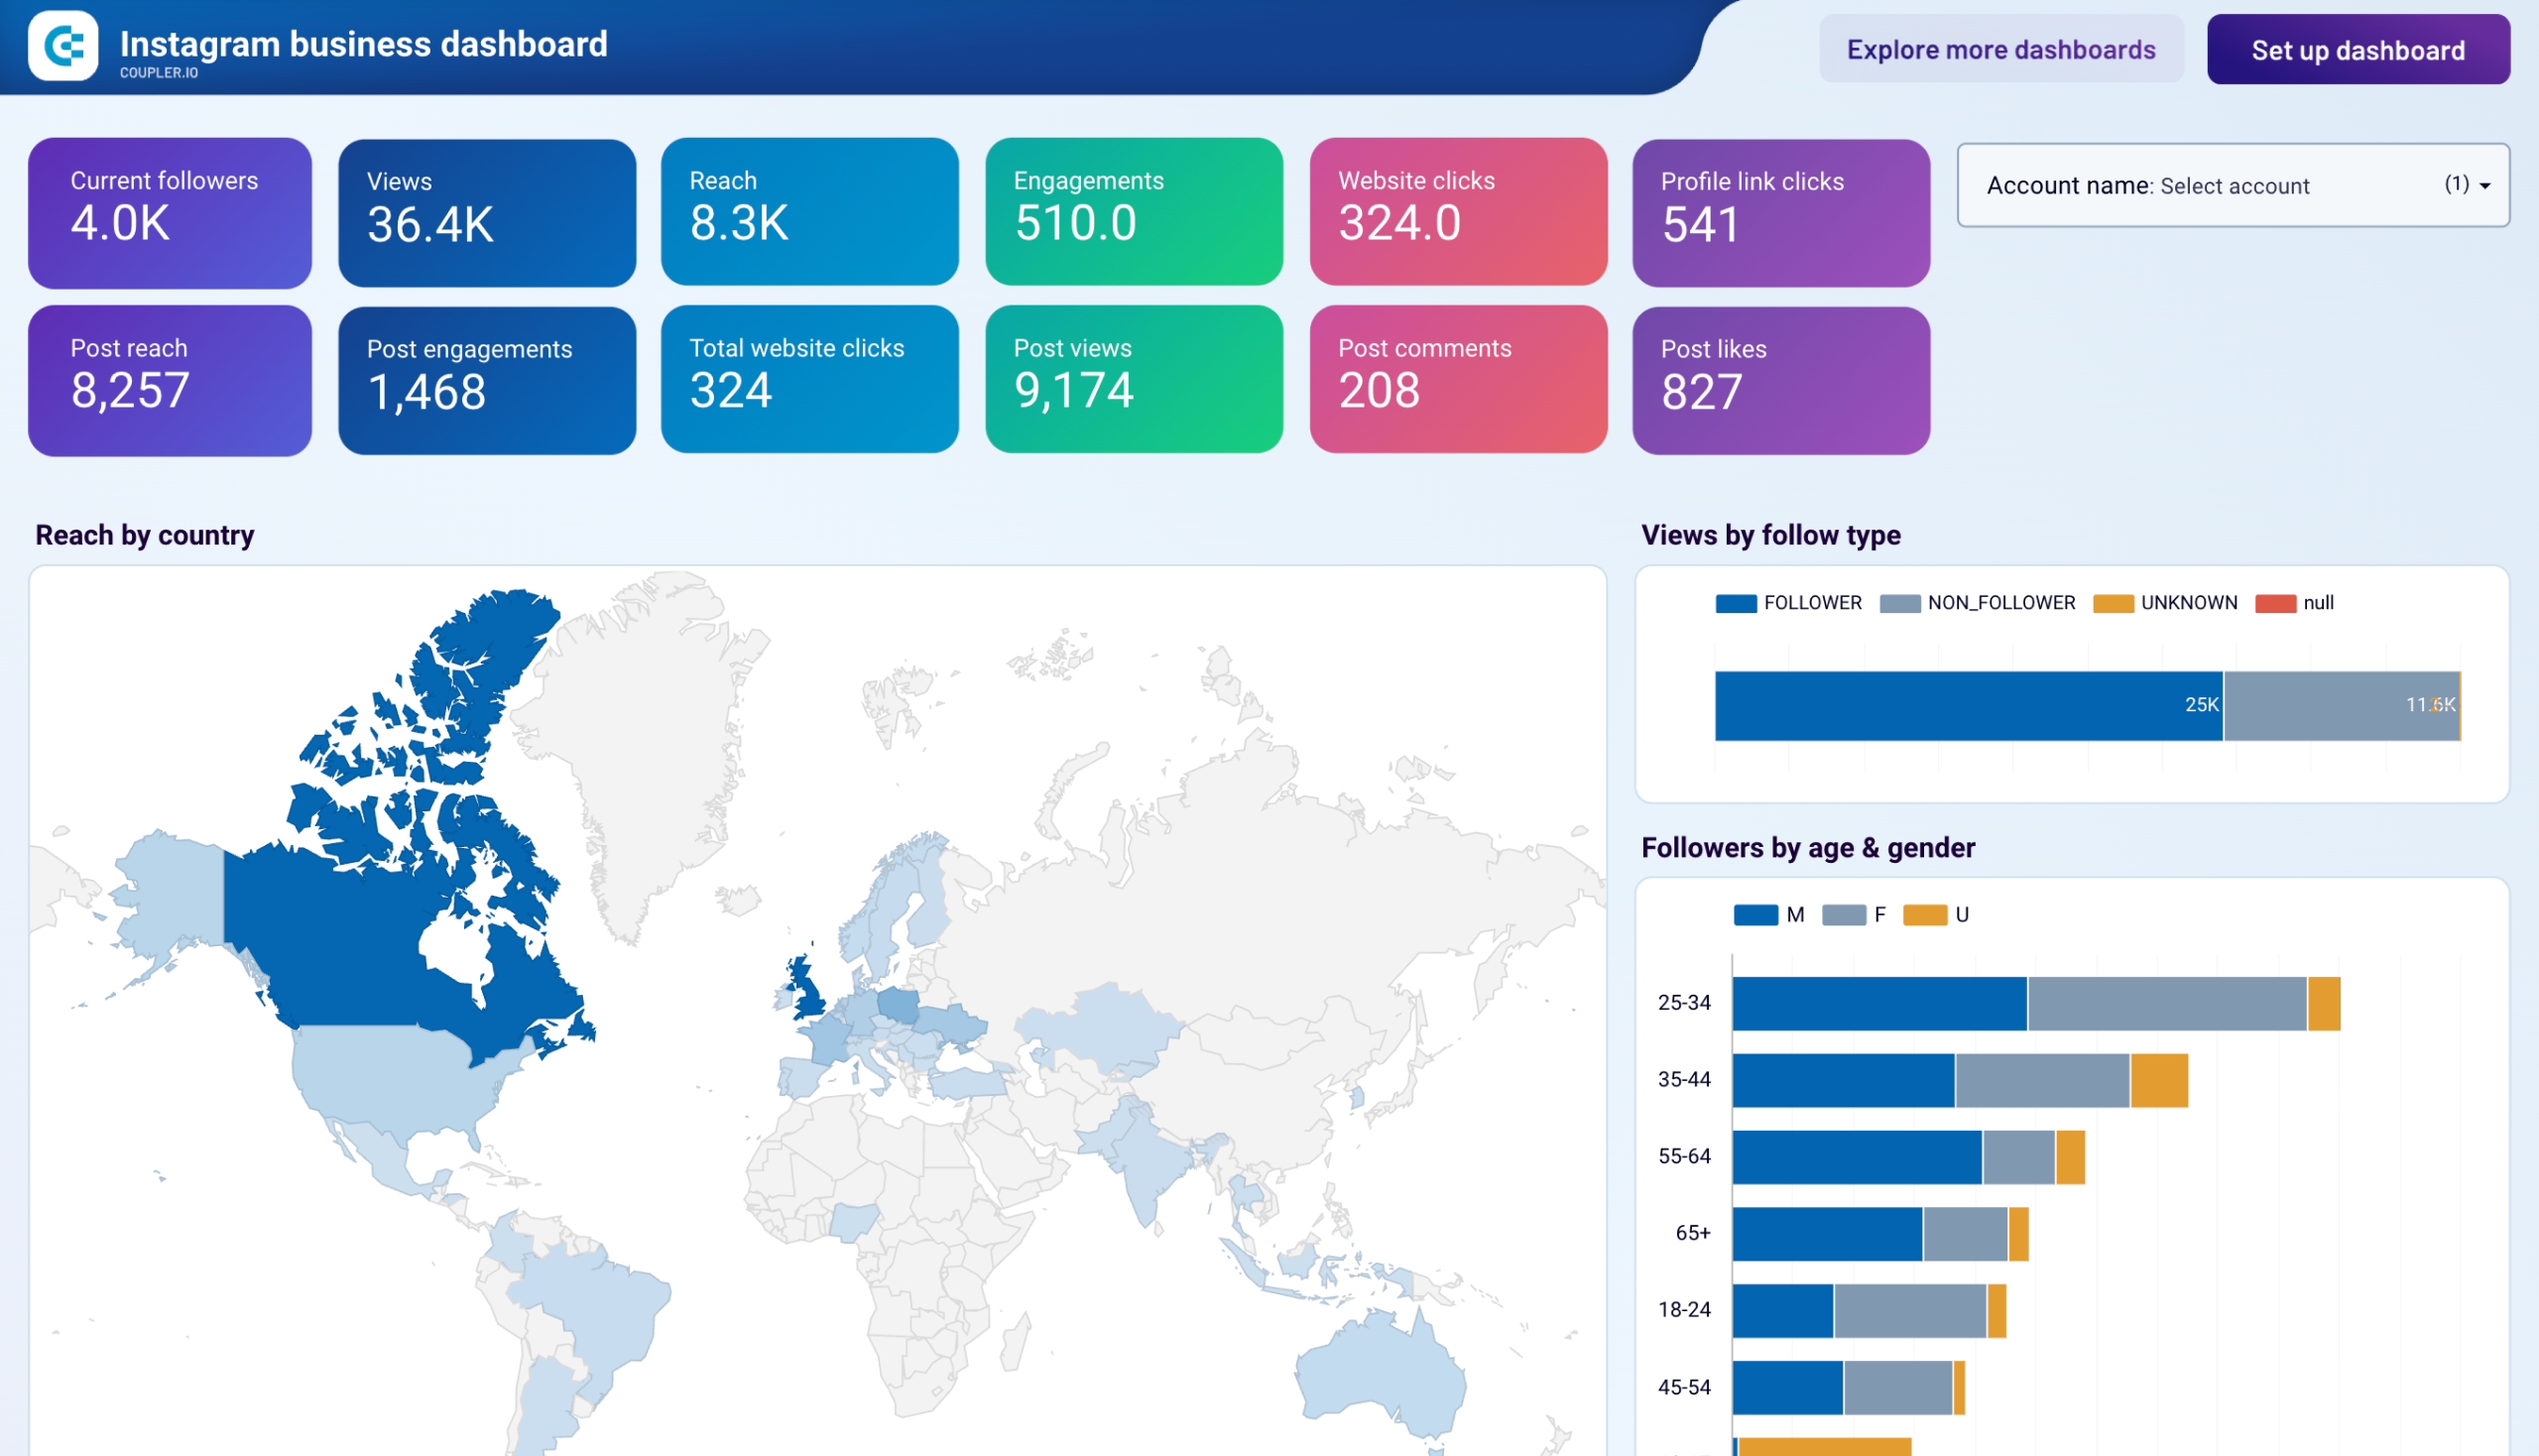
Email marketing reports
Open rates stopped meaning much after Apple’s privacy changes, so email reporting works better when it runs through to revenue.
Common KPIs:
- Revenue per campaign and per automated flow
- Click rate and conversion rate
- Total purchasers and total revenue
- List growth and unsubscribe rate
- Bounce and spam rate
Ecommerce clients care most about the flow side, since that’s the portion generating revenue without new creative every week.
Examples of pre-built email marketing reports:
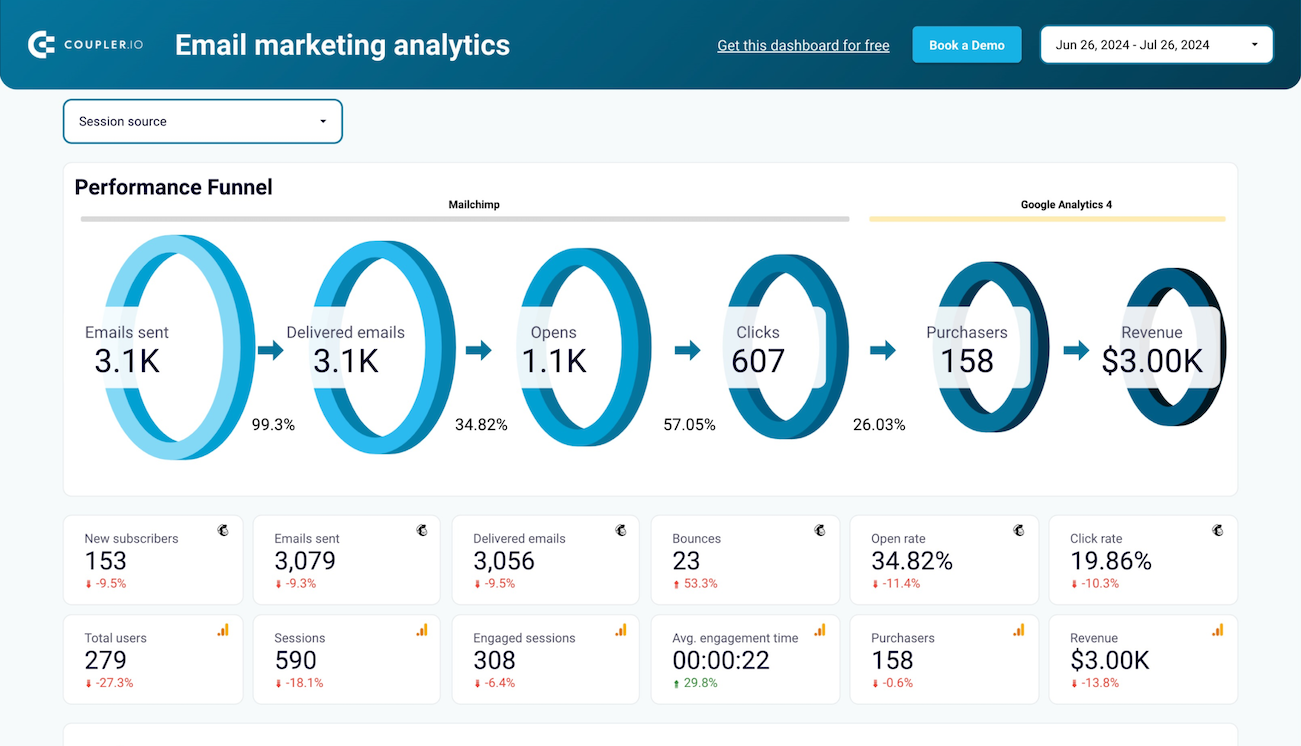
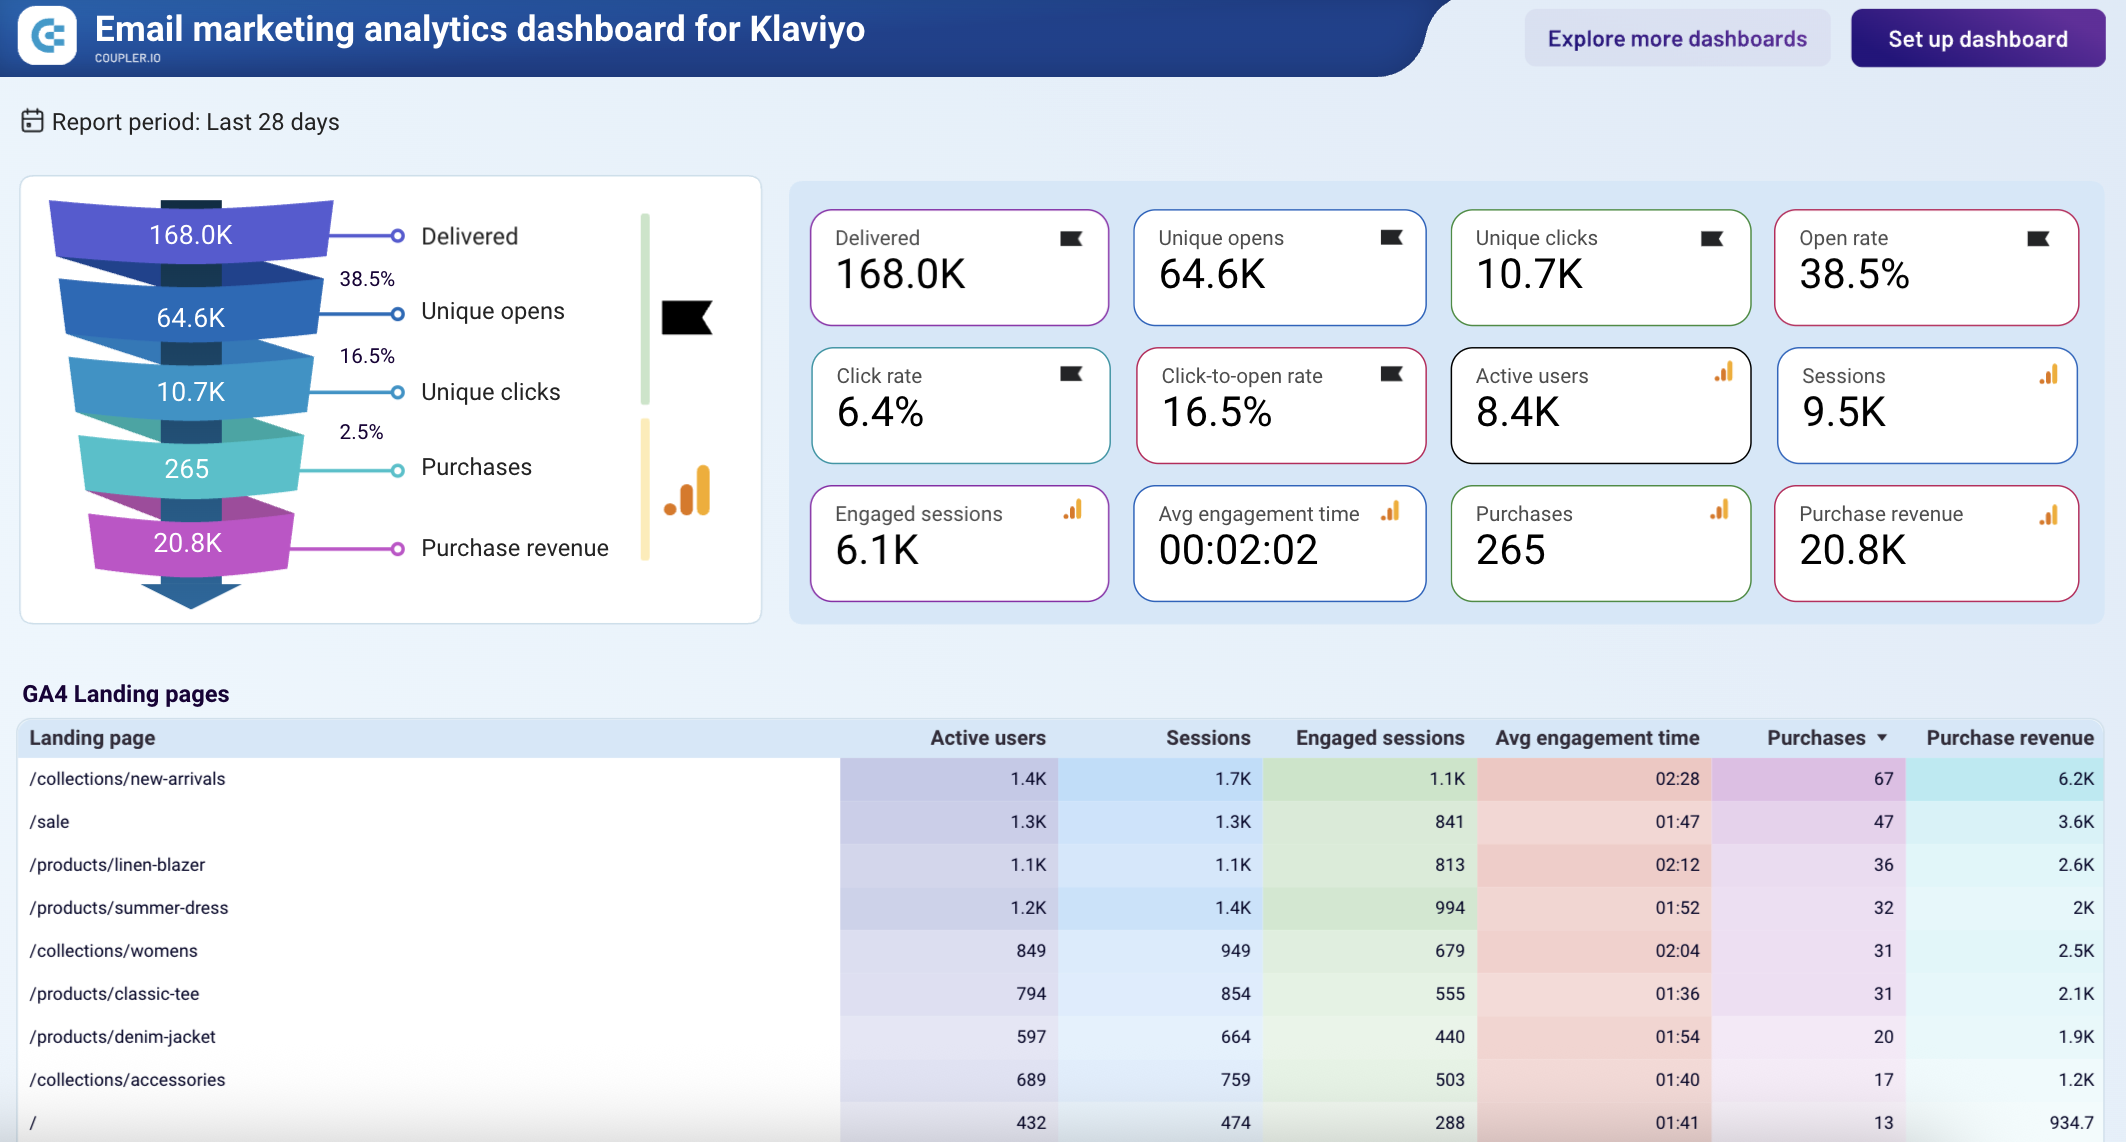
Lead and revenue reports
“Can you connect marketing performance to revenue?” is one of the questions agencies ask most often. Most agencies build this report last because it needs CRM data alongside marketing data, but that doesn’t make it less important.
Common KPIs:
- Leads, MQLs, and SQLs by source
- Cost per lead and cost per customer
- Conversion rate between each funnel stage
- Pipeline value and closed revenue
- Win rate and won amounts
Where prospects drop between stages is more useful to a client than the overall conversion rate, which is what funnel reporting is for.
Examples of pre-built lead and revenue reports:
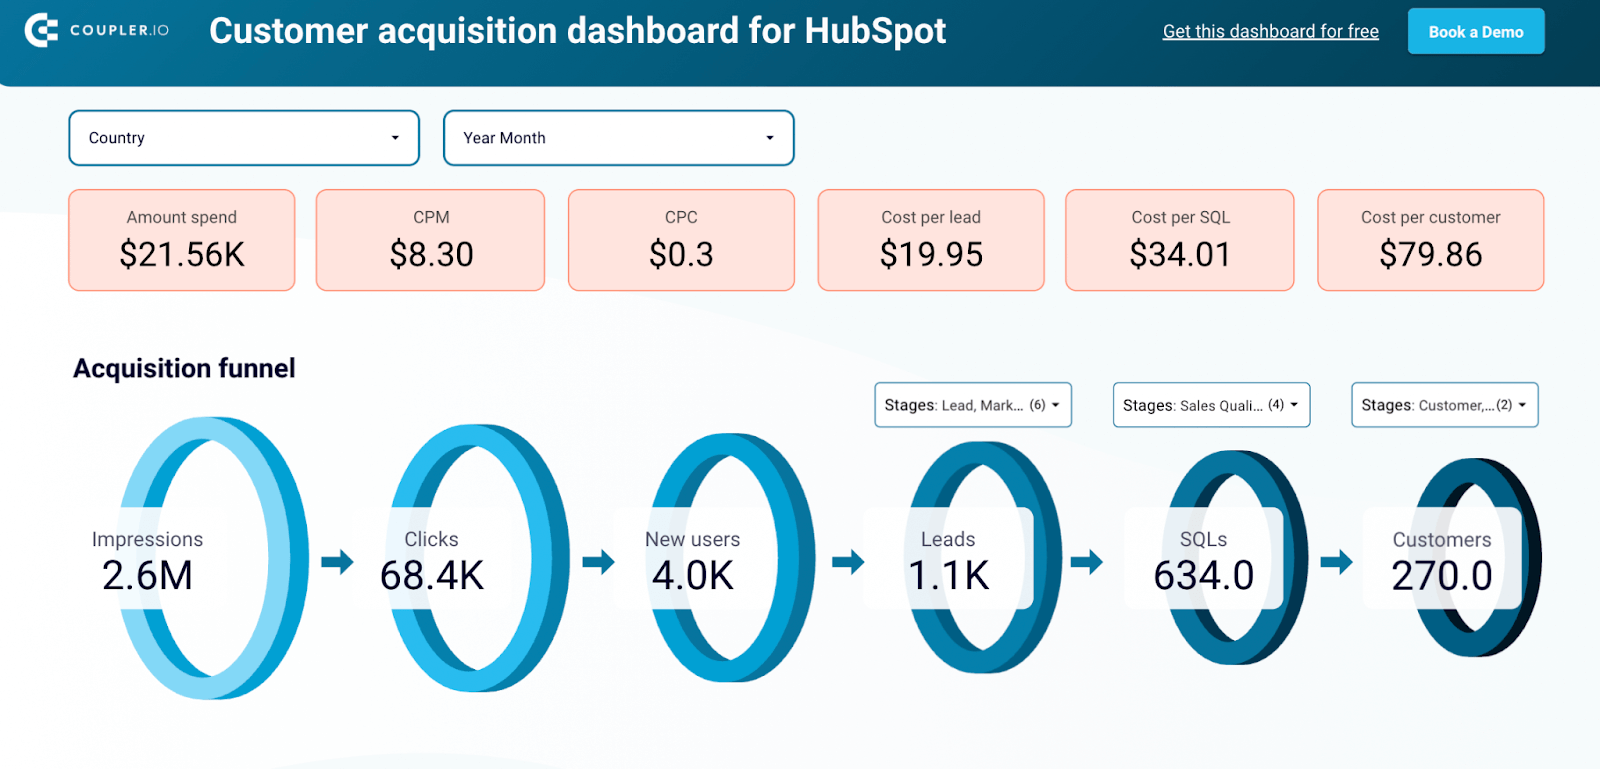
Customer acquisition dashboard for HubSpot in Data Studio


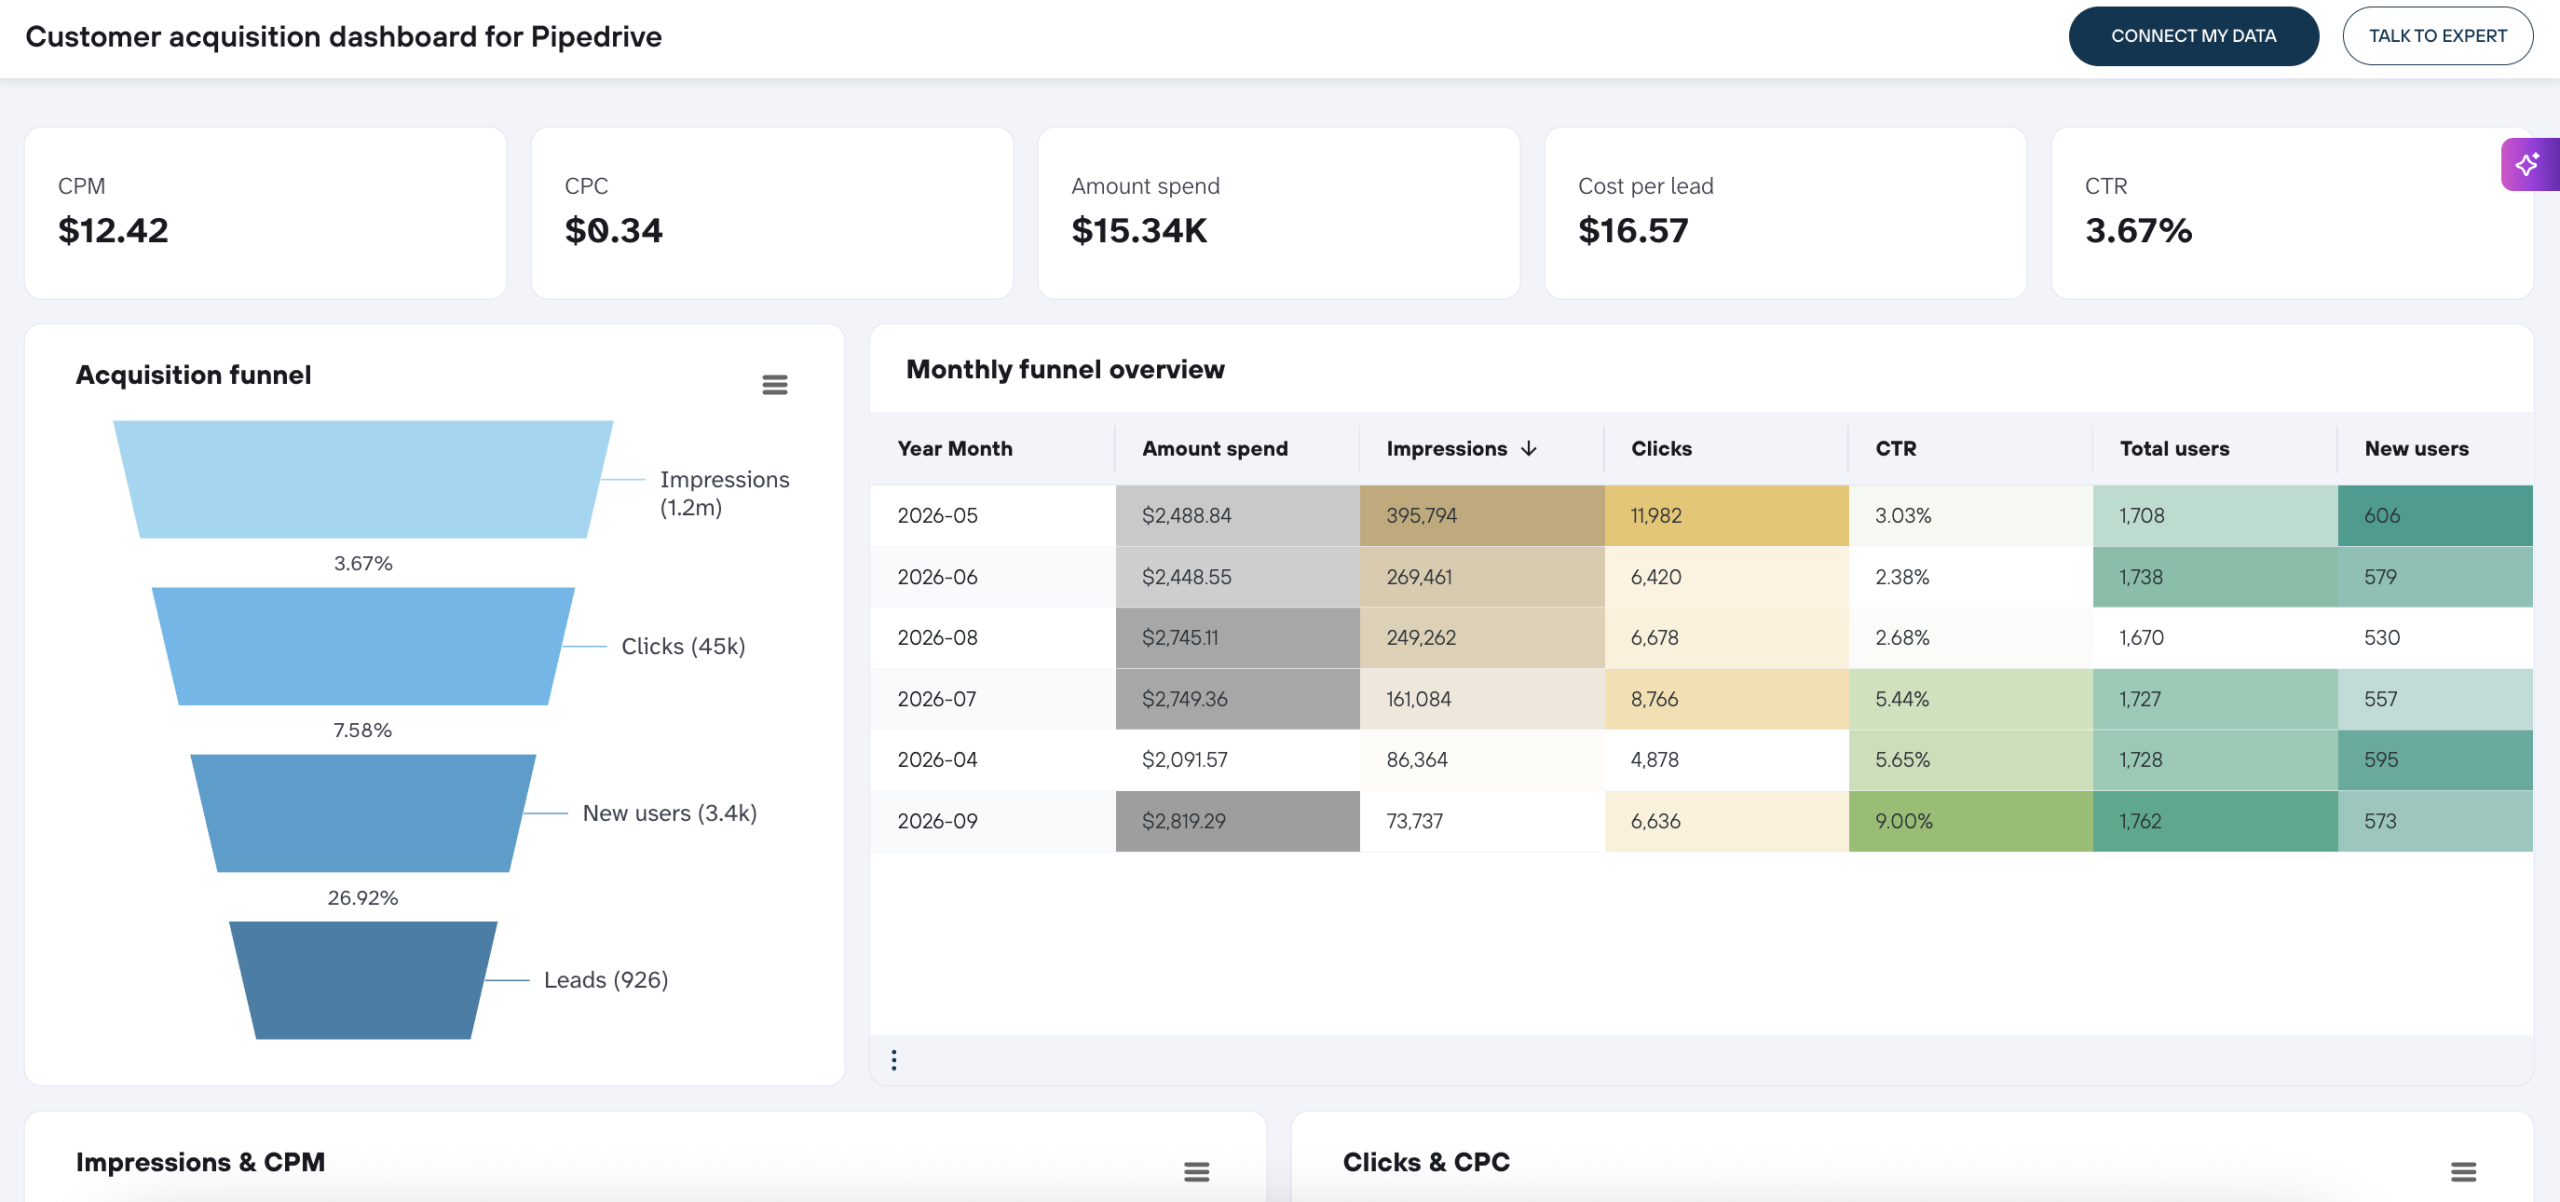
Customer acquisition dashboard for Pipedrive


Each of these is a separate template, but the account connections carry over. Once a client’s Google Ads and Meta accounts are in, the paid report and the overview both draw on them.
Internal agency reports
Every report above is built for the client. The one that decides whether an account is worth keeping is the one you build for yourself. A retainer at a good fee can still lose money once you count the hours going into it, and that only shows up when time data sits next to project/client work data.
Common KPIs:
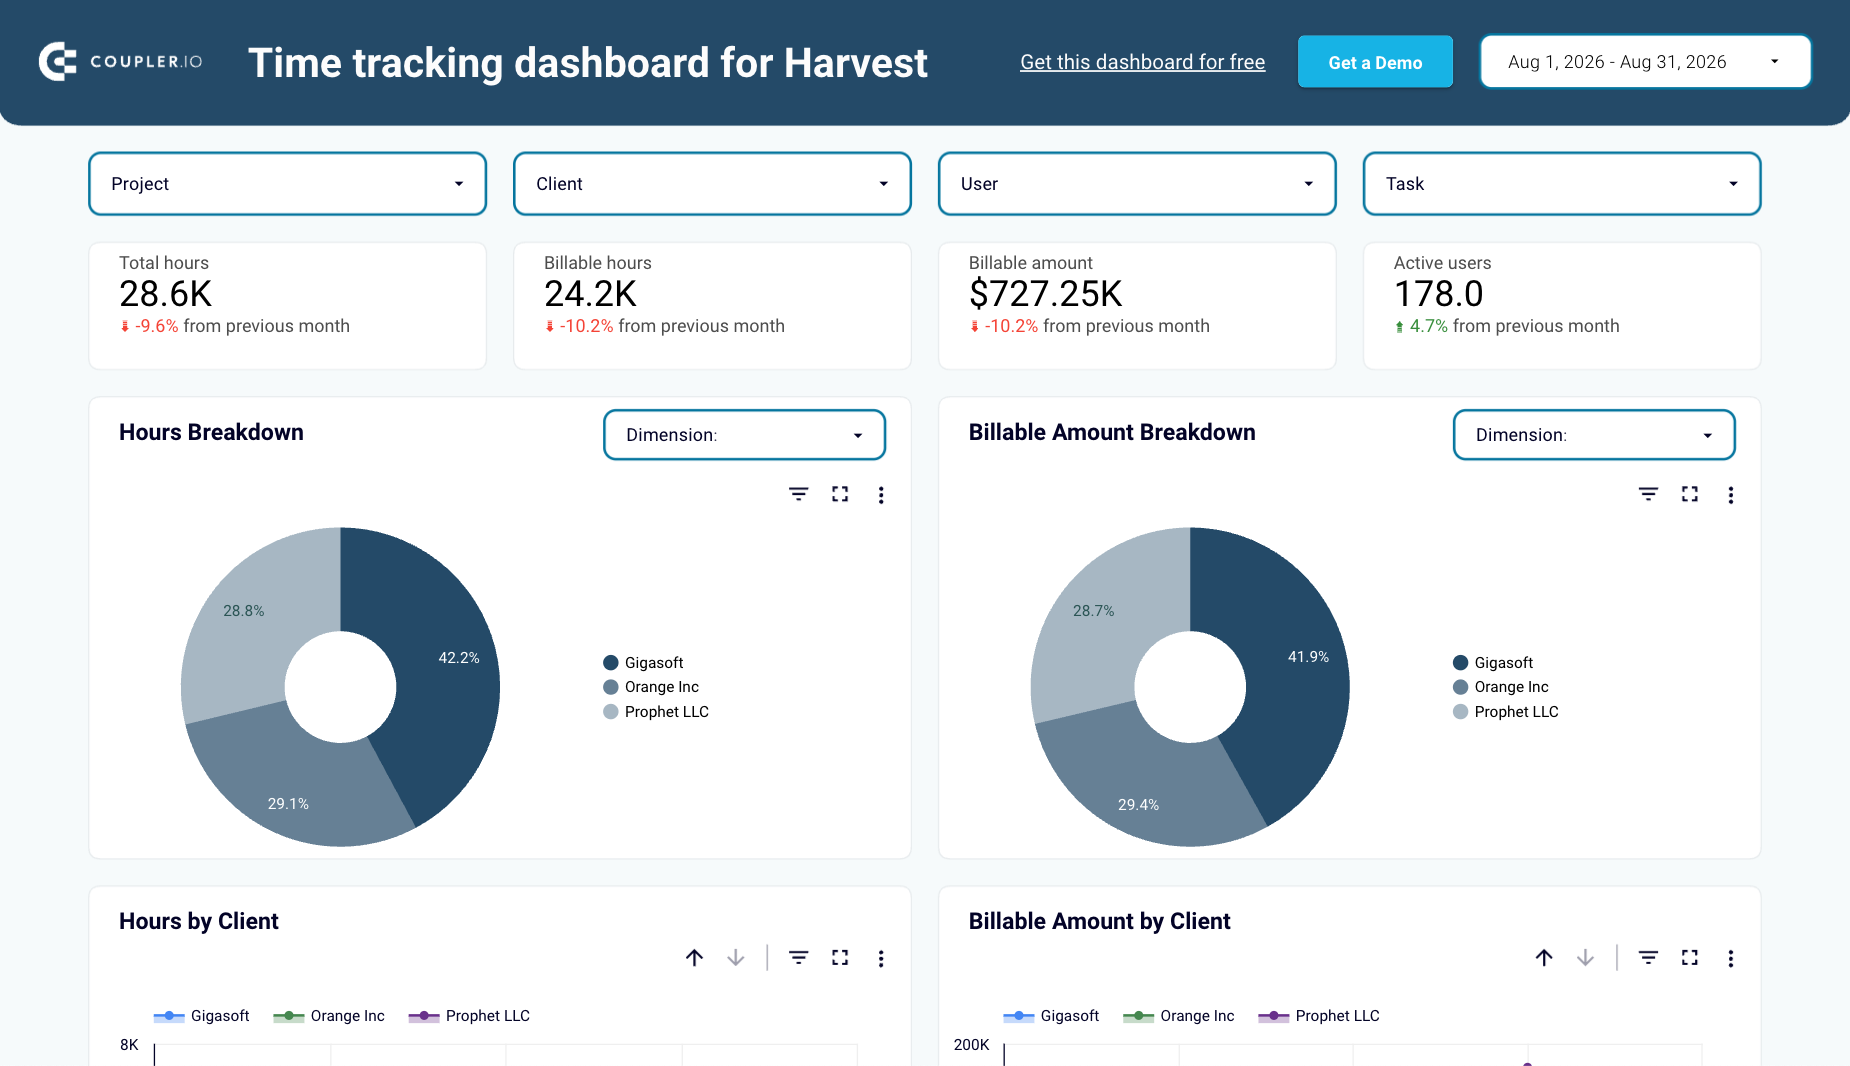
- Billable against non-billable hours by team member
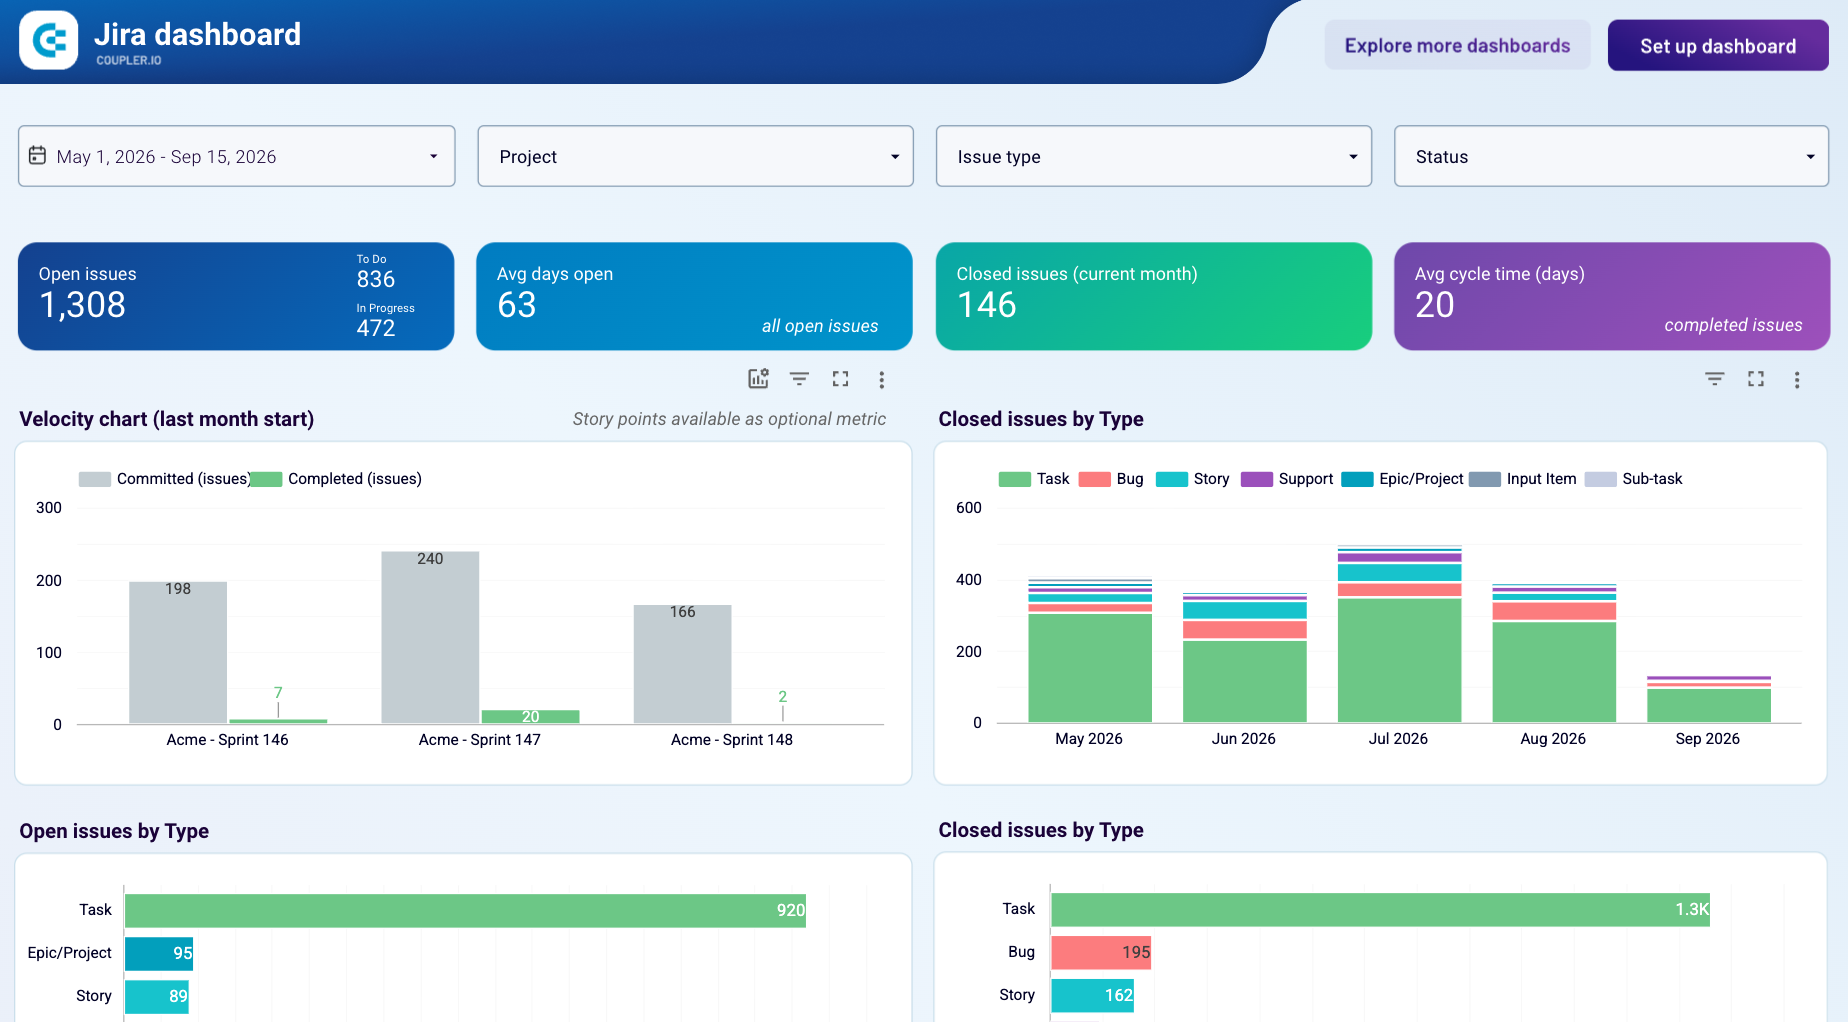
- Team velocity and avg. cycle time
- Billable amount by project and client
- Hours and amount by client and billing status
These reports pull from your time tracking (Harvest, Clockify), project management (Jira) and accounting tools rather than the client’s accounts.
Examples of pre-built internal reports:


What to look for in a reporting tool
Connection is the part everyone automates first, and plenty of ETL tools for marketers stop there. But preparing the data, delivering it, refreshing it, and having the analysis ready before a client call can all run on their own too. Here’s what to look for in a single tool:
Source coverage
Check the tool against your clients’ martech stack, CRM included. A broad source library helps, but the ones your accounts use are what decide whether the cycle runs without you.
Data organization capabilities
Client accounts arrive messy, partly because sales and marketing APIs each return data in their own shape. If you can’t filter test campaigns out, rename inconsistent columns, add a calculated field, or combine two sources into one data set, that work moves to a spreadsheet in the middle of your process.
Delivery in multiple formats
Some clients open a dashboard, others want a spreadsheet or the numbers walked through on a call, and often it’s the same client needing both because the marketing lead and the finance team read differently. Check whether one data set can feed several marketing data destinations, or whether each format means building the report again.
AI capabilities beyond summarizing
Most tools will write a paragraph about a chart. The useful version helps set up the report, records what a client’s metrics mean, and runs the same monthly review across accounts.
Branding control
Whether you can apply your logo, colors, and layout before anything reaches a client, and whether that styling is reusable across accounts rather than rebuilt each time.
Client separation
Each client’s data, reports, and users should sit in their own space. Without that, a new hire gets access to every account on day one, and removing a client who leaves can break another client’s reporting.
Coupler.io handles all of this in one place. You can choose from 400+ data sources, and the cleanup you do once applies to every refresh. Each client can read the numbers in whatever tool they already use, and 250+ dashboard templates mean you’re not building the first version from scratch. Its AI goes past summaries too: Coupler AI answers questions about the prepared data in plain language and sets up the reporting behind it.
Cover integration, cleanup, and delivery in one tool
Book a demoHow to make custom-built client reports easy to read
A template gives you a fixed set of views, branded as yours, and that’s enough for most accounts. When a client needs something the templates don’t cover, you build the page yourself in a BI tool or a sheet using the same prepared data. A few pieces of advice:
Put the agreed KPIs at the top. Scorecards work best. The client gets the summary before the detail, which is often all they wanted.

Don’t crowd the page. Mix raw numbers with tables and charts, but stop before it gets busy. Pick a color palette and hold to it across every client report you produce, so formatting isn’t a variable.
Add filters and drill-downs. Interactivity does more for perceived value than any styling choice. A date filter lets a client check last quarter without emailing you for a comparison, and a drill-down lets them go deeper on one metric without you building a second report.
Assume mobile. Clients check reports between meetings, so anything that depends on hovering is lost, and filters need to be large enough to tap. A vertical layout that reflows on narrow screens handles most of it.
Then pick a chart type per question on the page:
- Bar charts – for comparing the performance of different channels and campaigns, as well as their changes over a specific period.
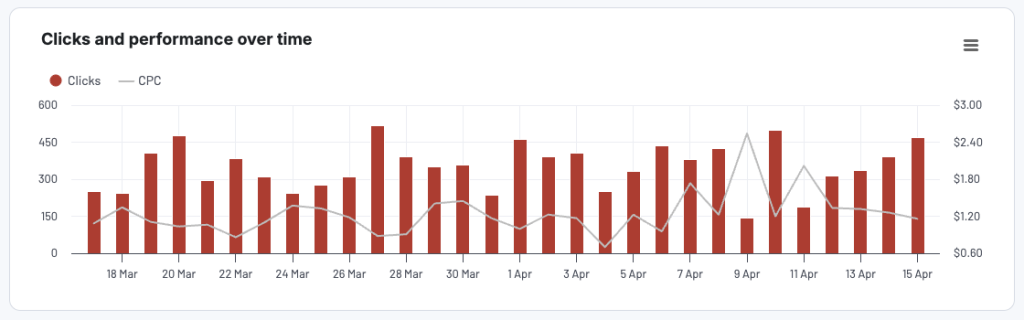
- Line charts – to visualize trends and marketing dynamics over time, such as a 6 or 12 month period.
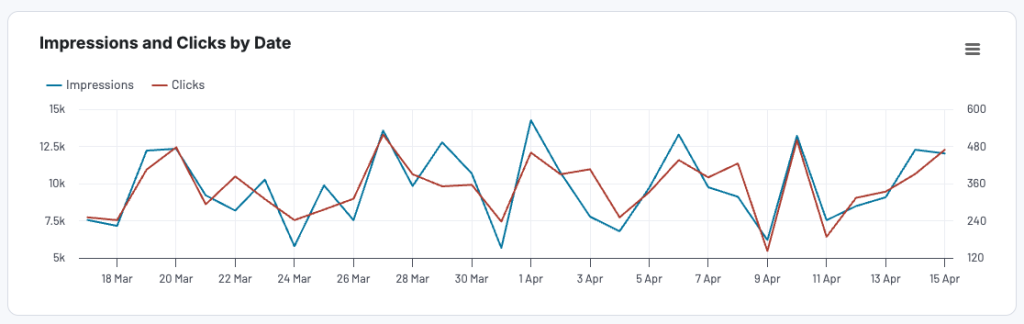
- Pie and donut charts – for broad comparisons, such as which social media platforms your client receives the most engagement from. Keep it to five or six slices.
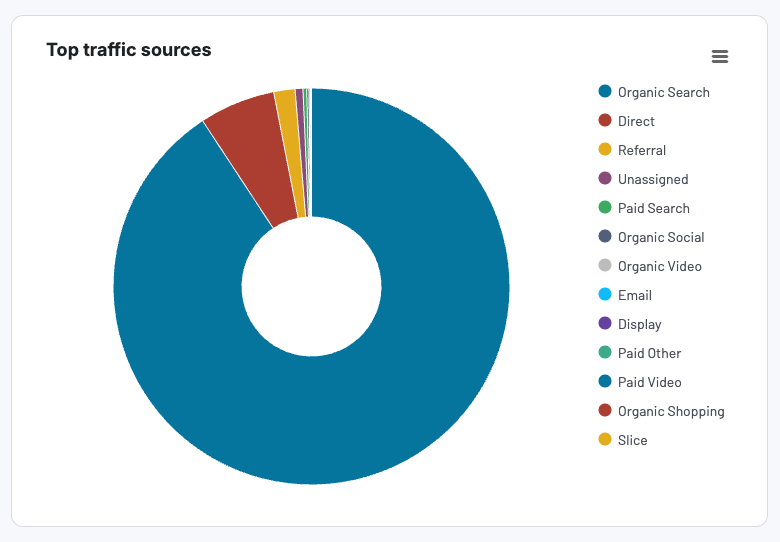
- Maps – to show the distribution of web traffic, sales, social engagements, etc. across countries or regions.
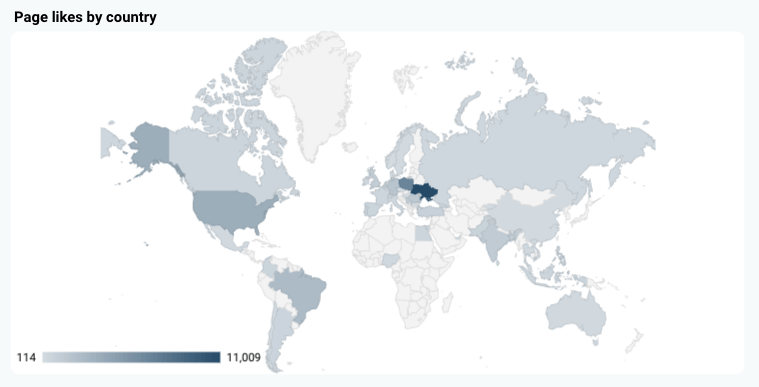
- Scatterplots – for correlations between data points and potential outliers.
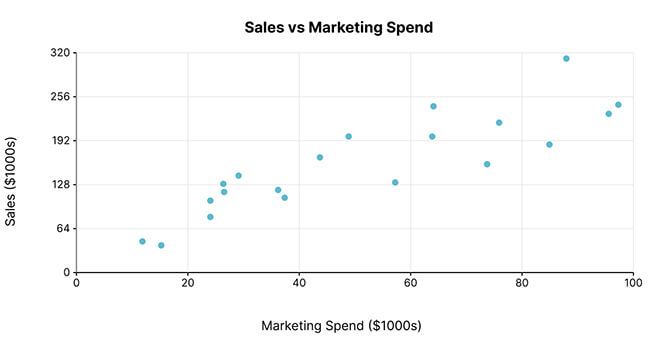
Whichever types you use, keep them the same across clients. A client comparing this month against last shouldn’t have to read a new chart first.
Best practices for protecting client data
The reporting setup that saves you time also puts client data in more places: your warehouse, your dashboards, your team’s logins, and now your AI tools.
Limit who can open what. Default clients to view-only, and make removing access part of offboarding. With Coupler.io, you can keep each client in a separate Workspace, so removing one leaves the other accounts’ reporting untouched.
Check what your AI tool does with the data. Find out whether it stores prompts and outputs, whether either gets used for training, where processing happens, and how long anything is kept. Your client contracts probably already set terms for this.
Route AI through a data layer. Coupler.io controls which prepared data sets are exposed, so the AI reads those rather than holding API keys or database access. Personal AI accounts are the other risk, since client numbers pasted into someone’s own ChatGPT sit outside your policies.
Set a retention period. This applies to the data your agency holds, the copies sitting in your warehouse and spreadsheets, rather than what lives in the client’s own platforms. Decide how long you keep it and review that every year or two.
Know which rules apply. GDPR covers the EU and CCPA covers California, with PIPEDA in Canada, LGPD in Brazil, and POPIA in South Africa. Coupler.io is SOC 2 Type II certified and compliant with GDPR, HIPAA, and DORA.
Where to start
Pick the account costing you the most hours rather than the largest one. Agree the KPIs with them, connect their sources, and tell Coupler.io what the report needs to show. Ready-made multi client reporting dashboard templates help speed up the design and delivery part.
Deciding what belongs on the report is the part worth your time. The setup around it takes minutes, and the next account takes fewer.
Automate marketing agency reporting with Coupler.io
Get started for free