Your monthly forecast looks healthy, but a delayed $50,000 payment from a major client and an unexpected $10,000 equipment repair in the same week can trigger a liquidity crisis. This is the cash timing mismatch problem that affects the majority of small businesses: cash arrives too late, and bills come due too early.
Traditional monthly forecasts can’t catch these weekly fluctuations. The 13-week cash flow model provides weekly visibility three months forward. This is enough time to negotiate terms, secure funding, and implement other corrective actions before shortfalls become critical. Master this essential forecasting tool and transform your financial planning from reactive crisis management to proactive strategic decision-making.
What is a 13-week cash flow model?
A Thirteen-Week Cash Flow (TWCF) is a rolling financial forecast that projects weekly cash inflows and outflows over three months.
Unlike static annual budgets, this dynamic forecasting approach updates continuously. Each week, you drop the oldest week and add a new one to maintain a constant 13-week forward outlook.
Why your weekly cash flow forecast matters: Research shows that 60% of small businesses struggle with cash flow management, with 75% citing rising costs as their primary financial challenge. Yet the deeper issue isn’t simply rising costs. It’s the timing mismatches that monthly forecasts fail to capture. When businesses operate with limited cash reserves, weekly visibility becomes essential for survival.
Finance teams across businesses of all sizes rely on TWCF models as their primary tool for operational liquidity management. Building a 13-week cash flow model serves several critical functions:
- Extends beyond daily cash balances to show upcoming payroll, vendor payments, and seasonal cash needs.
- Provides sufficient lead time to secure additional funding or negotiate payment terms.
- Spans exactly one quarter, so you can show stakeholders detailed cash flow through your next earnings report.
- Enables proactive identification of potential cash shortfalls before they become critical.
- Supports data-driven working capital optimization decisions.
13-week cash flow forecast vs. traditional planning
Traditional annual cash flow forecasts operate at a high level, typically projecting monthly cash movements based on broad assumptions. While valuable for strategic planning, these yearly models have significant limitations:
| Annual forecast limitations | 13-week forecast advantages |
| Lacks the precision needed for operational decision-making | Drills down to weekly detail, capturing actual payment timing |
| Misses weekly timing variations that create cash crunches | Reveals cash flow patterns that monthly models miss |
| Operates on broad assumptions rather than specific payment schedules | Offers model-specific scenarios like delayed payments or unexpected expenses |
| Obscures important cash flow patterns through monthly aggregation | Shows exactly when cash positions might become tight |
| Provides little advance warning for short-term cash needs | Enables targeted interventions rather than broad cost-cutting measures |
The 13-week timeframe proves optimal for operational planning because it extends far enough to identify emerging trends while remaining short enough to maintain accuracy.
Key components of cash flow analysis
Understanding cash flow timing is crucial because working capital (the difference between what customers owe you and what you owe suppliers) directly affects when money moves in and out of your business. When customers take longer to pay, inventory levels increase, or you negotiate different payment terms with suppliers. These shifts change your payment schedules and cash availability.
This timing impact makes it essential to track three fundamental elements that work together to provide complete visibility:
1. Cash inflows:
| Category | Example |
| Customer payments (based on actual collection patterns, not invoice dates) | If customers typically pay in 45 days, schedule receipt for week 6-7, not when invoiced |
| Loan proceeds and credit line draws | $100K credit line draw scheduled for week 8 when inventory purchases create temporary deficit |
| Asset sales and investment returns | $50K equipment sale planned for week 10 to fund expansion |
| Any other revenue sources with specific timing | Quarterly royalty payment of $25K expected in week 12 |
2. Cash outflows:
| Category | Example |
| Payroll and employee-related expenses | $80K bi-weekly payroll every other Friday, plus $15K quarterly bonus in week 13 |
| Rent, utilities, and fixed operating costs | $12K rent due first of month, $3K utilities mid-month |
| Supplier payments scheduled by actual payment terms | $40K inventory payment due week 5 (net 30), $8K software subscription week 2 |
| Debt service, taxes, and other obligations | $5K monthly loan payment week 4, $20K quarterly tax payment week 9 |
| Capital expenditures and equipment purchases | $75K machinery purchase scheduled for week 11 |
3. Net cash flow position:
| Component | Example |
| Weekly calculation of inflows minus outflows | Week 7 shows $45K inflows minus $60K outflows = ($15K) deficit |
| Identification of cash shortage and surplus periods | Weeks 7-9 show deficits requiring credit line, weeks 11-13 show surpluses for debt repayment |
| Working capital impact assessment | 10% sales increase adds $8K weekly to receivables, delaying cash by 6 weeks |
| Liquidity buffer requirements | Maintain minimum $50K cash balance, trigger the credit line when approaching $75K |
Your cash flow model should capture these impacts and present them clearly to executives, board members, and lenders so they understand your business’s financial health and cash needs.
How to build a 13-week cash flow model
Building an accurate 13-week cash flow forecast template requires a systematic approach that combines historical data analysis with forward-looking projections. The process involves four critical steps:
Step 1: Collect and prepare historical data
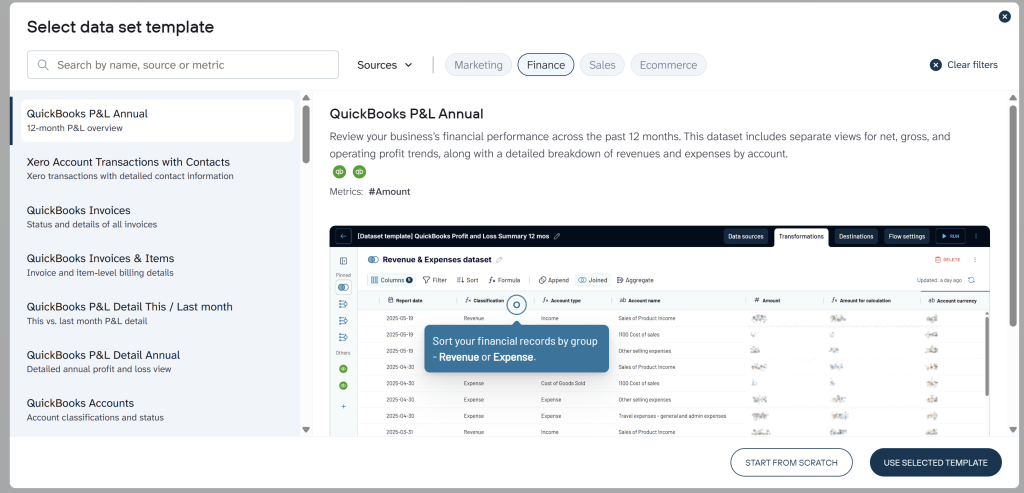
The foundation of any reliable cash flow forecast lies in understanding your business’s historical cash patterns. Start by gathering past financial data from your accounting systems, whether you use QuickBooks, Xero, NetSuite, or other platforms.
This historical analysis of 12-18 months of financial data reveals seasonal trends, payment timing patterns, and cash flow cycles that make your projections reliable rather than guesswork.
Data collection challenges
Gathering historical financial data creates several obstacles that can impact forecasting accuracy and efficiency. The traditional approach involves exporting transaction reports for the past 12-18 months, manually categorizing cash receipts and disbursements, identifying and correcting data inconsistencies, reformatting dates and amounts for analysis, and creating pivot tables to analyze trends.
This manual process consumes significant time and introduces potential errors through data transcription and formatting issues. Many businesses find that automating this data collection step eliminates these challenges while providing more reliable foundation data for forecasting.
Automated solution
Data integration tools address these collection challenges by connecting accounting systems directly to reporting tools like spreadsheets or BI platforms. For example, Coupler.io provides connectors for QuickBooks, Xero, and other software to automate exports of financial data directly to Google Sheets, Excel, and other destinations, including cash flow dashboards. Instead of downloading and reformatting data, you can automatically export key reports and combine data from multiple entities or sources for your forecast model.
The value of automated financial reporting becomes clear when managing multiple projects or complex cash flows. DE-YAN, a creative services company, faced exactly this challenge while managing 10-20 active client projects simultaneously.
Their manual process of exporting QuickBooks data, cleaning it, and formatting reports consumed about 15 hours per day across all projects. Occasionally, this led to budget overruns of 5% to 50% due to delayed decision-making.
With the help of Coupler.io and, specifically, its QuickBooks connector, DE-YAN eliminated manual data preparation and gained real-time visibility into project spending. This transformation enabled faster budget decisions, reduced overspending, and improved overall project profitability.
Automate financial data collection with Coupler.io
Get started for freeAnalyzing historical patterns
Once your data is properly organized, focus on identifying key cash flow patterns:
- Average time between invoice creation and payment receipt
- Seasonal variations in sales and collections
- Vendor payment cycles and terms
- Payroll and recurring expense timing
- Historical cash conversion cycles
Example: A consulting firm analyzing 18 months of data discovers that enterprise clients pay in 52 days on average (not the 30-day terms), collections slow by 15% in December due to client budget freezes, and their largest vendor offers 2% discounts for payments within 10 days.
This analysis reveals they can improve cash flow by $8K per month through early payment discounts and shows they need additional working capital every December to bridge the seasonal collection gap.
Data validation steps
Ensure your historical data is accurate and complete before building forecasting assumptions. Start by reconciling the exported data with your accounting system balances, and investigate any unusual transactions or timing anomalies.
Also, verify that cash-based transactions are properly categorized and confirm that all significant cash movements are captured and explained.
Step 2: Set up your spreadsheet framework
Successful 13-week cash flow frameworks balance detail with usability, providing comprehensive visibility while remaining manageable for weekly updates.
Most teams find that custom frameworks outperform generic templates because they reflect actual business operations rather than theoretical models.
Core structural elements
Most effective frameworks organize around three primary components: cash inflows, cash outflows, and summary calculations. Successful frameworks typically use separate worksheets or clearly defined sections for each component, making it easy to update specific areas without affecting the entire model.
Teams generally structure their weekly columns to show both historical actuals and forward projections, with most choosing Friday or month-end dates for consistency with existing reporting cycles.
The trade-off between granular detail and simplicity depends on your business complexity. Companies with straightforward operations might use broad categories, while multi-division businesses often require detailed breakdowns by product line or geography.
The key principle is matching your framework structure to how cash actually moves through your business rather than forcing operations into arbitrary categories.
Essential calculations and alerts
Effective models automate core calculations to reduce manual errors and ensure consistency. You can build formulas for weekly net cash flow, cumulative balances, and variance tracking as foundational elements.
Advanced frameworks often include conditional formatting to highlight potential cash shortfalls or surpluses, with threshold levels set based on actual business requirements rather than generic benchmarks.
The complexity of calculations varies significantly across industries and company sizes. Simple businesses might only track basic cash in/out calculations, while complex operations may incorporate working capital ratios, debt covenant monitoring, and scenario modeling.
The idea is to build calculations that actually inform decision-making rather than creating impressive but unused metrics.
Design for sustainable maintenance
Sustainable frameworks prioritize ease of weekly updates over the complexity of the initial setup. Most successful models use dynamic ranges that automatically adjust as the business grows, reducing the need for structural changes.
Teams typically find that separate worksheets for detailed analysis work better than cramming everything into one view, as this allows different stakeholders to focus on relevant information.
Automation represents a key trade-off between setup effort and ongoing efficiency. Manual frameworks offer complete control but require significant weekly maintenance. Automated solutions like Coupler.io reduce update time but require initial integration work.
The choice depends on team capacity, technical comfort, and the frequency of framework usage across the organization.
Step 3: Build cash flow categories
Effective cash flow models organize financial data around business reality rather than accounting conventions. You need to create categories that reflect how cash actually moves through your business. This enables more accurate forecasting and better decision-making.
Revenue categorization principles
The most successful approach is to organize cash inflows around collection patterns rather than sales categories. Most businesses find value in separating customer payments by typical collection timeframes (30-day vs. 90-day customers) rather than by product type, since timing matters more than source for cash planning.
Companies often distinguish between recurring revenue streams and one-time receipts, as these behave differently during economic stress. The trade-off between detailed categorization and simplicity depends on your decision-making needs.
Retail businesses might categorize by payment method (cash, credit card, financing), since each has different processing times. At the same time, service businesses often focus on client size or contract type, since these drive payment behavior.
Expense categorization strategy
Most effective models group cash outflows by payment control and timing flexibility. Fixed obligations like payroll, rent, and loan payments typically get their own categories since they’re non-negotiable, while variable expenses might be grouped by how quickly they can be adjusted.
Many teams organize supplier payments by terms (net 30, net 60) rather than by expense type, since this directly impacts cash timing.
Advanced frameworks often separate discretionary from non-discretionary spending to enable quick scenario analysis during cash crunches. The principle is to organize around what you can actually control when cash gets tight, rather than traditional accounting categories.
Operational integration approaches
Sophisticated models connect cash flow categories to business drivers such as sales volume, production schedules, and seasonal patterns. This enables dynamic forecasting, with operational changes automatically flowing through to cash projections.
Manufacturing companies often link raw material purchases to production schedules, while retail businesses connect inventory buying to seasonal demand patterns.
Most teams link their categories directly to aging reports from their accounting systems. They use historical collection patterns to predict when customers will actually pay their outstanding invoices.
The complexity of operational integration varies significantly by business model, but the key is building connections that actually improve forecasting accuracy rather than creating theoretical complexity.
Step 4: Implement rolling forecast methodology
With your framework built and categories defined, the model’s value depends on consistent maintenance. The rolling forecast methodology requires weekly discipline but becomes faster with practice, typically taking 30-60 minutes once established.
The following subsections outline the essential practices that successful teams use to maintain accurate rolling forecasts: systematic update procedures, variance analysis techniques, and review protocols that transform your model into a reliable management tool.
13-week rolling update process
Execute systematic weekly updates to maintain forecast accuracy:
- Update your model with actual results from the completed week
- Add the new forecast week to extend your planning horizon
- Refresh assumptions for all remaining weeks based on new information
- Review and adjust forecasts based on recent business changes
- Document any significant variances for future reference
Example: On Friday, update week 1 actuals (payroll was $82K vs. forecasted $80K), add week 14 projections, and adjust weeks 8-9 receivables assumptions after learning a major client will delay their $50K payment by two weeks due to their budget approval process.
Actual vs. forecasted variance tracking
Build comprehensive variance analysis into your model to improve forecasting accuracy:
- Compare actual cash flows to your previous week’s projections.
- Track timing variances (cash arriving earlier or later than expected).
- Monitor amount variances (actual receipts or payments differing from forecasts).
- Analyze forecasting accuracy trends over time.
- Identify areas where assumptions need refinement.
- Document variance patterns to improve future forecasting assumptions.
- Use variance insights to adjust collection and payment timing predictions.
Update methodology options
Manual updates work well for many businesses, requiring 30-60 minutes weekly while providing full control and hands-on familiarity with cash flow patterns. This approach allows finance teams to develop an understanding of their business cycles and maintain direct oversight of all assumptions.
Automation becomes valuable for specific scenarios: businesses managing multiple entities, teams performing multiple weekly updates, or organizations prioritizing error minimization over hands-on control. Tools like Coupler.io’s QuickBooks connector provide real-time synchronization, eliminating manual data entry while ensuring that actual columns always reflect current financial activity.
Many businesses start with manual processes and add automation as complexity grows, allowing teams to understand their cash flow patterns before implementing automated solutions.
Weekly review and adjustment procedures
Establish a consistent weekly review process:
- Update actual results for the completed week
- Refresh assumptions for customer payment timing based on recent collection patterns
- Adjust vendor payment schedules for any negotiated term changes
- Incorporate new information about upcoming receipts or expenditures
- Review and update seasonal or cyclical assumptions
- Document significant variances and their underlying causes for future reference
This disciplined approach to rolling forecasts transforms cash flow modeling from a periodic planning exercise into an ongoing management tool that drives better financial decisions.
13-week cash flow forecast example
Initially, I wanted to show a few examples, but it would make this long read even longer. So, I’ve ended up with one example that tells a complete story and demonstrates all the key concepts from the article.
Here’s a 13-week cash flow example. Let’s say there is an outdoor equipment retailer company with $2.5M annual revenue. It’s preparing for the holiday season (November-December), which generates 40% of annual sales. The challenge to face is that it must purchase inventory 8-10 weeks before peak sales. This will create a temporary cash deficit.
Starting position: $95K cash balance in early September
Minimum cash requirement: $50K (loan covenant and operational buffer)
Initial 13-week forecast (created September 1)
| Week Ending | Cash Inflows | Cash Outflows | Net Cash Flow | Cumulative Cash | Status |
| Sept 6 (Week 1) | $45K | $40K | $5K | $100K | ✓ Healthy |
| Sept 13 (Week 2) | $40K | $42K | -$2K | $98K | ✓ Healthy |
| Sept 20 (Week 3) | $42K | $38K | $4K | $102K | ✓ Healthy |
| Sept 27 (Week 4) | $38K | $125K | -$87K | $15K | ⚠️ Below minimum |
| Oct 4 (Week 5) | $35K | $45K | -$10K | $5K | ❌ Critical |
| Oct 11 (Week 6) | $40K | $48K | -$8K | -$3K | ❌ Negative |
| Oct 18 (Week 7) | $42K | $42K | $0 | -$3K | ❌ Negative |
| Oct 25 (Week 8) | $45K | $40K | $5K | $2K | ❌ Critical |
| Nov 1 (Week 9) | $65K | $38K | $27K | $29K | ⚠️ Below minimum |
| Nov 8 (Week 10) | $85K | $42K | $43K | $72K | ✓ Recovered |
| Nov 15 (Week 11) | $110K | $45K | $65K | $137K | ✓ Strong |
| Nov 22 (Week 12) | $125K | $48K | $77K | $214K | ✓ Strong |
| Nov 29 (Week 13) | $95K | $50K | $45K | $259K | ✓ Strong |
Key insight: Week 4’s $85K inventory payment drops cash below $50K minimum. Weeks 6-7 actually go negative without intervention. Holiday sales don’t recover cash until Week 10.
Management decision: Secure $75K credit line proactively to bridge the 5-week cash gap.
Week 3 update: Rolling forecast adjustment
A major corporate customer ($50K outstanding invoice) has delayed payment from Week 5 to Week 9 due to budget approval delays. As a result, cash deficit worsens from -$3K to -$53K at low point. Credit line requirement increases from $75K to $130K.
Revised actions:
- Increase credit line to $130K (secured 6 weeks before needed)
- Negotiate 15-day payment delay with two suppliers ($20K)
- Postpone $8K store renovation from Week 6 to Week 12
Week 5: Variance analysis
| Category | Forecasted | Actual | Variance | Reason |
| Inflows: | ||||
| Retail sales | $25K | $28K | +$3K | Stronger than expected |
| Major customer | $0 | $0 | $0 | Confirmed delay |
| Online sales | $10K | $8K | -$2K | Weaker than expected |
| Outflows: | ||||
| Suppliers | $30K | $28K | +$2K | Negotiated delay working |
| Payroll | $12K | $12K | $0 | As expected |
| Rent | $3K | $3K | $0 | As expected |
| Net position | -$45K | -$43K | +$2K | Slightly better |
Retail sales running 12% above forecast. Supplier negotiations working—saving $2K weekly.
Final outcome (Week 13)
Actual Results vs. Original Plan:
| Metric | Forecast | Actual | Difference |
| Maximum cash deficit | -$3K | -$48K | -$45K worse |
| Credit line drawn | $75K | $130K | +$55K higher |
| Credit line duration | 5 weeks | 6 weeks | +1 week longer |
| Interest cost | ~$575 | ~$975 | +$400 higher |
| Final cash position | $259K | $267K | +$8K better |
| Holiday sales | As planned | +3% vs plan | Beat forecast |
What value the 13-week model has delivered:
✅ 8 weeks advance warning enabled securing favorable credit terms (5% APR vs 12-18% emergency rate)
✅ Proactive adjustments when customer delayed payment—no missed obligations
✅ $8K supplier savings through negotiated payment timing vs forced delays
✅ Net benefit: $2,325+ in avoided costs (emergency borrowing premium, late fees) minus actual costs
Key takeaway: Weekly granularity revealed the precise timing of the cash crunch. Rolling updates enabled course correction when conditions changed. Early warning created options instead of forcing emergency measures. The forecast transformed from a prediction tool into a strategic management system.
13-week cash flow projection analysis
Once your 13-week model is built and updated regularly, you can apply these 5 analytical approaches to extract maximum strategic value from your projections.
1. Scenario planning and stress testing
A successful 13 week cash flow analysis requires building three core scenarios: best-case, worst-case, and most-likely outcomes.
Your base forecast becomes the “most likely” scenario, while the best-case scenario assumes faster collections and delayed expenses, and the worst-case scenario models payment delays and unexpected costs.
Build your model to quickly test common business disruptions:
- Major customer payment delay (30-60 days late)
- Loss of significant customer or contract
- Unexpected large expense (equipment failure, legal issue)
- Economic downturn affecting collections across all customers
- Supplier demanding faster payment terms
Determine how much financial stress your business can withstand by modeling scenarios where multiple negative events occur simultaneously.
For example, test the impact of your largest customer paying 60 days late, while a key supplier demands immediate payment, and collections slow by 20% across other customers.
2. Decision support framework
Use your 13-week projections to answer critical business questions:
- When can we afford to hire?
- Model the cash impact of additional salary, benefits, and onboarding costs against projected cash flows to identify safe hiring windows.
- Should we take early payment discounts?
- Calculate whether using cash reserves for 2/10 net 30 discounts provides better returns than alternative uses of cash.
- Can we invest in equipment this quarter?
- Analyze the timing of major purchases against cash availability, ensuring adequate liquidity buffers remain.
- Do we need to renegotiate payment terms?
- Identify when extended vendor terms or faster customer collections could prevent cash shortfalls.
The 13-week horizon reveals optimal timing for major business decisions. Your analysis might show that delaying a $75K equipment purchase by four weeks aligns with a major receivables collection, eliminating the need for credit line usage.
Modern finance teams increasingly rely on AI financial insights to support these decisions, using AI-powered analytics to automatically identify optimal timing windows and quantify trade-offs.
3. Warning signs and red flags
Watch for the following immediate concerns that may signal emerging cash flow problems:
- Consistently negative cash flow weeks without seasonal justification
- Shrinking cash buffer over time despite profitable operations
- Increasing reliance on credit lines for normal operations
- Growing variance between forecast and actual results
Monitor 13-week rolling cash flow patterns to identify deteriorating conditions before they become critical. For example, if your typical cash low point moves from week 6 to week 4 over several rolling periods, investigate underlying changes in customer payment behavior or supplier terms.
Establish clear triggers for action, such as when projected cash falls below two weeks of operating expenses or when credit line utilization exceeds 75% of the available limit.
4. Communicating findings effectively
Different audiences need different information from your analysis:
- Board members want high-level trends, major risks, and strategic implications
- Lenders focus on debt service coverage and liquidity covenant compliance
- Investors care about growth investment capacity and working capital efficiency
- Operational managers need timing guidance for spending decisions and vendor negotiations
Key metrics to highlight:
- Minimum projected cash balance and when it occurs
- Maximum credit line usage required
- Number of weeks until cash recovery after low points
- Variance trends showing forecasting accuracy improvement
Focus on actionable insights rather than raw data. Instead of showing all 13 weeks of projections, highlight critical decision points: “We can safely hire two people starting week 8, but earlier hiring would require additional credit line access.”
5. Using analysis to improve forecasting
Regular analysis reveals forecasting weaknesses that can be systematically improved. If customer payments consistently arrive one week later than projected, adjust collection assumptions accordingly.
Analysis often shows that certain expense or revenue categories should be split for better accuracy. For example, separating retail customers from enterprise customers may reveal significantly different payment patterns.
Use variance analysis to identify which assumptions need regular updating. Seasonal factors, customer payment behavior, and supplier term changes all require periodic recalibration based on actual results.
This analytical approach transforms your 13-week model from a planning tool into a comprehensive business intelligence system that supports confident decision-making and proactive risk management.
Benefits of a 13-week cash flow model
While a 13-week cash flow model requires consistent upkeep and disciplined forecasting, the return on that investment is significant.
When built and maintained properly, it can deliver early warning signals for cash shortfalls, elevating capital allocation decisions, strengthening stakeholder confidence, and enhancing operational planning and risk management.
The result is a far more resilient and proactive financial strategy that can transform how the business navigates uncertainty.
Early warning system for cash shortfalls
A 13-week cash flow model gives you 2–3 months of advance warning before potential liquidity issues surface. That’s enough time to negotiate payment terms, secure short-term financing, adjust spending plans, or take corrective action before a crisis develops.
This early visibility turns cash management from reactive firefighting into proactive financial control.
Advance visibility benefits:
- Negotiate more favorable terms with customers or suppliers before a shortfall hits, such as extending payables or accelerating key receivables.
- Secure short-term financing or adjust spending plans strategically with enough lead time to avoid emergency borrowing or abrupt cuts.
- Align major decisions, like hiring or capital purchases, with available cash, ensuring liquidity isn’t compromised.
- Hold informed, proactive conversations with lenders, investors, and internal stakeholders using clear data rather than reacting under pressure.
Example: If your forecast shows a cash dip eight weeks out, you can renegotiate a supplier’s 30-day term to 45 days, delay a planned equipment purchase by one cycle, and line up a small working-capital facility—all before the shortfall impacts operations.
Enhanced decision-making for capital allocation
Clear visibility into your future cash position enables confident decisions about when to invest, when to hold back, and how to allocate resources without risking day-to-day operations.
A 13-week cash flow model helps you time major decisions, like equipment purchases, hiring, or expansion, based on when cash will actually be available. Instead of guessing, you can anchor decisions to specific surplus or tightening periods.
For example, if Weeks 8–10 show a projected $150K surplus, you can confidently approve a planned equipment purchase. But if Weeks 5–7 reveal tightening, you can postpone that purchase to avoid straining liquidity.
The model also strengthens your evaluation process by showing the precise cash impact of each decision, ensuring growth investments stay aligned with your working capital needs.
Stronger stakeholder relationships
A 13-week cash flow model strengthens every key relationship by giving stakeholders the specific clarity they care about—how much cash the business will have, when it will have it, and whether upcoming obligations can be met without stress. Different groups look for different assurances, and the model helps you address each one directly:
- Lenders: Want confidence that debt service will be met on schedule.
The model shows exactly when cash will be available for payments, improving your ability to negotiate terms or renew credit facilities. - Investors: Want evidence of management competence and financial discipline.
Your projections demonstrate that you understand your cash cycle and can plan growth without jeopardizing liquidity. - Suppliers and vendors: Want predictable payment cycles and early notice of changes.
The model provides documented cash timing, making it easier to request flexibility or negotiate extended terms. - Board members: Want visibility into short-term liquidity risks and upcoming cash needs.
Regular 13-week reporting supports better oversight and more informed strategic decisions.
By answering each stakeholder’s core concerns with disciplined, data-driven projections, the model signals financial sophistication, builds trust, and strengthens your negotiating position across every relationship.
Operational planning and risk management
A 13-week cash flow model is a powerful risk management tool because it quantifies the financial impact of potential disruptions long before they occur.
By modeling “what-if” scenarios, you can understand how sensitive your cash position is to key events and prepare contingency plans in advance.
Risk management advantages:
- Model customer payment delays to see how a 30–60 day slip from your largest customer affects liquidity—and determine whether you need to adjust spending or secure temporary financing.
- Test cost shocks such as an unexpected equipment failure or legal expense, and evaluate whether your current cash buffer is sufficient to absorb the hit.
- Simulate market or demand changes, like collections slowing 15–20% across all customers, and plan mitigation steps before the impact becomes critical.
- Prepare for multiple stress events at once, such as a delayed receivable and a supplier demanding shorter terms, so you can build a realistic contingency plan.
By quantifying the financial impact of these scenarios, the 13-week model turns risk management from guesswork into a data-driven process.


