What is Instagram Ads analytics
Instagram Ads analytics are data insights used for reporting on your Instagram paid social media campaigns. They allow you to analyze ad performance data on your ad sets, see which campaigns have the best engagement rates or generate the highest return on ad spend. Then, you can easily adjust your social media marketing strategy.
In this article, we go over the main Instagram Ads analytics options and explain the benefits and drawbacks of each. We’ll also cover key metrics you should be tracking in order to maximize your results.
How to analyze Instagram Ads performance
There are three distinct ways to analyze your Instagram Ads performance data:
- Native method. Instagram Insights offers a quick overview of reach, impressions, followers, and other engagement metrics. For deeper analysis, you can use Facebook (Meta) Ads Manager, a built-in analytics tool. It offers breakdowns of conversion metrics.
- Instagram Ads dashboard templates. These are pre-designed solutions for tracking and analyzing the performance of your Instagram Ads campaigns. If you use templates by Coupler.io, you only need to connect your Meta Ads account to populate the dashboard with your data. Moreover, some templates are designed to analyze ad data across multiple platforms in addition to Instagram. You can also set up automatic data refreshes to ensure you always have the latest campaign data at your fingertips.
- Custom reports built from scratch. If you want to go a step further, create a personalized report for your Instagram Ads. Coupler.io allows you to do this in a few clicks and load your preferred metrics to the custom report or dashboard. Similar to the aforementioned templates, you can consolidate data from multiple channels and refresh ad performance on a schedule.
Now that you understand the basics of each approach, let’s explore them in more detail.
Native options to analyze Instagram Ads data
Let’s explore the key features and differences between these two native Instagram Ads analytics tools.
Instagram insights
Note: To have access to Instagram Insights, you need a business account or a creator account on Instagram.
Instagram Insights is the quickest way to access data on your ads through your Instagram account. The feature is only available in the mobile app, and it’s unsuitable for analyzing Instagram Ads as a standalone solution.
Since it’s not designed for advanced reporting, we’ll not focus on it too much.
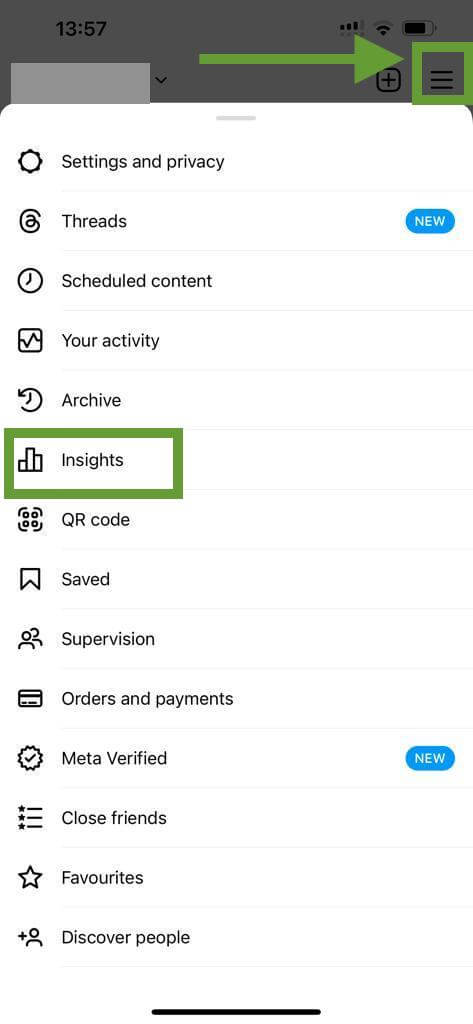
To access Instagram Insights, go to your Instagram profile and click on the profile menu on the top right corner, then click on Insights.
Alternatively, you can click View Insights on the specific post, video, or reel you want to analyze.
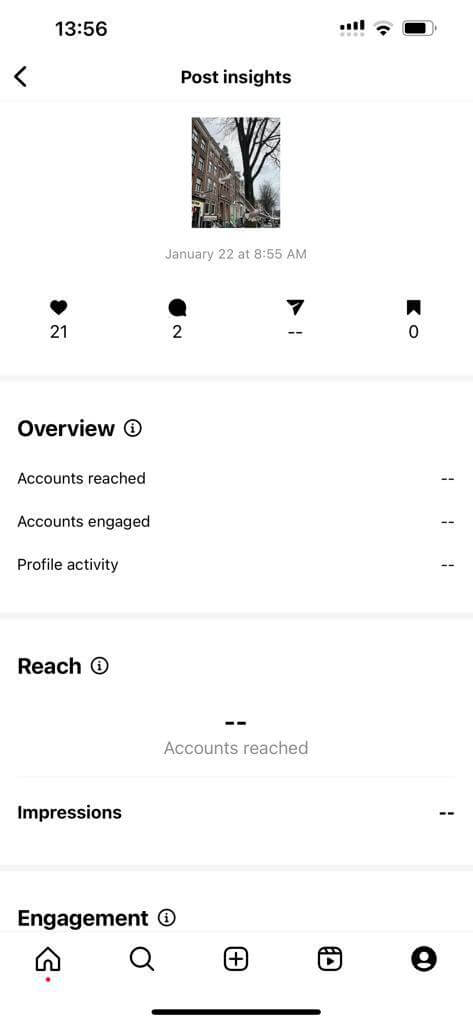
This is more of an on-the-go solution that gives you a glance of your digital ads performance.
For more insights, you should use the second option to analyze Instagram Ads, the native Facebook Ads Manager.
Facebook Ads Manager
Facebook Ads Manager (Meta Ads Manager) is the main tool you can access to understand your ad performance. This is an all-in-one tool for setting and analyzing Facebook and Instagram campaigns.
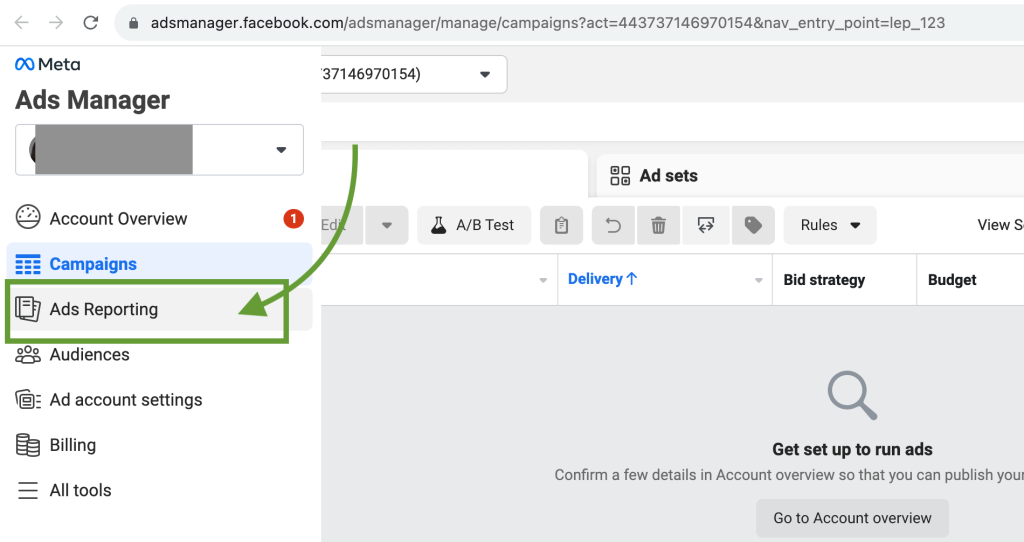
To access Instagram Ads analytics, you need to go to your ads manager and click on Ads Reporting on the left side menu. This will give you an overview of all your campaigns, ad sets, and ads in your account.
If you have campaigns running, you can see them in a list with quick performance data displayed in the main dashboard. This gives you an overview of your settings, like the bid strategy, budget, and attribution, as well as top results and reach.
The same data views apply at the Ad sets and Ads levels, so you can quickly analyze Instagram Ads in one view.
Depending on the ad objective you choose when creating the ad, you’ll have different metrics available. For example, in an engagement ad, your top metrics will be Engagement and Cost per result.
For more ad data insights, you can access standard report breakdowns by clicking on Reports in the top right corner.
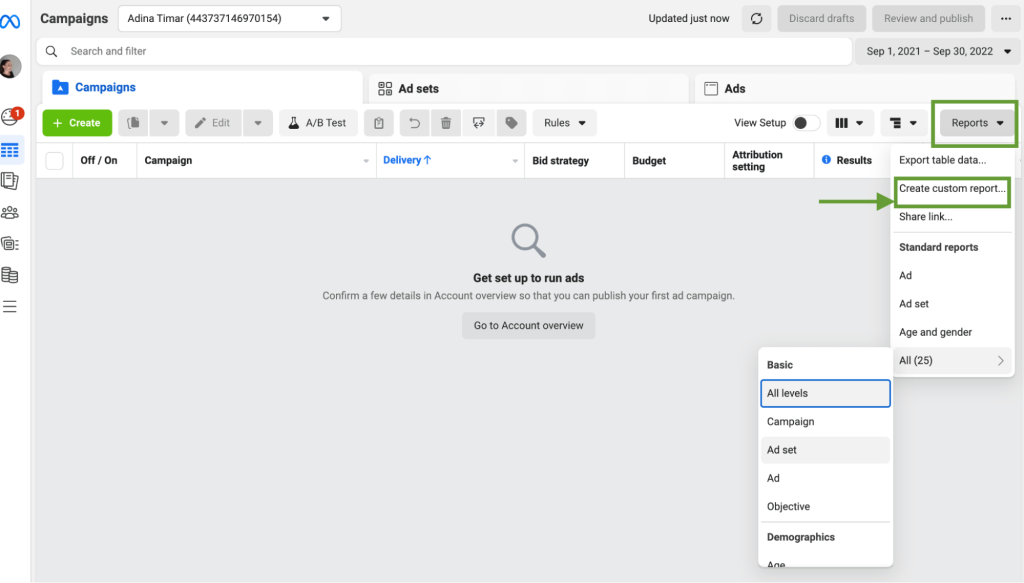
This will take you to the custom reporting dashboard where you can personalize pivot tables to show you the data you are interested in:
- Analyze multiple ad accounts across your business and compare results in one single table.
- Create a breakdown of your ad creatives to compare images, videos, and text from different ads to see which performs best.
- See breakdowns of conversion metrics by different demographics, placement, and more.
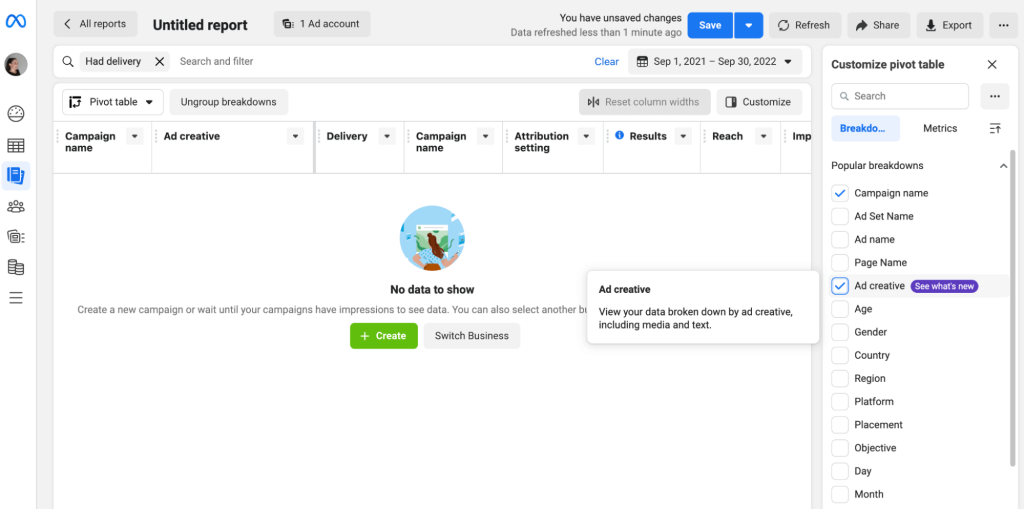
All custom reports can be saved and exported if you need to share the data with your team.
Is Facebook Ads Manager enough for analyzing Instagram ad metrics?
With all these reports, you might think that the native analytics solution provided by Meta is enough.
If you’re only running a few occasional ads, then the Facebook Ads Manager should be good enough for you. You can manage both Instagram and Facebook Ads inside it.
But when it comes to managing several campaigns at once, its lack of advanced features can slow you down. Major drawbacks include:
- Regular delays in updating the data i.e. no access to real-time results.
- Limited visualization and customization options when building reports.
- If you’re running campaigns on channels besides Instagram and Facebook, there’s no way to compare results with Facebook Ads Manager alone. It can be hard to understand which platform is driving the best results.
On top of that, as you start scaling and investing more budget into your digital marketing strategy, your paid campaigns will diversify. Soon, if you’re only using Facebook Ads Manager, you’ll start drowning in ongoing campaigns that must be monitored closely for optimizations.
It’s hard to understand which platform is driving the best results when you don’t have all your data in one place. With these limitations, it is no wonder that most performance marketers opt for dedicated analytics and reporting tools to create custom dashboards.
Learn more about performance marketing for B2B SaaS.
Dashboard templates for Instagram Ads analytics
With Facebook Ad Manager’s limitations, it is no wonder that most performance marketers opt for marketing and automation tools for a customized solution. For example, using a tool like AdEspresso by Hootsuite will unlock more custom analytics dashboards. You will be able to both create and analyze your Google, Facebook, and Instagram campaigns in one place.
The downside is that as you grow, so does your monthly price. The starter plan includes tracking ad campaigns up to $1,000 monthly spend, which can be very limited.
Instagram report templates are an alternative solution to analyze Instagram Ads. Here are some handy dashboards that you can get started with right away.
Instagram Ads multi-account dashboard
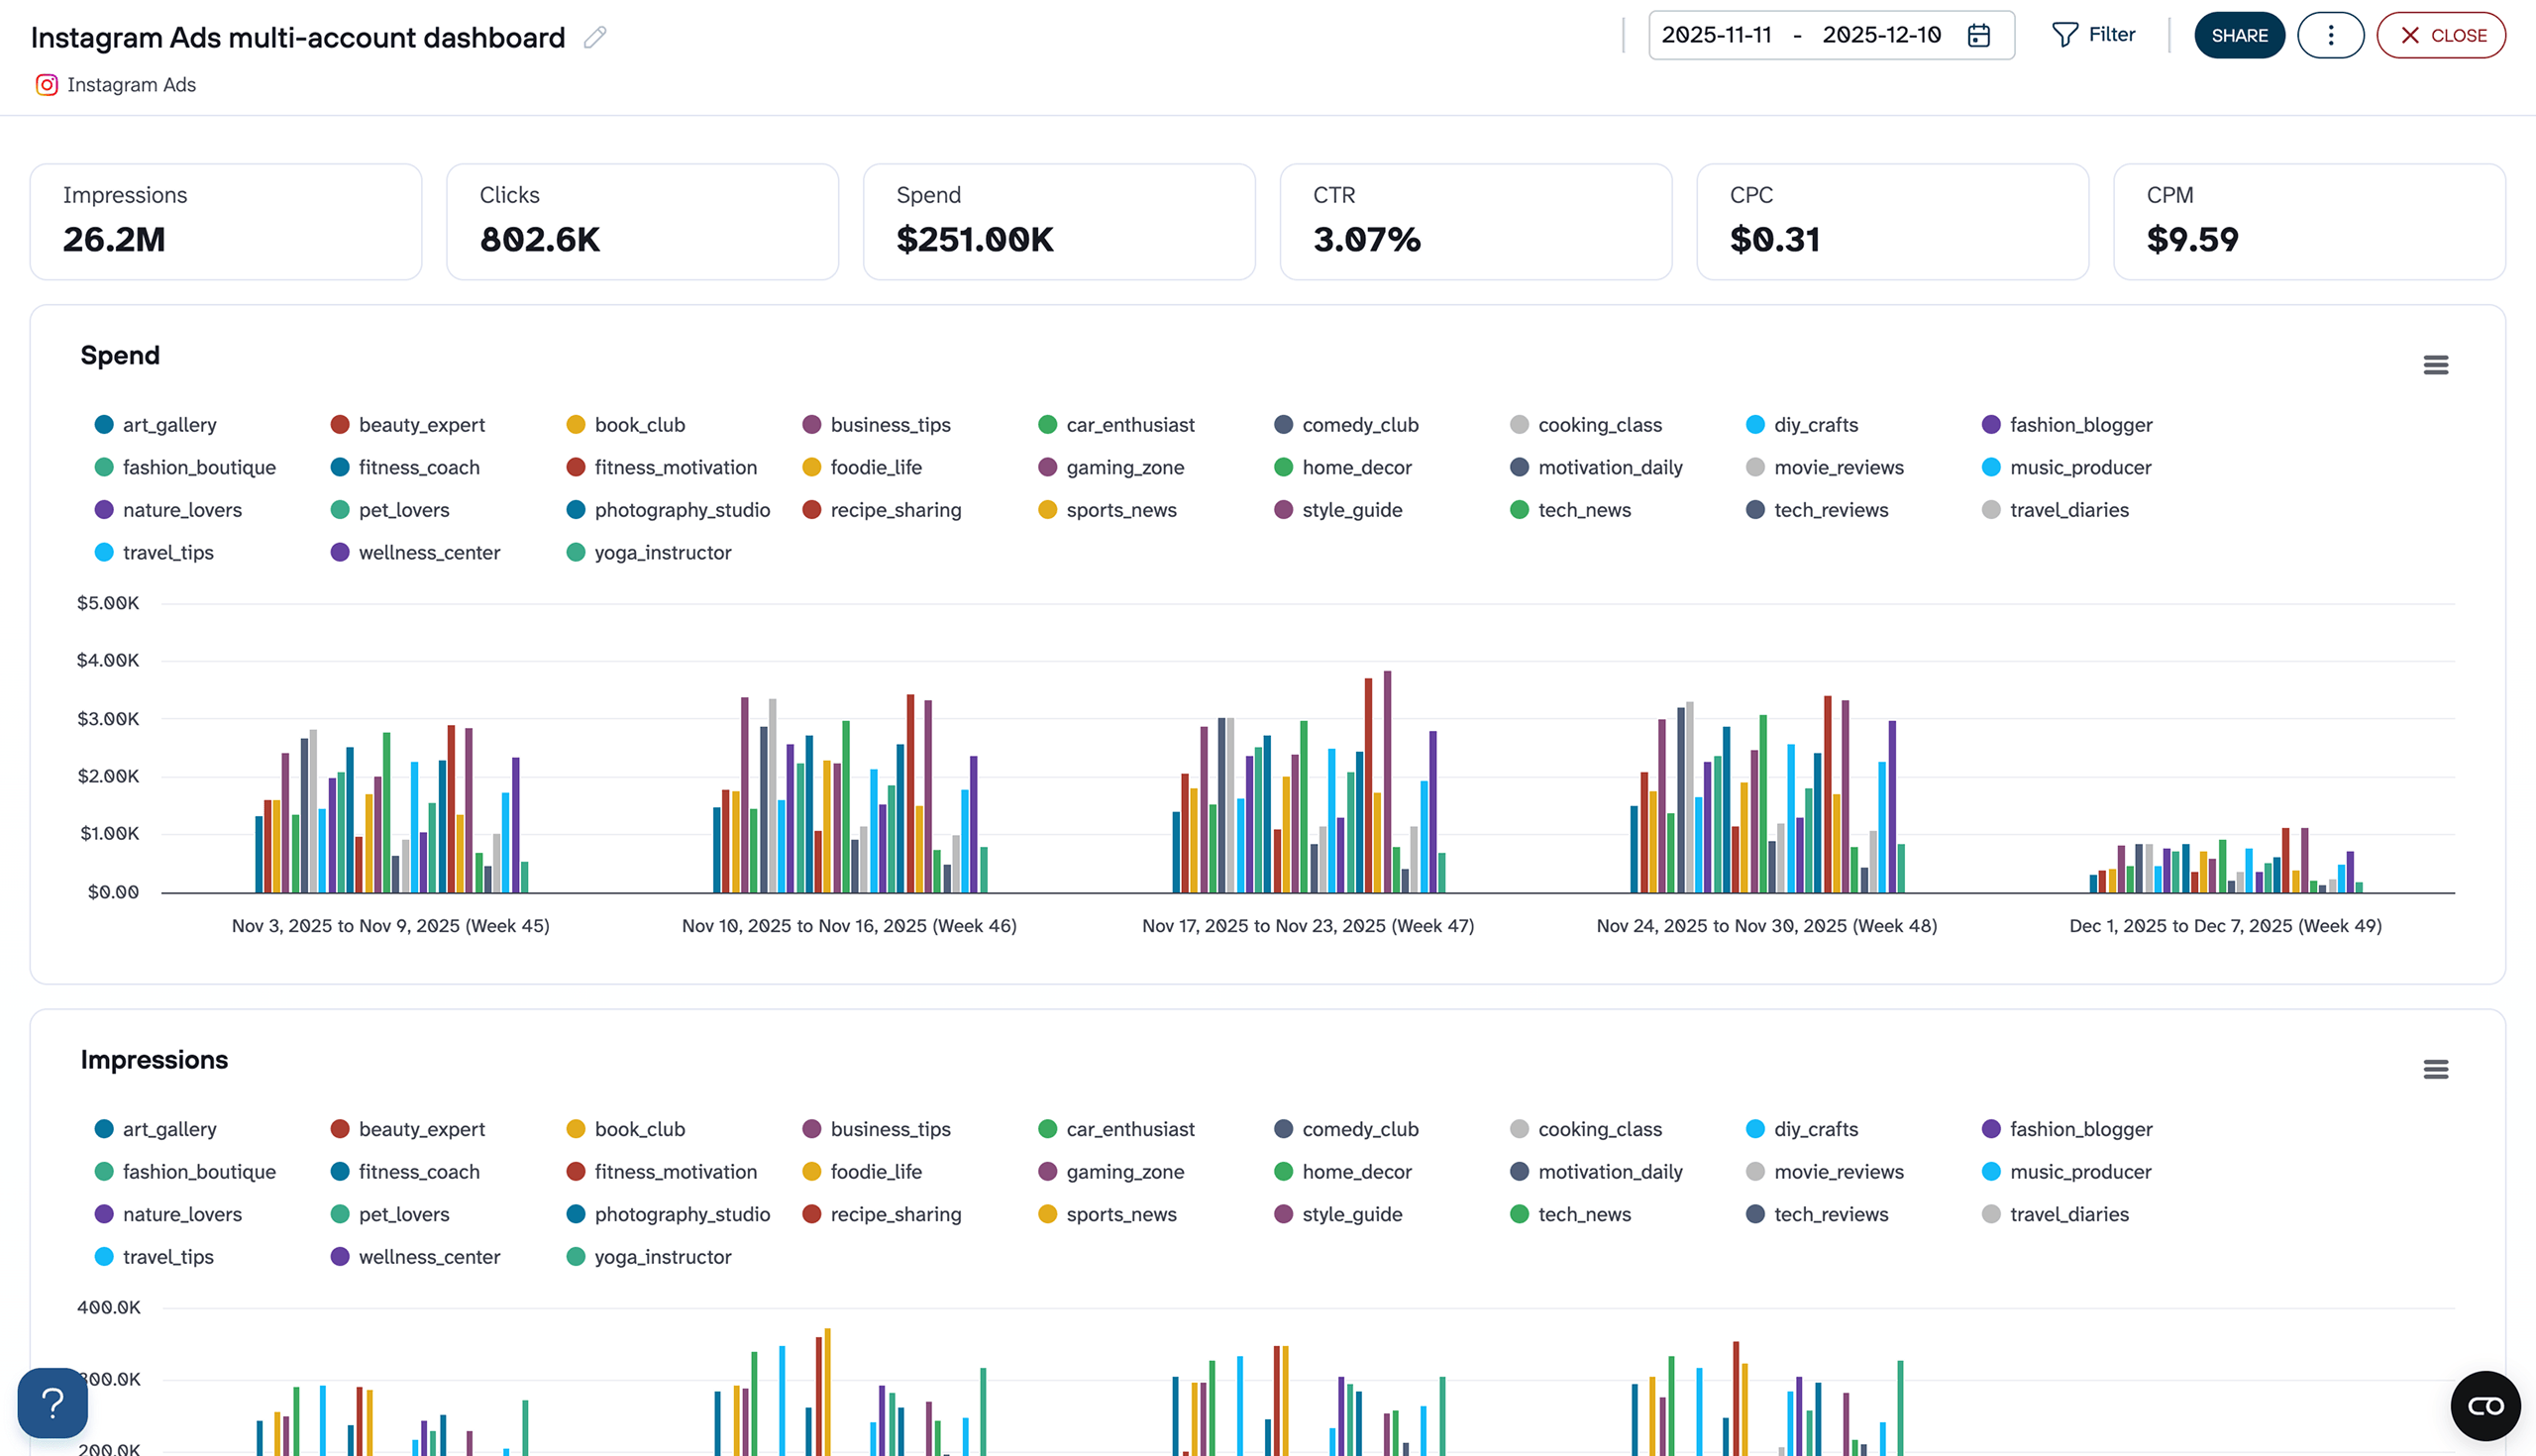
One of the biggest gaps in Meta Ads Manager is comparing Instagram ad performance across multiple accounts without manually exporting data from each one. This dashboard closes that gap. It connects to all your Instagram ad accounts at once and breaks down spend, clicks, impressions, CTR, CPC, CPM, reach, and frequency at the account level.
Instagram Ads multi-account dashboard
 Preview dashboard
Instagram Ads multi-account dashboard
Preview dashboardWhere this becomes particularly valuable is in weekly pacing and cost control. The grouped bar charts make it easy to see which accounts are burning through budget too fast or falling behind on delivery. Frequency and reach charts add another layer. If an account’s daily frequency is climbing while CTR drops, that’s a clear signal to refresh creatives or tighten the audience before costs spiral.
The dashboard is available right in Coupler.io, so you only need to connect your Instagram Ads account to use it.


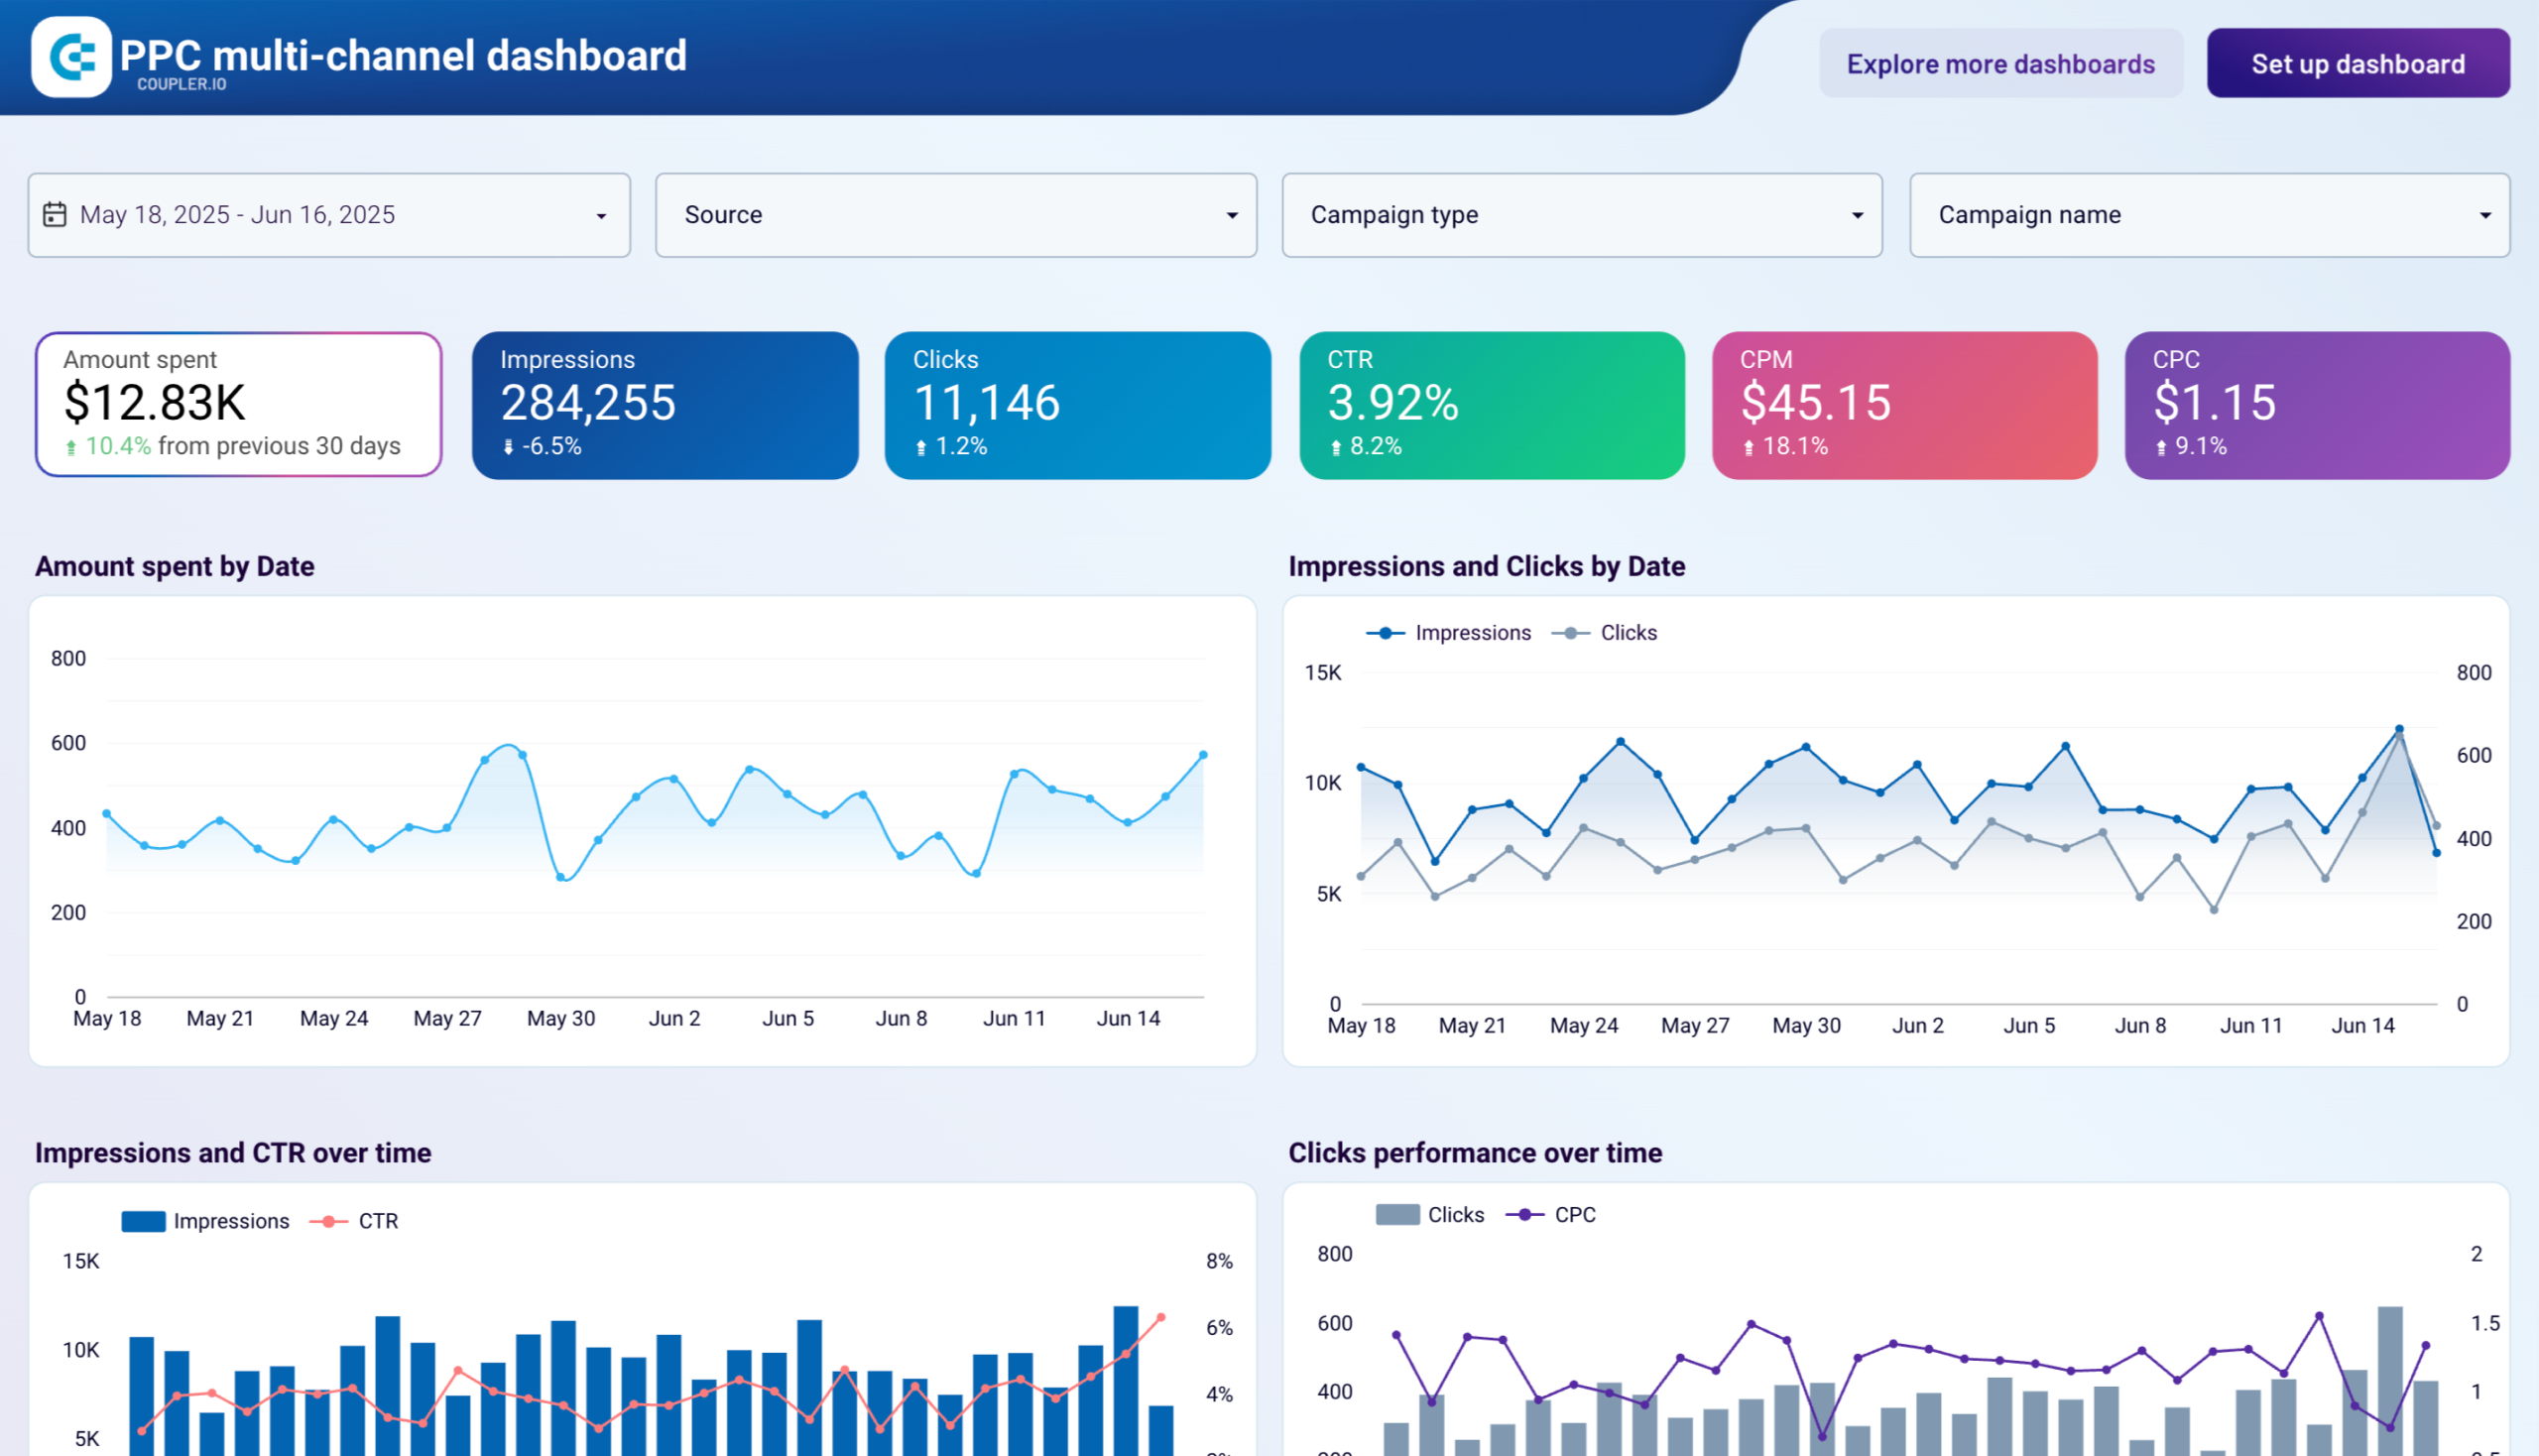
PPC multi-channel dashboard template for Looker Studio
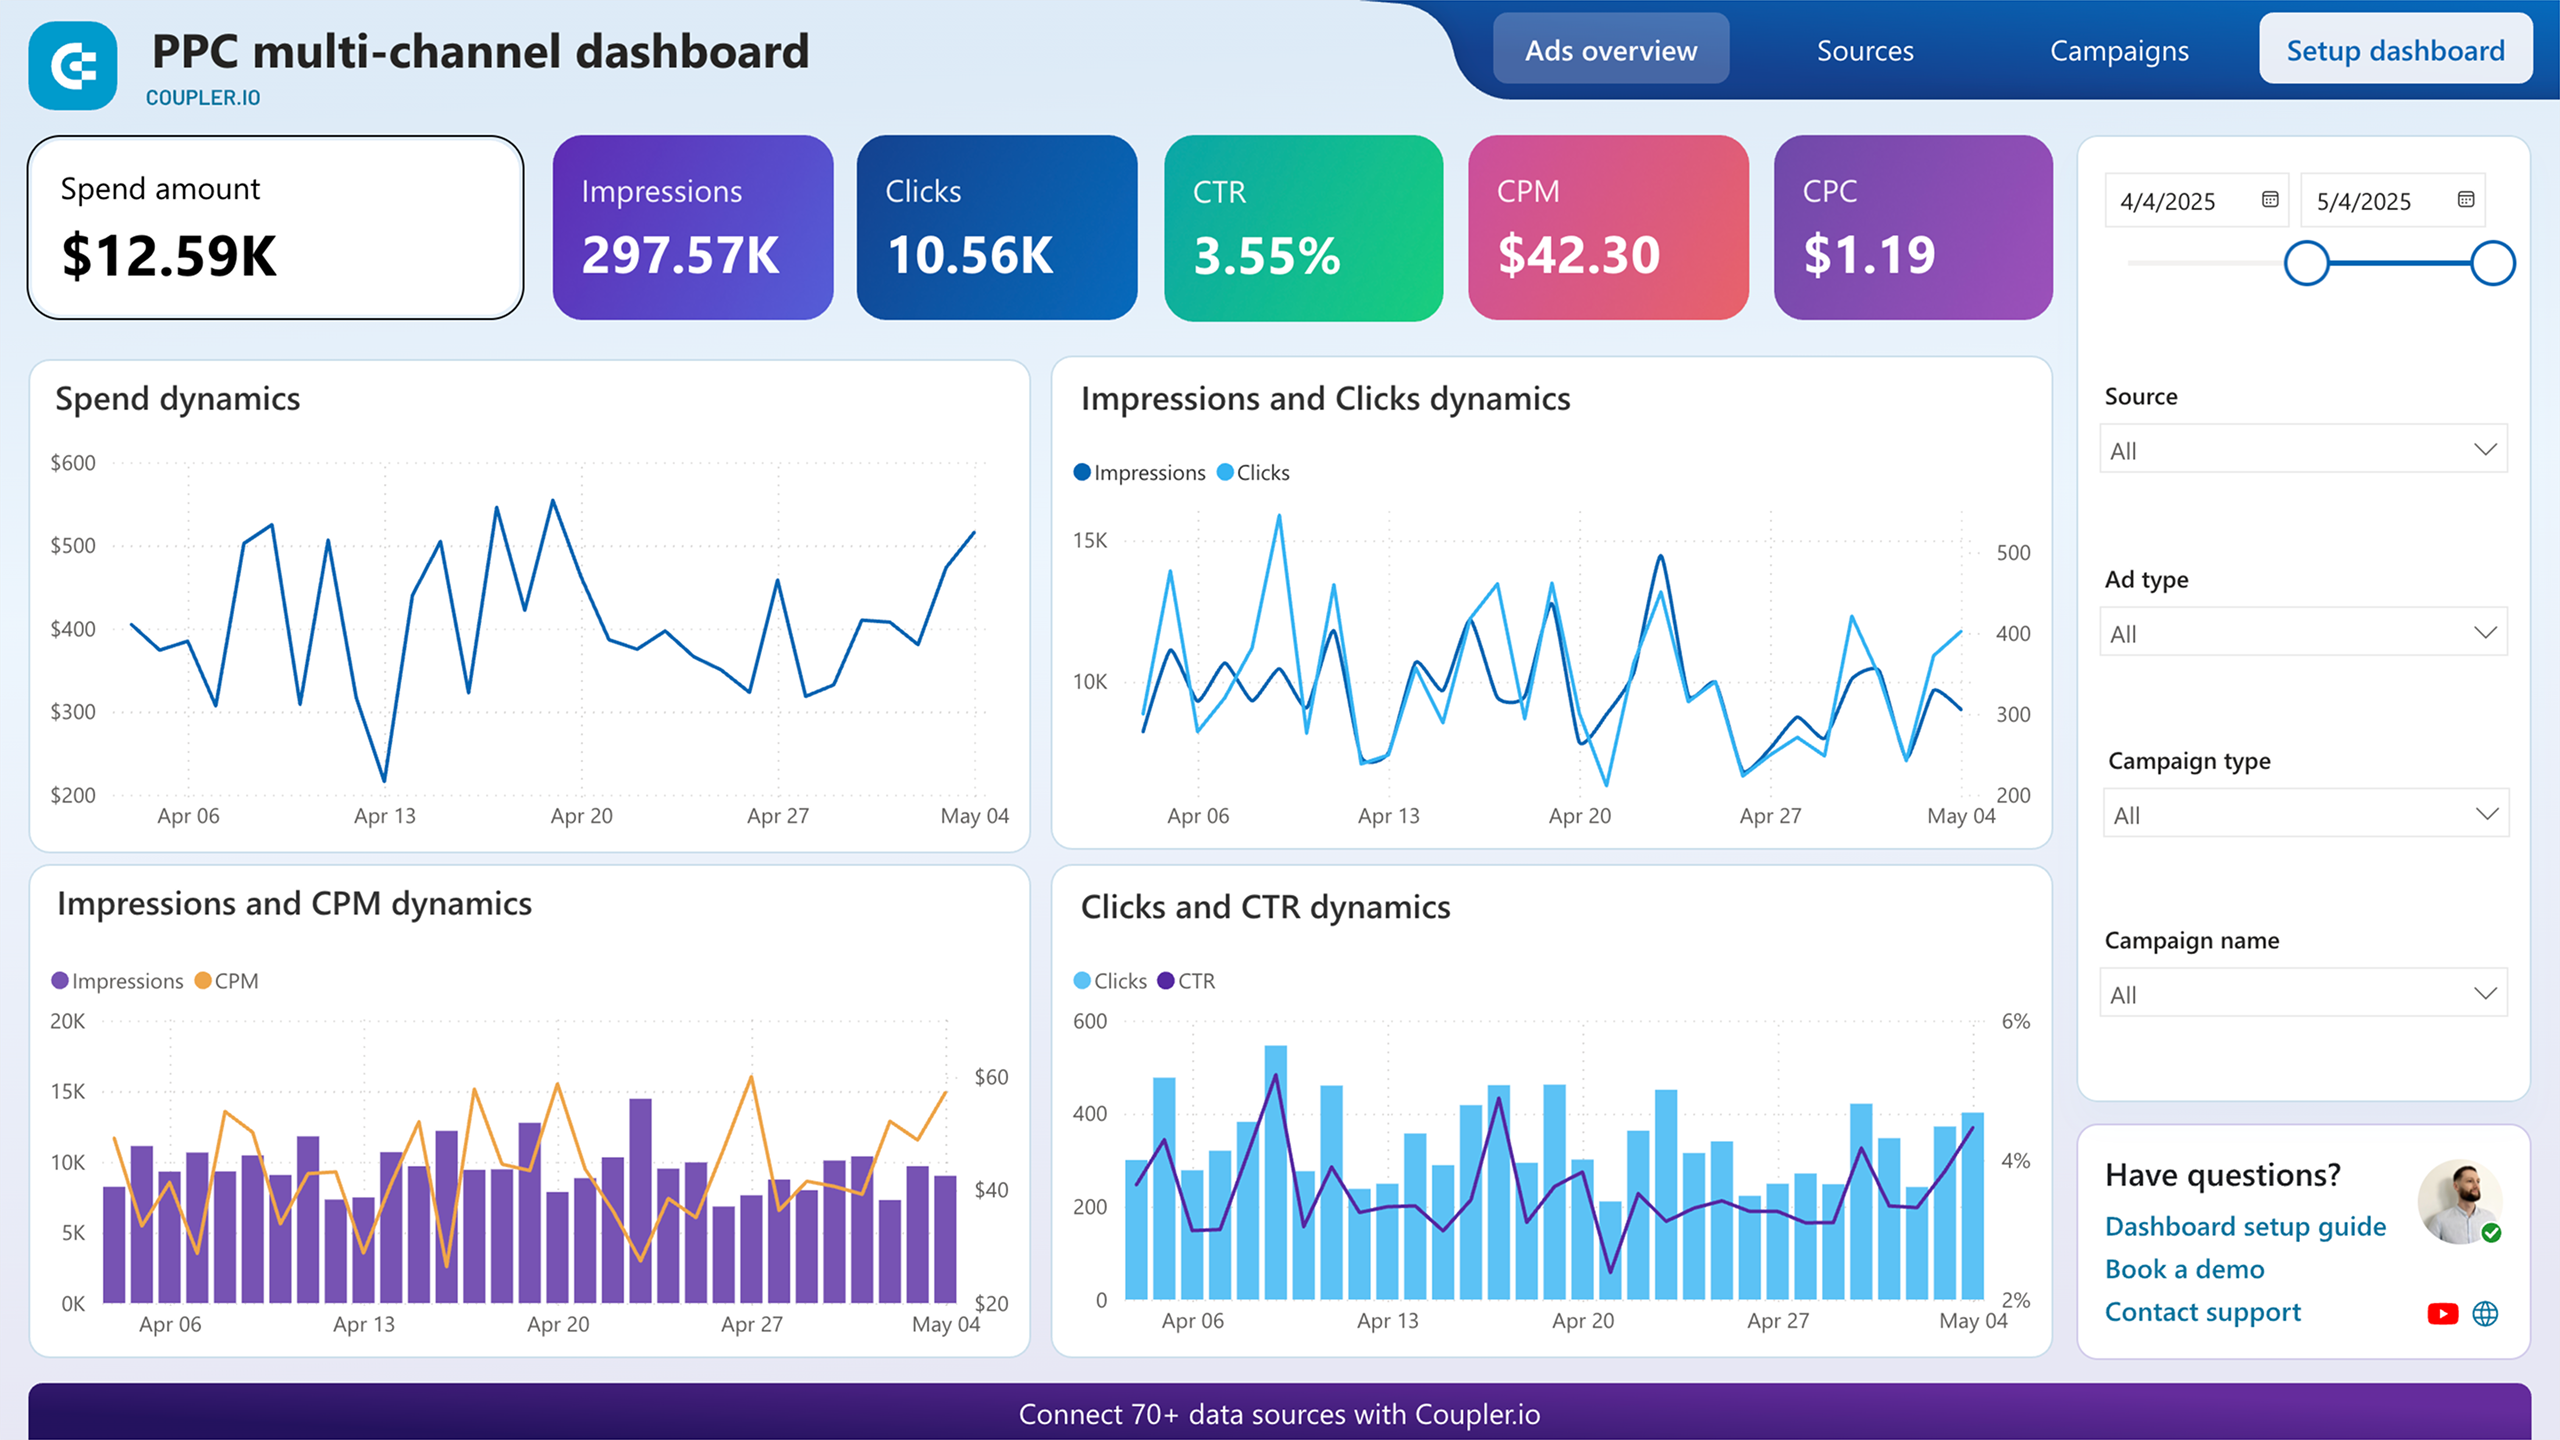
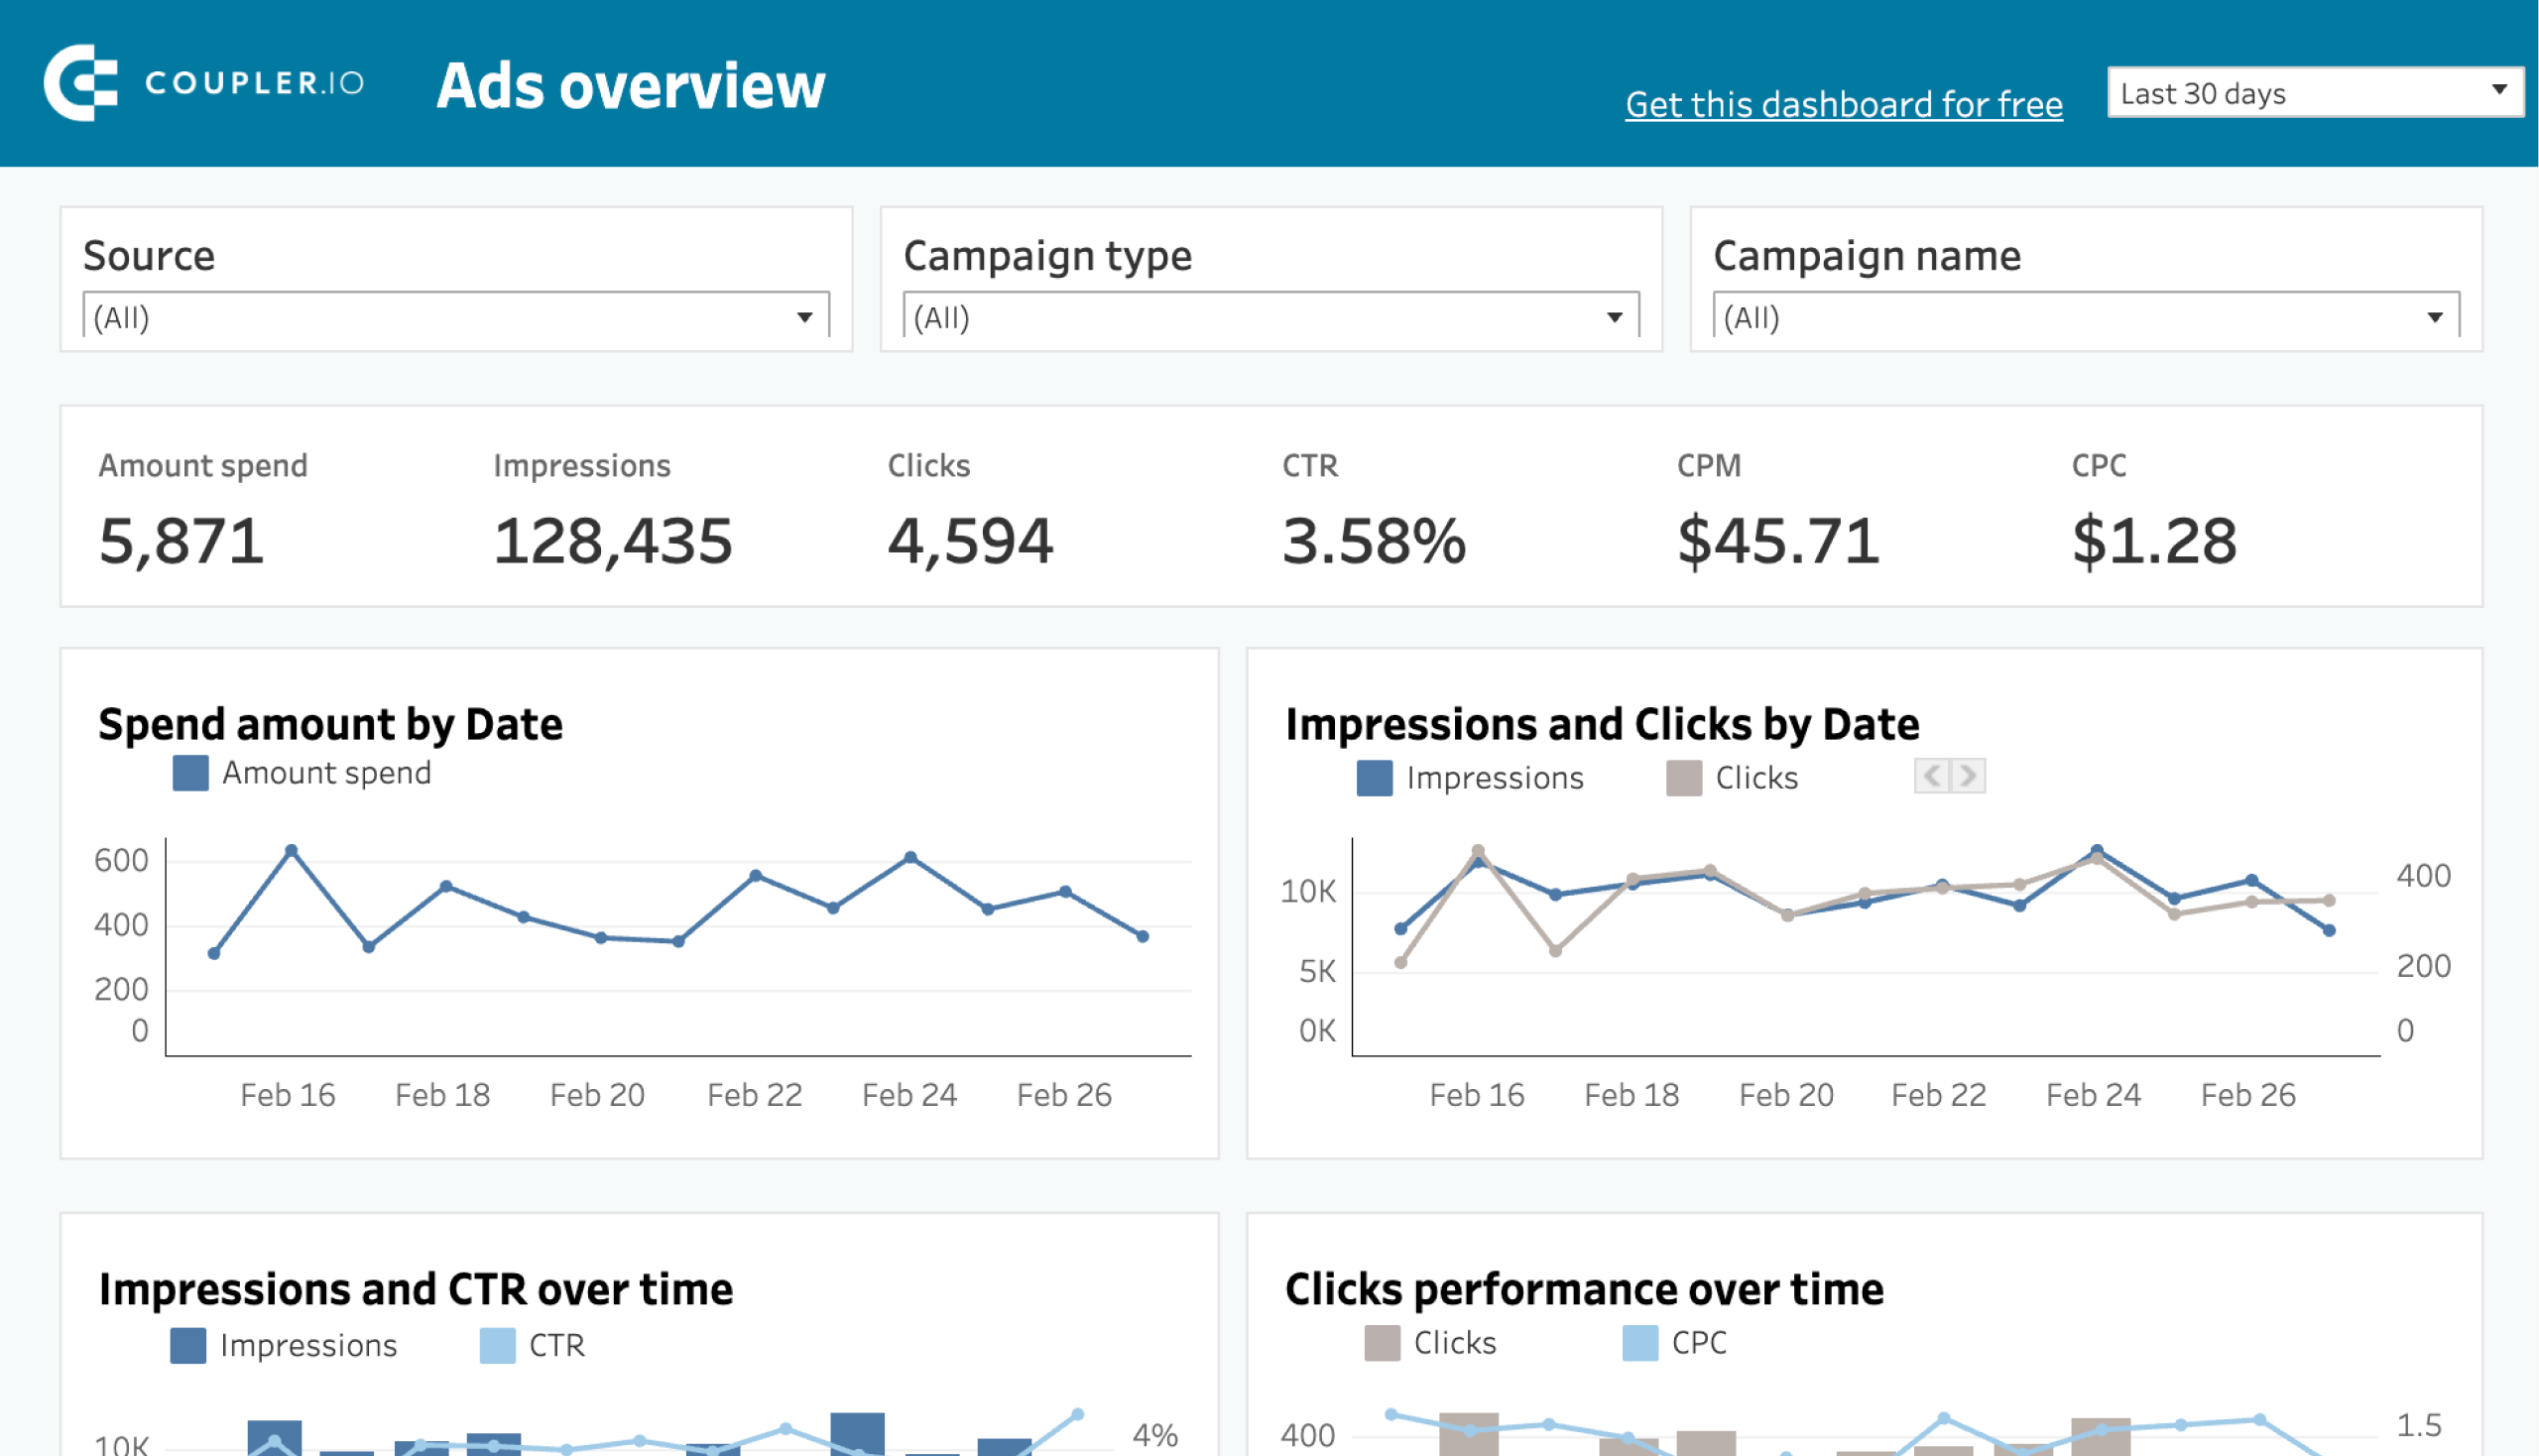
This PPC multi-channel dashboard is a great tool if you run ad campaigns on different platforms. It’s a concise, one-page report that automatically pulls fresh data from channels like Instagram, Facebook, TikTok, Google, and more.
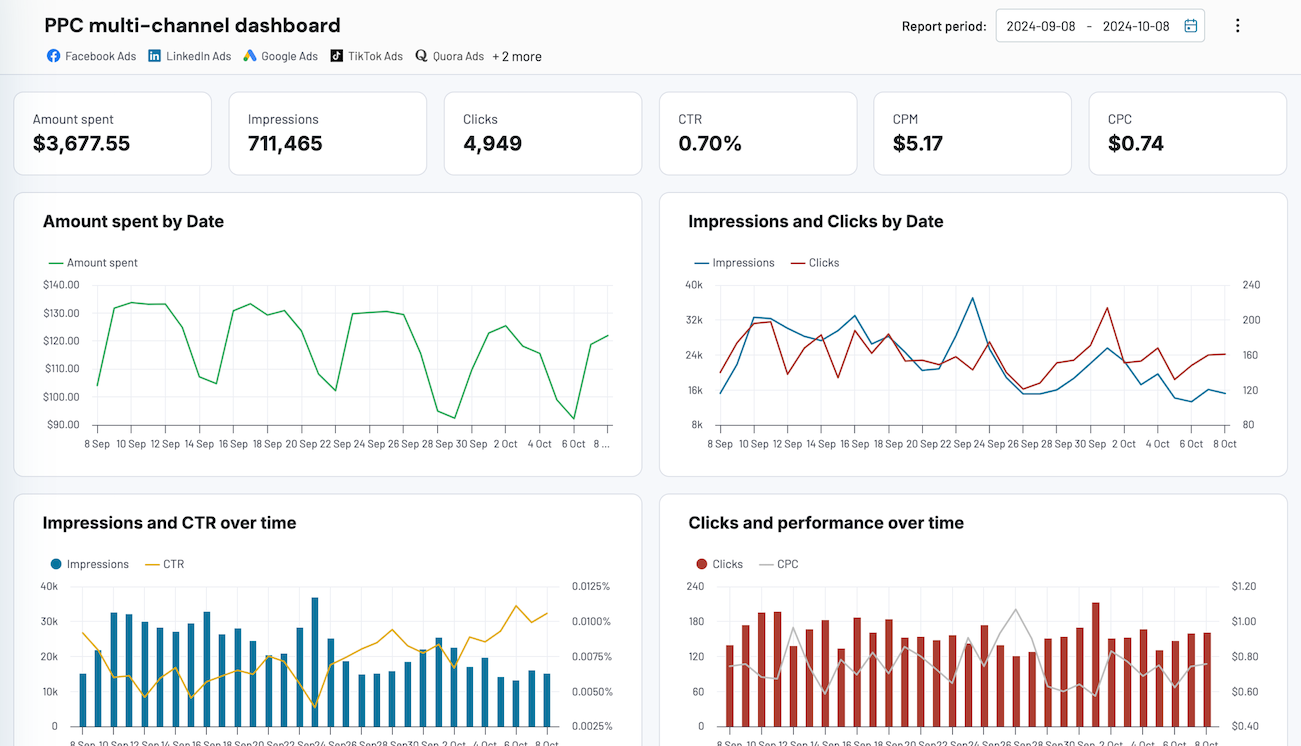
You can compare performance metrics for Instagram ads against other platforms, keep track of campaign progress, and filter by source to conduct a granular analysis of your Instagram ads results.
It’s also possible to drill down into ad spend by campaign type, or filter by date to uncover trends in your ad performance.
If you only need to use it as the Instagram dashboard template, just connect Meta Ads account and ignore or deleted other ad platforms. This way, you’ll get a dedicated reporting solution for Instagram advertising.
With Coupler.io, it takes less than 5 minutes to load your ads data into the dashboard, schedule automatic updates, and start analyzing all your PPC data in one place. Besides Looker Studio, this template is also available for BI tools like Tableau and Google Sheets. Check them out:







All-in-one marketing dashboard template
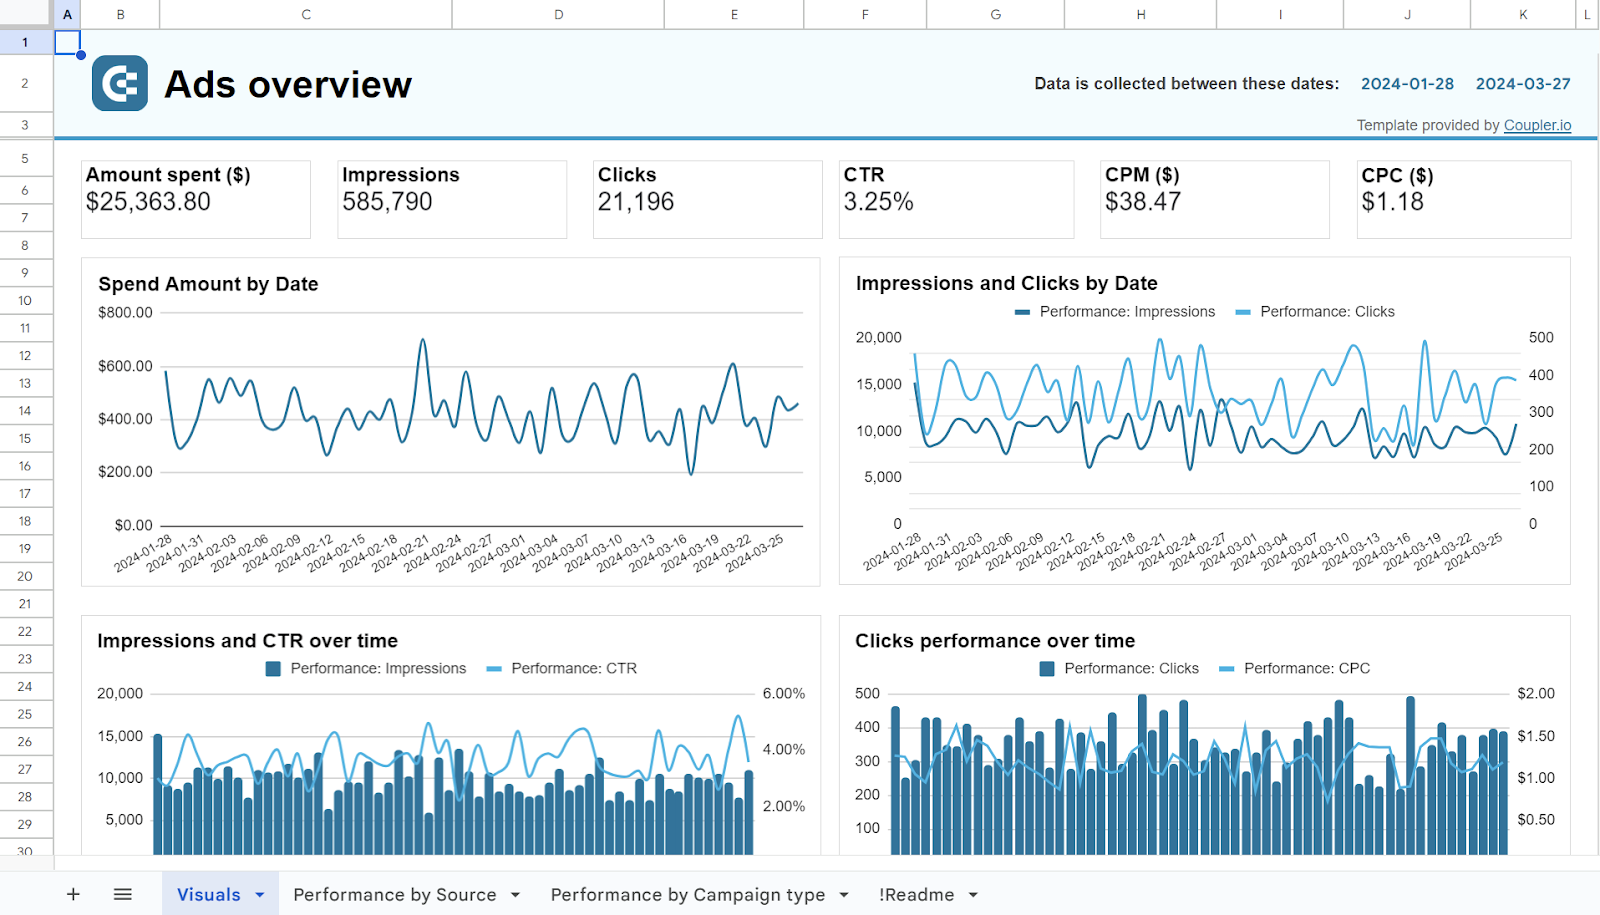
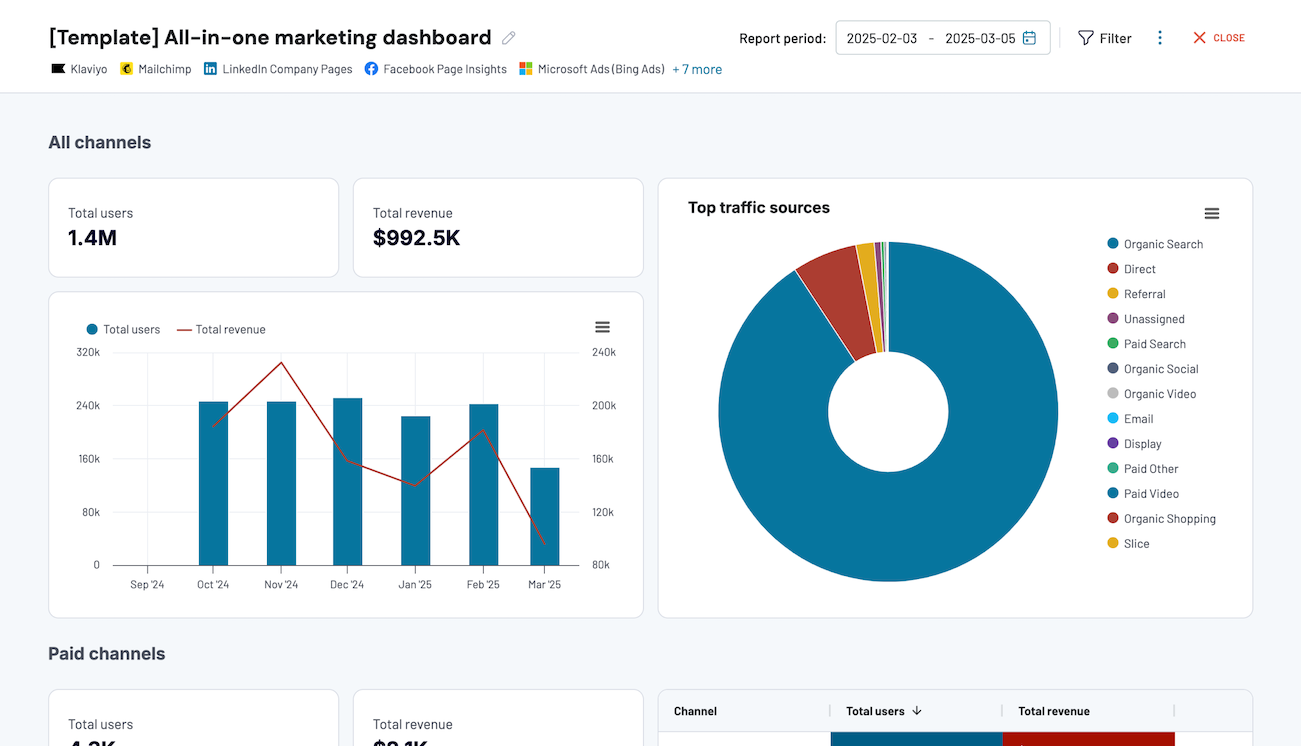
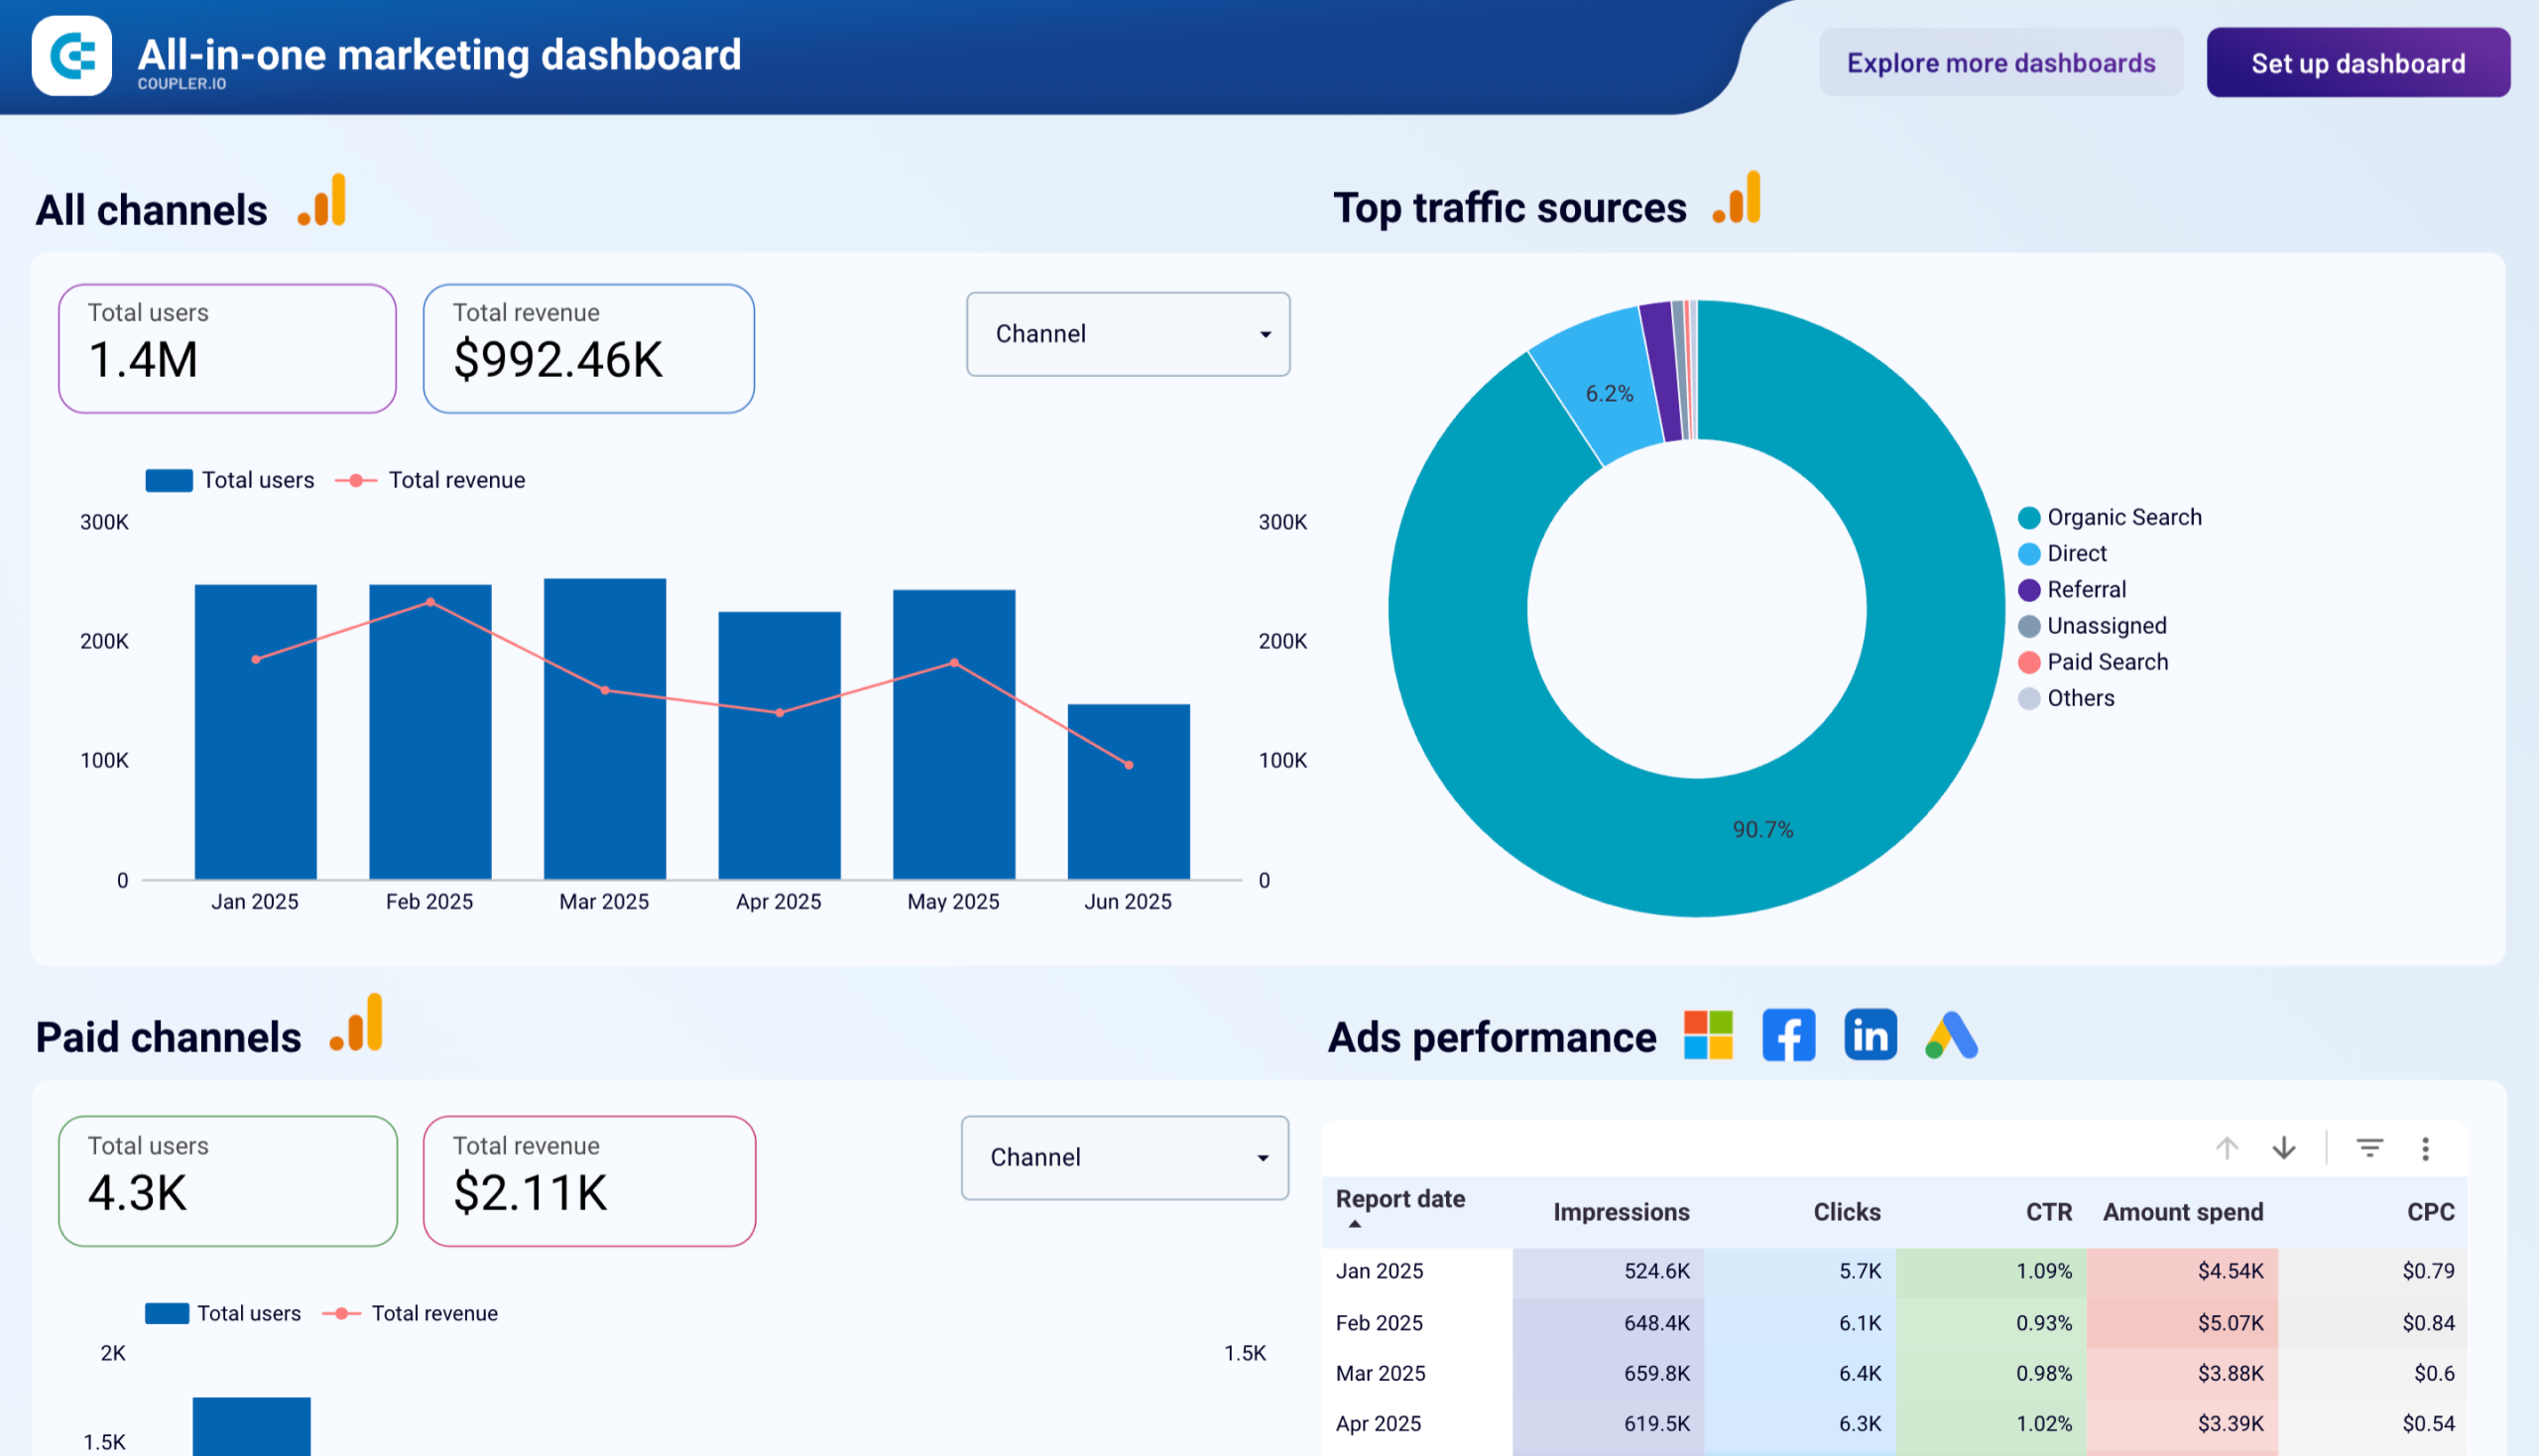
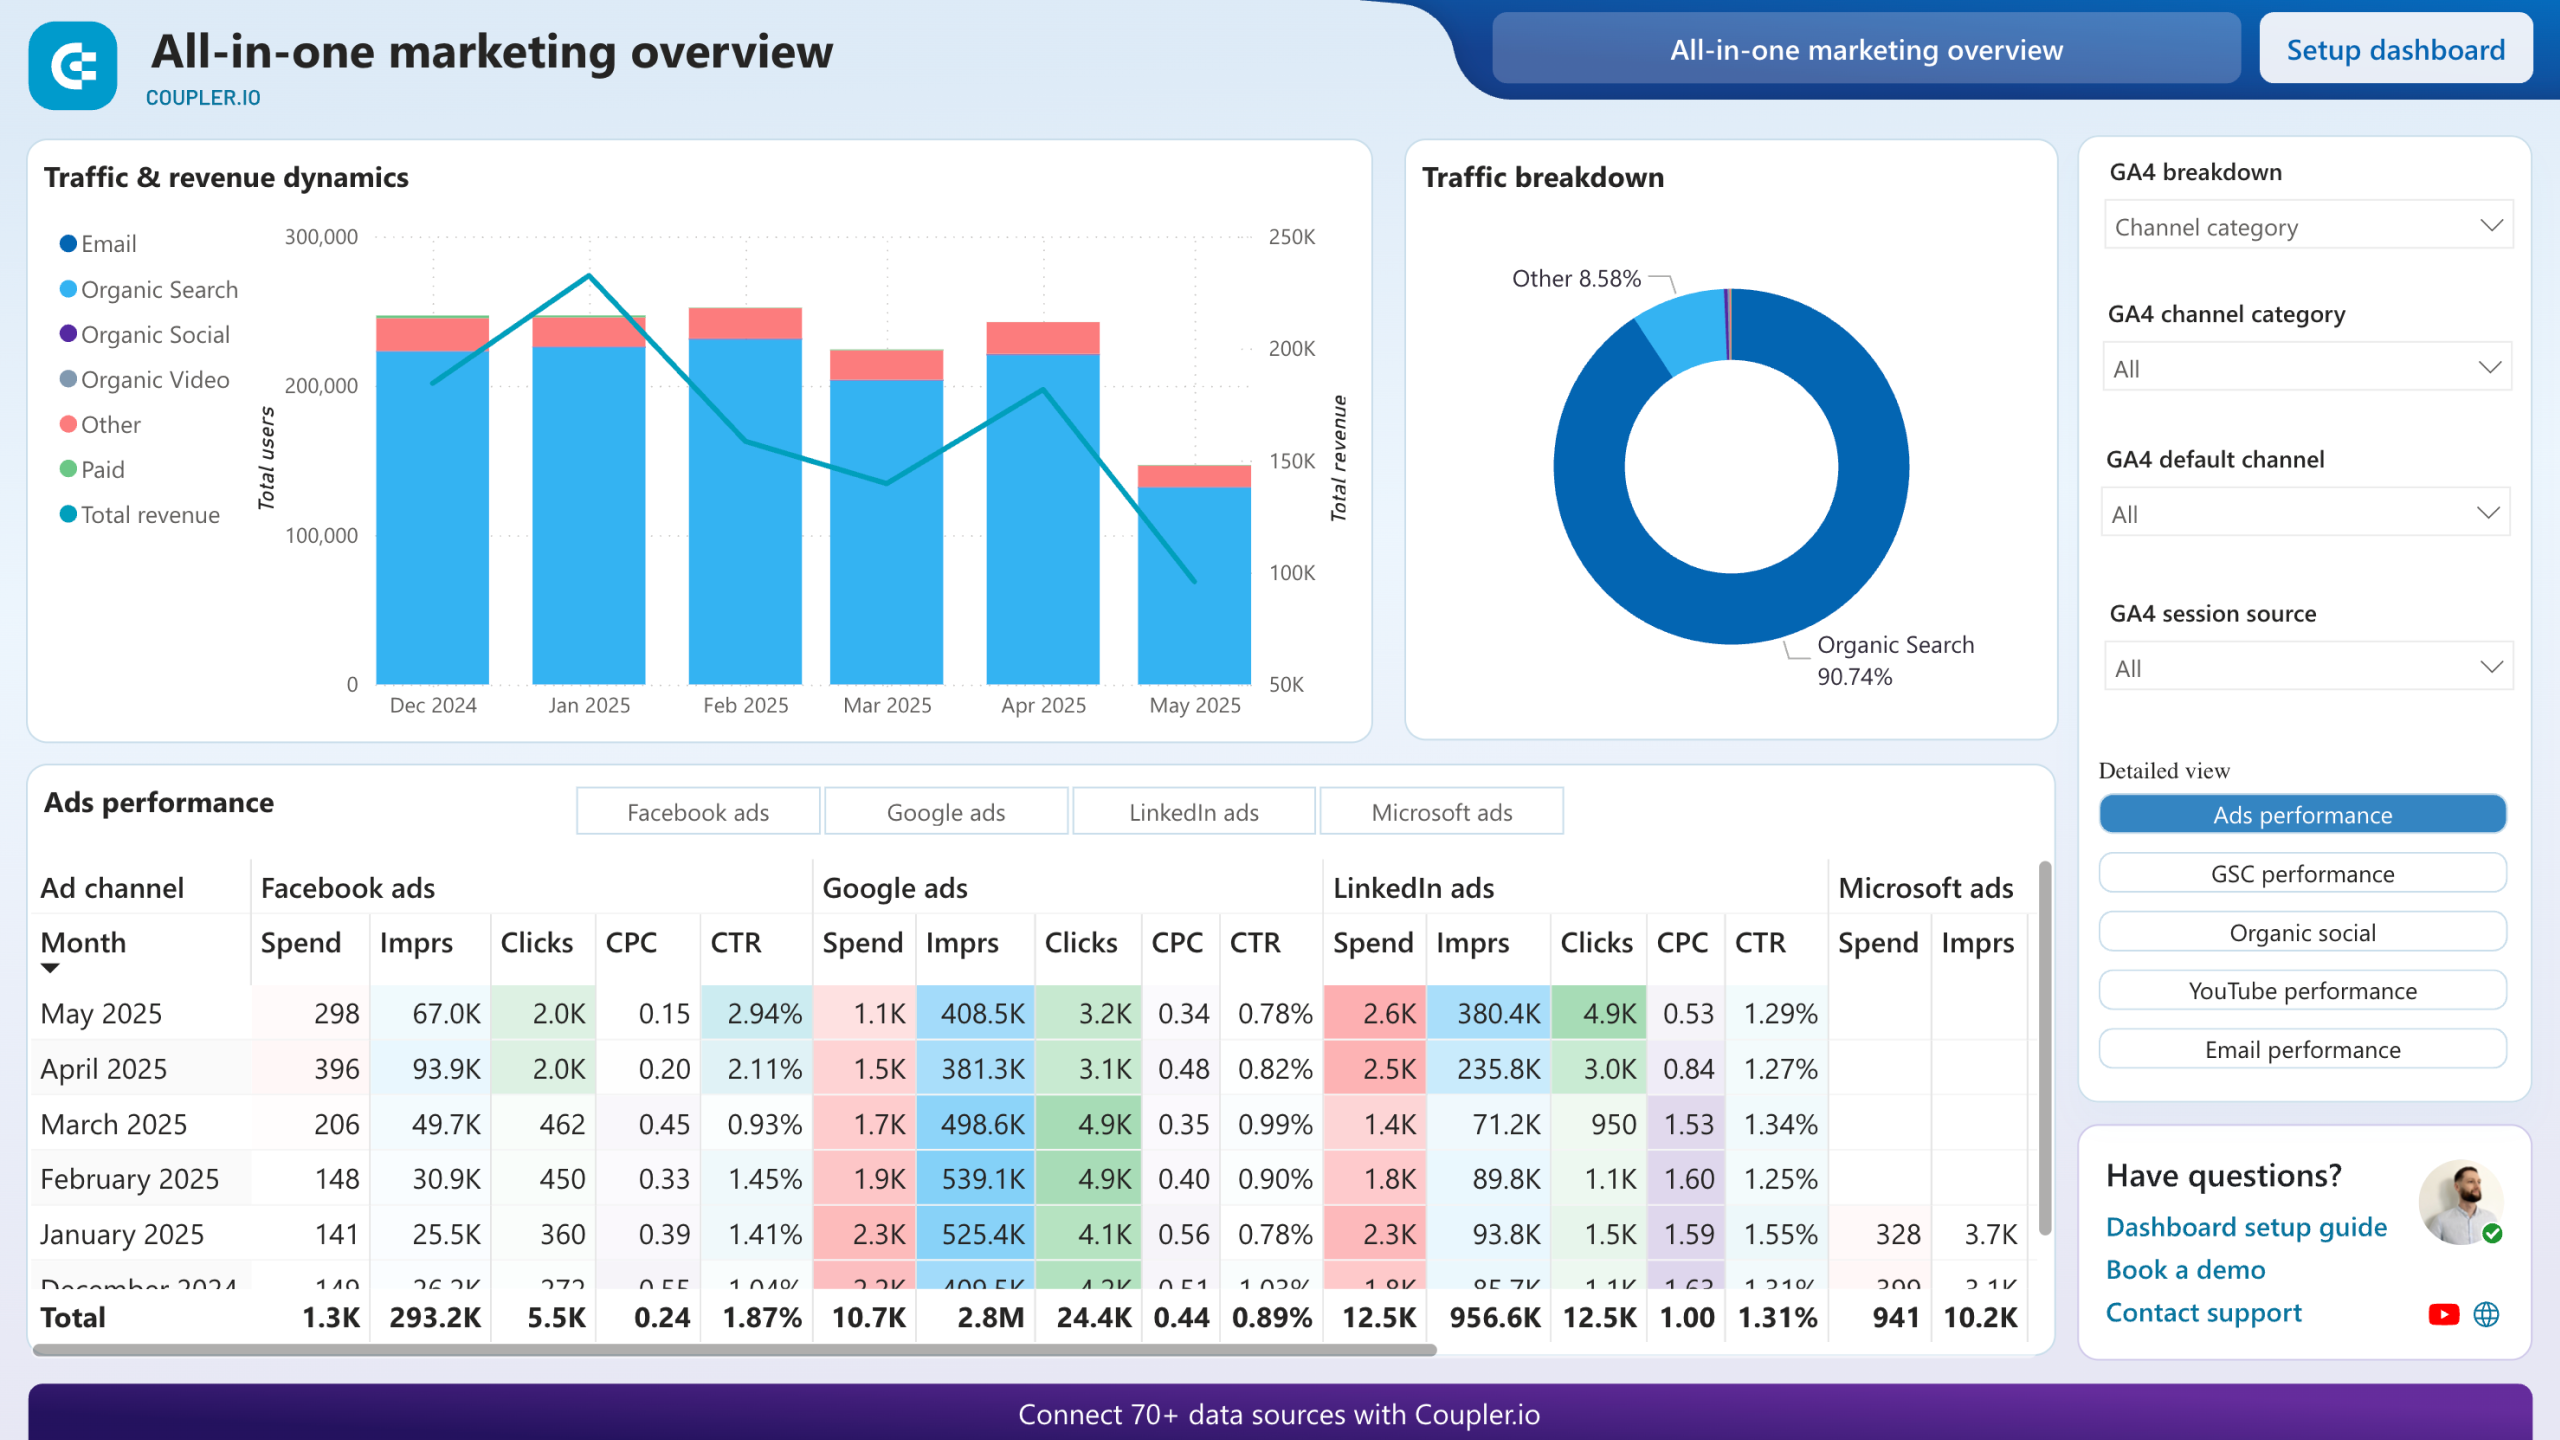
This all-in-one marketing dashboard provides a holistic view of your marketing performance across different channels. It collects data from Instagram, GA4, Google Search Console, YouTube, email tools, and other advertising platforms and social media apps. This allows you to track the performance of paid ads, organic search, social media, or email campaigns in a single interface.
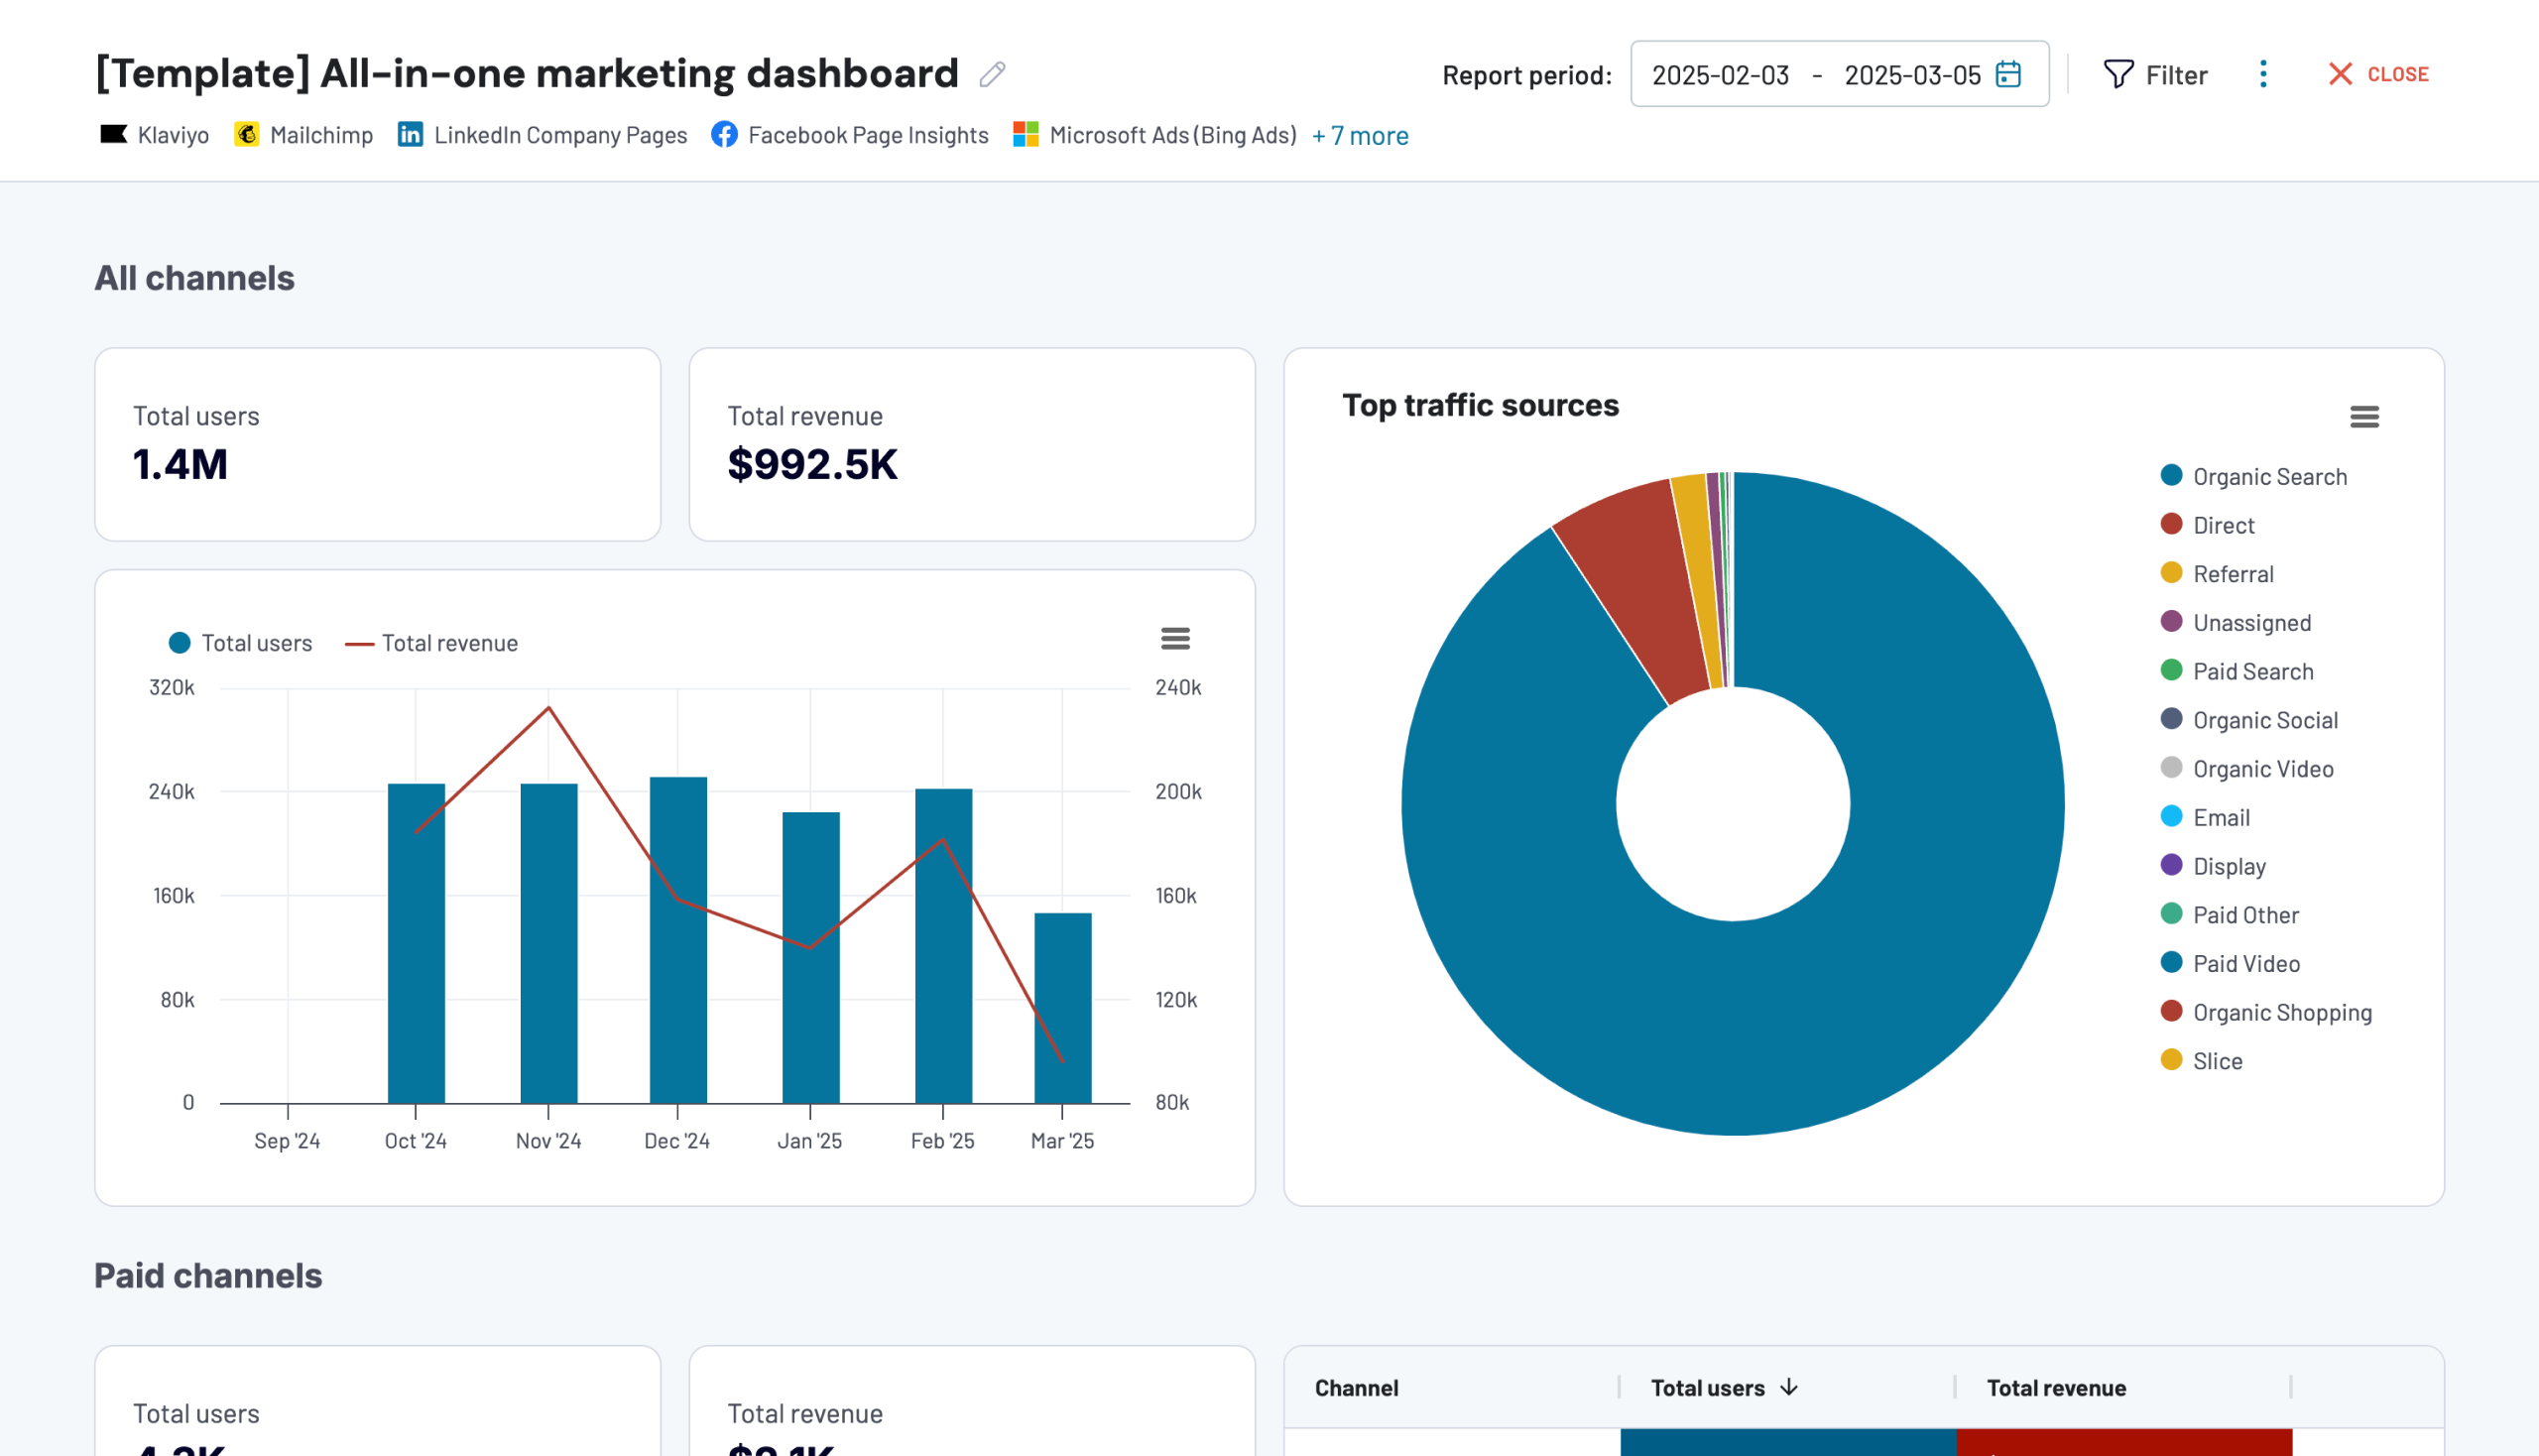
More specifically, you can track trends and your PPC marketing through key metrics like amount spend, impressions, clicks, cost per click, and click-through rate. The ads performance table shows monthly performance for all paid channels, but you can filter by platform for more granular insights.
You can get this dashboard in the Coupler.io UI or as a Looker Studio or Power BI template for free. It’s also possible to set up regular data refreshes on a schedule of your choosing.


Meta Ads creatives dashboard template
The Meta Ads creatives dashboard provides an overview of your ad creatives’ performance on Facebook and Instagram. It helps you identify inefficient campaigns, cost-management issues, and opportunities to maximise engagement and ROI.
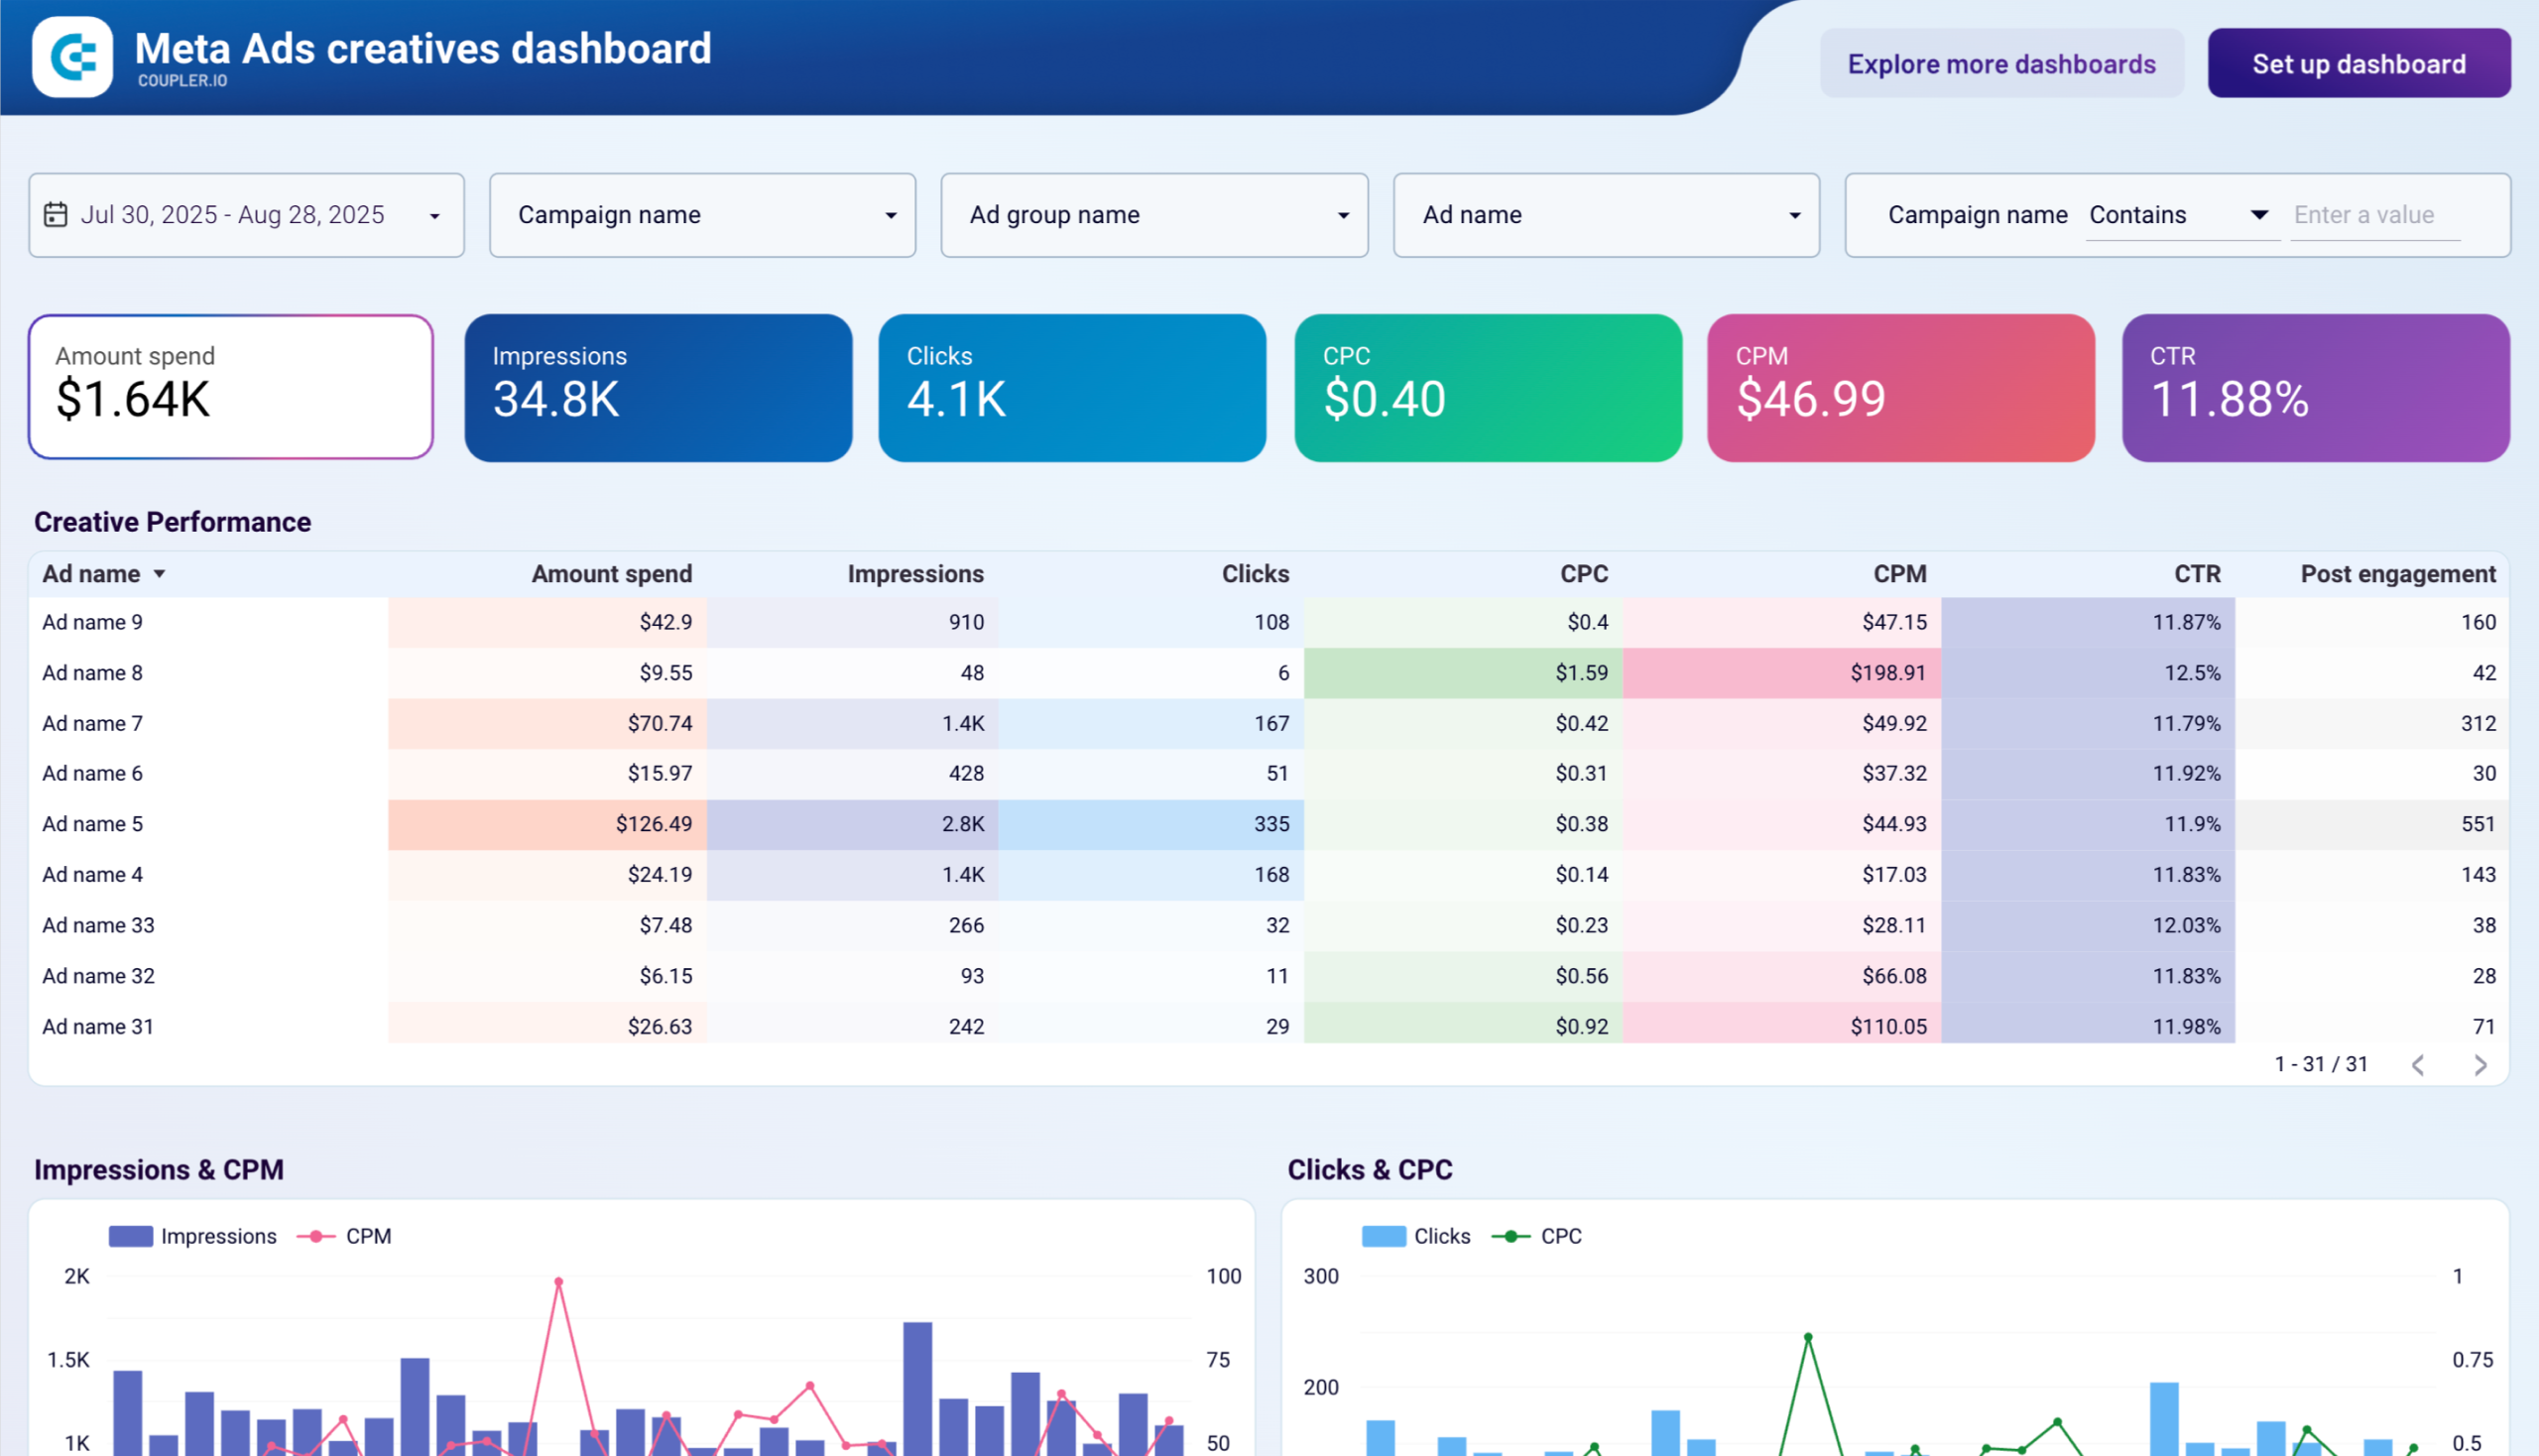
A table visualization allows you to track performance of ad creatives across several metrics, such as CTR, CPM, CPC, conversions, and total spend. This allows you to make data-driven decisions about which campaigns to prioritize or refine.
Meanwhile, interactive charts let you compare the cost-efficiency of impressions and clicks for the past month. These are useful for spotting audience engagement patterns or anomalies in budget spend. The spend dynamics chart is handy for monitoring budget utilization and goal alignment.
It only takes a few minutes to visualize this template with your own data from Meta. It’s available in Looker Studio with a free Coupler.io account.
Create a custom Instagram Ads analytics report with Coupler.io
Do you need a solution more tailored than the templates? Let’s see how you can use a tool like Coupler.io to automate all the hard work and easily track Instagram Ads analytics with a custom dashboard.
As a brief reminder, Coupler.io is a reporting automation and marketing analytics tool that simplifies marketing reporting, including for Instagram Ads. You can export Instagram Insights and other data from 60+ sources and create cross-channel reports. Use dashboard templates (like the ones above) or create custom dashboards in your favorite BI tool (Looker Studio, Tableau, etc.) to track and analyze your ads data in one place.
To get started, select the destination app for your report in the form below and click Proceed. For example, you can load data from Instagram Ads to Looker Studio.
1. Connect your accounts and configure your report preferences
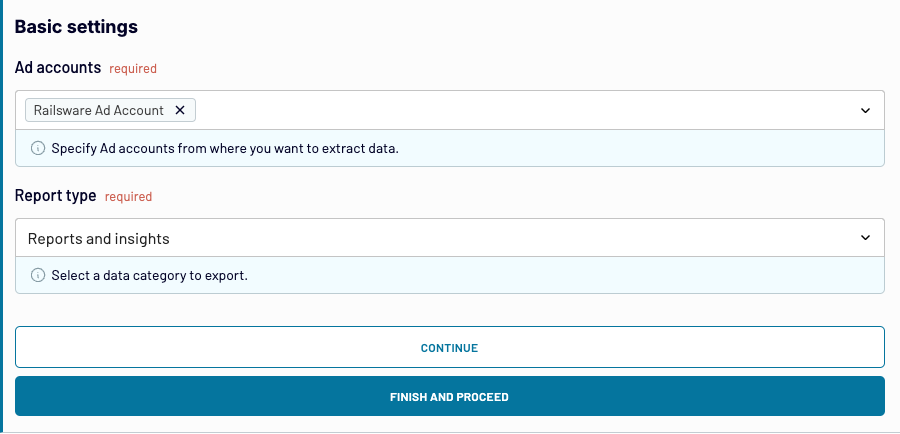
On the next page, you will have to connect your Instagram ads account. Under Basic Settings, choose your preferred ads account and report type (Reports and Insights is the most comprehensive).
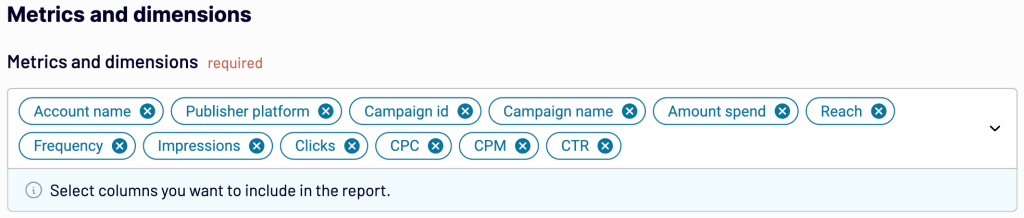
You can also configure the report scope and metrics and dimensions at the next step. For example, you may want to exclude certain metrics that aren’t vital to your recent campaigns (e.g. reach) or make the report period longer than 60 days.
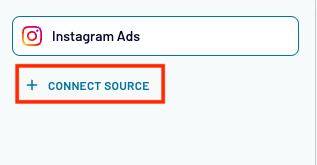
Remember you can combine and transform data from other platforms too. This step is optional, but if you want to understand how your campaign is performing on Instagram vs. Facebook, this can help.
To add another source, go to the left-hand panel, click Connect Source, and follow the steps.
Now click Finish and Proceed and your data will be exported automatically. Click Transformations to move on to the next step.
2. Organize and transform your data
At this stage, you can refine how data from one or more accounts will be presented in the final report. For example, if you chose 2 sources with similar dimensions, metrics, and campaign names (e.g. Instagram ads and Facebook ads) you can use the Append function to seamlessly join the datasets. This ensures a cohesive and readable report.

If you want to organize your data further, then you can filter, sort, and hide or rearrange columns for each individual source.
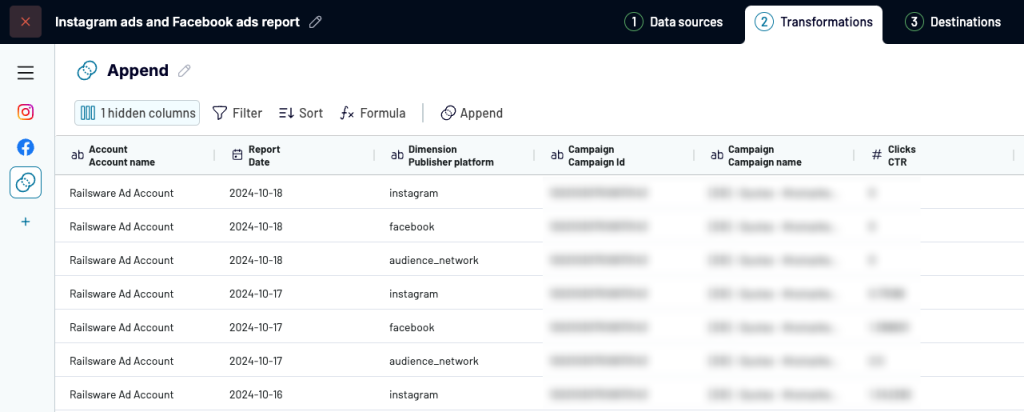
When you are done making changes, click Destinations to proceed.
3. Load data and schedule automated data refreshes
At the next step, select Append from the Data to Share dropdown. Then, follow the instructions to load your data to the selected BI tool or spreadsheet.
Finally, return to the Coupler.io interface and proceed to Set up a schedule. This will ensure the data in your report updates on a regular basis. Choose your preferred days of the week, timezone, hours, and interval (as often as every 15 minutes).
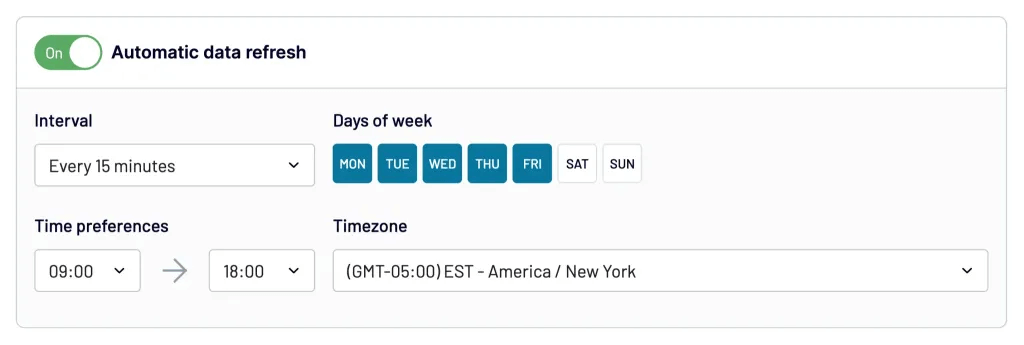
After scheduling is done, click Save and run Importer. The very last step is to create graphs and other visualizations in your report in Looker Studio, Power BI, or another app. The precise layout will be totally up to you. And you’re all set. The whole process can be completed in a few minutes.
Important Instagram Ads KPIs to track campaign performance
We’ve covered different ways to track your Instagram Ads analytics and create insightful and actionable reports.
To avoid getting lost in a sea of data, let’s review the key metrics you should be tracking to properly analyze Instagram Ads.
Impressions
Impressions measure how often your Instagram Ads are displayed in front of a user. Instagram Impressions directly correlate with your audience size and budget. With a larger ad spent, your impressions will be higher as the algorithm will deliver the ad more often to try to reach the ad objective. Same for your audience size.
The only thing to remember is that if one user sees your ad multiple times, it will count as an impression every time.
This leads us to “reach”, which is a similar metric to impressions.
Reach
Reach measures the unique number of users your ads have been displayed to. In other words, how many unique users have your campaigns reached?
Reach and impressions are often confused as they are quite similar. Here’s a quick way to understand the difference:
If you see one ad five times, that would be counted as five impressions, while reach would be one.
Click-through rate (CTR)
Click-through rate, CTR for short, is a metric that counts the percentage of users that clicked on your ad after seeing it.
CTR is a good indicator of how well your message resonated with your targeted audience. A high CTR means your ad was highly relevant for the people it reached, or a compelling element made them check out your offer.
Following Instagram Ads best practices will help you maximize your CTR and, ultimately, conversions.
To calculate CTR, divide the total number of clicks by impressions.
Cost per click (CPC)
The cost per click, CPC for short, is a metric that measures how much you have to pay for a click. The lower your CPC is, the better.
A high CPC means that not enough people are clicking on your ad for several reasons. These could be that you are targeting the wrong audience, your visuals need more work, or your offer is not attractive enough.
To calculate the cost per click, divide the total cost of your Instagram Ads by the number of clicks.
Cost per mile (CPM)
Similar to CPC, the CPM metric measures the cost per 1,000 impressions.
When setting up Instagram Ads, depending on your objective, you can choose to pay either per click (CPC) or based on the number of impressions (CPM).
When you are trying to generate awareness of your brand or drive video views, this option can be beneficial as you are not looking to drive specific conversions on your website. The downside of using CPM is that the Instagram algorithm will optimize displaying your ads in order to maximize your goal. In the case of awareness, you might end up generating a lot of impressions for the same users and paying for it.
To calculate CPM in Instagram, divide the spend by impressions, then multiply the result by 1000.
Custom conversion
Custom conversion is an important metric that tracks the number of people who converted after engaging with your Instagram ad.
There can be different types of conversions based on your ad objective. While you might have different campaigns running in parallel, each will focus on one specific conversion goal using a clear call to action.
You can track people who converted to customers on your website, the number of leads generated, e-book downloads, app installs, etc.
Cost per conversion
Cost per conversion measures how much you have to pay for one conversion generated by your Instagram Ad.
The lower the number, the better. You will always want to look at optimizing your campaigns in order to minimize this cost.
To calculate cost per conversion, divide your total Instagram ad spent by the number of conversions they generated.
Return on ad spend (ROAS)
The return on ad spend (ROAS) metric measures the return on investment for your Instagram Ads. In other words, it tells you how profitable your campaigns are in a specific timeframe.
To calculate ROAS, divide the total revenue your campaigns have generated by the total ad spend that led to conversions.
A positive ROAS means that your Instagram Ads are successful in generating more revenue than what they cost.
If your ROAS is negative, this means you should look at your Instagram Ads analytics and tweak them as they are costing you more money than they are generating for your business.
Why should you track Instagram Ads metrics?
For every marketing campaign, tracking analytics is crucial. Otherwise, how would you know whether you are achieving your goals?
The same applies to Instagram marketing campaigns. Here are the top three benefits of tracking your Instagram Ads performance consistently:
- Get an accurate view of how your budget is spent. Every paid campaign can easily go off track and spend your budget without delivering the desired results. Keeping an eye on how the budget is spent across different campaigns can show you which one is worth investing in further.
- Understand the best-performing campaign type. Like tracking budget spend, looking at performance metrics across different Instagram campaigns will help you understand which is driving the best conversion rate. Spot trends in your data and learn what type of content your target audience resonates with. For example, are your video ads performing better than Carousel ads? Analyze Instagram Ads and get these insights so you can optimize your content strategy.
- Optimize campaigns based on real data: Each Instagram ad campaign has specific goals. For example, drive engagement, increase the number of Instagram followers, or generate conversions. As you collect more data, you’ll be able to benchmark what a good CTR or ROAS is for a specific campaign type. By monitoring key metrics while your campaigns are running, you can get an in-depth understanding of what you should be optimizing.
Additionally, don’t forget that an ad’s performance is closely tied to the quality of the content posted. There are several free online tools that can assist you to create a flyer, add text to an image, edit a video or photo, and boost the metrics of your ads. You can also use insights from first-party product data to make targeted campaign optimizations.
The choice of Instagram Ads analytics tools: native or custom
By now, you should be familiar with the various ways of reporting on and analyzing your Instagram Ads. In case you are still unsure about which path to take, let’s revisit the key differences between the native methods (Instagram Insights, Facebook (Meta) Ads Manager) and the customized approaches – dashboard templates or reports built from scratch.
| Factor | Native methods | Dashboard templates | Custom-built reports |
| Visualization options | Limited to pivot tables, trend, or bar charts. | Varied, including pie charts, drill-down tables, scorecards, etc. | Fully configurable according to your needs |
| Level of reporting customization | None | You can choose a format that best suits your needs | Can be 100% customized based on your preference |
| Real-time data refresh | Potential delays of a few hours or even a day if you have lots of ads | As frequently as every 15 minutes with Coupler.io | As frequently as every 15 minutes with Coupler.io |
| Opportunity for cross-channel analysis | No, limited to Instagram and Facebook | Yes, for multiple channels: Facebook, LinkedIn, Google, etc. | Yes, based on your preference |
| Ease of use | Easy, although can become overwhelming and difficult to track multiple campaigns | Easy, take less than 5 minutes to set up | Moderate. More complex setup but you have control over the design |
In summary, if you have just started dipping your feet into the world of paid advertising, using native tools like Facebook Ads Manager is a good solution for tracking your ad performance.
However, professional PPC managers and marketers who need to track several campaigns and closely monitor their metrics should use a tool for automating reporting.
Feel free to try one of Coupler.io’s dashboard templates for PPC and social media analytics. Of course, if you need a more sophisticated reporting solution, you can also build your own dashboard using Coupler.io’s connector or reach out to our team for help. Ready to get started?

Automate Instagram Ads analytics and reporting with Coupler.io
Get started for free