How to Connect LinkedIn Company Pages to Google Sheets or Excel

LinkedIn’s native Company Page analytics fall short when it comes to conducting in-depth performance analysis, creating custom reports, or combining data from other pages or platforms. Instead, exporting your data to external tools (like spreadsheet apps) is often the best option.
In this tutorial, you’ll learn how to connect your LinkedIn Company Pages data to your preferred spreadsheets application: Google Sheets or Microsoft Excel. We’ll explore the different methods for exporting data, the benefits of add-ons, and how dashboard templates can help you save time on LinkedIn performance analysis.
Methods to connect LinkedIn Company Pages to Google Sheets or Excel
There are 3 main ways to connect LinkedIn data to your spreadsheet app:
- No-code connector with Coupler.io. Third-party connectors, such as Coupler.io, provide a quick and sophisticated way to transfer data from LinkedIn to spreadsheets. You can connect your accounts in just a few clicks, automate exports on a customizable schedule, and take advantage of prebuilt dashboard templates. Best of all, you don’t need any coding knowledge to get started.
- Custom API integration. Building a custom data integration (with Google Apps Script or Power Query API) is an alternative to using a third-party connector. It allows you to tailor the data extraction to your exact requirements and create custom refresh schedules. That said, you will need technical skills – or the help of a developer – to set it up and keep everything running smoothly.
- Manual export. A straightforward way to connect your data is to manually export XLS files from LinkedIn and upload them to your spreadsheet app. The process is simple and only takes a few clicks. However, it’s not convenient if you want the data in your spreadsheet to be consistently fresh. You’ll have to repeat the export from LinkedIn every time you need updated information, which can be tedious and prone to errors.
Method 1: Quickly connect LinkedIn Company Pages to Google Sheets or Excel with Coupler.io
Coupler.io is a reporting automation tool that enables you to connect data from over 60 sources to spreadsheet apps, BI platforms, and data warehouses. You can export data from your LinkedIn accounts in minutes and establish a flow for automatic updates. This ensures you have round-the-clock access to fresh LinkedIn Company Pages data in your spreadsheet app!
To begin the export, select your preferred destination from the interactive form below: Google Sheets or Excel. You’ll be prompted to set up a free account and create your LinkedIn data connection.
1. Extract your LinkedIn Company Pages data
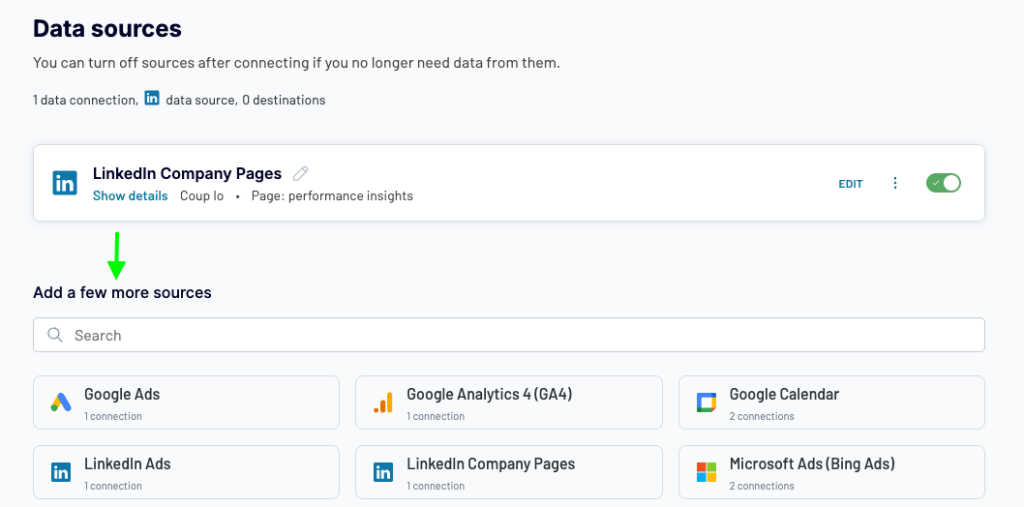
You’ll first need to connect your LinkedIn source account and configure the details of your data export. We’ll walk you through these steps below:
Don’t forget that with Coupler.io, you can connect multiple data sources simultaneously and consolidate them into a single export. This is useful when you want to combine different types of Company Page data – such as Visitors, Followers, and Content – or connect insights from other social media apps, CRMs, or sales platforms. Simply add more sources before proceeding to the Transformations stage.
2. Transform and organize your data
Here’s where you can review the data that will appear in your spreadsheet report and make strategic changes before export. Click through the options for an overview of the key data organization techniques:
FYI: If you added more than one LinkedIn Company Page source in the first step, you can use the Join function to consolidate this data for export. In the example below, we joined Visitors and Followers data:
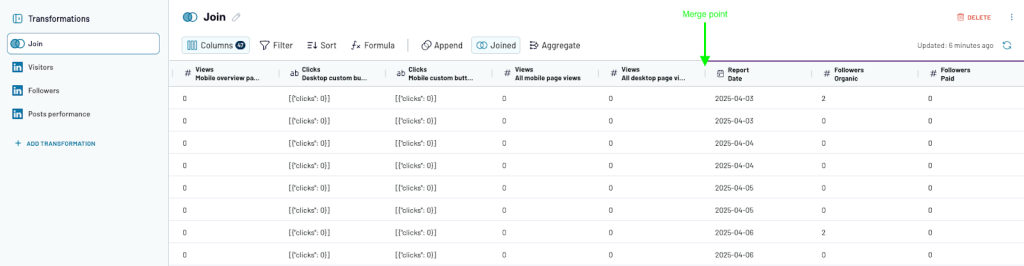
Once you’re satisfied with the preview (and any changes), click Destinations to finalize your spreadsheet app connection.
3. Load data to Google Sheets or Excel and schedule updates
Lastly, follow the steps below to import your LinkedIn Company Pages data to your spreadsheet app.
The entire process should only take a few minutes to complete. After that, your spreadsheet data will update automatically, and you can design reports to simplify your analysis of LinkedIn performance.
Shortcut: Coupler.io add-in/on for Google Sheets and Excel
What if I told you there’s a simpler way to complete the above steps without needing to open the Coupler.io app? The dedicated Coupler.io add-in/on for Google Sheets and Excel saves you from having to switch between tabs – everything happens in your spreadsheet tool. Let’s go through the installation process:
Coupler.io add-on for Google Sheets
- Open the spreadsheet where you plan to connect your LinkedIn data.
- Click Extensions in the navigation bar ? Add-ons ? Get add-on.
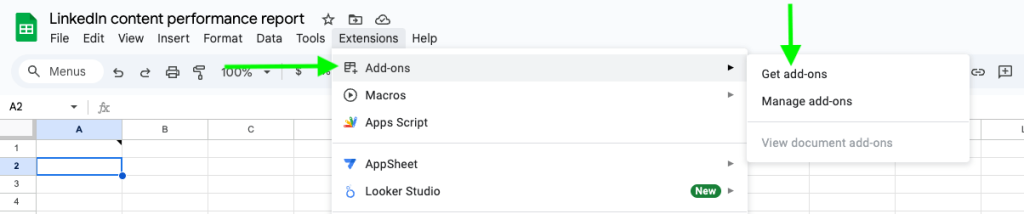
- Search for Coupler.io in the Google Workspace Marketplace and click Install.
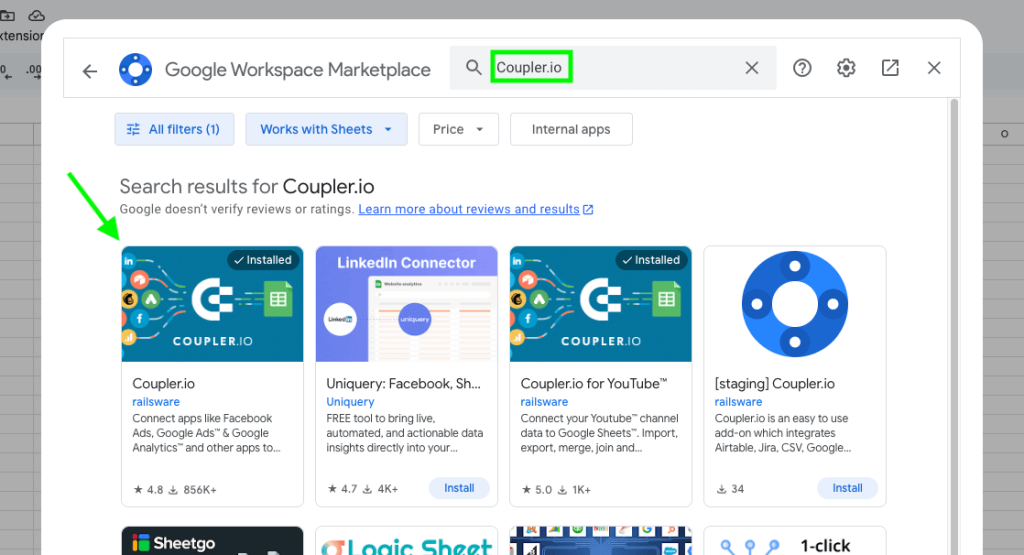
- Launch the add-on and sign up for a free Coupler.io account.
- In the add-on bar on the right side of your spreadsheet, click Add to start creating a data flow.
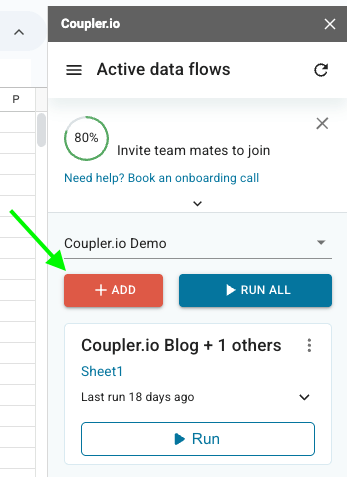
- Follow the steps in the pop-up window to connect your LinkedIn Company Pages and finalize the data export to your Google Sheet.
Coupler.io add-in for Excel
- Open your workbook where you plan to import your LinkedIn data.
- Under Home, click Add-ins and search for Coupler.io in the marketplace.
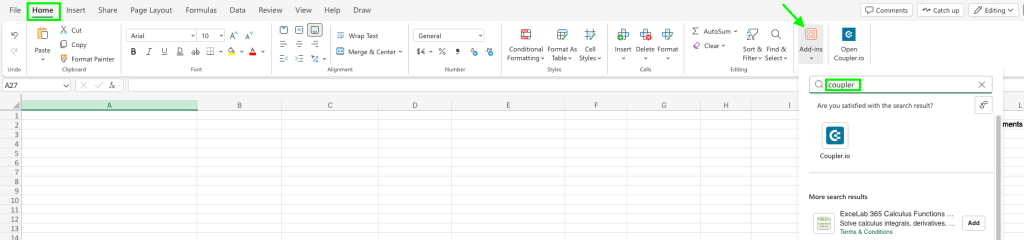
- Click Add to install it. Once launched, you’ll see the app appear on the right side of your screen.
- Sign up for a free Coupler.io account, then click Add New to start the data flow creation process.
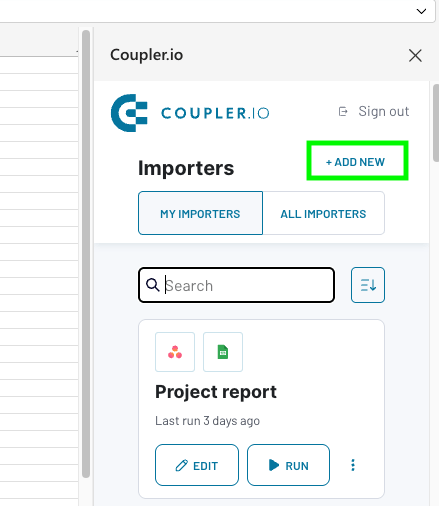
- Follow the steps in the pop-up window to complete the connection of your LinkedIn Company Pages to Excel.
Method 2: Custom integration with Google Apps Script or Power Query
The key benefit of using Coupler.io is that it enables you to connect your LinkedIn data to spreadsheet apps without any coding. You get access to a ready-made API through a no-code interface, eliminating the need for technical support or development work.
Alternatively, some users prefer to create their own API integration between LinkedIn and Google Sheets or Excel. This option typically gives you more control over the connection setup and data flow automation. For example, it may be possible to customize refresh schedules to your liking (faster than every 15 minutes) or tailor data filtering to your needs.
Here’s the catch: building a custom integration requires coding expertise or help from a developer. You’ll need to be comfortable working with Google Apps Script (for Google Sheets) or Power Query (for Excel). Most importantly, LinkedIn API access requires approval through their developer portal, which is a lengthy process with no guarantee of acceptance.
All in all, this approach has some pretty significant limitations:
- Setting it up is time-consuming, taking a minimum of a few days.
- You will need the assistance of a developer or a dev team to configure the integration and maintain it over time.
- LinkedIn API access is notoriously restrictive. You’ll have to fill out request forms and verify your company page.
- It’s complex and not worth the effort when you only need to export basic LinkedIn company data to a spreadsheet regularly.
That’s why Coupler.io is better suited for non-technical teams. Or anyone who wants to save hours on LinkedIn data exports in general ?
Method 3: Manually export data from LinkedIn Company Pages to Google Sheets or Excel
Another way to connect your Company Page data to a spreadsheet is to export XLS files from the LinkedIn app. Depending on the amount of data you need to export, this process can be brief and straightforward, or lengthy and repetitive. In any case, it’s not ideal when you need fresh data in your reports on demand.
If you do decide to go the manual route, follow these steps:
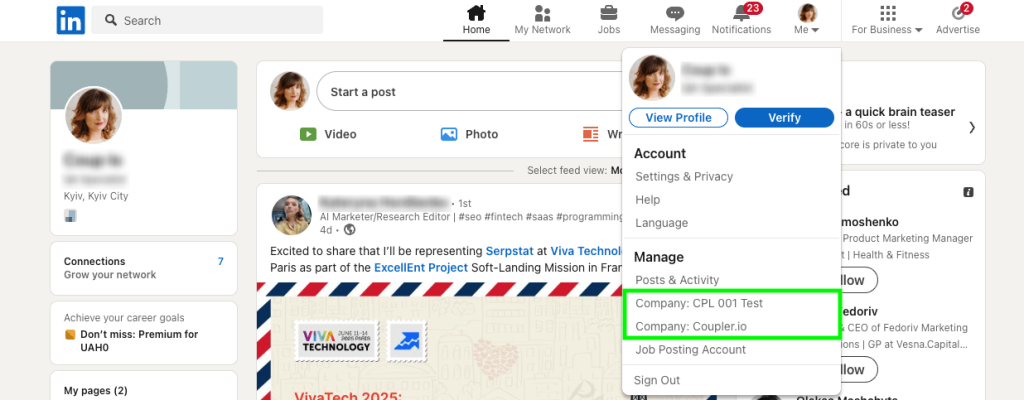
- Open LinkedIn and click on the profile button (‘Me’) in the main navigation bar.
- Under Manage in the drop-down menu, select the company page you want to export data from.
- Once the page loads, you’ll notice page analytics are divided into 5 parts: Content, Visitors, Followers, Leads, and Competitors. You can’t export data for all of them in one go – an unfortunate limitation of LinkedIn. You can, however, export the data separately or choose a specific context to extract data from, such as Content.
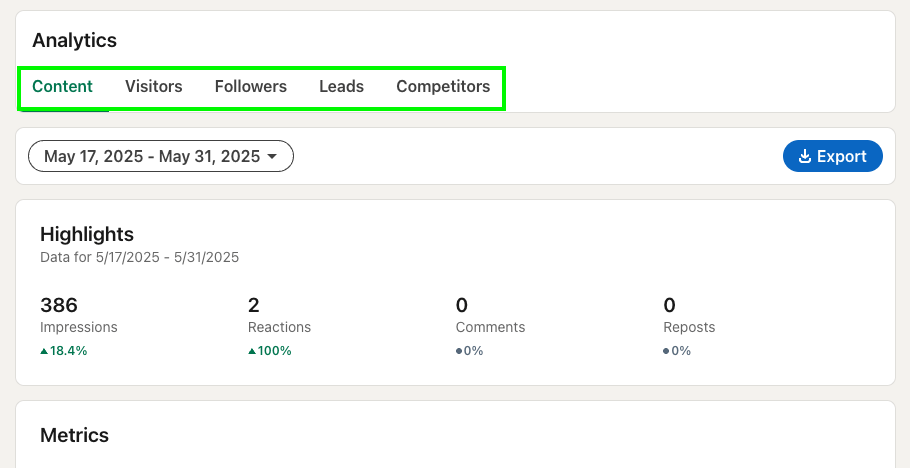
- Specify the time range for data export, such as the last 30 or 90 days. The default setting is 15 days.
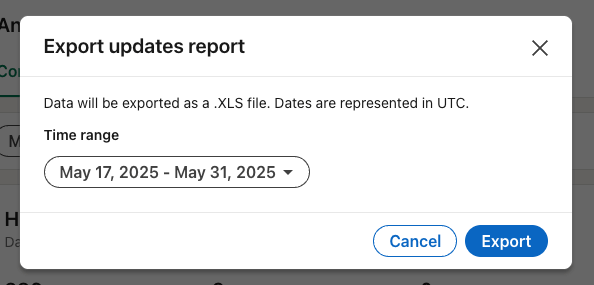
- Click Export when you’re ready. A pop-up window will appear, allowing you to tweak the time range if you haven’t done so already. Click Export again to initiate the download of the XLS file.
- Now it’s time to open your spreadsheet app and import the downloaded data. Let’s explore the individual steps for each app:
Google Sheets manual import
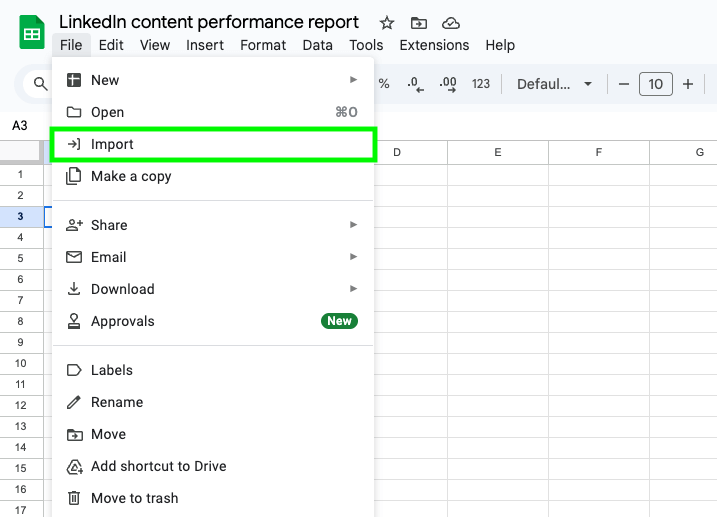
- Create or open a blank sheet in your Google Sheets interface. Under File, click Import in the drop-down menu.
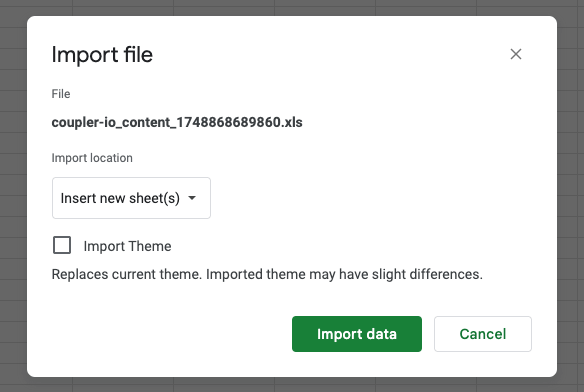
- Select and upload the XLS file from your computer.
- Confirm the import location (current sheet, new sheet, etc.) and click Import data.
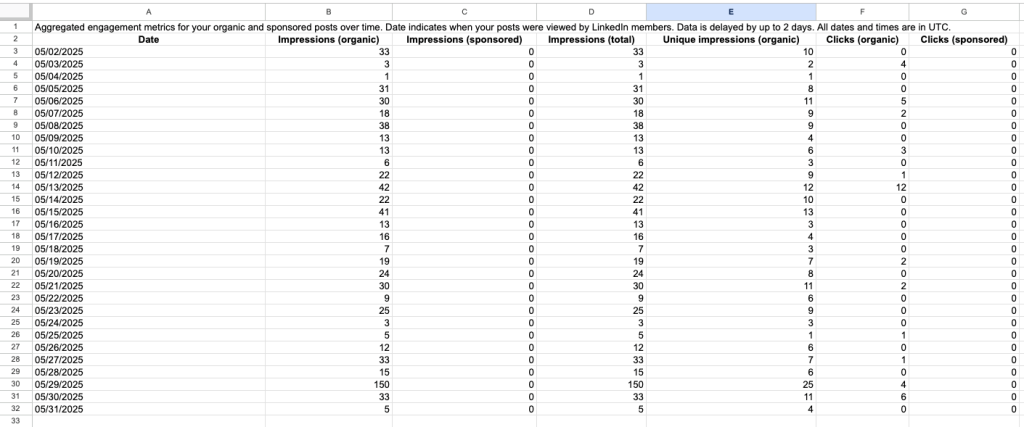
- That’s it! Your exported company page data should appear like this in the Google Sheet:
Microsoft Excel manual import
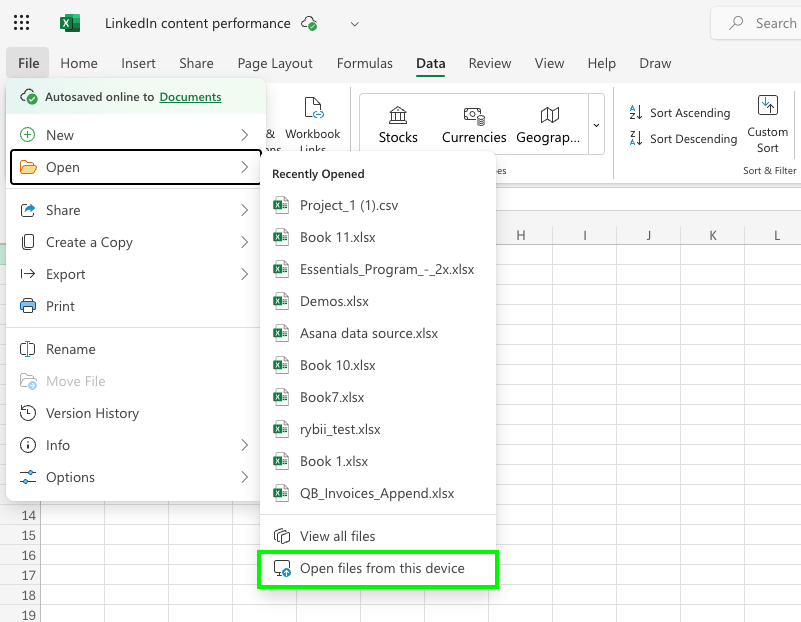
- Create or open an existing workbook, and then click File in the navigation bar.
- Hover over Open and choose the option to Open files from this device.
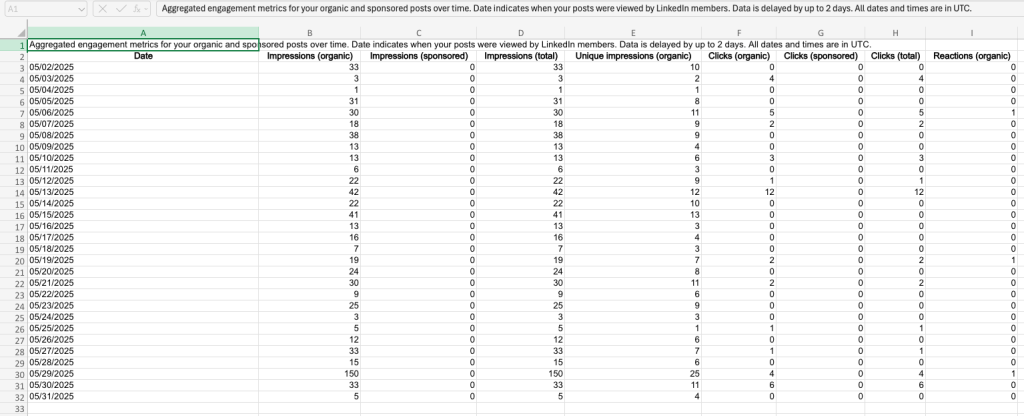
- Select the XLS file from your downloads folder and wait for it to open in your Excel interface. The imported data should look something like this:
The final step is to repeat this export process for every data type you want to analyze, such as Competitors, Followers, and Visitors.
Alternatively, you can use prebuilt dashboard templates for LinkedIn to skip the hassle and get right to analysis – more on that in the next section.
Bonus: Ready-made dashboard templates for analyzing LinkedIn Pages performance
If your end goal is to export data for analysis, dashboard templates are a flexible and convenient option. They come with pre-selected performance metrics, ready-made visualizations, and automatic data refresh schedules.
Coupler.io offers a vast range of free dashboard templates for BI tools and spreadsheets. Here’s a selection of our top picks for LinkedIn Company Page and LinkedIn Ads analysis:
LinkedIn Company Page performance dashboard in Looker Studio
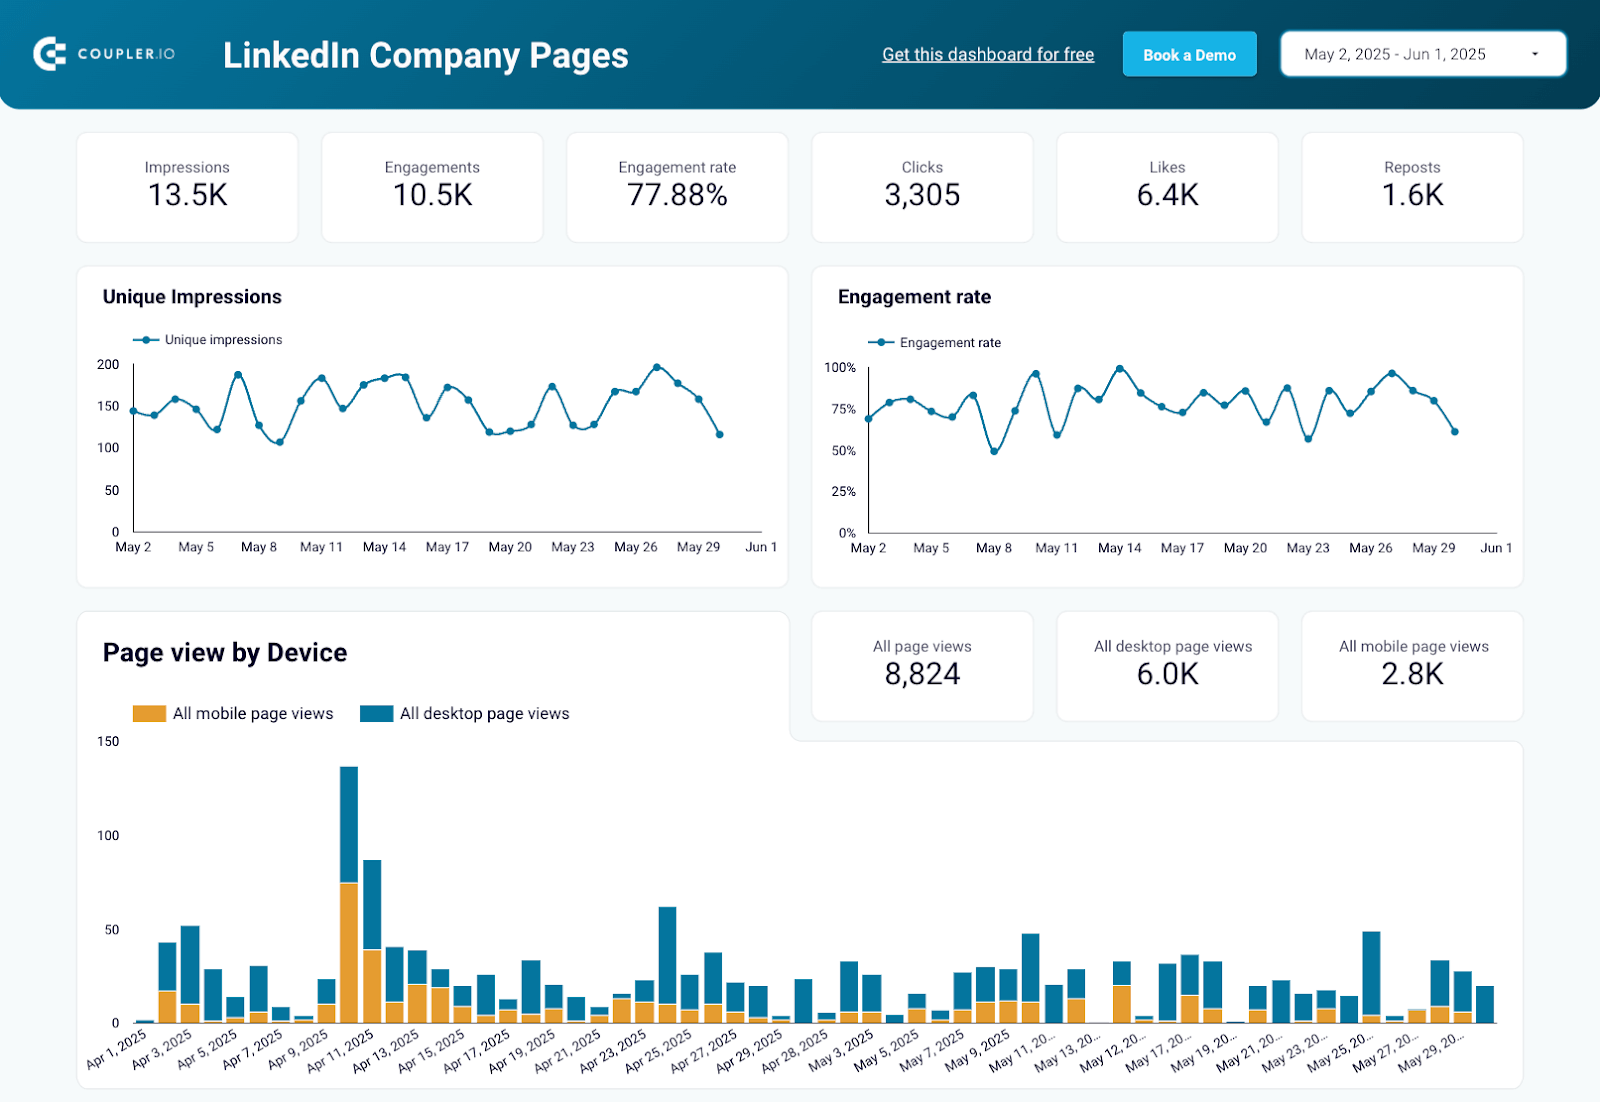
This dashboard allows you to track the performance of your company’s presence on LinkedIn. It pulls data from LinkedIn Company Pages and displays metrics, including impressions, engagements, clicks, and reposts. You can track monthly dynamics and follower growth in separate pages.
LinkedIn Company Page performance dashboard
 Preview dashboard
LinkedIn Company Page performance dashboard
Preview dashboardWhat you can do with this dashboard:
- Monitor overall performance. Keep an eye on your page’s engagement rate, number of unique impressions, and other key metrics such as likes and clicks on your company’s posts.
- Understand audience behavior. Analyze page views by device and country to determine how your audience prefers to interact with your content. Use these insights to optimize your page for local and international visitors.
- Track follower growth. Compare the number of new organic followers versus paid followers to determine which acquisition channel drives the most engagement for your company page.
- Refine targeting. Pinpoint your followers’ company size, seniority, industry, and top job function to improve the accuracy of audience targeting and boost your conversion rates.
This automated, white-label dashboard template is only available in Looker Studio. To make a copy and populate it with your LinkedIn data, simply sign up for a free Coupler.io account.
LinkedIn page and Ads analytics dashboard in Looker Studio
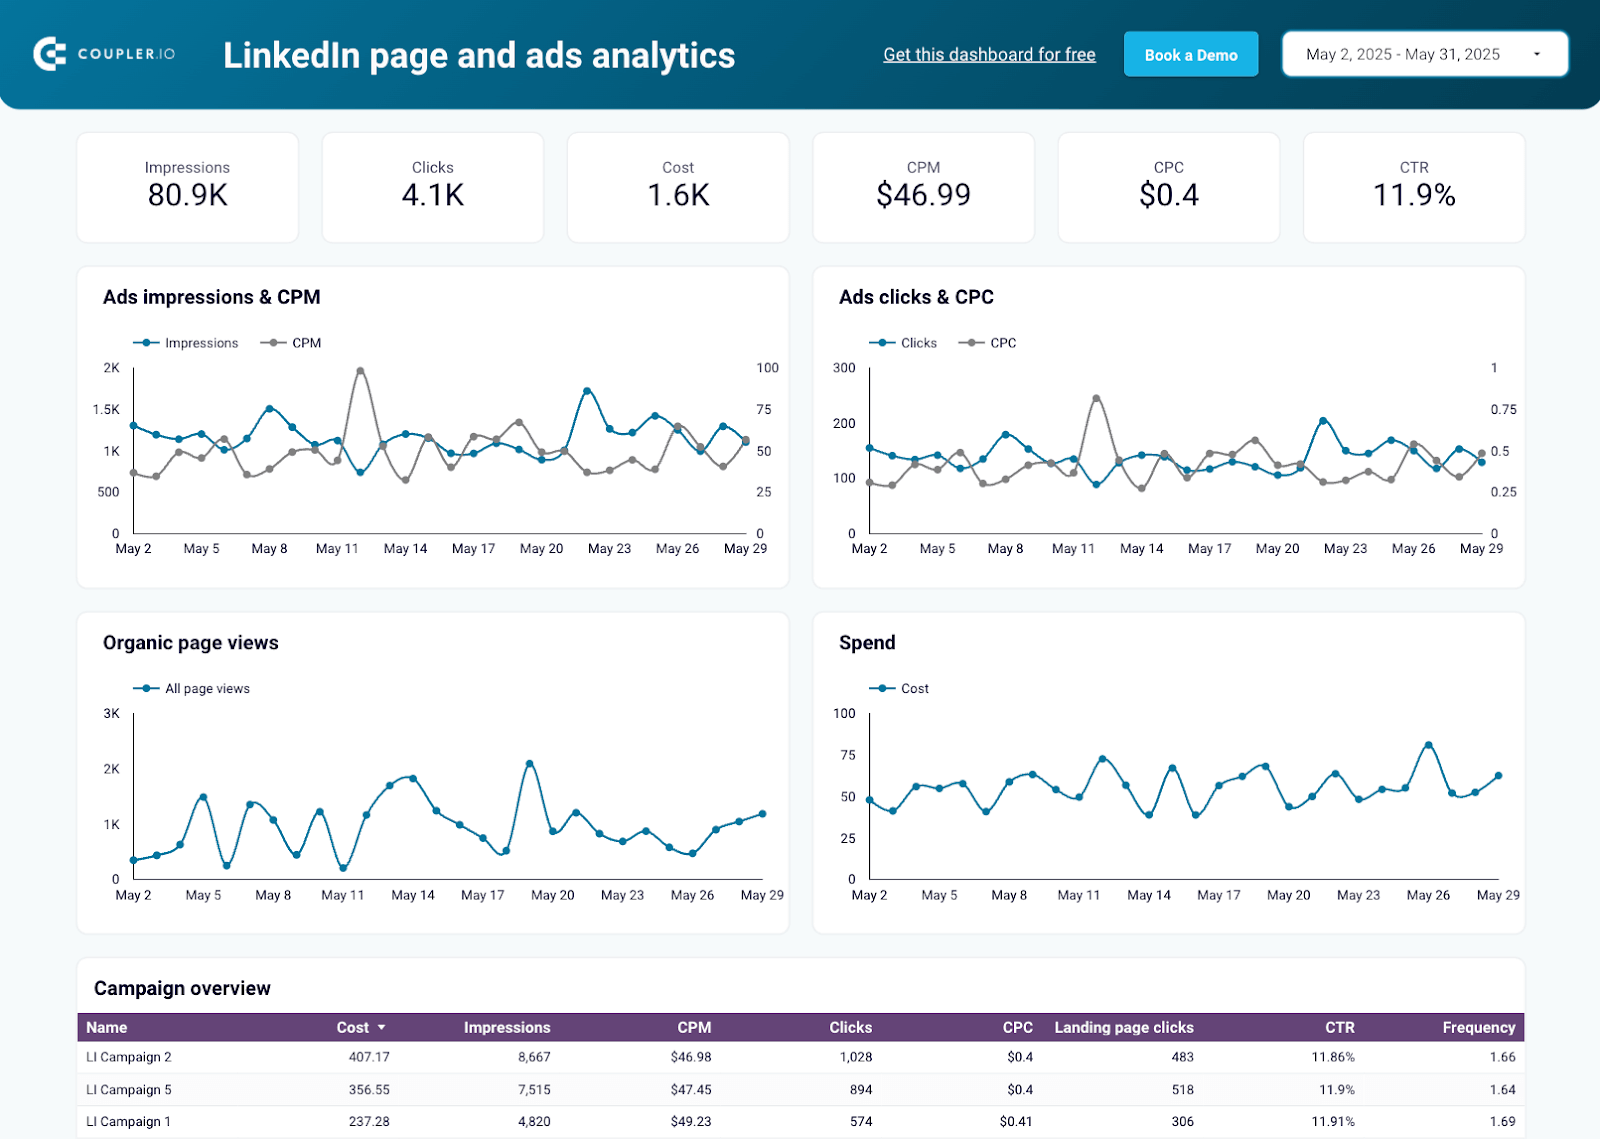
This dashboard is a handy tool for tracking your business’s organic and paid performance on LinkedIn. It combines data from LinkedIn company pages and LinkedIn Ads campaigns to provide insights into content effectiveness, spending patterns, and engagement trends.
LinkedIn page and Ads analytics dashboard
 Preview dashboard
LinkedIn page and Ads analytics dashboard
Preview dashboardWhat you can do with this dashboard:
- Monitor KPI dynamics. Keep a close eye on weekly and monthly fluctuations in key metrics, such as impressions, clicks, CPM, and page views. This is useful for assessing the impact of your content relative to spending.
- Track campaign stats. Analyze individual campaign performance in a dedicated table, where you can compare KPIs like cost, impressions, landing page clicks, and frequency.
- Better understand your global audience. Compare the geographic breakdown of ad impressions vs page views. Use this information to fine-tune audience targeting and create localized content for high-performing regions.
- Evaluate posts’ performance. Identify the LinkedIn posts that received the most engagement (likes, reposts, etc.) to understand which aspects of your content strategy are working and which require refinement.
This Looker Studio dashboard template is free to use with a Coupler.io account. You can sync your LinkedIn data in minutes and automate data refreshes on your own schedule.
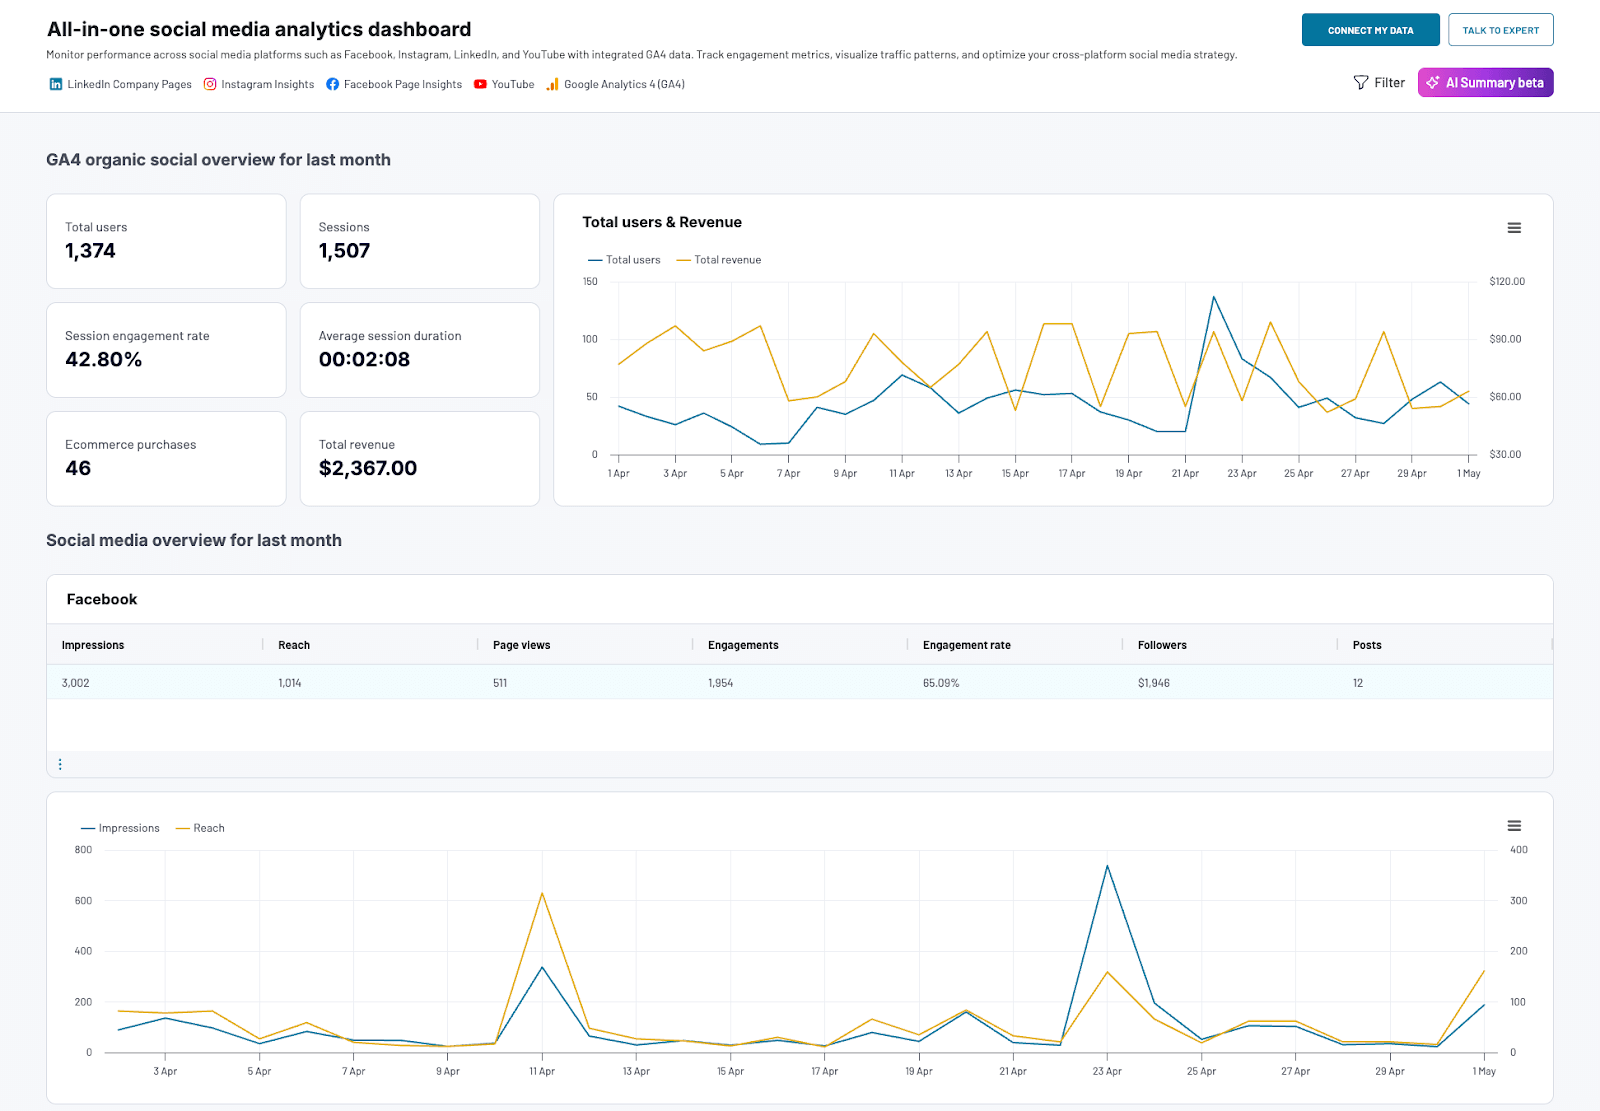
If you run organic marketing campaigns across multiple social media platforms, this dashboard enables you to analyze performance in one place. It collects data from LinkedIn Company Pages, Meta Insights, YouTube, and GA4. You can track key business metrics, such as total users and revenue, as well as KPIs for each platform, including reach, engagement, page views, and more.
All-in-one social media analytics dashboard
 Preview dashboard
All-in-one social media analytics dashboard
Preview dashboardWhat you can do with this dashboard:
- Track the business impact of campaigns. Understand how your content on LinkedIn and other platforms drives website visits, e-commerce purchases, and revenue growth.
- Analyze monthly performance. Get a monthly overview of results for each platform, including the total number of posts, average engagement rate, and the dynamics of impressions vs reach. This analysis can help you identify the strengths and weaknesses in your social marketing strategies.
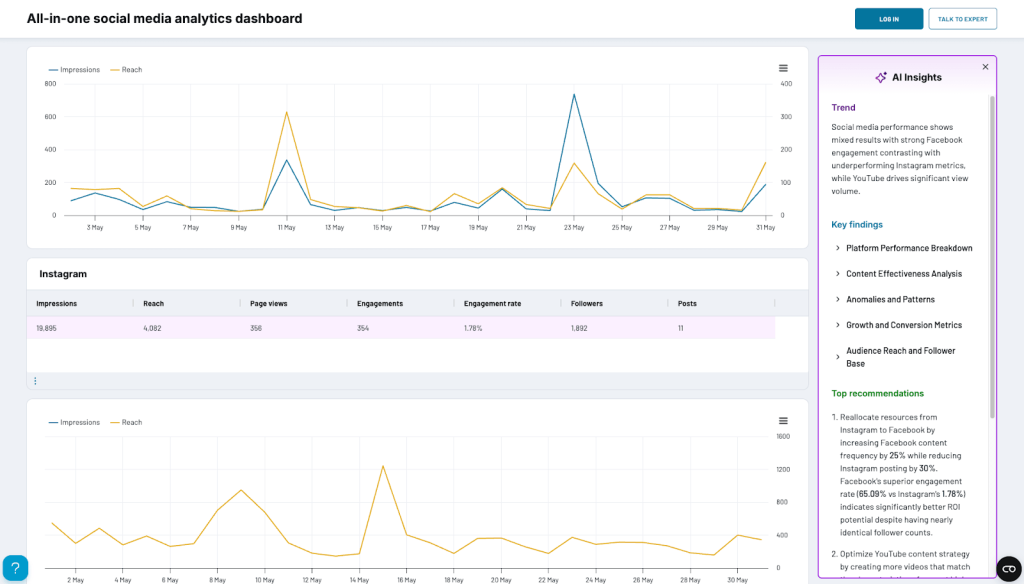
- Compare results across platforms. See which platforms attract the most followers, views, and engagements for your business. Use these insights to reprioritize your content marketing efforts and achieve more consistent results.
The dashboard also comes equipped with AI Insights for Coupler.io, an optional, AI-powered feature that summarizes the information in your dashboard. With a single click, you can get a breakdown of trends, key findings, and recommended actions. This can help you reduce analysis time and make faster marketing decisions.
Sign up for a free Coupler.io account to make a copy of this AI-powered dashboard. It only takes a few minutes to set everything up and configure automatic data updates.
LinkedIn Ads companies reach dashboard in Google Sheets
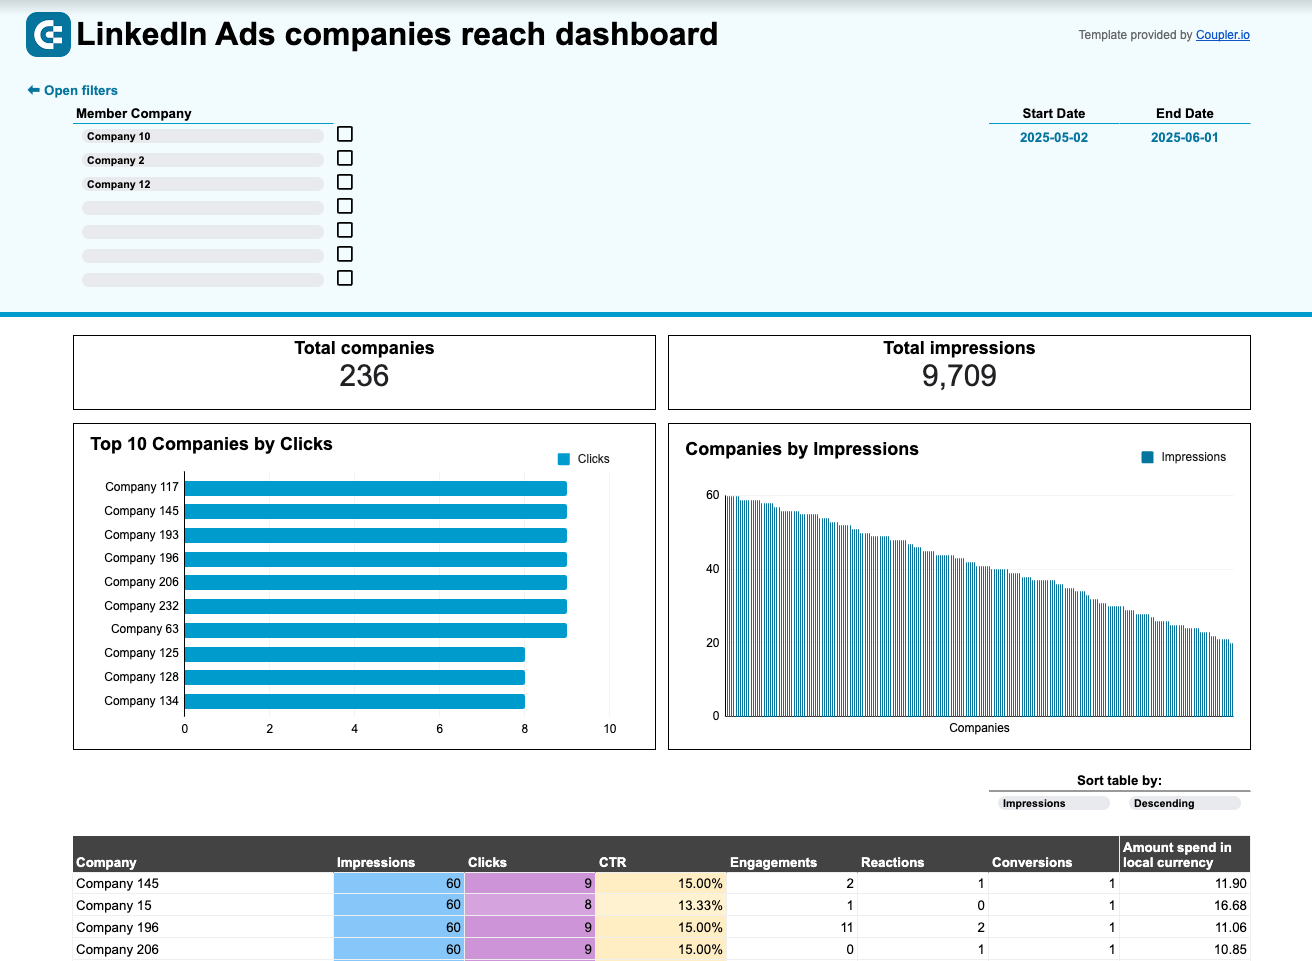
This Google Sheets dashboard gives you a complete breakdown of the companies that have been exposed to your LinkedIn Ads. It goes beyond the list of the top 50 companies provided by LinkedIn Ads analytics, allowing you to identify every single business engaging with your campaigns.
LinkedIn Ads companies reach dashboard
 Preview dashboard
LinkedIn Ads companies reach dashboard
Preview dashboardWhat you can do with this dashboard:
- Pinpoint the top 10 companies. Identify the companies that click on your LinkedIn ads the most. Use this information to personalize campaign messaging and improve targeting accuracy.
- Assess the total number of impressions each company generates to understand which organizations are most interested in your offerings.
- Analyze engagement by company. In a comprehensive table, evaluate each company’s engagement with your campaigns using metrics such as CTR, impressions, clicks, reactions, and conversions. Compare results and refine your targeting parameters to increase interest among your target audience.
To get a free copy of this Google Sheets template, sign up for a Coupler.io account.
We hope you found the answers you were looking for in this tutorial! If you discover that your LinkedIn exporting needs are more complex but don’t know where to start, our data experts can help. Let’s discuss your case over a quick call:

Get in touch with our data experts
Book a free demo