Imagine your Mixpanel data flowing directly into your reports, giving you immediate insights into user behavior and conversion trends. Instead of wasting hours on CSV downloads or wrestling with complex API code, you can focus on making data-driven decisions. You no longer have to deal with rigid row limits or the headache of merging scattered datasets by hand. Learn how you can achieve this seamless automation with Coupler.io.
How to automate Mixpanel data export with Coupler.io
Coupler.io is a data integration platform that enables you to export Mixpanel data, organize and load it to spreadsheets, dashboards, databases, or AI tools. You can also schedule automatic data refreshes, so your records in the selected destination stay up to date. All this takes just a few clicks without coding.
Try it out right away for free. Choose a destination for your Mixpanel data in the form below and click Proceed:
Next, sign up for Coupler.io (no credit card required) and proceed straight to the steps below to set up your Mixpanel data connector.
Step 1: Collect data from Mixpanel
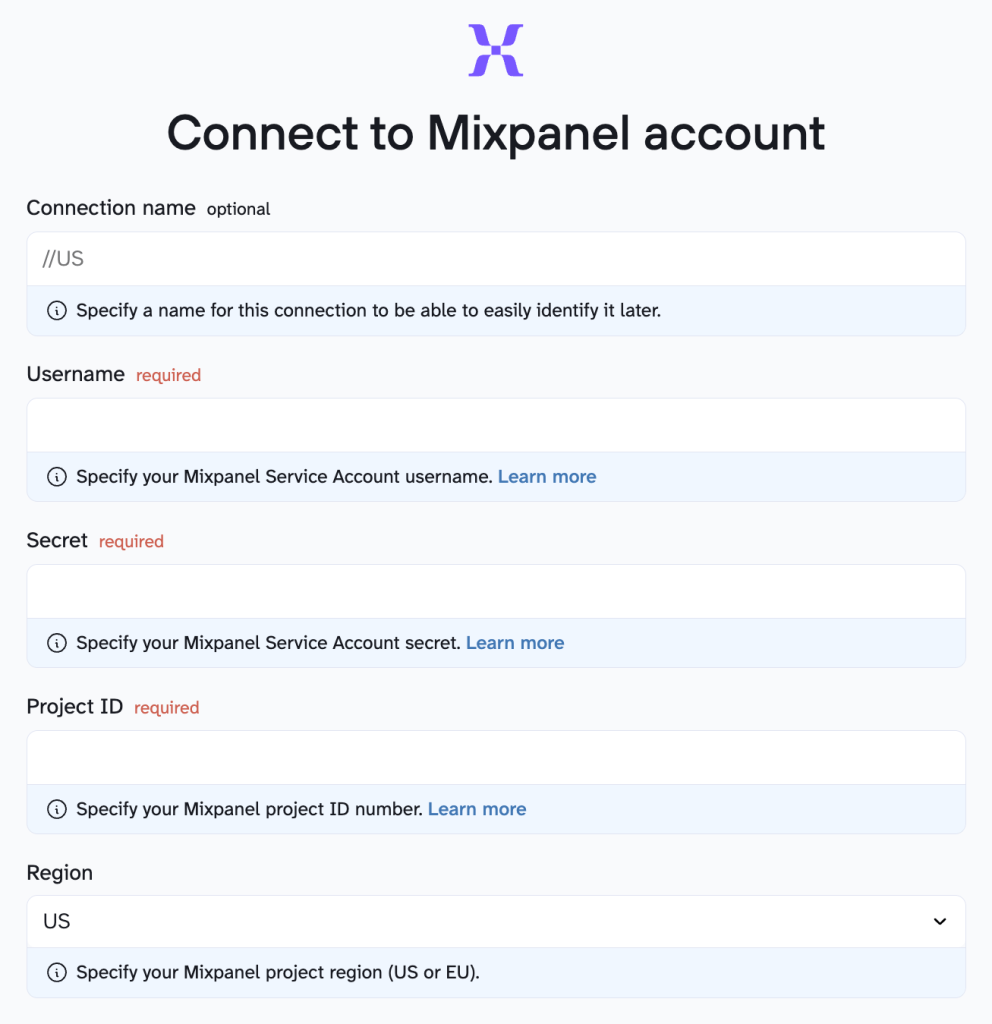
Сonnect your Mixpanel account by entering your Username, Secret, Project ID, and Region.
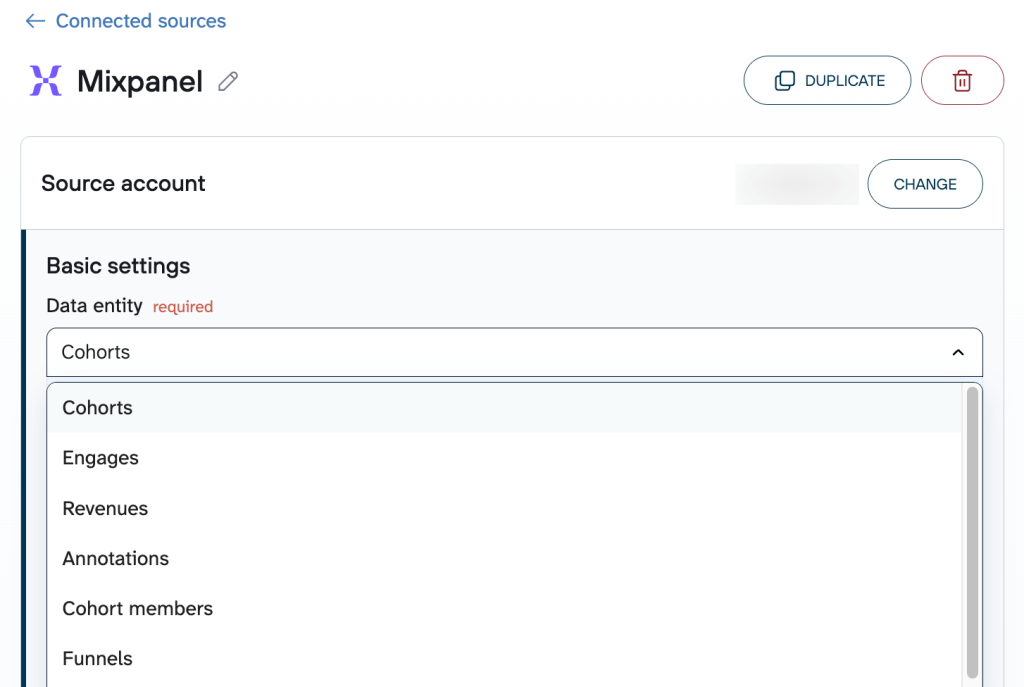
Then, select a data entity, which is the specific type of Mixpanel data you want to export.
Optionally, you can select:
- Start date – the earliest date to export data from.
- End date – the latest date to export data to.
- Attribution window – the number of days to attribute results to ads.
- Date slicing window – the number of days for data processing.
- Export lookback window – the number of seconds to look back from the last sync to ensure no data is missed.
- Project timezone.
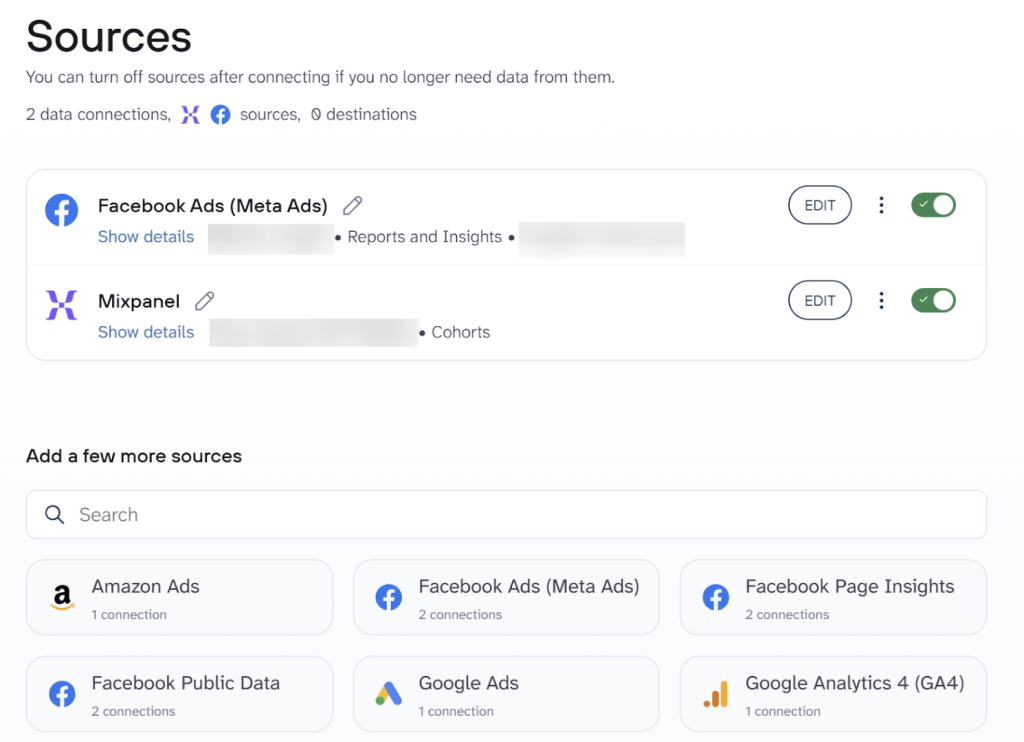
Coupler.io also allows you to connect multiple sources within a single data flow. So, you can combine records from different Mixpanel entities, accounts, or even other apps.
Step 2: Organize your Mixpanel data
Raw Mixpanel data often includes extra properties or event-level details that aren’t immediately useful for analysis. Therefore, you often need to clean up irrelevant fields and prepare metrics in a way that matches your data analytics needs.
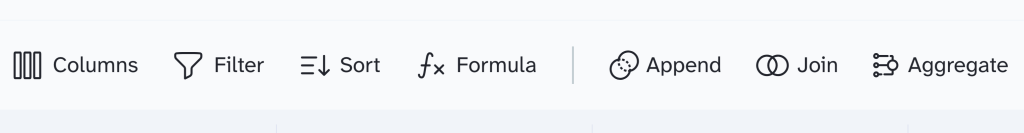
In this step, Coupler.io makes it easy to transform your data:
- Filter – Keep only the events, properties, or users relevant to your analysis, e.g., filter out test events or focus on a specific user segment.
- Sort – Arrange events or users by date, revenue, or other key metrics to make trends easier to spot.
- Hide or remove unwanted columns – Exclude unneeded event and user properties, such as detailed event-level metadata, to reduce clutter in your dataset.
- Rename or rearrange columns – Adjust property names or column order to make the dataset consistent and easier to interpret.
- Aggregate data – Gain quick insight from event-level data by applying functions like sum, average, count, min., or max., e.g., calculate average session duration.
- Add calculated columns – Create custom metrics, such as conversion rate per cohort or revenue per active user, directly from your raw data.
- Combine data sources – Enrich Mixpanel events with data from other Mixpanel entities, accounts, or other apps to get a more complete view of user experiences.
Step 3: Load data to the destination and automate data refresh
Connect your destination by following the in-app instructions.
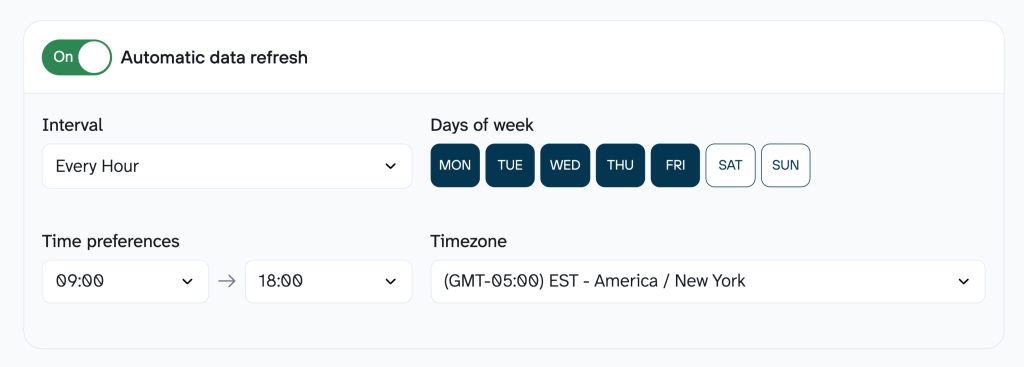
To keep your Mixpanel records up-to-date without manual work, turn on automatic data refresh. Then select the interval, days, hours, and relevant time zone. By default, data refreshes daily, but you can make updates more frequent, from hourly to every 15 minutes, for near real-time reporting.
Make sure you click to save and run. Only then will your automated Mixpanel data export be active.
Bonus: Analyze Mixpanel data with AI Agent
Coupler.io integrates with AI tools such as ChatGPT and Claude, which makes it possible to explore Mixpanel data through natural-language questions. However, Coupler.io also includes its own AI Agent, so you can analyze data directly inside the platform.
You can ask questions like “Which users stopped after the signup event?” or “Which events had the highest activity last month?” and receive immediate answers based on your Mixpanel dataset.
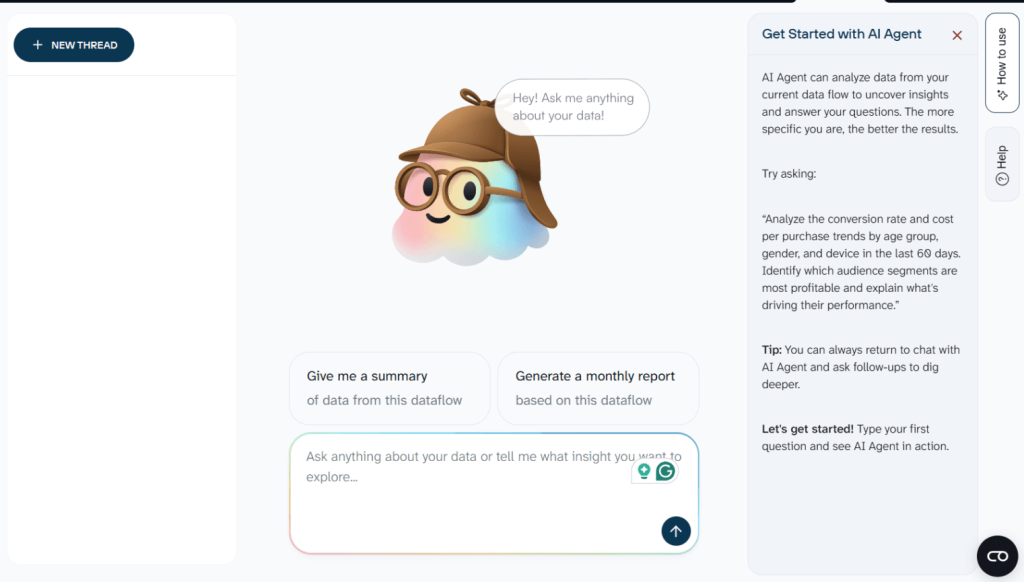
The AI Agent relies on an internal analytics engine that queries the data, performs calculations, and produces validated results. No SQL required on your side.

Export Mixpanel data and analyze it with AI
Try Coupler.io for freeWhat data can you export from Mixpanel?
The following data types are available in the Mixpanel source app [click to expand the list]:
- Cohorts: user segments based on shared characteristics or behaviors.
- Engages: user profiles with demographic and behavioral data.
- Revenues: revenue tracking data from user transactions and purchases.
- Annotations: project notes and markers for tracking important events.
- Cohort members: individual users who belong to specific cohorts.
- Funnels: conversion funnel analysis data showing user progression.
- Exports: raw event data from user interactions and activities.
Where can you load Mixpanel data?
With Coupler.io, you can export data from Mixpanel to the following destination apps:
- Spreadsheets: Google Sheets, Microsoft Excel (online & desktop).
- BI tools: Looker Studio, Power BI, Tableau, Qlik Sense.
- Data warehouses and databases: BigQuery, Snowflake, PostgreSQL, Redshift.
- AI tools: Claude, ChatGPT, Perplexity, Cursor, Gemini, OpenClaw.
- Other destinations: JSON, CSV, monday.com.
Blend Mixpanel data with other information
Mixpanel data becomes even more powerful when combined with information from other business systems. By blending user analytics with sales, marketing, and operational data using Coupler.io, you can uncover deeper insights, identify trends, and make more informed decisions.
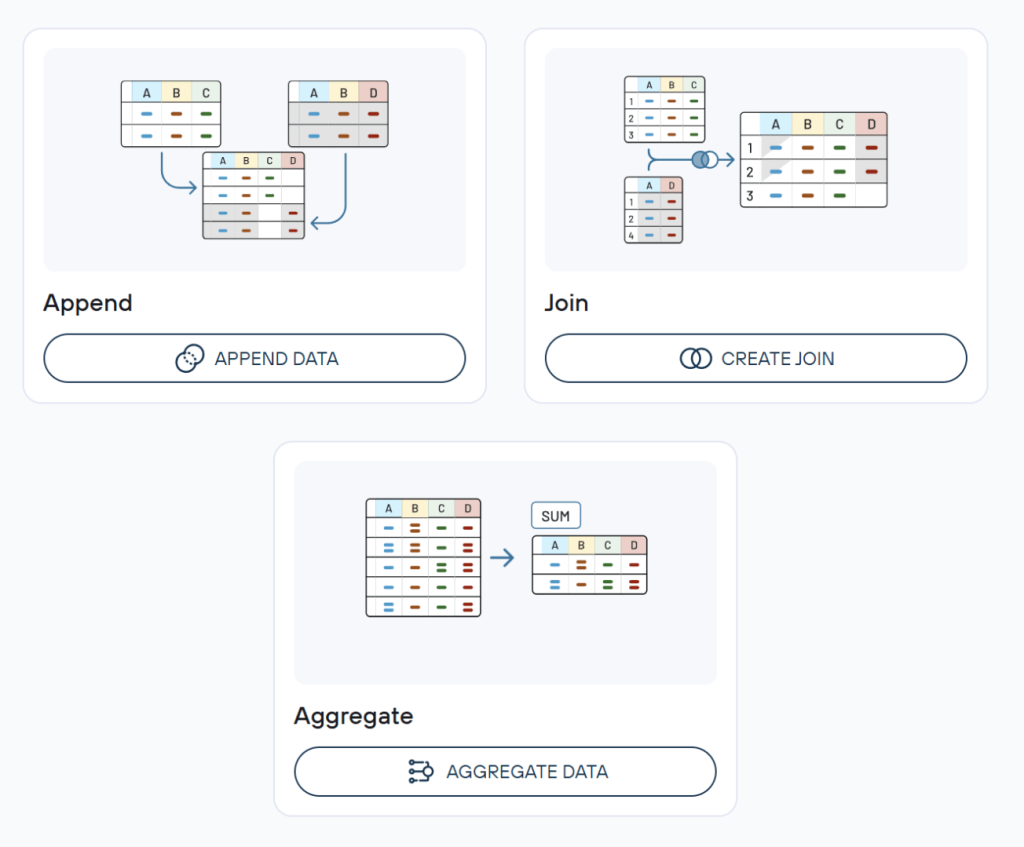
Once you’ve extracted data from several sources through Coupler.io, you can blend it using one of two modes – Append or Join:
Append merges datasets by adding all possible columns and rows, and matching columns with the same name. Suppose you need to combine the same data entities from different Mixpanel accounts. If so, this mode will place the rows from columns shared by both datasets into unified columns under the same headers.
Join combines two datasets by aligning rows based on at least one shared column. Let’s say you’re blending data from Mixpanel and Meta Ads. In that case, you’ll need to specify the columns with similar information shared by both datasets (not necessarily with the same name), e.g., date columns. This lets you bring data together to run cross-platform analysis, for example:
- Enrich user engagement data with Meta Ads spend numbers to measure the true ROI of marketing campaigns.
- Merge cohort data with WooCommerce orders to analyze customer lifetime value and retention patterns.
- Blend product usage metrics with Stripe revenue data to track feature adoption against monetization.
- Combine funnel performance data with Zendesk support tickets to reveal friction points affecting customer satisfaction.
Coupler.io connects with 400+ sources, so you can easily integrate Mixpanel data with the rest of your business ecosystem.
Automate Mixpanel data export with Coupler.io
Get started for freeKey challenges users face when making Mixpanel export data, and how Coupler.io solves them
While Mixpanel is a powerful product analytics platform, many teams eventually run into limitations when they try to export their data to other tools.
Below are some of the most common challenges Mixpanel users face and how Coupler.io helps overcome them.
Hours wasted on manual exports
Mixpanel allows exporting data directly from the UI, but this process is completely manual. Users need to repeatedly download CSV files from reports or tables, and exports only include the data currently loaded in the interface. For larger datasets, you must scroll and load more results before exporting. Additionally, most report exports are limited to 10,000 rows (or up to 50,000 rows on Enterprise plans).
✅ Solution: Coupler.io automates data exports so your Mixpanel records flow into tools like spreadsheets, BI platforms, databases, etc., on a scheduled basis. Instead of downloading CSV files manually, you can configure automatic refreshes and keep your reports continuously updated. Plus, Coupler.io lets you export unlimited rows per run, starting with the Active plan.
API-based exports require technical resources
For Mixpanel data export API options are available (such as the Raw Event Export API, Engage API, and Query API), but it’s impossible to use them without development work. You must handle authentication, pagination, data storage, scheduling, and maintenance. Raw event exports may also contain duplicates that require additional deduplication logic.
For non-technical teams, building and maintaining such pipelines can become a major challenge.
✅ Solution: Coupler.io provides a no-code way to extract Mixpanel data without building custom API integrations. You can configure exports through a visual interface and automatically sync events, user profiles, cohorts, etc., without writing or maintaining code.
Difficulties blending Mixpanel data with other business data
Native Mixpanel data export doesn’t provide built-in workflows for combining Mixpanel records with information from other systems, e.g., CRMs, payment processors, or e-commerce platforms.
✅ Solution: Coupler.io enables you to bring Mixpanel data together with numbers from 400+ business tools in one place. You can combine product usage data with marketing spend, revenue figures, CRM records, etc., to perform deeper cross-platform analysis.
Native data pipelines are complex and expensive
Mixpanel offers automated exports through Data Pipelines, but this feature is only available as a paid add-on for Growth and Enterprise plans. It also requires configuring storage integrations, IAM roles, and other technical components. Export timing cannot be customized, and pipelines can have a data delay of up to 24 hours.
For many teams, this makes native pipelines either too complex or too expensive.
✅ Solution: Coupler.io provides a simpler alternative for syncing Mixpanel data to analytics destinations. Instead of configuring cloud infrastructure and pipeline permissions, you can set up automated data exports in minutes and schedule updates as needed. Data refresh can happen as often as every 15 mins, which is nearly live.
Limited ability to explore combined data with natural-language analysis
Mixpanel has AI features, but they focus on event data within the platform itself. To combine this data with records from marketing, CRM, or revenue platforms, you usually need additional setup or enterprise-level integrations.
✅ Solution: Coupler.io AI Agent lets you ask plain-language questions across all your connected data sources and get validated, accurate answers in seconds, without building complex queries.

Export data from Mixpanel to spreadsheets, dashboards, and AI
Try Coupler.io for freeOther ways to export data from Mixpanel
Mixpanel offers several built-in ways to get your data out, from quick manual downloads to API-based pipelines. Let’s go over them one by one.
CSV export from the UI
The simplest way to make Mixpanel export data is directly through the Mixpanel interface. You can grab events, user profiles, and Group Profiles as CSV files.
How it works: Mixpanel exports whatever is currently visible in the table. You can customize which columns (properties) are included before exporting.
To export events:
- Navigate to the events tab.
- Query the events that you are interested in seeing.
- Click the export button in the top right corner.
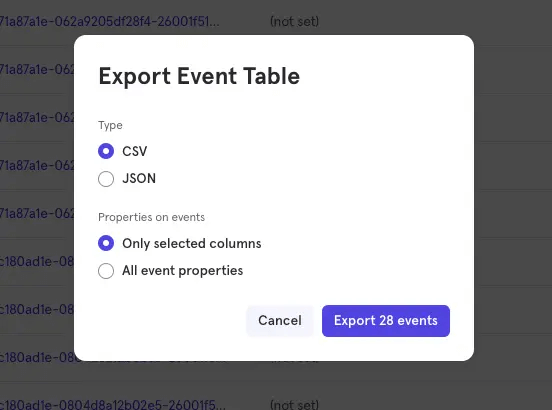
To modify the properties columns shown in the events table, click the edit columns button.
If you are interested in all of the event properties, select the option to include all event properties.
To modify the properties columns shown in the events table, click the edit columns button.
If you are interested in all of the event properties, select the option to include all event properties.
To make Mixpanel export user data:
- Navigate to the users tab.
- Query the profiles that you are interested in seeing.
- Click the export button in the top right corner.
To choose the profile properties to return before your export, modify the table by clicking the edit columns button.
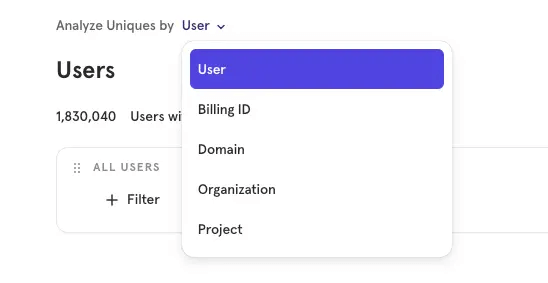
To export Group Profiles, switch the group key to your group of choice by clicking the analyze uniques by button in the top left of the UI.
This method can be useful when:
- You need a quick, one-off data pull for ad hoc analysis without any engineering involvement.
- You want to share a snapshot of event or profile data with a stakeholder in a familiar spreadsheet format.
- You’re doing exploratory work and need to inspect a small sample of raw records quickly.
Limitations:
- Strictly manual, no scheduling or automation.
- Only exports what’s loaded in the UI at export time (you need to scroll and load more to include additional events).
- Export row limits apply: up to 10,000 rows for most report types or up to 50,000 rows for Enterprise plan users on specific Insights views.
- Not suitable for large-scale or recurring data needs.
Report downloads (UI)
Any report in Mixpanel (Insights, Funnels, Retention, and others) can be exported directly from the report UI as CSV, PNG, or PDF.
How it works: You click the more options menu in any report and choose the export option.
This method can be useful when:
- You need to share a formatted visualization or summary report with stakeholders who don’t have Mixpanel access.
- You want a snapshot of a specific report’s output at a given point in time for documentation or presentation purposes.
- You require a quick one-off export of a report’s underlying data without writing any code.
Limitations:
- Manual process with no automation.
- Row limits apply: up to 10,000 rows for most users or up to 50,000 rows for Enterprise in select views.
API integration
Mixpanel offers different APIs to access your data: raw events, user and group profiles, or pre-aggregated reports (Insights, Funnels, or Retention). Each API offers distinct functionality and comes with its own considerations, from authentication and data formatting to scheduling and volume limitations. Let’s explore them one by one.
Raw Event Export API
For high-volume event exports, Mixpanel provides the Raw Event Export API. You query events by date range and receive data as JSONL (one JSON object per line).
How it works: You make an authenticated HTTP request with date range parameters and optional event filters. The API returns raw event data as it was ingested.
To make Mixpanel export raw data on events, send a request like in the example below:
# Returning "sample_event" from 2026-01-10 to 2026-01-11
curl -gG --request GET \
     --url 'https://data.mixpanel.com/api/2.0/export?from_date=2026-01-10&to_date=2026-01-11&limit=100' \
     --data-urlencode 'event=["sample_event"]' \
     --header 'accept: text/plain' \
     --header 'authorization: Basic YOUR_TOKEN'
Example payload:
# The entire payload is a JSONL
# Each line of event is a JSON object
{"event":"Signed up","properties":{"time":1602611311,"$insert_id":"ABCDE","mp_processing_time_ms":1602625711874}}
{"event":"Signed up","properties":{"time":1602787121,"$insert_id":"ABCDE","mp_processing_time_ms":1602801521561}}
For projects created before 1 Jan 2023, your event timestamp is stored in your local project timezone at the time of ingestion. For projects created after 1 Jan 2023, your event timestamp is stored in the UTC timezone. Learn more about managing your project timezone here.
This method can be useful when:
- You need to export large volumes of raw event data programmatically and store it in your own environment.
- You’re building a custom ETL pipeline and need full control over how events are fetched and processed.
- You want to pull data for a specific date range or specific event types without setting up a full recurring pipeline.
Limitations:
- Requires technical knowledge to set up and maintain.
- Date parameters are interpreted in UTC (for projects created after January 2023), which may require timezone conversion.
- No built-in scheduling – you need to build and maintain your own pipeline logic.
- Raw exported data can contain duplicates, requiring deduplication.
User and Group Profile export via API
The Engage API lets you export user profiles and Group Profiles programmatically. You can filter by cohort, specify which properties to return, and page through results.
How it works: You send a POST request with your project ID and optional filters. Profiles are returned as a paginated JSON array. By default, all profile properties are returned.
To make Mixpanel export data on user profiles, send a request like the example below:
# Returns all user profiles in project 1234567
curl --request POST \
     --url 'https://mixpanel.com/api/query/engage?project_id=1234567' \
     --header 'accept: application/json' \
     --header 'authorization: Basic YOUR_TOKEN' \
     --header 'content-type: application/x-www-form-urlencoded'
Example payload:
# Your profiles are stored in an array of objects in the results key
# Each object is a separate profile
{
  "page": 0,
  "page_size": 1000,
  "results": [
    {
      "$distinct_id": 1,
      "$properties": {
        "$created": "2008-12-12T11:20:47",
        "$email": "example1@mixpanel.com",
        "$first_name": "Example1",
        "$last_name": "Name1",
        "$last_seen": "2008-06-09T23:08:40"
      }
    },
{
      "$distinct_id": 2,
      "$properties": {
        "$created": "2008-12-12T11:20:47",
        "$email": "example2@mixpanel.com",
        "$first_name": "Example2",
        "$last_name": "Name2",
        "$last_seen": "2008-06-09T23:08:40"
      }
    }
  ],
  "session_id": "1234567890-EXAMPLE",
  "status": "ok",
  "total": 1
}
By default, all profile properties are returned. To specify specific profile properties to return, use the output_properties parameter.
Example: output_properties=[“$last_name”, “$email”, “Total Spent”]
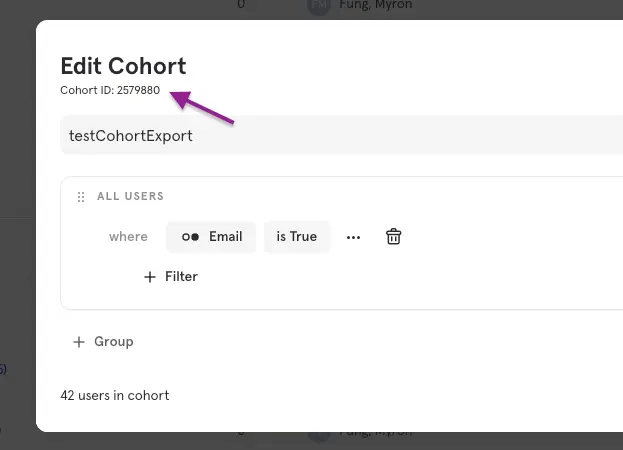
You may export specific cohorts by using the filter_by_cohort parameter. Find the cohort_id in the UI next to your cohort or by using the cohorts-list API.
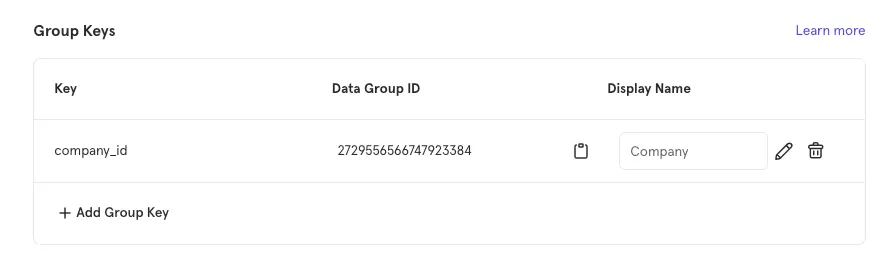
To export Group Profiles, provide the data_group_id parameter in your Engage API request. You can find the data_group_id for your group keys in your project settings.
This method can be useful when:
- You need to extract user profile data programmatically for use in downstream systems, such as a CRM or data warehouse.
- You want to export only a specific cohort of users rather than all profiles in the project.
Limitations:
- Requires API authentication and custom code to consume and store results.
- No native scheduling – automation must be built from scratch.
Query API (Insights, Funnels, Retention)
For users on Growth or Enterprise plans, the Query API allows you to programmatically pull formatted report results, the same data you see in the Mixpanel UI.
How it works: You call the relevant API endpoint (Insights, Funnels, or Retention) and receive structured report data in JSON format.
This method can be useful when:
- You want to automate the extraction of formatted report data into an internal dashboard, data store, or reporting tool.
- You’re building integrations where downstream systems need access to pre-aggregated Mixpanel metrics rather than raw event data.
Limitations:
- Available on paid plans only (Growth or Enterprise).
- Requires development work to build, authenticate, and maintain API calls.
- The Flows report cannot be exported via API – UI download is the only option.
- Still requires custom scheduling infrastructure for recurring exports.
Data Pipelines
Data Pipelines is Mixpanel’s native solution for continuous, automated exports to cloud storage (AWS S3, Google Cloud Storage, Azure Blob Storage) or data warehouses (BigQuery, Snowflake, Redshift, Databricks).
Note: Databricks is currently in closed beta, meaning access is granted to a limited audience for feature testing.
Note: Databricks is currently in closed beta, meaning access is granted to a limited audience for feature testing.
How it works: After configuring your destination and setting permissions, you create a pipeline in the Mixpanel UI. It then exports events, user profiles, and identity mappings on a recurring hourly or daily schedule.
Here’s what it looks like step by step:
- Configure your destination. The process varies depending on the type of destination you choose, cloud storage or data warehouse. Learn more here.
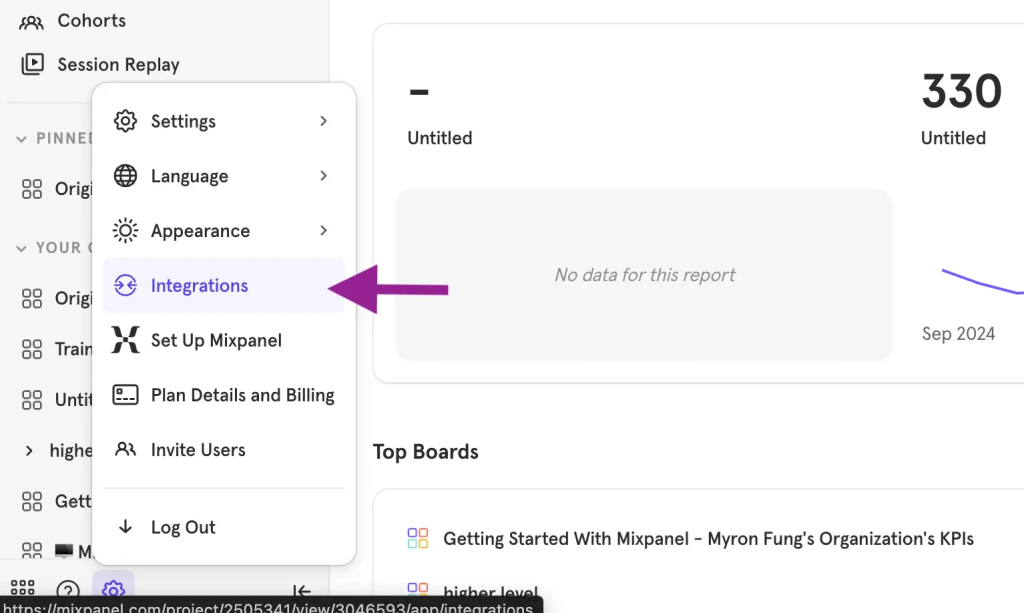
- To initiate the pipeline from the Mixpanel UI, click the settings button and select integrations.
- Select the provider of your destination and click to create the pipeline.
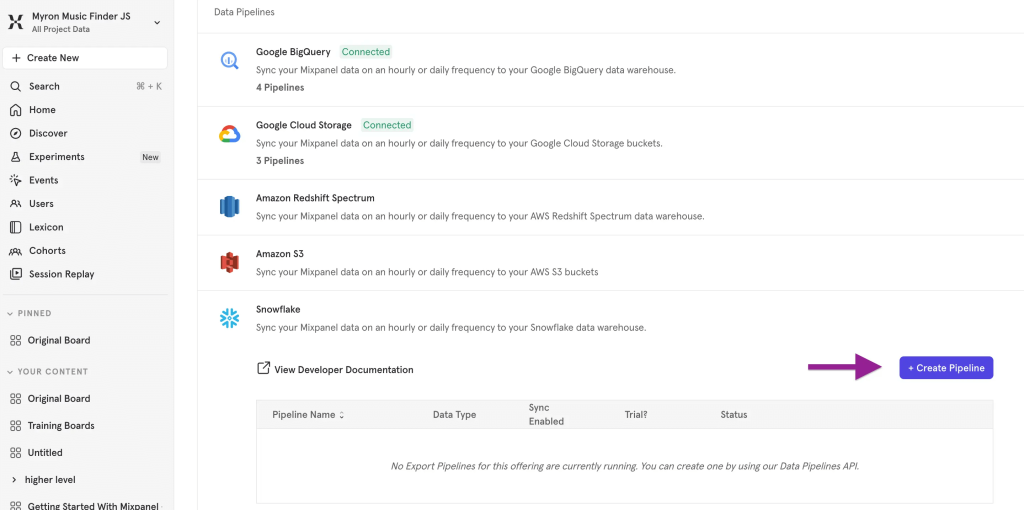
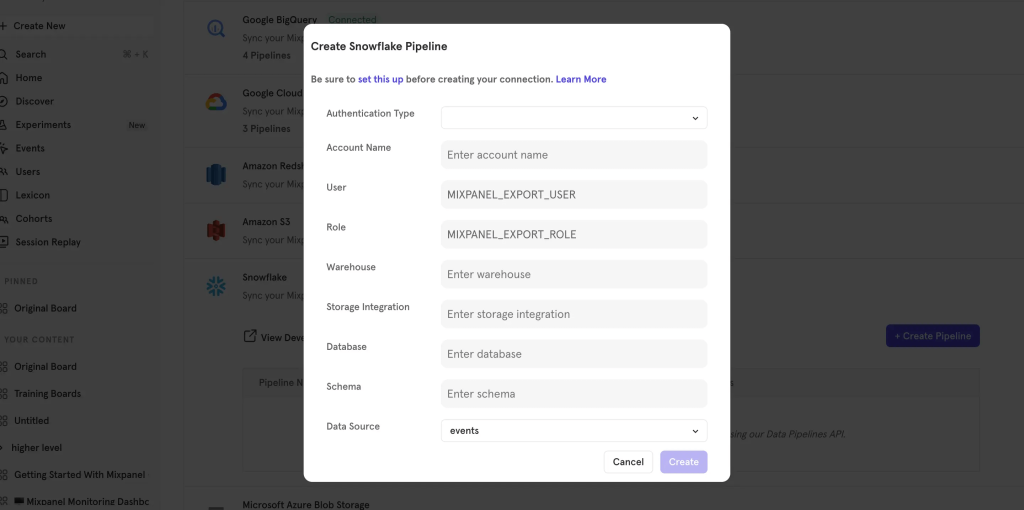
- Provide the details of your destination to create the pipeline, like the example below:
This method can be useful when:
- You need a fully automated, continuous export of raw Mixpanel data into your own data warehouse or cloud storage for SQL-based analysis.
- Your data team wants to join Mixpanel data with other sources in a warehouse environment that they control.
- You’re building a durable analytics infrastructure and require reliable, recurring data delivery with an SLA.
Limitations:
- Available as a paid add-on for Growth and Enterprise plan customers only.
- Configuring IAM roles, permissions, storage integrations, and schema access requires intermediate-to-advanced technical expertise.
- Export timing cannot be customized.
- Exported data may lag by up to a day.
- You cannot export only a subset of events or filter by properties in JSON pipelines – all events are exported as ingested.
- Custom subfolder paths within your storage bucket are not supported.
- GDPR deletions do not cascade to your warehouse – you must handle data removal on the warehouse side separately.
- Each project is limited to 2 recurring pipelines and 1 date-range backfill pipeline at a time.
- A free trial is available, but it is limited: daily exports only, no data sync, one pipeline per data source, and backfill limited to one day before pipeline creation.
- Trial pipelines cannot be deleted, even after upgrading.
Cohort Sync
Cohort Sync lets you push dynamic user segments (cohorts) from Mixpanel to marketing, advertising, and engagement platforms like Braze, Google Ads, Mailchimp, etc.
How it works: You select a cohort, choose a destination, and set a sync cadence (one-time, hourly, daily, or real-time). Mixpanel then pushes cohort membership updates (adds and removals) to the destination automatically.
Here’s what it looks like step by step:
- To establish a connection, refer to the Cohort Sync Integration Directory below for partner-specific setup guides. To export cohorts to destinations without a native integration, use the Custom Webhooks guide.
- Navigate to Lexicon and select cohorts in the left-hand sidebar.
- Click the three-dot button next to the cohort you want to sync and choose export.
- Select one of your connections to open the export modal.
- Choose a one-time export or a recurring export.
This method can be useful when:
- You need to activate Mixpanel behavioral segments directly in ad platforms (e.g., Google Ads, Meta Ads) for targeted campaigns or lookalike audience creation.
- You seek to keep a downstream engagement tool (e.g., Braze, Iterable, Intercom) automatically up to date with a user segment defined in Mixpanel.
- You’re running re-engagement campaigns and want to target users who completed or dropped off at a specific step, without any manual CSV exports.
Limitations:
- Available to paid plan customers only.
- Each project is limited to 60 active recurring cohort syncs across all destinations.
- Each cohort is capped at 10 million users.
- Only a limited set of properties is exported – full profile data is not included.
- Group-level cohorts are not supported.
- For custom webhook destinations, syncs run on a 30-minute cadence.
- Real-time availability depends on the specific destination.
- If your webhook server is down for more than 3 days, Mixpanel falls back to a full re-sync, which can cause duplicate actions on the receiving end.
- The cohort snapshot used for diffing expires after 3 days, requiring careful management of sync reliability.
How to choose the right Mixpanel export data method
The best option to export data from Mixpanel depends on your reporting needs, technical resources, and how frequently you need the data updated. Some methods work well for quick manual analysis, while others are designed for automated pipelines or large-scale analytics.
Look at the table below to see when each method typically makes the most sense:
| Export method | Best for | Automation | Technical effort |
|---|---|---|---|
| Coupler.io | Automating Mixpanel exports to spreadsheets, BI tools, databases, and AI tools with scheduling and transformations | ✅ Yes | Low |
| CSV export from the UI | Quick one-off data pulls, small datasets, sharing snapshots with stakeholders | ❌ No | Low |
| Report downloads (UI) | Exporting visual reports or summarized analytics for presentations or documentation | ❌ No | Low |
| Raw Event Export API | Exporting large volumes of raw event data and building custom ETL pipelines | ⚠️ Requires custom scheduling | High |
| Engage API (profiles) | Programmatically retrieving user or group profiles for CRMs or internal systems | ⚠️ Requires custom scheduling | High |
| Query API | Pulling pre-aggregated report data (Insights, Funnels, Retention) for dashboards | ⚠️ Requires custom scheduling | High |
| Data Pipelines | Continuous exports to data warehouses or cloud storage for large analytics infrastructures | ✅ Yes | Medium/High |
| Cohort Sync | Sending behavioral user segments to marketing or engagement platforms | ✅ Yes | Medium |
If your goal is to keep reports continuously updated without building or maintaining custom infrastructure, Coupler.io provides a versatile no-code solution for your needs.
