Finance teams spend hours every month pulling data from accounting tools, formatting reports, checking changes, and answering follow-up questions from leadership. The numbers are usually available, but explaining what changed and why still takes time.
Claude by Anthropic can become your AI assistant to help with that analysis layer. It can summarize a P&L report, compare budget vs. actuals, review cash flow changes, spot unusual expenses, and turn financial data into plain-language commentary.
But for recurring reporting, Claude needs clean, structured, and up-to-date data. A one-time spreadsheet upload works for quick analysis, but it does not create a repeatable workflow.
Coupler.io provides that data layer. It connects financial data from sources like QuickBooks, Xero, spreadsheets, and payment tools to Claude, refreshes it on a schedule, and runs calculations through its Analytical Engine before Claude explains the results.
That is the workflow I’ll focus on in this tutorial: what Claude can do for financial reporting, how to connect financial data to it, and which reports you can automate.
What Claude can do for financial reporting
Claude is useful for the analysis and narrative side of financial reporting. It can help interpret structured financial data, explain what changed, turn numbers into clear commentary, and provide other AI financial insights.
I would not use Claude as the source of truth for financial data. That should still come from your accounting software, spreadsheets, payment tools, or internal databases. But once the data is prepared properly, Claude can make the reporting process faster and more interactive.
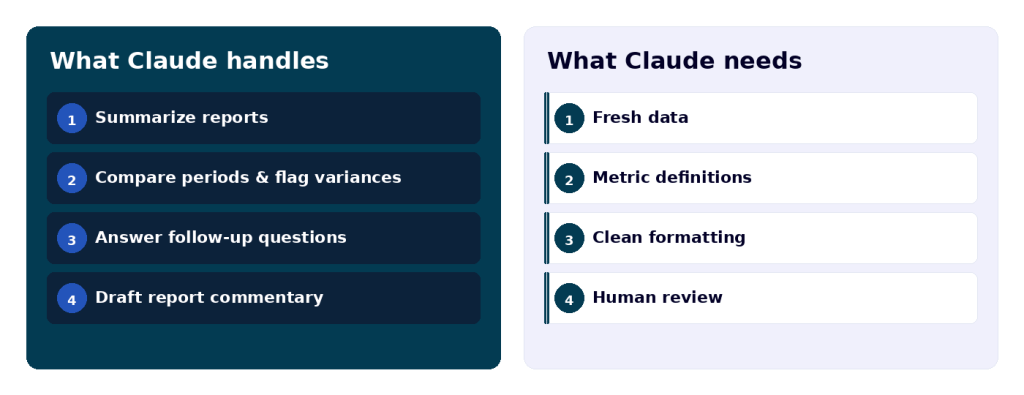
So, how do you use Claude AI for financial reporting? Let’s get started with that.
Summarize and explain financial reports
Claude can turn financial data into plain-language summaries. Instead of reading through rows of numbers manually, you can ask it to explain the main changes, highlight important movements, and describe what the report shows.
This is useful when the numbers are already available, but the analysis still needs to be written. Claude can create the first draft of the explanation, which the finance team can then review and adjust before sharing.
Compare periods and identify key variances
Claude can compare financial data across different periods and point out the largest changes. This helps when you need to understand what moved, how much it changed, and whether the change is worth investigating.
For example, you can ask Claude to identify the biggest increases or decreases by account, category, department, customer, vendor, or region. This makes it easier to find the areas that need attention before preparing a final report.
Answer follow-up finance questions
One of Claude’s main advantages is that you can keep asking questions after the first analysis. If a report shows a change in profit, revenue, costs, or cash position, you can ask Claude to drill into the details without creating a separate spreadsheet each time.
Particularly helpful for ad hoc questions from leadership. Instead of rebuilding a report for every follow-up, you can explore the connected dataset conversationally and narrow down the answer step by step.
Draft report commentary and artifacts
Claude can also turn financial analysis into report-ready content. After reviewing the data, it can draft summaries, variance explanations, management notes, tables, and charts.
This does not remove the need for review. Financial commentary still needs human judgment, especially when explaining accounting decisions or business context. But Claude can reduce the time spent turning analysis into a readable update.

Get prepared financial data in Claude with Coupler.io
Get started for freeLimitations of using Claude without structured data
You can analyze financial data with Claude AI, but the quality of the output depends on the quality of the dataset. If the data is messy or disconnected from the source system, the analysis becomes harder to trust.
Common limitations include:
- Stale data: If you upload a spreadsheet manually, Claude only sees that version of the file. The analysis becomes outdated as soon as the source data changes.
- Unclear metric definitions: Claude may not know how your company defines revenue, gross margin, operating expenses, cash flow, or other finance metrics unless the dataset includes that context.
- Messy formatting: Mixed date formats, unclear column names, merged cells, duplicate rows, and missing categories can make the analysis less reliable.
- Manual repeat work: Without a connected data flow, you need to export, clean, and upload the data again every time you want to update the report.
- Limited source-of-truth control: Claude should not replace your accounting tool or financial review process. The final numbers still need to be checked against the original source.
This does not mean Claude is unreliable for financial reporting. It means the data layer matters. Claude is most useful when it works with clean, structured, and regularly refreshed data.
Claude for finance vs. dashboards
Claude and dashboards are not interchangeable. I would use them for different parts of the financial reporting workflow.
Dashboards are better for monitoring fixed metrics. They give you a consistent view of revenue, expenses, margins, cash flow, and other KPIs over time. If the goal is to check the same numbers every week or month, a dashboard is usually the better format.
Claude is better when you need to understand the story behind the numbers. Instead of only seeing that operating expenses increased, you can ask what changed, which categories drove the increase, whether the change looks unusual, and how to explain it in a finance update.
When dashboards work better
Dashboards work best when the report is stable and repeatable. For example, a CFO dashboard can show monthly revenue, gross margin, operating expenses, net income, cash balance, and outstanding invoices in one place.
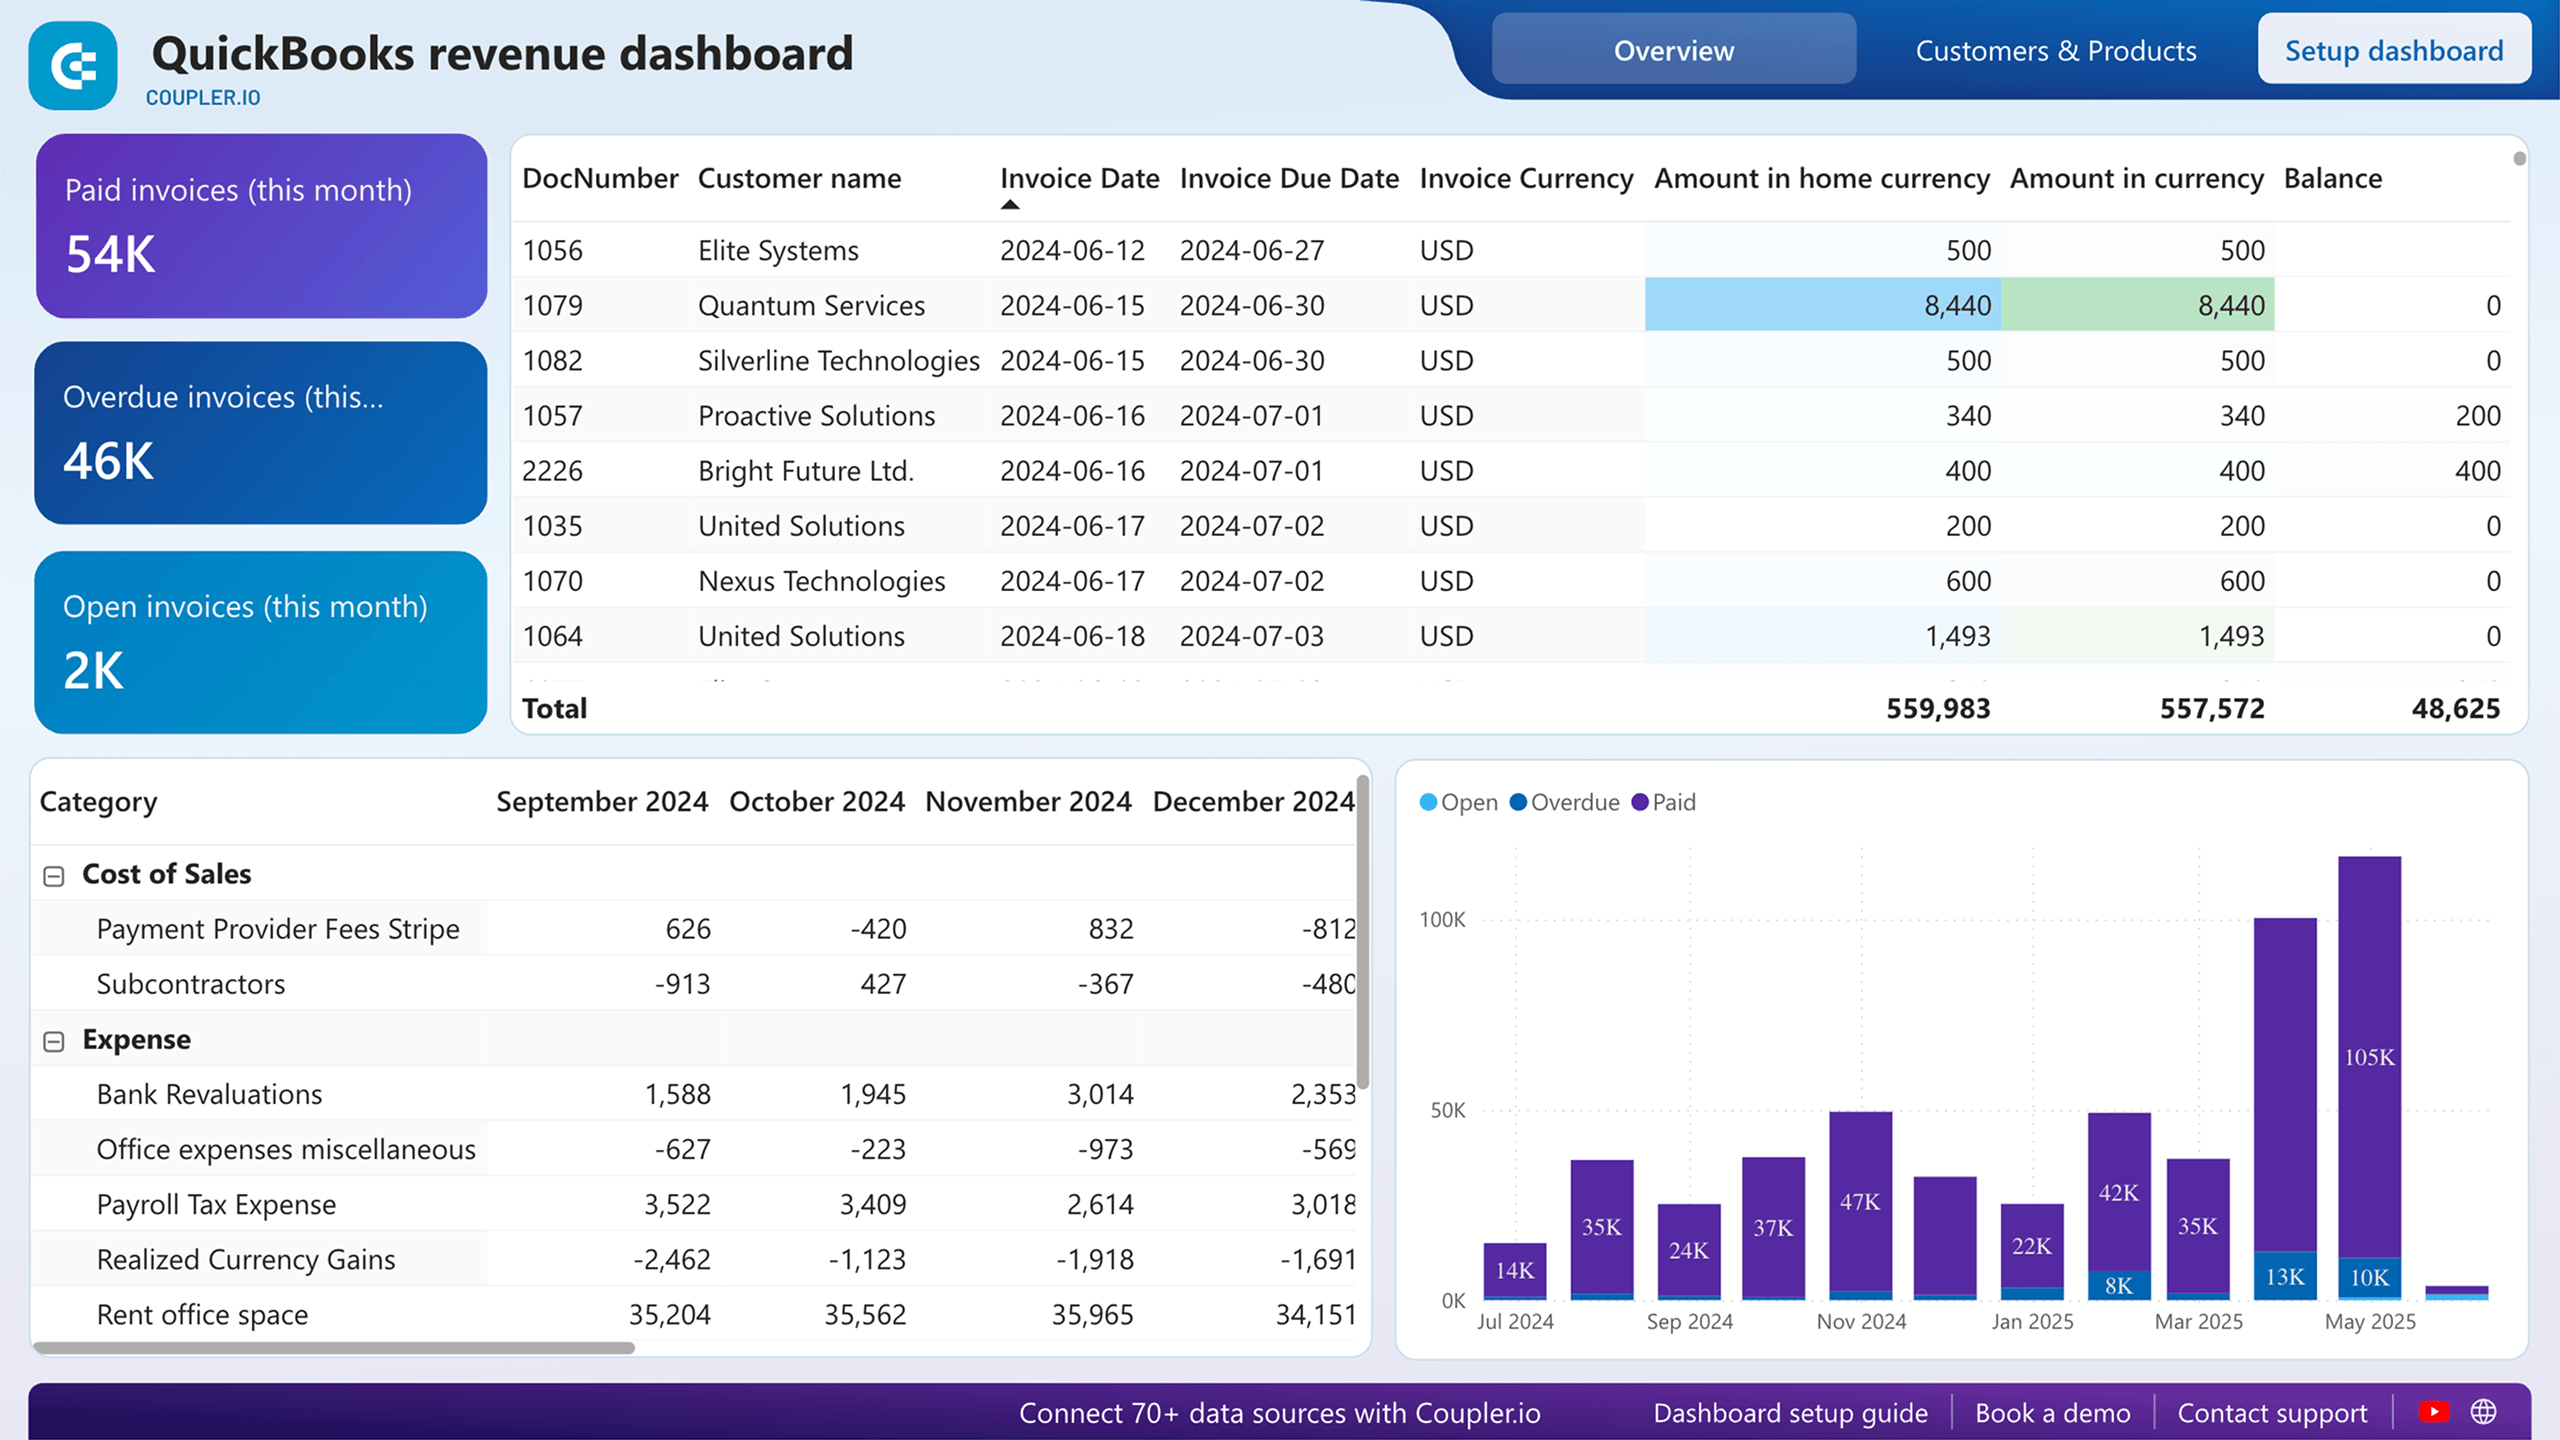
This is useful for:
- Tracking the same financial KPIs over time
- Monitoring trends at a glance
- Sharing consistent reports with stakeholders
- Comparing performance across months, quarters, or business units
- Keeping a visual reporting layer for recurring meetings
Dashboards are also better when the audience does not need to ask many follow-up questions. If leadership only wants to see the latest numbers and trends, a dashboard is usually enough.
When Claude works better
Claude is more useful when the question is not fixed. Financial reporting often leads to follow-up questions, such as:
- Why did expenses increase this month?
- Which accounts caused the largest variance?
- Was the change driven by one-time costs or a recurring trend?
- What should I mention in the board summary?
- Which numbers need more investigation before the report is shared?
These questions are harder to answer with a static dashboard. You can add more filters and charts, but that often turns into another reporting task. Claude is better for this kind of analysis because you can ask questions in plain language and keep narrowing the answer.
This is where Claude for finance becomes useful. It helps with exploration, explanation, and commentary. The dashboard shows what happened. Claude explains why it happened and how to communicate it.
How Coupler.io supports both dashboards and Claude analysis
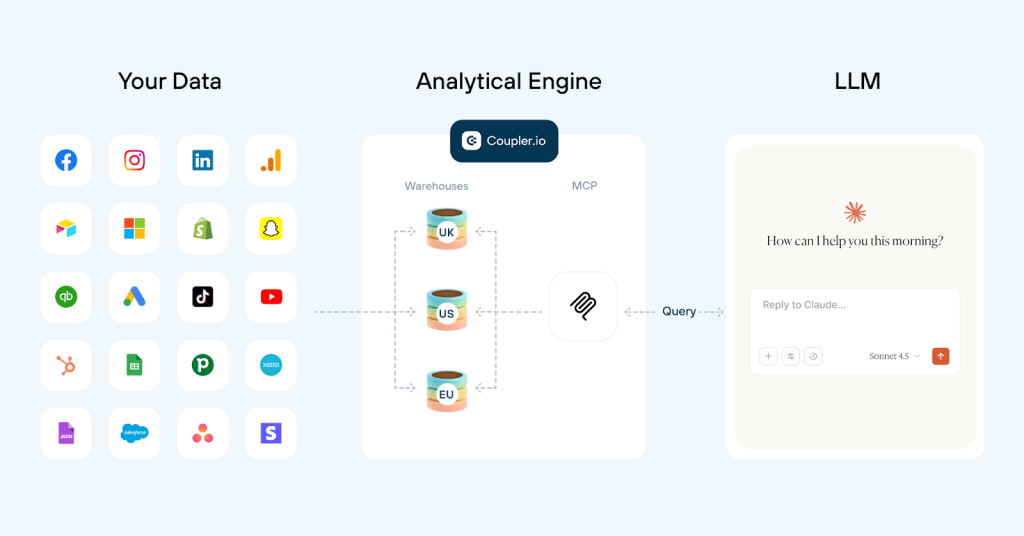
Coupler.io collects financial data from different sources, prepares it, and sends it to a dashboard for recurring KPI monitoring. The same prepared dataset can also be connected to Claude for conversational analysis.
This matters because financial reporting requires reliable numbers before it can provide a good explanation. Claude is useful for interpreting questions, finding patterns, and explaining what changed, but the calculations should come from a structured calculation layer.
With Coupler.io, the Analytical Engine handles the math on the prepared dataset before Claude explains the results. In other words, Coupler.io calculates, while Claude interprets and turns the output into plain-language financial analysis.
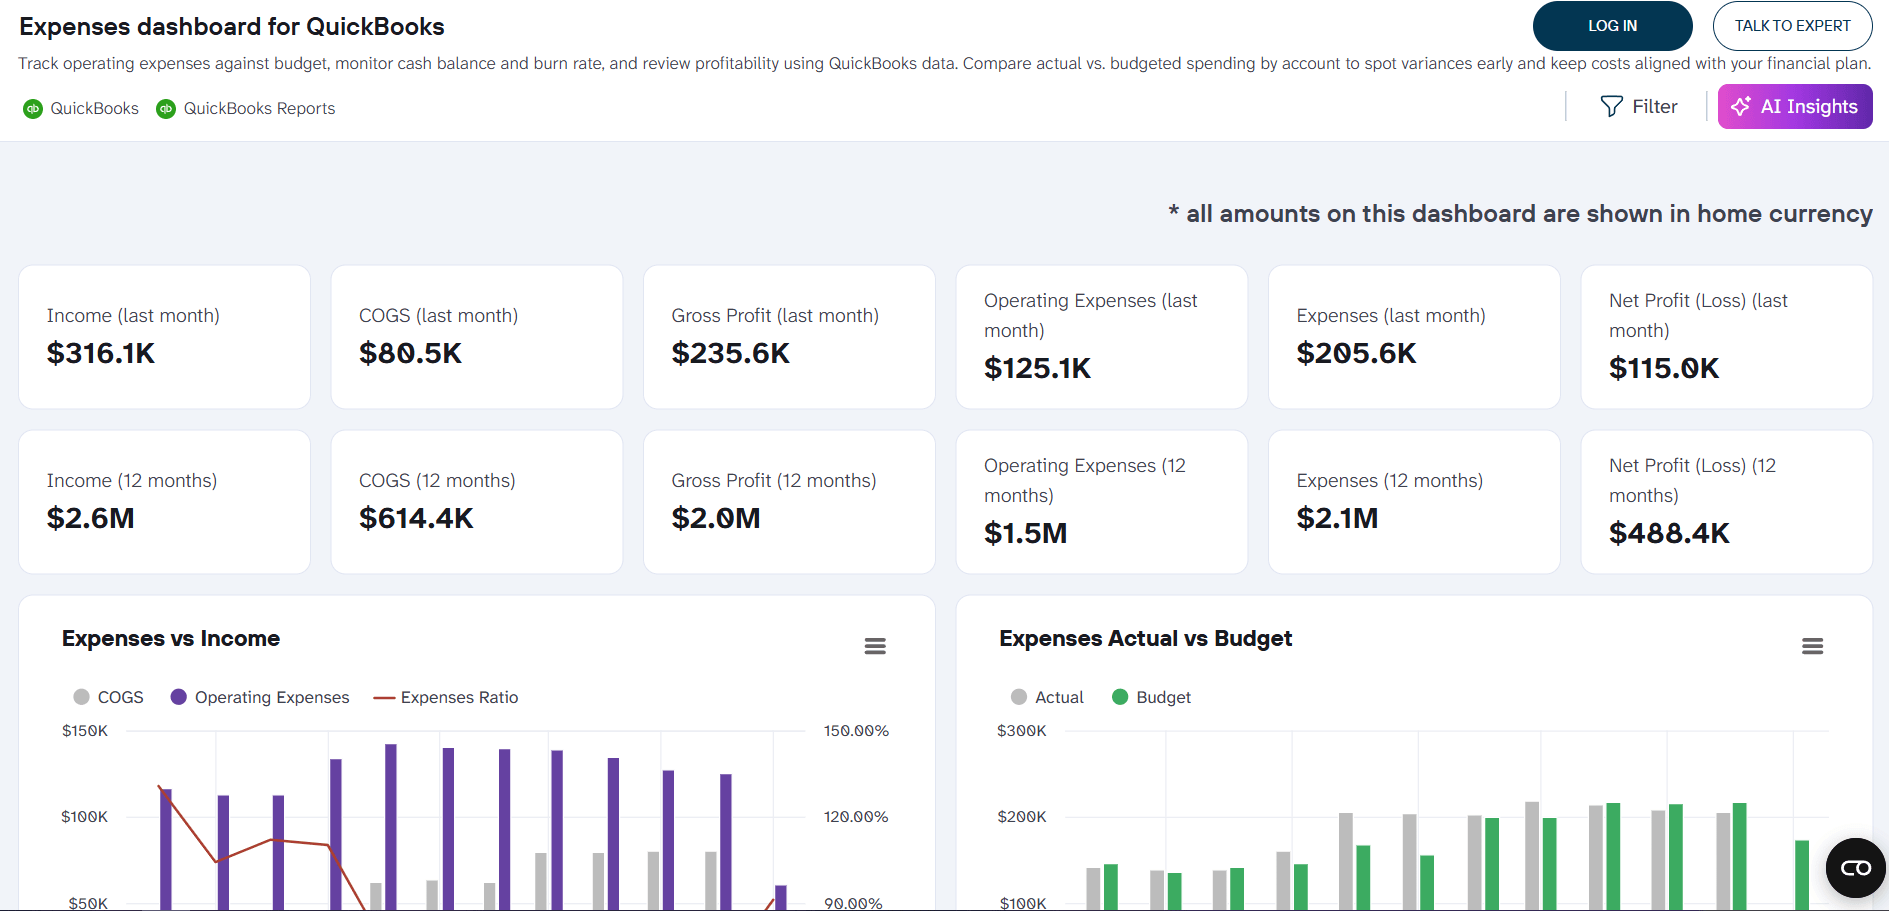
For example, the QuickBooks expenses dashboard can show that expenses increased by 18% month over month.
Expenses dashboard for QuickBooks
 Preview dashboard
Expenses dashboard for QuickBooks
Preview dashboardClaude can then answer which expense categories caused the increase, whether the change looks unusual, and how to summarize it for leadership.
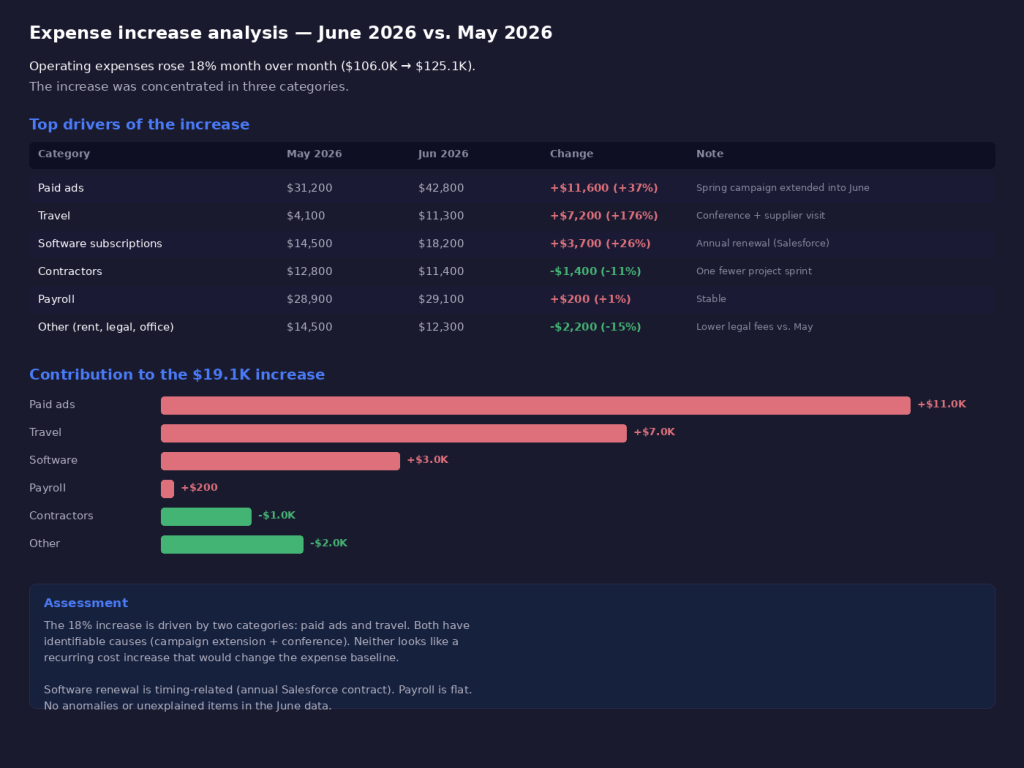
That combination is the strongest workflow: dashboards for recurring visibility, Claude for deeper analysis, and Coupler.io as the data layer that keeps both connected to prepared, refreshed financial data. You can also use one of the many Coupler.io financial dashboard templates to streamline your reporting.
Build a P&L, budget, and cash flow pipeline for Claude
Book a demo with Coupler.ioHow to automate financial reporting with Claude
There are three main ways to automate financial reporting with Claude: connect a prepared dataset through Coupler.io, use Claude’s native connectors or MCP, or upload files manually.
For recurring reports, I would not start with manual uploads. The better approach is to prepare the financial data first, then let Claude analyze and explain it.
Connect through Coupler.io
Coupler.io is a data integration and AI analytics platform that provides over 400 Claude integrations. From a financial analytics perspective, it connects QuickBooks, Xero, Google Sheets, Stripe, Shopify, and other financial data sources to Claude via MCP. The connection means that your data will refresh automatically on a schedule. In addition, all required data calculations are performed by the Analytical Engine before Claude sees the results.
There are two paths to set up a workflow with Coupler.io:
- Create data flows yourself in Coupler.io
- Describe what you need directly in Claude and let it create the data flow for you through the Coupler.io connector.
The latter option looks to be the simplest way to get started. For example, you tell Claude “connect my QuickBooks balance sheet data by month”, and it will create the data flow in Coupler.io for you, ask you to authorize your QB account, and prepare the dataset based on your description. To work this way, you need a Coupler.io account (a free trial works) and the Coupler.io connector installed in Claude.
However, from my experience, finance professionals used to get more control over the data Claude will see. So, it makes sense to set up the data flow yourself.
Step 1. Prepare the dataset in Coupler.io
Start by creating a data flow in Coupler.io. You can use the form below to select and get started with Coupler.io for free (no credit card required)
Financial reporting often pulls from more than one place, such as actuals from QuickBooks, budget from a Google Sheets planning file, cash flow from a bank feed, etc. Coupler.io can combine multiple sources into one prepared dataset, so Claude gets a complete picture instead of a single slice.
Here are the most common integrations for financial analytics in Claude
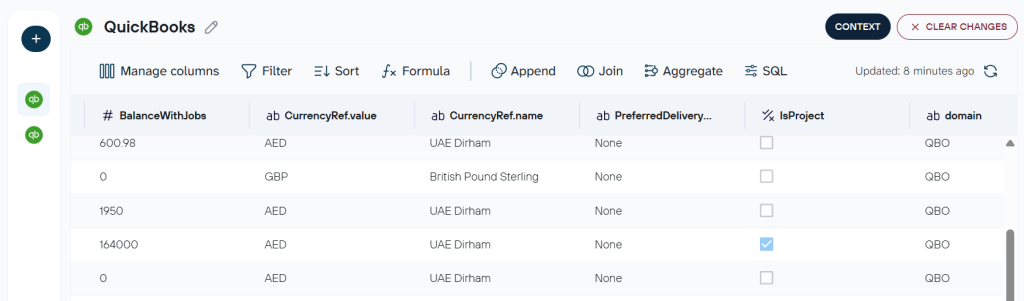
Then, prepare the dataset before sending it to Claude. You can rename unclear columns, remove unnecessary fields, filter the reporting period, standardize dates, and organize metrics into a cleaner structure.
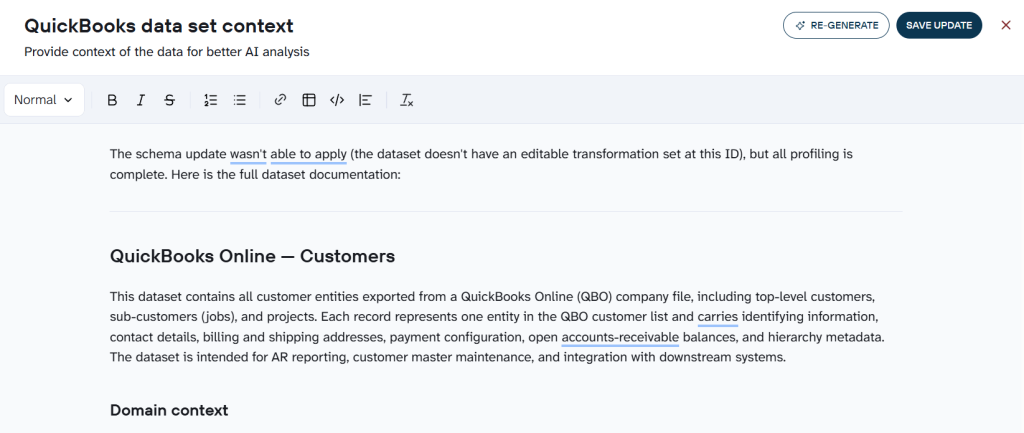
Next, add business definitions in the Context field. Without them, Claude has to guess what your columns mean. It might treat “revenue” as gross instead of net, or include COGS in operating expenses. The Context field lets you specify that “revenue” means net revenue after refunds, that “operating expenses” excludes COGS, or that “gross margin” is calculated as (revenue – COGS) / revenue.
The same data flow can also send the prepared data to multiple destinations. A dashboard for recurring KPI monitoring and Claude for conversational analysis can both run from the same dataset, without duplicating the setup.
Claude reads both the prepared structure and the context before it starts analyzing. Instead of trying to interpret a raw export with no definitions, it works with a dataset where the column names, metrics, time periods, and business logic are already clear.
Step 2. Connect Coupler.io to Claude
Once the dataset is ready, set Claude as the AI destination in Coupler.io and follow the instructions to connect Coupler.io to Claude.
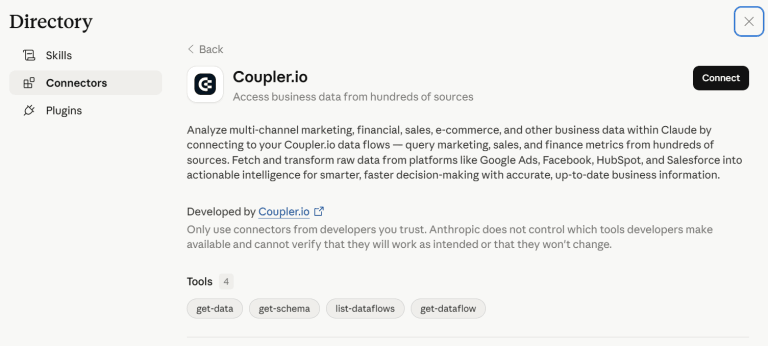
After the connection is set up, Claude can query the prepared dataset through Coupler.io instead of relying on a one-time spreadsheet upload.
To keep the dataset up-to-date, enable the Automatic data refresh in Coupler.io and set up the schedule.
For monthly reporting, you can refresh the dataset after the books are closed. For revenue, cash flow, or expense monitoring, you may prefer a daily or weekly refresh.
This is what turns the setup from one-off AI analysis into a repeatable AI financial reporting workflow. Claude can answer questions based on refreshed financial data, while Coupler.io handles the data preparation, structure, and calculations behind the scenes.
Connect your financial data to Claude with Coupler.io
Get started for freeUse Claude’s native connectors or MCP
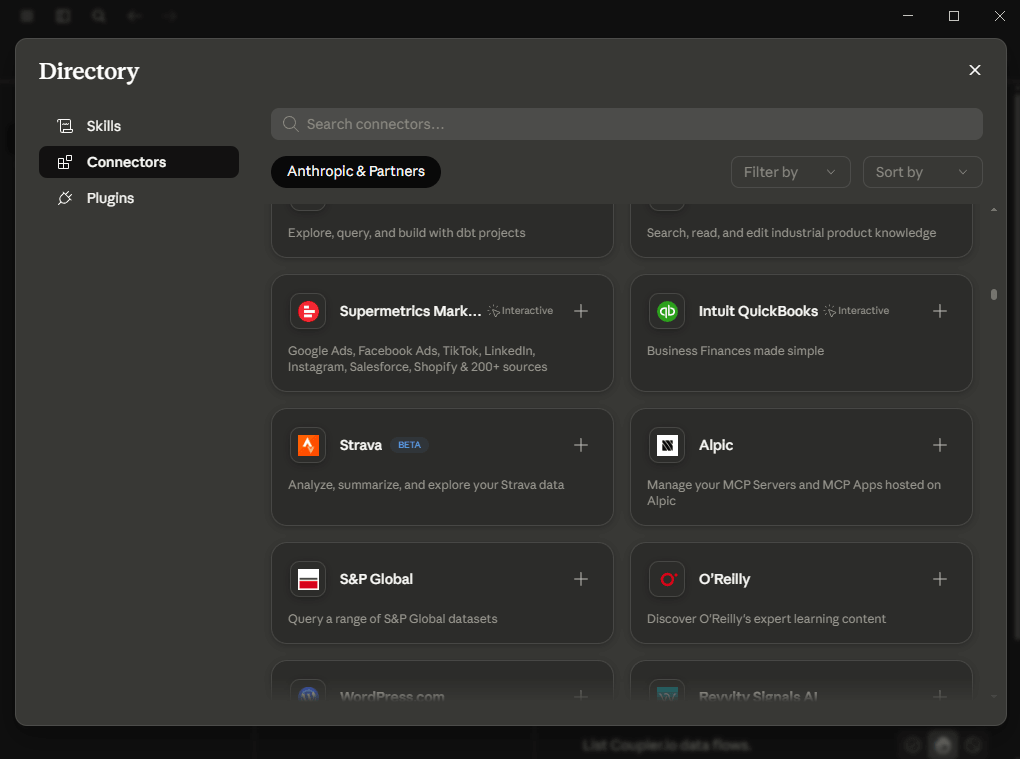
If your financial data is already available through a tool Claude supports natively like QuickBooks MCP or Xero MCP, you can connect it directly through Claude’s connector directory without setting up Coupler.io. This works for quick exploration or a one-time question about a specific dataset.
For sources Claude does not support, you can export a CSV or Excel file from your accounting tool and upload it manually. This is the fastest way to get started if you need an answer right now and don’t plan to repeat the analysis.
Both approaches have the same limitations. Claude receives the data in whatever structure the source system provides, with no transformation layer, no metric definitions, and no scheduled refresh. If column names are unclear or metrics overlap, Claude has to guess. If the source data changes, you need to reconnect or re-upload manually. And there is no Analytical Engine running calculations before Claude interprets the results, so the math depends entirely on Claude’s own processing.
For one-off analysis, that may be enough. For recurring financial reporting where accuracy and freshness matter, that’s where Coupler.io fills the gap.
Financial analytics in Claude: reports you can automate
Now let’s see what Opus or Sonnet models in Claude can actually do for your financial reporting. It’s not that I’m comparing models, a marketer from Coupler.io recently shared his experience with different AI models. But I’m going to show the actual finance workflows you can create in Claude and automate with Coupler.io.
1) Monthly P&L reporting
A monthly P&L report shows whether the business is becoming more or less profitable over time. It usually includes revenue, COGS, gross profit, operating expenses, and net income.
The report gives the numbers, but the harder part is explaining what changed and why. This is where Claude can help. Instead of manually reviewing each line item, I can ask Claude to summarize the overall performance and focus on the metrics that matter most.
Example prompt:
“Using the dataset, summarize monthly P&L performance from Jan 2025 to Jun 2026. Focus on revenue trend, gross margin, operating expenses, and net income.”
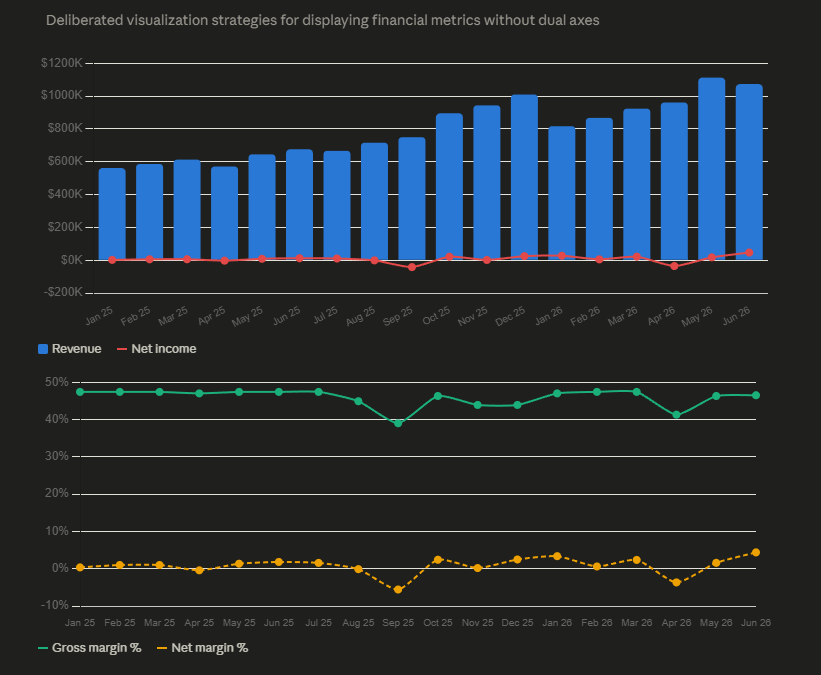
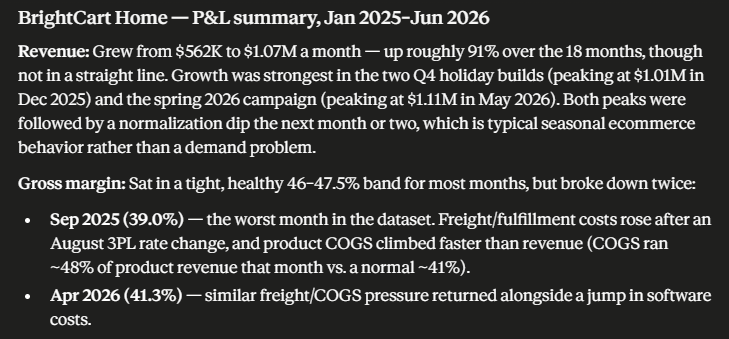
In my dataset, Claude identified that revenue grew from around $562K in Jan 2025 to $1.07M in Jun 2026, with stronger months around the Q4 holiday period and the spring 2026 campaign. It also pointed out that gross margin stayed mostly stable, but dropped in specific months when fulfillment and COGS pressure increased.
I can also ask follow-up questions without creating another spreadsheet. For example:
“Drill into the latest month, Jun 2026. What were the main drivers of net income, and how did it compare with the prior month?”
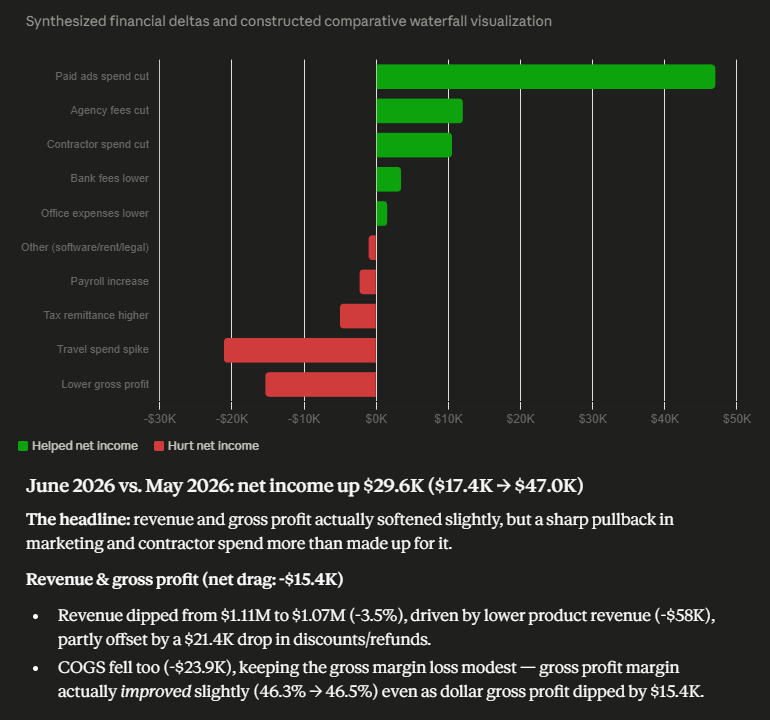
Claude compared Jun 2026 with May 2026 and showed that net income improved from $17.4K to $47.0K. Revenue was slightly lower, but operating expenses dropped enough to improve profitability.
It identified lower-paid ads, agency fees, and contractor spend as the main positive drivers, while higher travel, taxes, and payroll partially offset the improvement.
This makes the P&L review more practical. Instead of manually checking every account, I can start with a high-level summary, then drill into the month, category, or account that needs more explanation.
Coupler.io can bring monthly P&L data from QuickBooks, Xero, Google Sheets, or another accounting source into Claude. The important part is that the dataset is already organized by month, account, revenue, expenses, margin, and net income, so Claude can focus on explaining the results instead of interpreting a messy export.
2) Budget vs. actual analysis
Budget vs. actual analysis shows where financial performance differs from the plan. It helps answer questions like which accounts went over budget, whether revenue missed targets, and what caused the biggest variance.
Example prompt:
“Compare actuals vs. budget by month and account. Which accounts have the largest dollar variances and percent variances?”
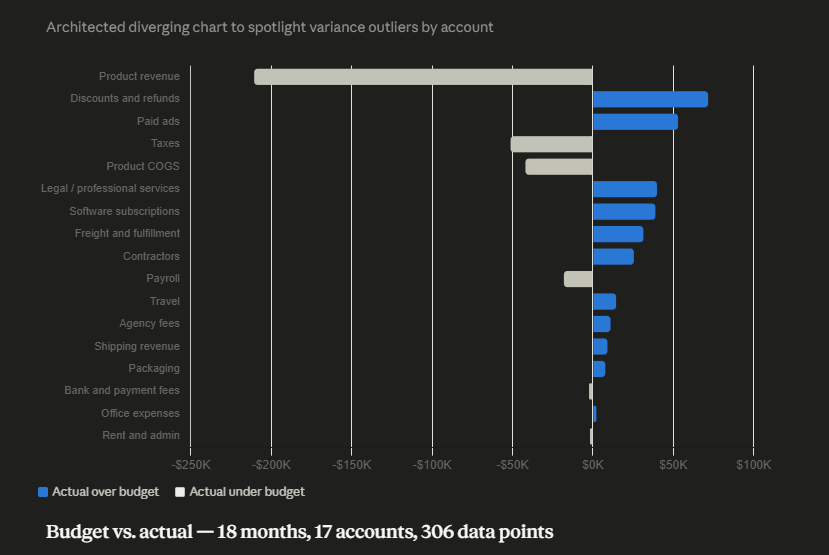
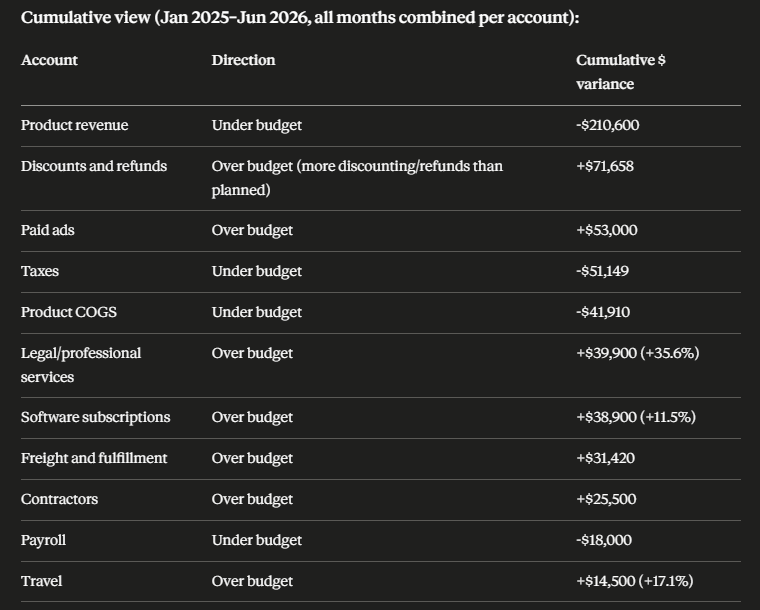
Claude analyzed 18 months of data across 17 accounts and highlighted the biggest differences. Product revenue was under budget by around $210.6K overall, while discounts and refunds were over budget by around $71.7K. On the expense side, paid ads, legal/professional services, software subscriptions, freight and fulfillment, and contractors were the main over-budget accounts.
Claude separated recurring budget issues from one-time spikes. Paid ads and freight looked like categories where the budget assumptions may need to be reviewed. Legal fees, travel, and software renewals looked more like specific one-off or timing-related items.
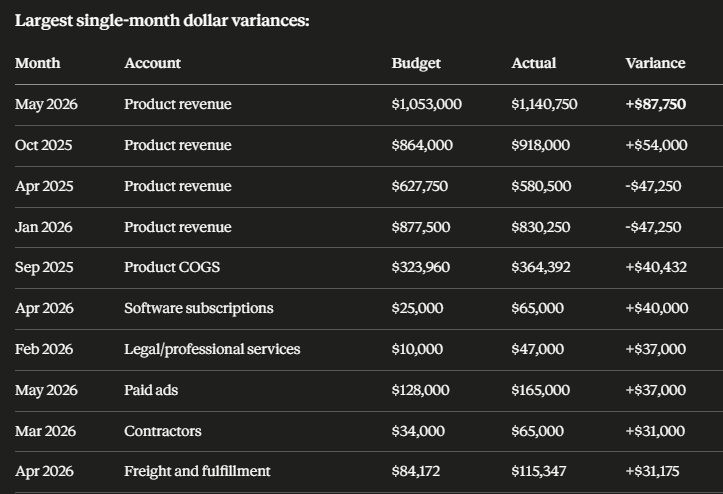
Claude also identified the largest single-month variances, such as product revenue in May 2026, product COGS in Sep 2025, software subscriptions in Apr 2026, and legal/professional services in Feb 2026. This makes it easier to decide which variances need management attention.
For this report, Coupler.io is useful because the actuals and budget often live in different places.
Coupler.io can bring both into one prepared dataset, so Claude can compare the numbers by month and account without manually matching spreadsheets.
3) Cash flow analysis
Cash flow analysis shows how money moves in and out of the business. This is different from P&L analysis because a profitable month can still create cash pressure if large payments, taxes, inventory purchases, or payout delays happen at the same time.
You can use this to identify positive and negative cash flow months, find the lowest cash balance, and explain what caused the pressure.
Example prompt:
“Analyze the cash_flow_monthly sheet. Which months had positive vs. negative net cash flow, and what was the lowest closing cash balance? Keep your answer actionable and concise.”
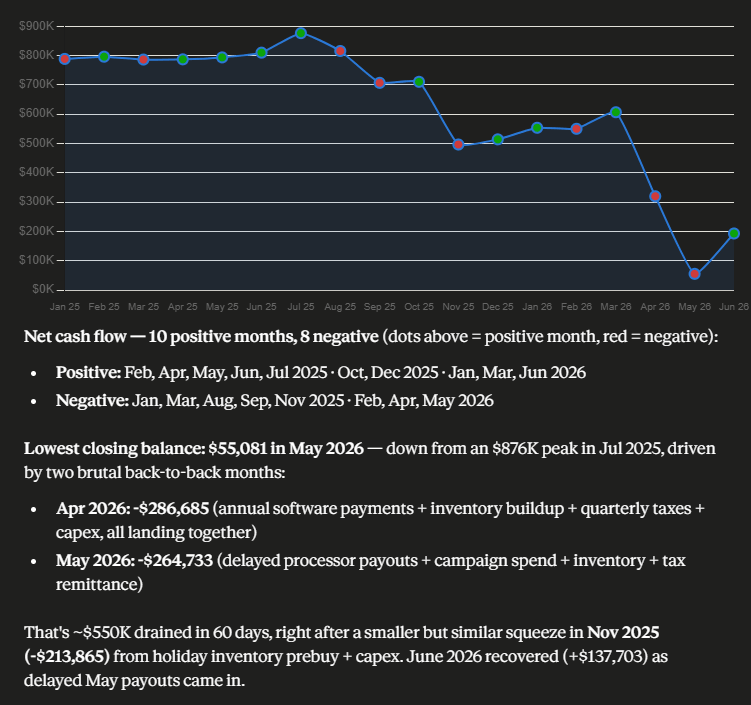
Claude identified 10 positive cash flow months and 8 negative cash flow months. It also found that the lowest closing cash balance was around $55K in May 2026, down from a peak of around $876K in Jul 2025.
The useful part was the explanation. Claude showed that the cash issue was not mainly caused by weak revenue. It came from timing: annual software payments, inventory buildup, quarterly taxes, capex, delayed processor payouts, and campaign spend landing close together.
I then asked Claude to turn this into a leadership-ready summary:
“Based on this, prepare a short cash flow risk summary for leadership, including the top 3 drivers of cash pressure and recommended follow-up questions.”
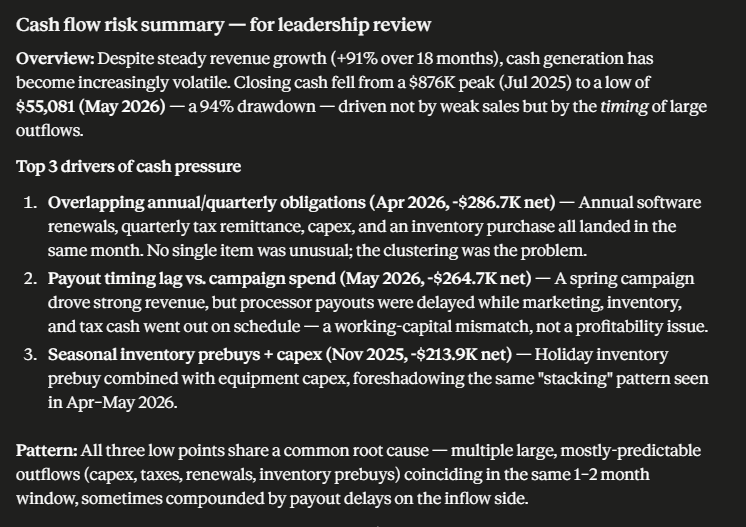
Claude then produced a short risk summary that explained the main cash pressure points. It identified overlapping annual and quarterly obligations, payout timing lag, and seasonal inventory prebuys as the top drivers.
It then turns the cash flow report into an action item: forecast months where large outflows overlap and plan payment timing or credit needs earlier.
Cash flow often depends on timing across different systems, not just the P&L and Coupler.io can bring together data from accounting tools, bank feeds, payment processors, or spreadsheets.
Once the monthly cash flow dataset is prepared, Claude can focus on explaining the liquidity movement and the risks behind it.
Set up multi-source financial reporting in Claude
Talk to Coupler.io4) Expense and anomaly detection
Expense and anomaly detection helps finance teams review transactions before closing the month.
The goal is not only to find fraud. It is also to catch duplicates, unusual vendor payments, one-time spikes, and costs that need documentation before the report is finalized.
Example prompt:
“Review the expense_transactions sheet and identify transactions finance should review before closing the month. Keep your answer actionable and concise.”
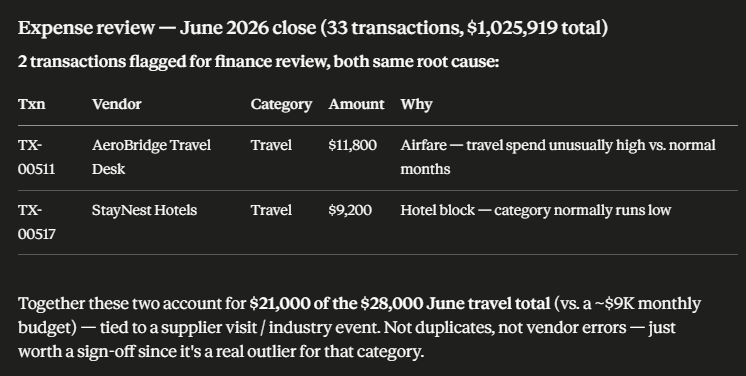
Claude reviewed the June 2026 transactions and found two items worth checking: an $11.8K airfare charge and a $9.2K hotel block. Both were tied to travel, and together they explained most of the June travel spike.
Claude also noted that they did not look like duplicates or vendor errors, but they still needed sign-off because the category was much higher than normal.
I then asked a follow-up question:
“Compare anomaly-flagged transactions against normal spending patterns. Which anomalies are most material by dollar amount?”
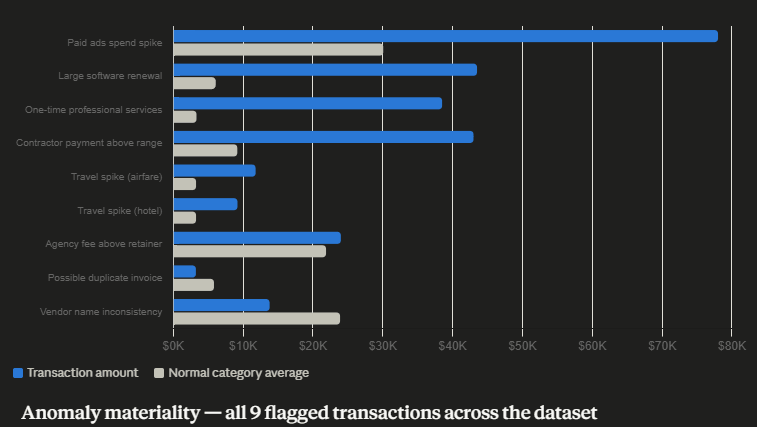
Claude ranked the flagged transactions by materiality. It showed that the largest issue was a paid ads spike in May 2026, followed by a large software renewal in April, one-time professional services in February, and a contractor payment above the normal range in March.
This helped separate routine review items from anomalies that could affect the monthly close or budget commentary.
Anomaly review needs transaction-level detail, not only monthly totals. Coupler.io can prepare expense data from accounting tools, corporate cards, bank feeds, or spreadsheets with vendor, category, department, amount, payment method, and approval context.
That gives Claude enough detail to compare current transactions against normal spending patterns and highlight the items finance should review.
Best practices for reliable financial reporting in Claude
You can use Claude for financial report analysis to get things done quicker, but the output still depends on the quality of the data and the way the question is asked. Before using it for recurring finance reports, I would keep a few things in mind:
- Start with clean data. Use structured tables with clear columns for dates, accounts, categories, departments, actuals, budgets, cash inflows, cash outflows, and notes. Avoid messy exports with merged cells, unclear labels, duplicate rows, or mixed formats.
- Define your metrics. Claude needs context for how the business calculates revenue, gross margin, operating expenses, net income, cash flow, or EBITDA. Account mapping and metric definitions make the analysis more reliable.
- Ask specific questions. Instead of asking Claude to “
analyze financial performance,” include the period, the metrics, and the output you want. For example: “Compare actuals vs. budget for Q2. Focus on revenue, COGS, operating expenses, and net income. Highlight the largest unfavorable variances.” - Use follow-up questions. The first answer is usually the starting point. Ask Claude to drill into specific months, separate recurring issues from one-time items, explain large variances, or turn the findings into a leadership summary.
- Review the final output. Claude for financial services can summarize and explain financial data, but the finance team should still check the numbers, assumptions, and wording before sharing the report.
- Keep the data refreshed. Manual uploads work for one-off analysis, but recurring reporting needs updated data. If the source numbers change, Claude needs access to the latest version of the dataset.
This is where Coupler.io helps make the workflow repeatable. You can connect your financial data sources, prepare the dataset, refresh it on a schedule, and connect it to Claude for analysis. Claude then becomes the layer for asking questions, explaining changes, and turning financial data into report-ready AI-driven insights.
To automate AI-powered financial reporting with Claude, start by creating a Coupler.io data flow and connecting your financial data to Claude.