A lot of guides will tell you PostgreSQL can be used as a data warehouse. But can it really handle the reporting needs of a marketing, finance, or ecommerce team, and keep your data fresh without manual exports? In this guide, you will find what a PostgreSQL data warehouse actually offers for reporting and how to set one up step by step with Coupler.io keeping your data flowing in automatically.
Can PostgreSQL be used as a data warehouse?
Yes. PostgreSQL can work as a data warehouse, though it was not purpose-built for analytics the way BigQuery or Snowflake are.
PostgreSQL is a relational database management system (RDBMS). It stores data in structured tables and lets you query them with SQL. As one of the most widely used open-source databases, many teams already run it as their application database.
The PostgreSQL Global Development Group has maintained the database actively for decades. This long track record gives you a stable tooling, a mature ecosystem, and a large community to lean on.
PostgreSQL as a data warehouse vs. regular database
PostgreSQL can handle two very different types of database work.
PostgreSQL as a regular database handles online transaction processing (OLTP). These are frequent write operations like INSERT, UPDATE, and DELETE happening throughout the day. For example, every time a customer places an order, updates their profile, or a product inventory count changes, that is an OLTP operation.
PostgreSQL as a data warehouse handles analytical queries (OLAP). These are read-heavy queries that summarize and compare data across large historical datasets. For example, pulling twelve months of revenue by product category, comparing ad spend across channels, or tracking how customer cohorts behave over time.
You can technically run both on the same PostgreSQL server, but it is not a good idea in practice. Heavy reporting queries compete with your app for the same CPU and memory, and one slow dashboard query can affect your users. The recommended approach is to run a separate PostgreSQL instance for analytics.
That difference in workload is exactly why a warehouse exists.
Strength and limitations
On the surface, PostgreSQL is free, open source, and runs on SQL your team already knows. It connects natively to popular Business Intelligence (BI) tools like Looker Studio, Power BI, and Tableau.
However, there are limitations worth knowing upfront.
- Row-based storage. PostgreSQL stores and reads data row by row. When a report only needs two columns, it still reads the entire row. At scale, that adds up. Warehouses like BigQuery and Snowflake use columnar storage instead, storing and reading only the columns a query actually needs, which makes analytical queries significantly faster.
- Single-server ceiling. PostgreSQL runs on a single server. When you need more capacity, you upgrade that server rather than adding more. There is no built-in way to automatically spread the load across multiple machines.
- Maintenance overhead. PostgreSQL uses multiversion concurrency control (MVCC) to handle concurrent reads and writes. Over time, this leaves old row versions behind. These need regular cleanup through vacuuming. Autovacuum handles this automatically, but it needs monitoring as your tables grow. Backups also need to be scheduled and tested regularly.
These are real trade-offs, but for most small-to-mid-sized analytics workloads, they are manageable.
For teams using PostgreSQL as a data warehouse, a common practical challenge is getting data from their business apps in the first place. PostgreSQL does not connect to tools like HubSpot, Shopify, or QuickBooks on its own. Coupler.io solves this by syncing data from 400+ data sources automatically, so the pipeline runs without anyone triggering it manually.

Integrate data from 400+ sources to PostgreSQL with Coupler.io
Get started for freePostgreSQL data warehouse architecture
Data moves from sources, through a staging area, into the warehouse repository, sometimes through data marts, and out to the analytics tools your team actually opens. The diagram below maps that pattern to a PostgreSQL data warehouse setup.
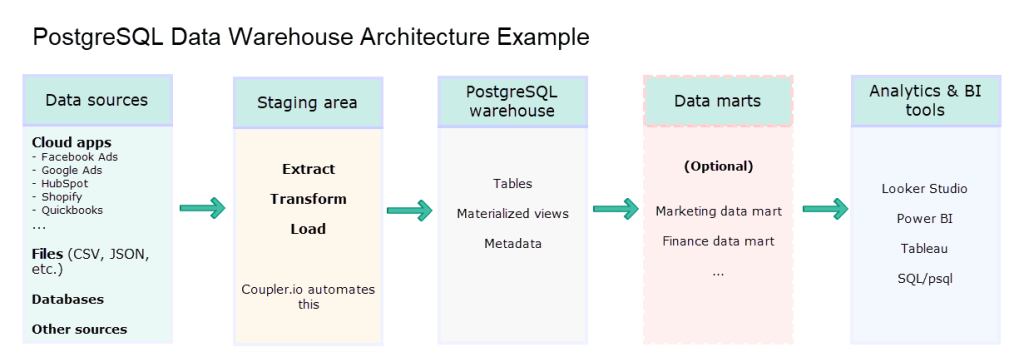
Data sources
Your business data is rarely in one place. Cloud apps like Facebook Ads, Google Ads, HubSpot, Shopify, and QuickBooks each hold a different piece of the picture. Files like CSV exports and JSON feeds add more. Operational databases contribute transactional data. Other sources, APIs, third-party tools, or internal systems, fill in the rest.
To get a complete view, you need to pull all of them into your warehouse.
Staging area
Before reaching the warehouse, data passes through a staging area. This is a temporary layer where it is extracted from your sources, validated, and prepared for loading.
Traditional ETL transforms data before loading it into the warehouse. PostgreSQL setups commonly flip that order (ELT). Raw data lands in staging tables first, then gets transformed there with SQL.
Coupler.io automates the extraction and loading step on a schedule, and even applies transformations like filtering, joining, or aggregating data before it lands.
Some organizations use a data lake as a larger-scale version of this same staging idea, holding raw data of any format and size before it reaches the warehouse.
The PostgreSQL warehouse repository
This is the central layer, holding different objects like:
- Tables that hold data that lands straight from staging.
- Summary data, like monthly revenue by channel, lives in materialized views.
- Metadata, like the structure that defines your tables and other objects.
- Views and stored procedures that hold your business logic.
- Foreign keys, constraints, and triggers to keep your data accurate.
This repository is the single source of truth your whole organization queries from.
Data marts (optional)
A data mart is a focused slice of the warehouse built for one team. A sales team queries their sales mart. A finance team queries their finance mart. Each mart holds only what that team needs, shaped around the questions they ask most
In a typical PostgreSQL setup, data marts are implemented as views or materialized views in a dedicated schema.
Data marts matter more at a larger scale. Most small-to-mid-sized PostgreSQL warehouses are already fast enough without them. They earn their place once a warehouse grows large enough to slow down team-level reporting.
Analytics and BI tools
Looker Studio, Power BI, and Tableau all connect to PostgreSQL natively. Analysts may query the warehouse directly with SQL, while business users read dashboards built on clean and ready-made views.
PostgreSQL data warehouse capabilities that matter for reporting
Once you commit to PostgreSQL as a warehouse, here is what you actually get.
Data integrity
Good reports start with data you can trust. PostgreSQL enforces that at the database level.
Constraints
Constraints are rules that prevent invalid data from entering your tables. Types include primary keys, foreign keys, and NOT NULL.
In a warehouse, use them selectively. Data arriving from an OLTP system or a cleaned staging area is already consistent, so heavy constraint enforcement adds overhead without much benefit. Primary keys on dimension tables are the minimum. Foreign keys on fact tables are optional and often skipped, relying instead on upstream data quality checks.
Triggers
Triggers run automatically whenever data is inserted or updated. In a warehouse, a common use is audit logging, recording when a row was last modified and by which process. This helps with debugging and incremental load tracking. Like constraints, use them sparingly on large tables since they add overhead to every row operation.
ACID compliance
ACID compliance means your data operations are reliable, even when things go wrong. If a load fails partway through, nothing gets committed, so you never end up with half-loaded data. Once a load succeeds, it stays committed permanently, and every rule you defined, like foreign keys or NOT NULL, still holds. Even while multiple processes read and write at the same time, each one sees a consistent, uninterrupted view of the data.
Built-in features that support reporting
Beyond data integrity, PostgreSQL has built-in tools for query performance, data flexibility, and reusable reporting logic.
- Indexes help PostgreSQL find the right rows without scanning entire tables. The most useful types for a data warehouse include:
- B-tree for filtering and sorting by dates, IDs, or categories. PostgreSQL creates a B-tree index by default when you run CREATE INDEX.
- GIN for querying inside JSONB columns or running full-text searches.
- GiST for geospatial queries.
- BRIN for large append-only fact tables like orders or events, where data arrives in time order. BRIN indexes are small and fast for date range scans.
- Partitioning divides large tables into smaller segments, typically by date. A quarterly revenue report on a partitioned table scans only the relevant months, not the entire table.
- Stored procedures encapsulate reusable SQL logic that runs inside the database. In a warehouse, they are commonly used to run transformations, refresh materialized views in sequence, and apply business rules consistently.
- Window functions perform aggregate and ranking calculations over partitions of a result set, while keeping every row intact. While GROUP BY collapses rows into summaries, window functions do not. This makes them better suited for running totals, rankings, and period-over-period comparisons.
- CTEs (Common Table Expressions) are named temporary result sets defined within a query. They break complex SQL into logical, named steps, making queries easier to read, test, and debug.
- Materialized views save a query result as a physical snapshot on disk. PostgreSQL reads that snapshot instead of rerunning the query each time. A scheduler can trigger a refresh to keep the data current.
- JSONB is a native data type for storing and querying semi-structured data like API responses.
- Full-text search is built in for any free-text field, like product descriptions or notes.
- FDW (Foreign Data Wrappers) let PostgreSQL treat tables in another database as if they were local. Say your customer support tickets live in a separate MySQL database. Instead of exporting that data and loading a copy into your warehouse, you can query it directly from PostgreSQL through an FDW, joining it with your sales data in the same query. This is useful when a small amount of external data needs to stay in sync with its source rather than being duplicated and refreshed on a schedule.
Ecosystem depth
PostgreSQL has a rich extension ecosystem that expands what it can do beyond the core engine:
- PostGIS adds geospatial support, useful for tracking delivery zones or analyzing performance by region.
- pg_cron runs job scheduling directly inside PostgreSQL, so you can call stored procedures or run SQL on a defined schedule without an external tool.
- pg_duckdb brings DuckDB’s columnar-vectorized analytics engine directly inside PostgreSQL. If you are familiar with DuckDB, this lets you run DuckDB-powered analytical queries on your PostgreSQL data without moving it anywhere.
- pgvector adds vector similarity search, useful for semantic search, product recommendations, and AI-driven analytics inside your warehouse.
- Citus, an open-source extension now maintained by Microsoft, distributes data across multiple servers for horizontal scale and adds a columnar storage option for large tables.
- TimescaleDB optimizes PostgreSQL for time-series data, useful for metrics, event tracking, and any data with a time dimension.
These features work best when your data pipeline delivers clean, consistently structured data. Coupler.io’s pre-load transformations, including filtering, aggregating, and joining before data lands in PostgreSQL, reduce cleanup work inside the warehouse and make downstream reports more reliable.
Headline: Keep your PostgreSQL warehouse fresh with Coupler.io
Try it freeHow to build a data warehouse in PostgreSQL for reporting
The steps below show how to build a data warehouse with PostgreSQL and keep your data fresh for consistent reporting.
Step 1. Set up an instance for analytics
Create a new PostgreSQL instance dedicated to analytics. If you already run PostgreSQL as your application database, it is best practice to set up a separate instance rather than adding a new database to the same server.
A managed PostgreSQL service from AWS, Google Cloud, or similar is a good starting point for most teams. It handles automatic backups, recovery, and failover, so you are not managing that infrastructure yourself
Step 2. Design a schema with fact and dimension tables
Most warehouse schemas start with a star schema. It has one fact table at the center and dimension tables branching directly from it. Queries are simple joins with no intermediate tables.
A snowflake schema is a variation where dimension tables have their own sub-dimensions. For example, a DimProduct table might link to a separate DimCategory table, or a date dimension might link to a separate fiscal calendar table. Use snowflake when those hierarchies are large, frequently reused, or need to be updated independently. For most small-to-mid-sized warehouses, star schema is simpler and fast enough.
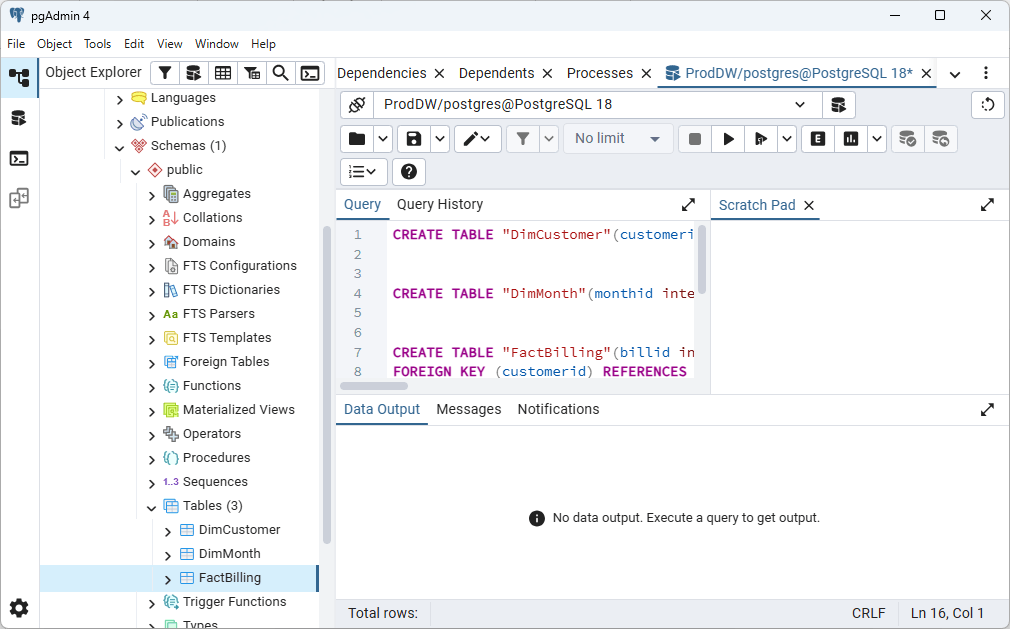
The following is a simple example of a star schema with three tables.
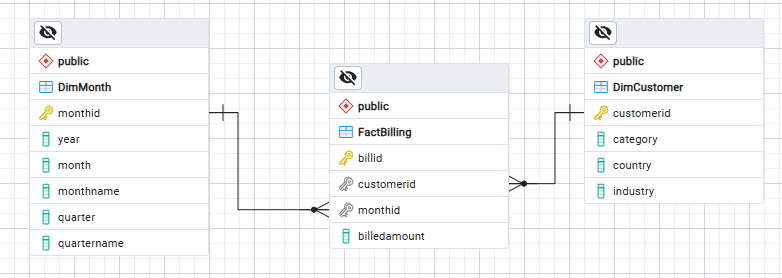
FactBilling holds one row per billing record, linked to DimCustomer via customerid and to DimMonth via monthid.
DimCustomer describes each customer by category, country, and industry.
DimMonth gives each billing period a quarter and year label.
In practice, data might come from a billing system like Stripe for the fact records and a CRM or internal database for the customer dimension. The exact sources depend on your case. Raw data from two separate apps like Stripe and HubSpot does not arrive with a shared customerid. The transformation step bridges that gap by joining the two staging tables on a field both systems reliably store, typically email address.
Step 3. Load your data with an automated pipeline
Coupler.io is a no-code data integration platform and AI analytics that connects your business apps to PostgreSQL. You can pull data from Google Ads, Meta Ads, Salesforce, HubSpot, Shopify, QuickBooks, Google Analytics 4, and more. In total, you get over 400 PostgreSQL integrations and over 15 other destinations in one connector. This platform handles extraction, optional pre-load transformations, and scheduled refreshes, so data arrives clean and the pipeline runs without anyone triggering it.
Here is how to set it up.
Create a data flow
Create a new data flow in Coupler.io and choose the data source you want to connect. You can also use the widget below and click Get started for free to sign up for a Coupler.io account.
Select your source, such as Stripe for billing data or HubSpot for customer data. Configure what data to pull and apply any pre-load transformations, like filtering canceled invoices or selecting only active contacts.
To import data into PostgreSQL, enter your connection credentials: host, port, database name, user, and password. Set the target schema and table name.
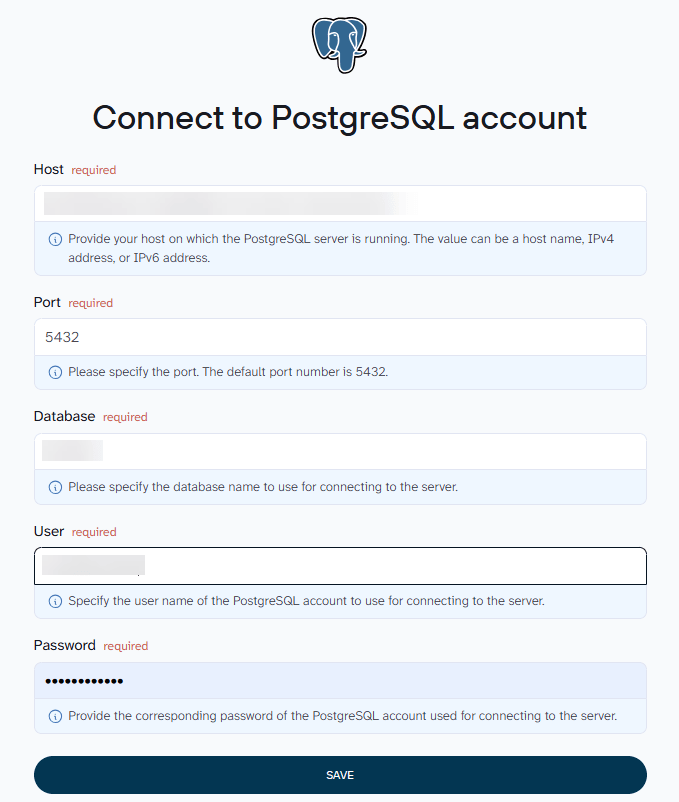
For the Import mode, use Replace for dimension tables like DimCustomer, which should always reflect the current state. Use Append for fact tables like FactBilling, which accumulate historical records over time.
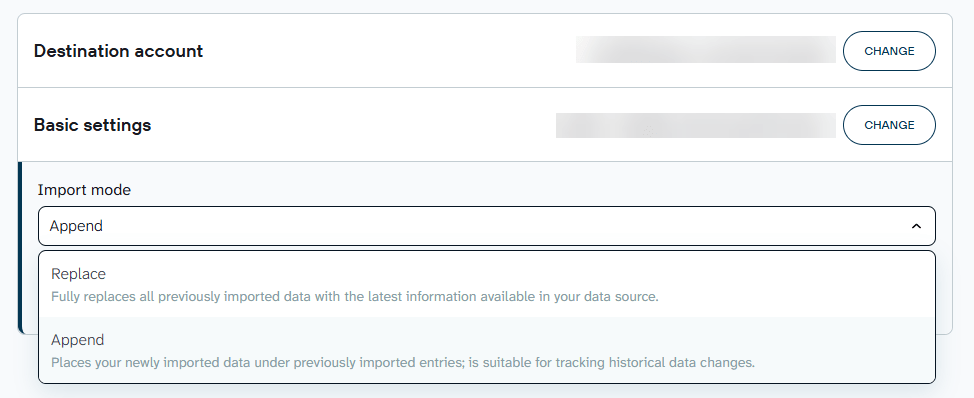
Click Save and Run to complete the connection and trigger the first load.
Set a refresh schedule
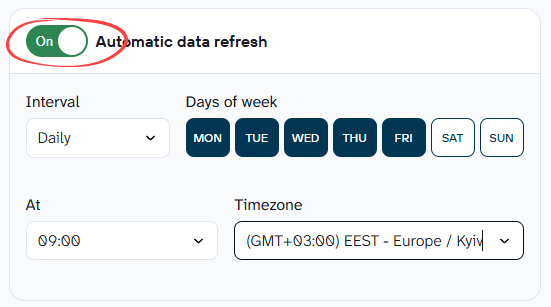
After the first successful run, set a refresh schedule. Daily is a good default for most business reporting. Coupler.io runs the pipeline automatically from that point on.
Step 4. Build reporting-ready views
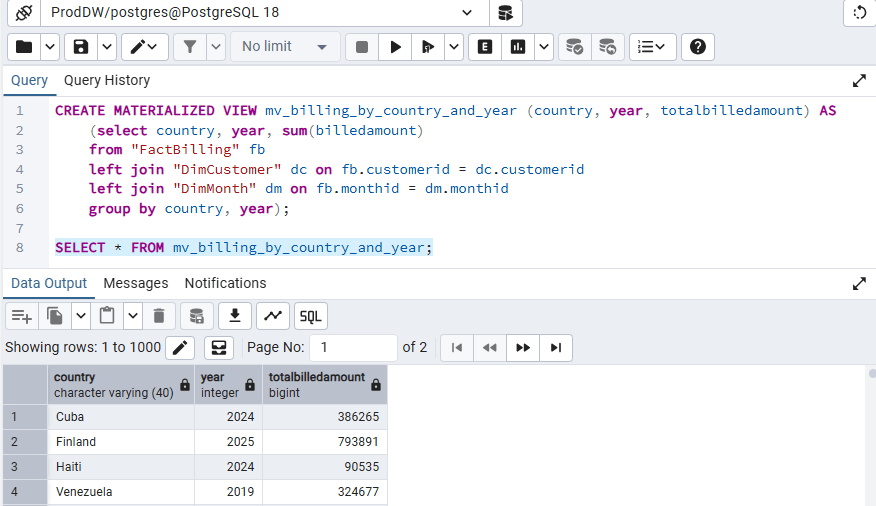
In this step, you turn staging tables into objects your dashboards will actually query.
You can connect Power BI directly to your staging tables and build the joins there. But creating views or materialized views inside PostgreSQL is a better approach. The logic lives in one place, every tool that connects to the warehouse queries the same definition, and you avoid rebuilding the same joins in multiple dashboards.
Views are saved SQL queries. You query a view like a table, and PostgreSQL runs the underlying logic against the live data each time. The data is always current and the logic stays in one place.
Materialized views go one step further. They store the query result on disk, so instead of recalculating across all rows every time a dashboard loads, PostgreSQL reads the stored result. This is especially useful for large tables or complex joins.
Here is an example that summarizes total billed amount by country and year:
CREATE MATERIALIZED VIEW mv_billing_by_country_and_year (country, year, totalbilledamount) AS
	(select country, year, sum(billedamount)
	from "FactBilling" fb
	left join "DimCustomer" dc on fb.customerid = dc.customerid
	left join "DimMonth" dm on fb.monthid = dm.monthid
	group by country, year);
Once the materialized view exists, run the statement below to populate it with refreshed data:
REFRESH MATERIALIZED VIEW mv_billing_by_country_and_year;
You can schedule the pg_cron to run after your pipeline is expected to finish, so the view always reflects the latest loaded data.
Step 5. Connect your reporting tool
If you use Power BI, click Get Data and select PostgreSQL database. Enter your server host and database name, then click OK. After that, enter your database credentials and click Connect.
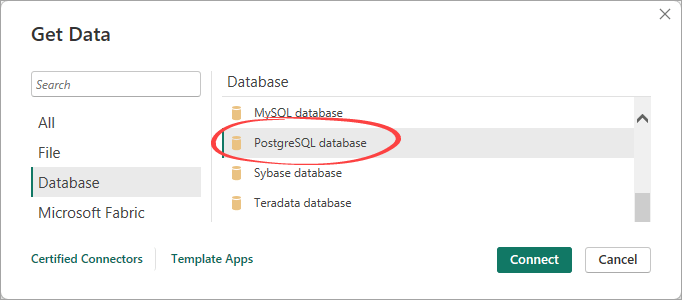
Once connected, Power BI shows a list of available tables and views.
Note that Power BI does not display PostgreSQL materialized views in this list. To access one, expand Advanced options when setting up the connection and enter a native SQL query:
SELECT * FROM mv_billing_by_country_and_year;
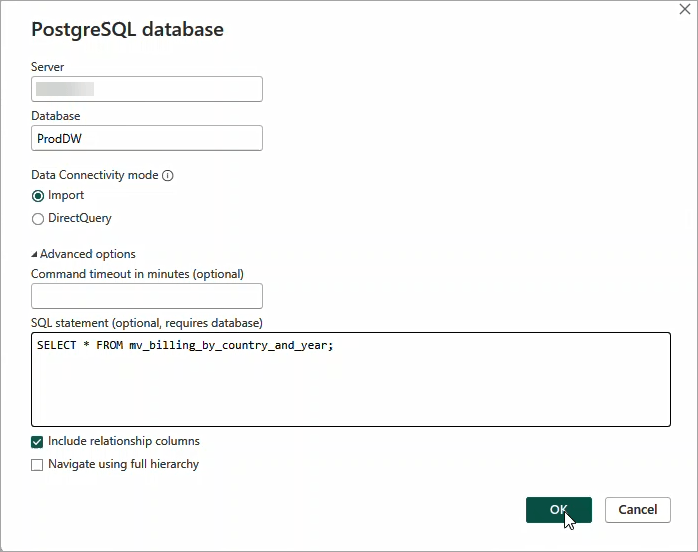
Power BI loads the precomputed result and treats it as a flat table. You will see a data preview. Click Load, then build your charts on top of it.
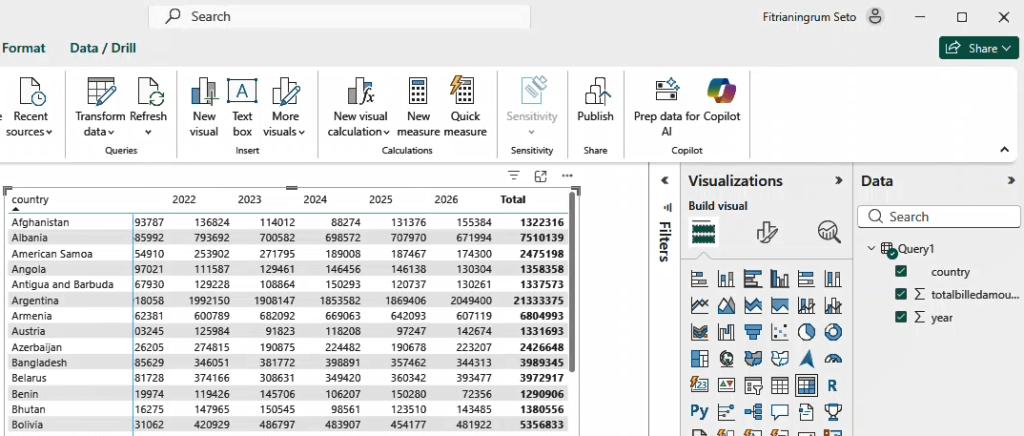
With the pipeline and the materialized view both refreshing automatically on schedule, the dashboard stays up-to-date without anyone doing anything manually.
Headline: Connect 400+ sources to any warehouse with Coupler.io
Get started for freePostgreSQL as data warehouse: what the day-to-day looks like
Here is how a team actually works with PostgreSQL as a data warehouse day to day.
Different people in your team may interact with the warehouse in different ways.
SQL analysts connect directly using a client like pgAdmin, DBeaver, or psql. They write queries, build views, and run transformations. They also build and maintain reports in BI tools for the rest of the team.
Business users access the warehouse through reports and dashboards built using tools like Google Data Studio, Power BI, or Tableau. They filter, sort, and drill down into the data to find answers and make decisions, without writing a single line of SQL.
QuickBooks revenue dashboard in Power BI
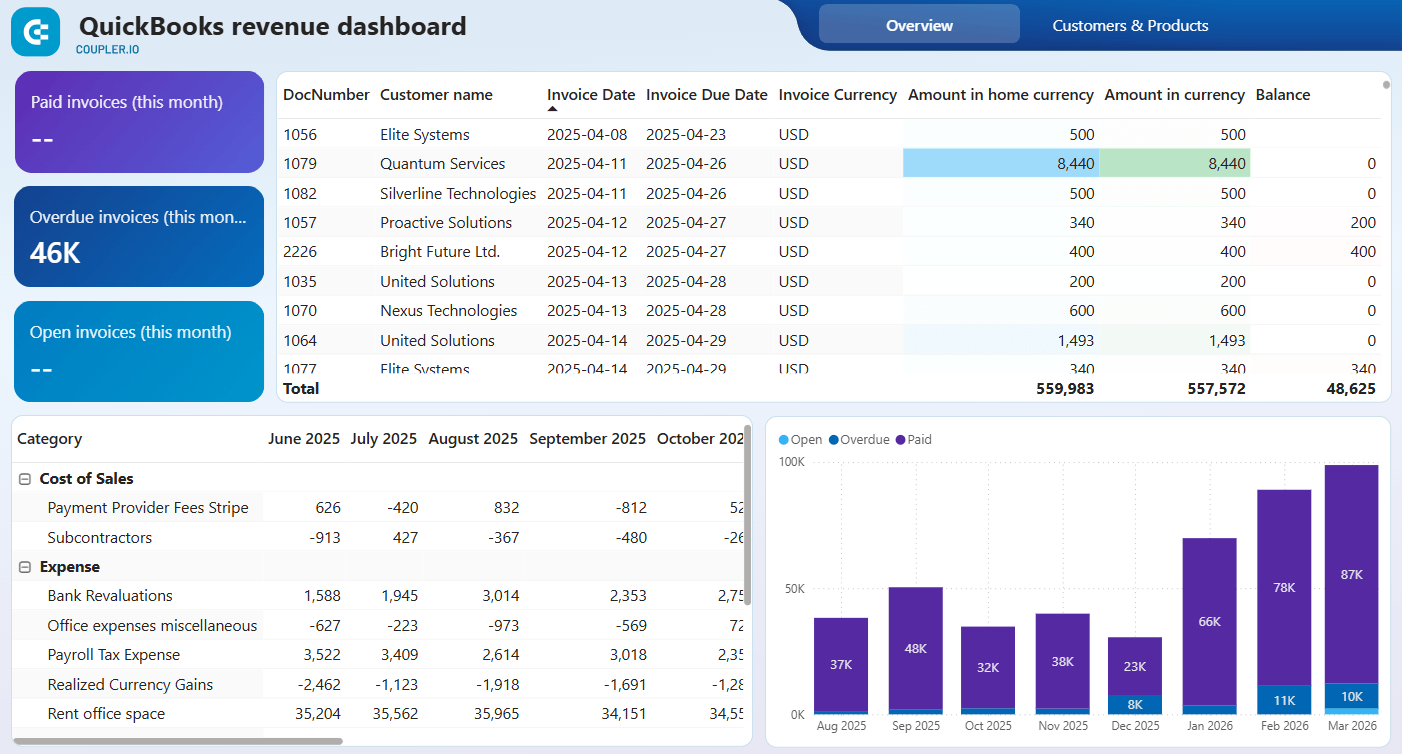 Preview dashboard
QuickBooks revenue dashboard in Power BI
Preview dashboard
Why a data warehouse makes reporting easier
The core benefit is a single source of truth. Everyone queries the same data instead of instead of pulling separate app exports.
Below are a few short examples of what the warehouse makes easier, by team.
Marketing sees customer behavior across every platform in one place, because the warehouse already pulled it together. No more manually stitching numbers from five different ad accounts.
Sales can run trend analysis across months of pipeline data without waiting on an export. The data is already there, updated and ready to query.
Finance no longer spends a week gathering data from different systems before month-end reporting can even begin. It is already in the warehouse, structured and ready.
Ecommerce can join sales, inventory, and supplier data in a single query to spot stockouts and their revenue impact. That kind of cross-source data analysis is not possible when the data lives in separate systems.
Moreover, historical data accumulates automatically. You can always query any past period in the warehouse.
None of these benefits hold up if the data feeding the warehouse is out of date. Coupler.io keeps it fresh by syncing your apps on a schedule, so teams always see current numbers instead of old ones.
Headline: Sync your business apps to PostgreSQL with Coupler.io
Start for freePostgreSQL vs. BigQuery vs. Snowflake vs. Redshift: which warehouse fits your team?
Now that you know what PostgreSQL offers as a warehouse, it helps to see how it compares to the most popular alternatives.
One thing worth noting before you compare. Coupler.io loads data into all four options, PostgreSQL, BigQuery, Snowflake, and Redshift. The pipelines you build today work regardless of where you land.
| PostgreSQL | BigQuery | Snowflake | Redshift | |
| Storage model | Row-based | Columnar | Columnar | Columnar |
| Scaling | Single node, extensions help | Serverless, automatic | Compute and storage scale separately | Cluster-based, serverless option available |
| Cost | Free software, you pay for hosting | Pay per data scanned (on its default pricing model) | Pay per compute (credits) | Pay per node-hour (provisioned) or per active query time (serverless) |
| Maintenance | You manage it | Fully managed | Fully managed | Managed, some tuning expected |
| Best for | Small to mid data, tight budgets | Spiky or unpredictable query loads | Steady, heavy analytical workloads | Teams already on AWS |
A few notes on each:
- PostgreSQL is the only option here you manage yourself. That gives you full control and zero licensing cost, but also means you handle maintenance, backups, and scaling decisions.
- BigQuery is a fully managed cloud data warehouse that charges per query by the amount of data scanned. It is cost-effective for spiky or unpredictable workloads, but poorly written queries can get expensive quickly. Check out our BigQuery tutorial.
- Snowflake separates compute and storage, so you scale each independently based on what you actually need. It suits teams with steady, heavy analytical workloads.
- Redshift uses a PostgreSQL-compatible SQL dialect, so the query syntax feels familiar if your team already uses PostgreSQL. It is columnar and distributed, making it a natural step up for teams on AWS who have outgrown a single PostgreSQL instance.
PostgreSQL makes sense when:
- Your data is under roughly one terabyte (a directional guideline, not a hard rule)
- Your team is small to mid-sized
- Budget is a constraint
- You already run PostgreSQL somewhere in your stack
Consider moving on when:
- Data reaches multiple terabytes and queries stay slow despite partitioning and materialized views
- Many analysts query at the same time and concurrency becomes a bottleneck
- Maintenance overhead grows faster than your team can manage
When that point comes, migration is more manageable than it sounds. If your ingestion already runs through Coupler.io, switching to a new warehouse destination is a configuration change, not a rebuild. Most of the SQL logic you have built stays useful, though some queries may need minor adjustments to fit the new warehouse’s dialect.
Start for free with Coupler.io and connect 400+ data sources to PostgreSQL in minutes. Once connected, your data flows into PostgreSQL automatically on a schedule you set.