You were happy for a minute to see the number of leads Facebook ads generated this week. This is shattered when you realize that your ROAS has dropped immensely. Maybe you are spending more than ever to acquire a single lead. With more and more companies using Facebook ads to grow their businesses, it has become very dynamic.
The best part is Facebook provides detailed data on every ad campaign of the ad account, which can be analyzed and converted to reports. Even though Facebook Ad Manager has an ads reporting feature, it can overwhelm you with too much data and limited visualization options.
But the best tool for Facebook ads reporting can help you:
- Customize reports to meet your specific needs.
- Save time by automatically collecting data from your campaigns and creating reports for you.
- Measure the Facebook ad performance by providing insights into metrics, such as click-through rates, conversion rates, and cost per click (CPC).
But finding the right one for your needs can be tricky. This article has curated a list of the best Facebook Ads reporting tools.
The 10 best Facebook ads reporting tools for marketers & agencies
To help you avoid the hassle of searching for multiple tools and going through endless product demos, we’ve compiled a list of the industry’s top 10 Facebook Ads reporting tools. This way, you can easily find the right tool for your needs without wasting time on all the noise.
Coupler.io

Coupler.io is a powerful all-in-one reporting automation platform that streamlines data processing, analysis, and reporting. By integrating data from 60+ business apps, including Facebook Ads, you can save time and gain insights into your business. With Coupler.io, you can create live dashboards, automate reporting, and make data-driven decisions.
While Coupler can be considered a no-code ETL or ELT tool, it is a solution to turn raw data into meaningful reports. So, you can not only connect Facebook Ads to BigQuery, but also enjoy the data analytics services, from simple data automation to setting up advanced analytics and data management for your business. Not just integrating data, it also helps in analysis and visualization with an insightful and customized dashboard, making it the best tool for Facebook ads reporting.
Features of Coupler.io
60+ integrations: Coupler.io provides more than 60 apps available for connection. So, in addition to Facebook Ads to Excel integration, you can pull stats about Google Ads, Instagram Ads, and LinkedIn ads to optimize your reporting and analytics.
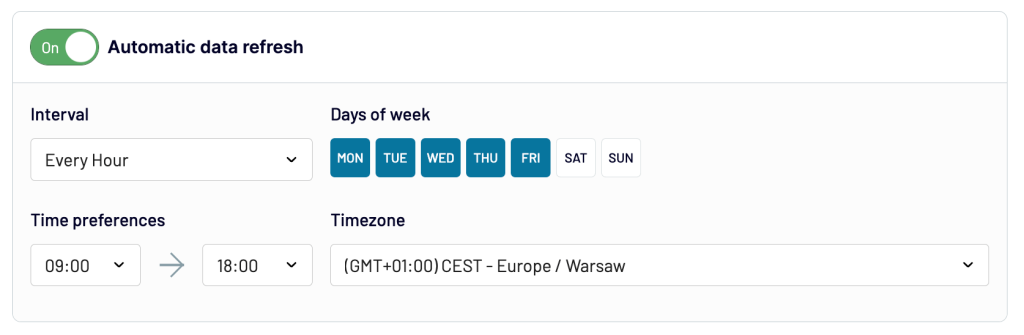
Automated data import: Set up an import schedule once and sit back to relax. Coupler will regularly update the import data and all the dashboards linked to it per your preferred date range and frequency.
WebHooks: Coupler allows you to trigger your imports based on specific apps or events. You can also set up your importers to trigger external events in return.
Data stitching: Is your data spread across different applications? Don’t even think of exporting data manually from all the apps. Instead, Coupler can put together data from different sources in seconds.
Data analytics consulting services: You can make informed decisions using up-to-date, real-time data. With Coupler.io, you can easily review your business’s growth and overall health quickly.
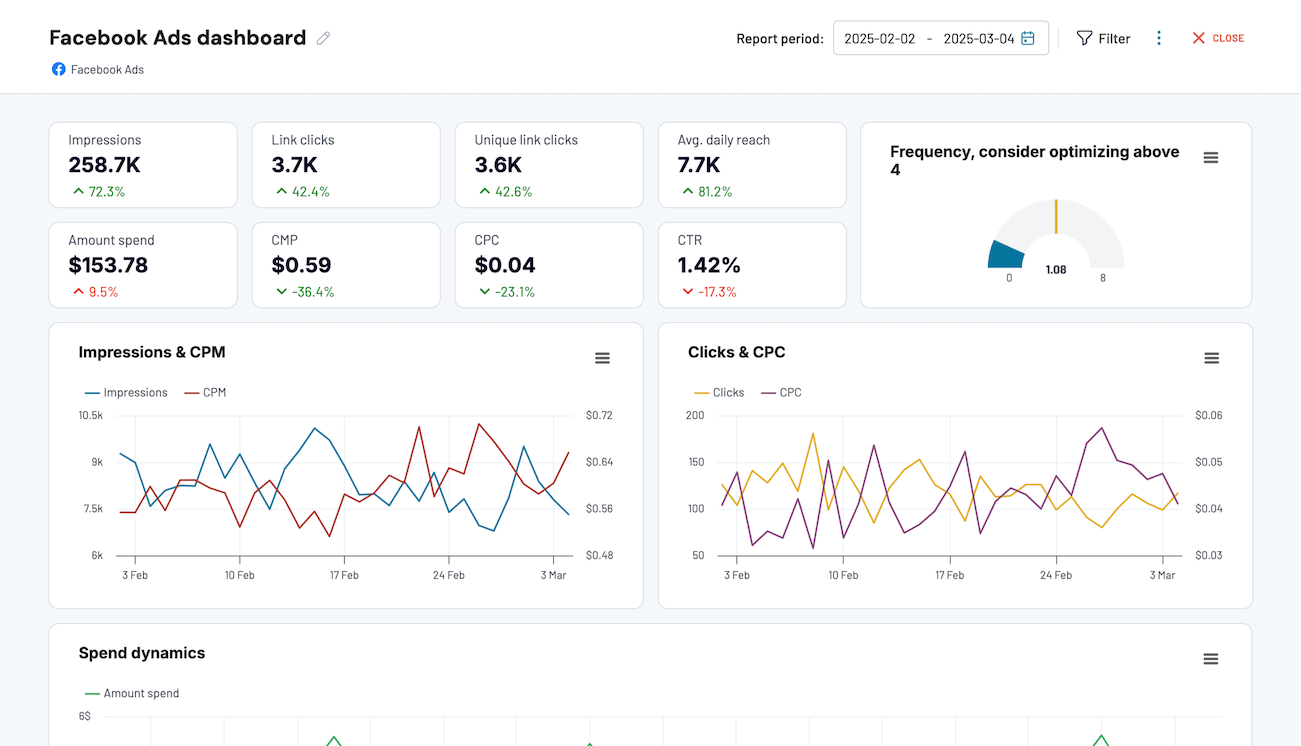
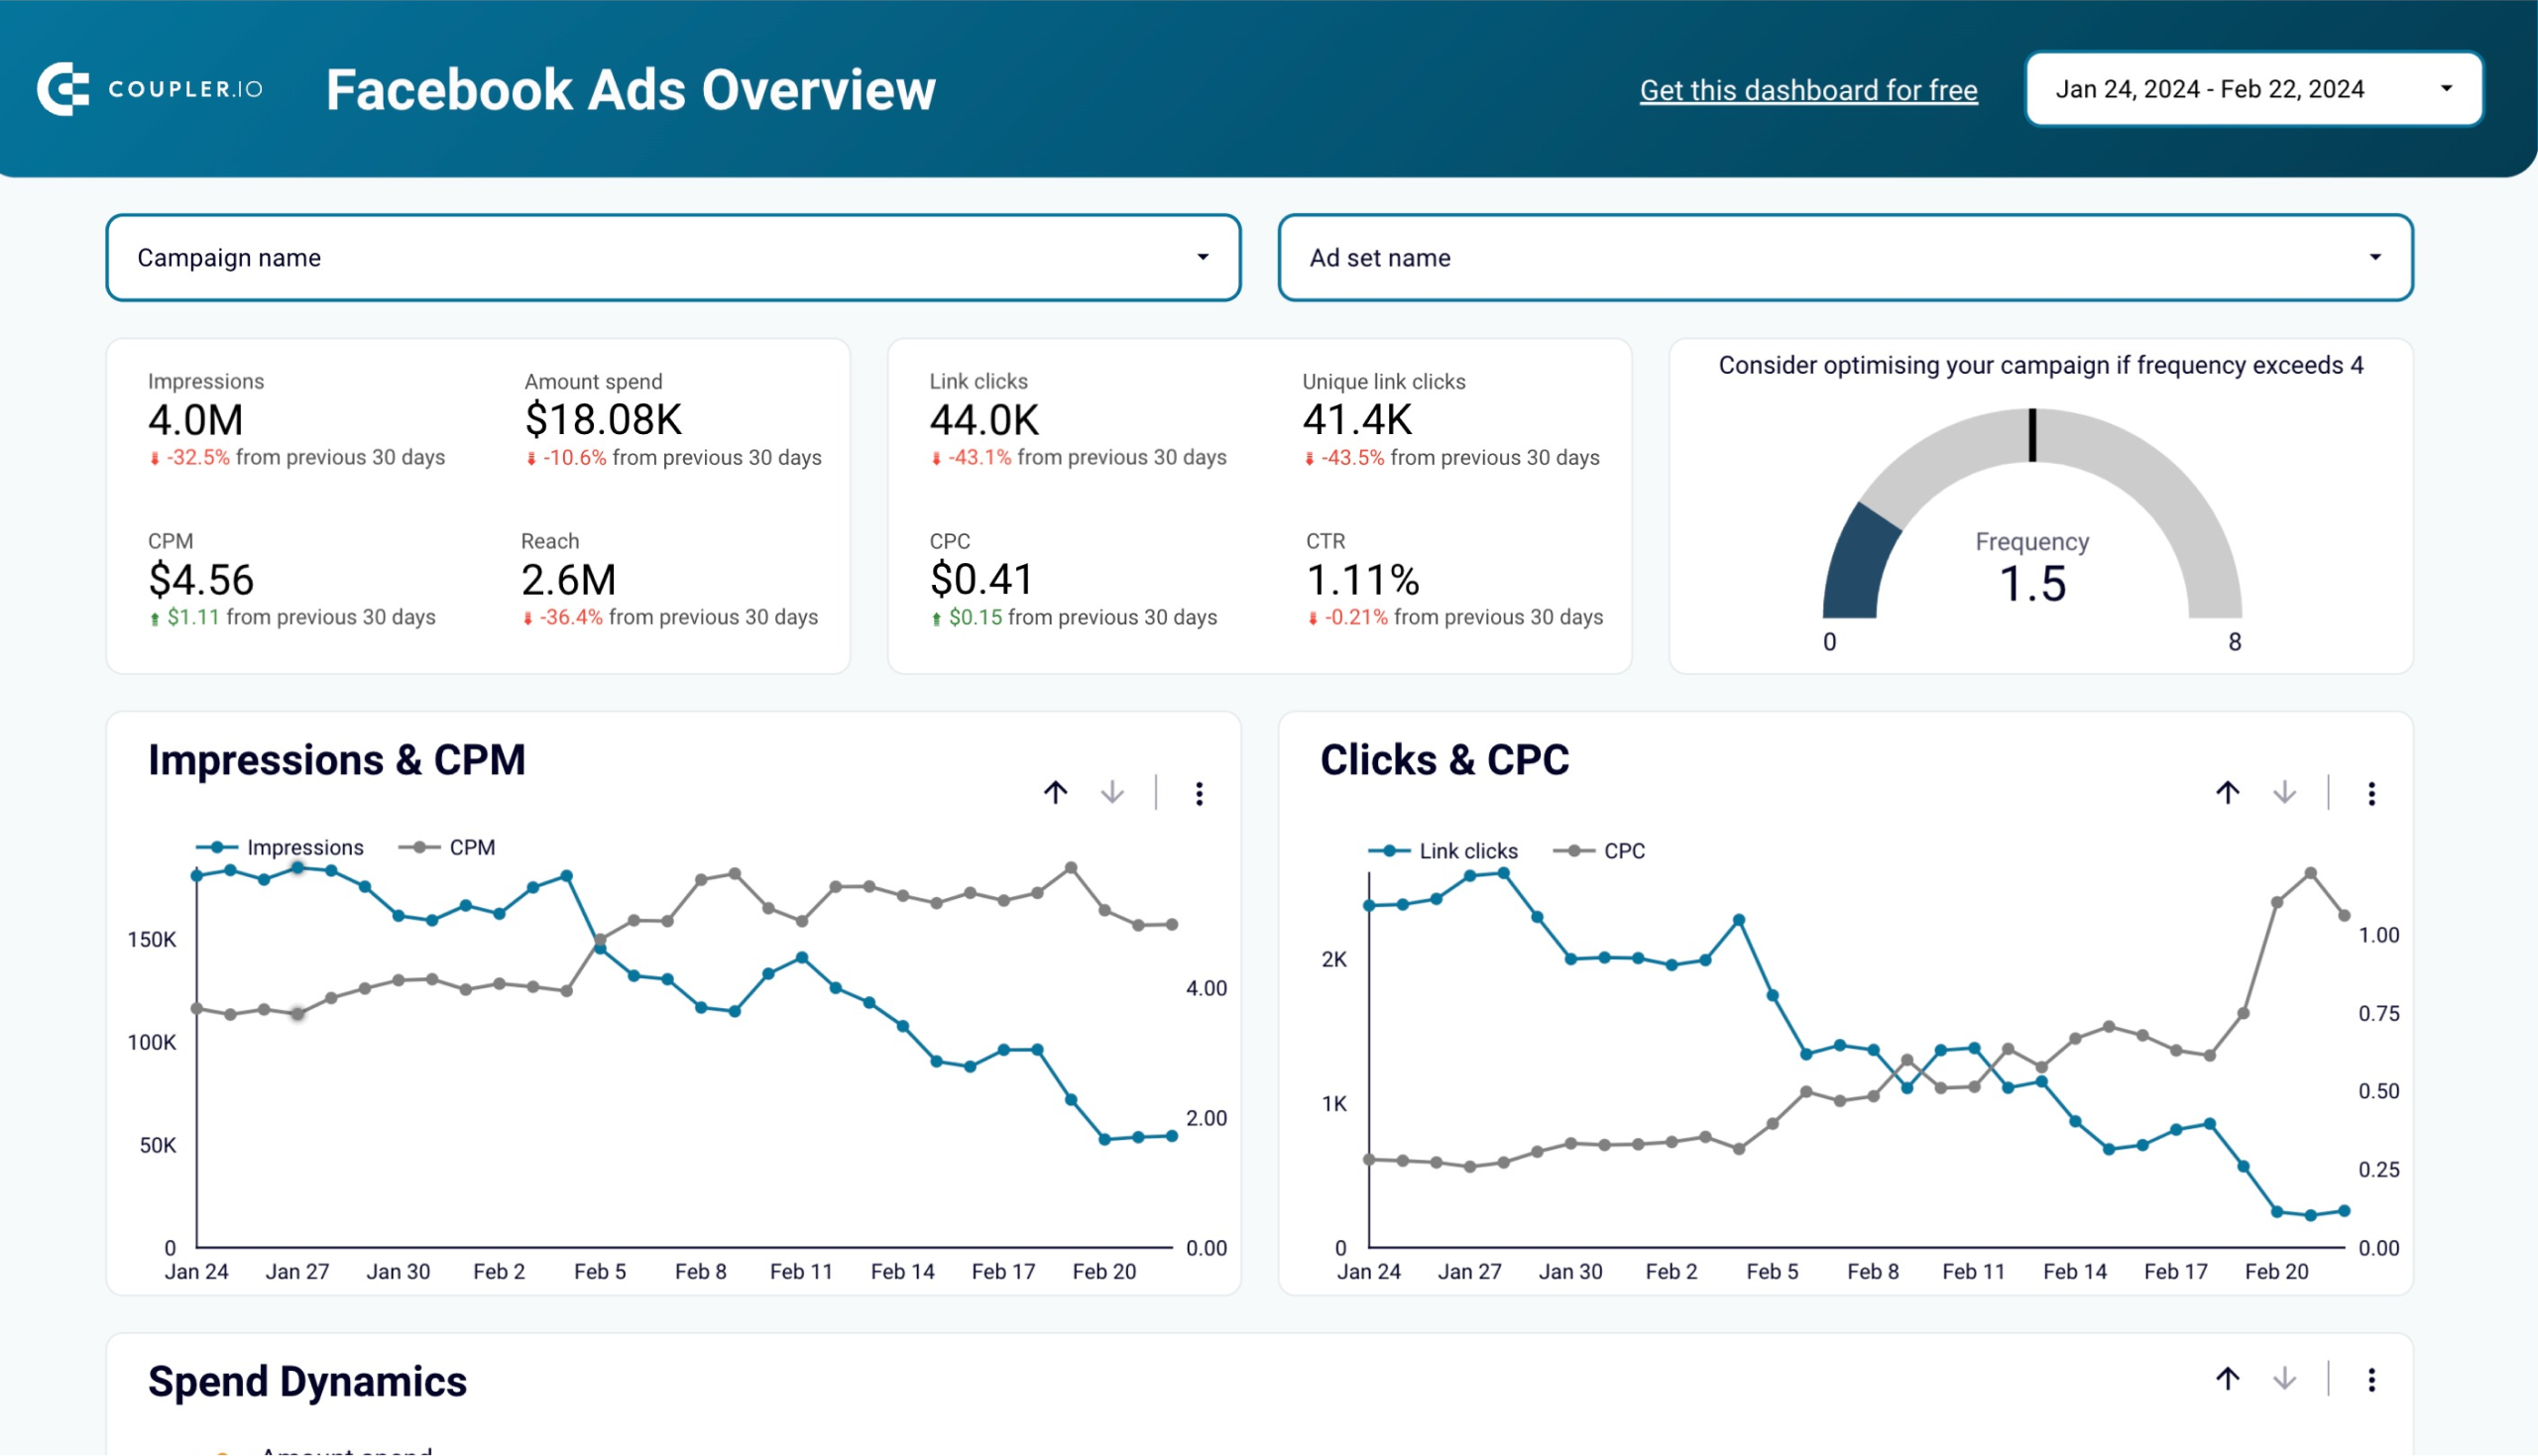
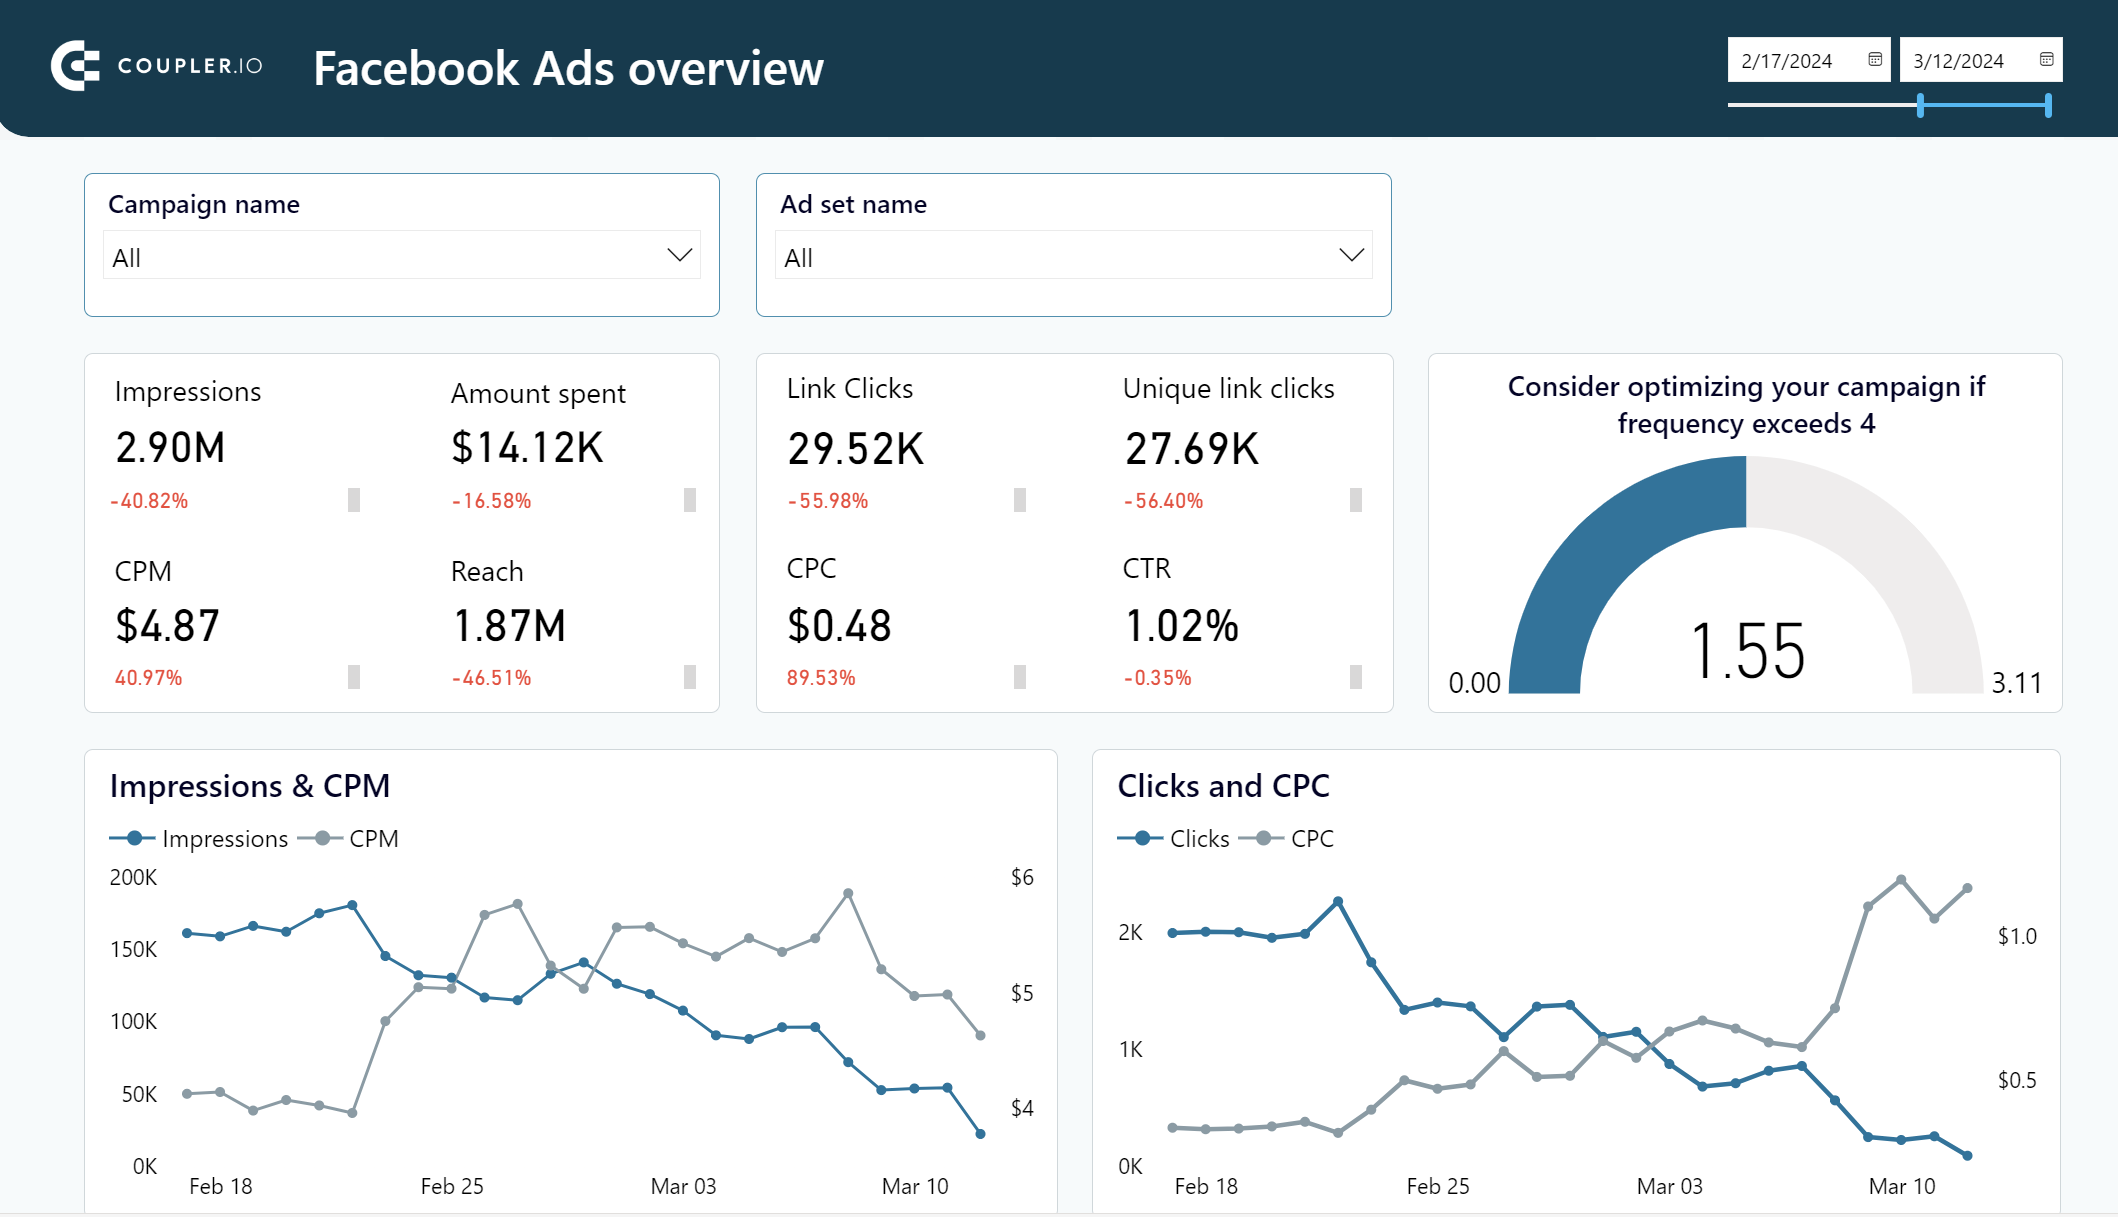
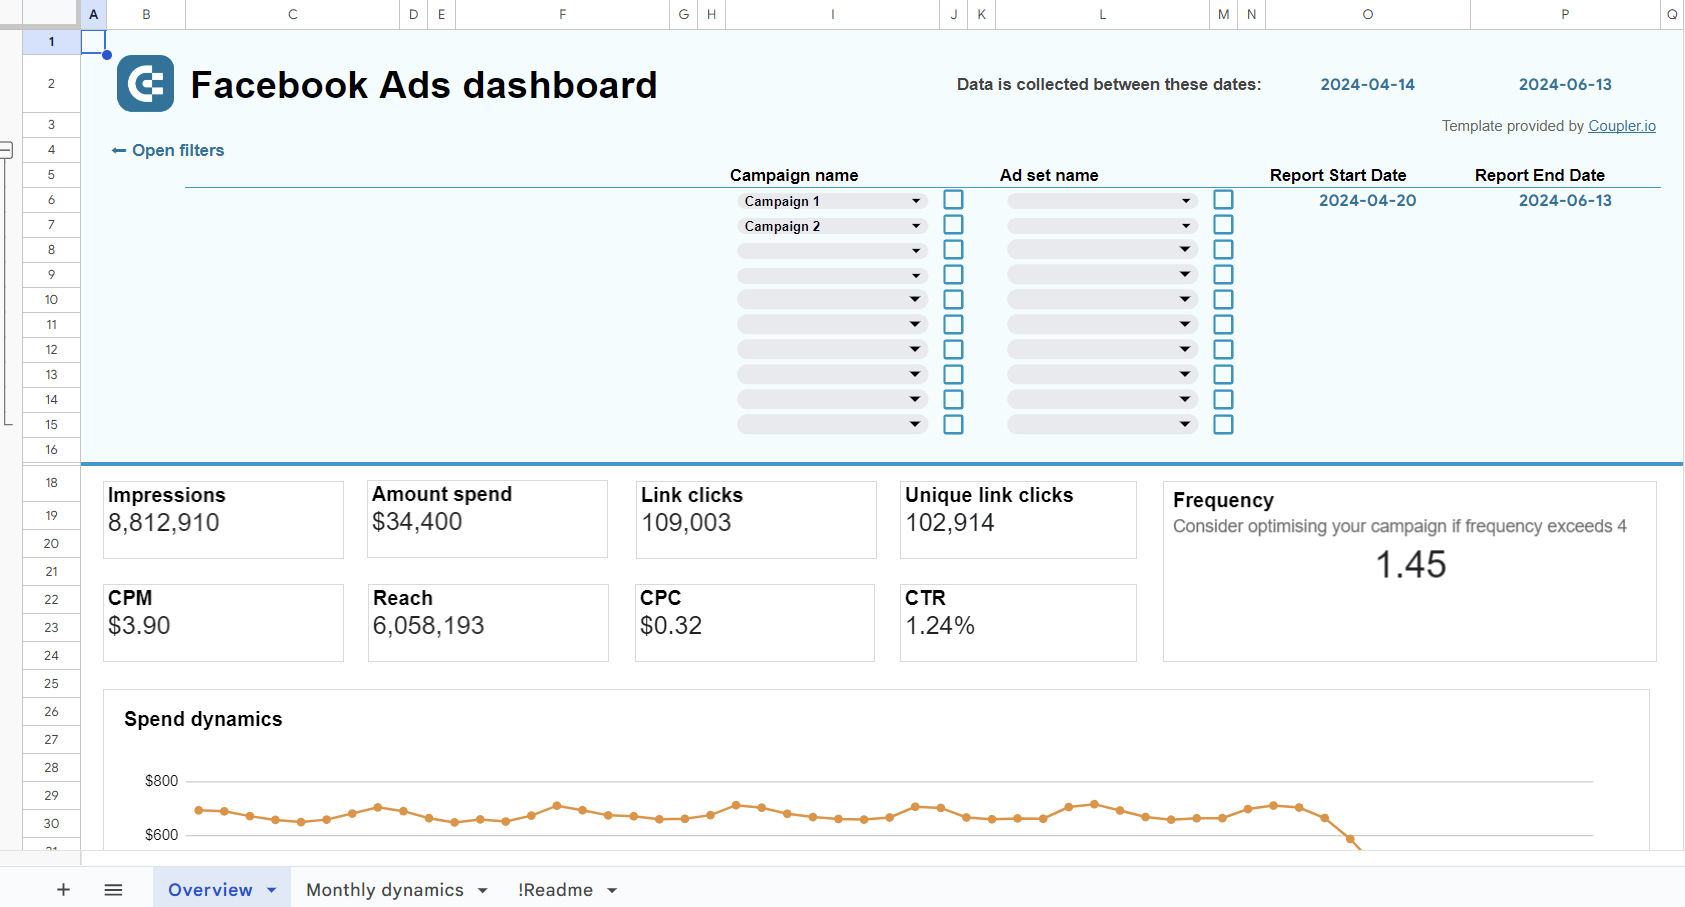
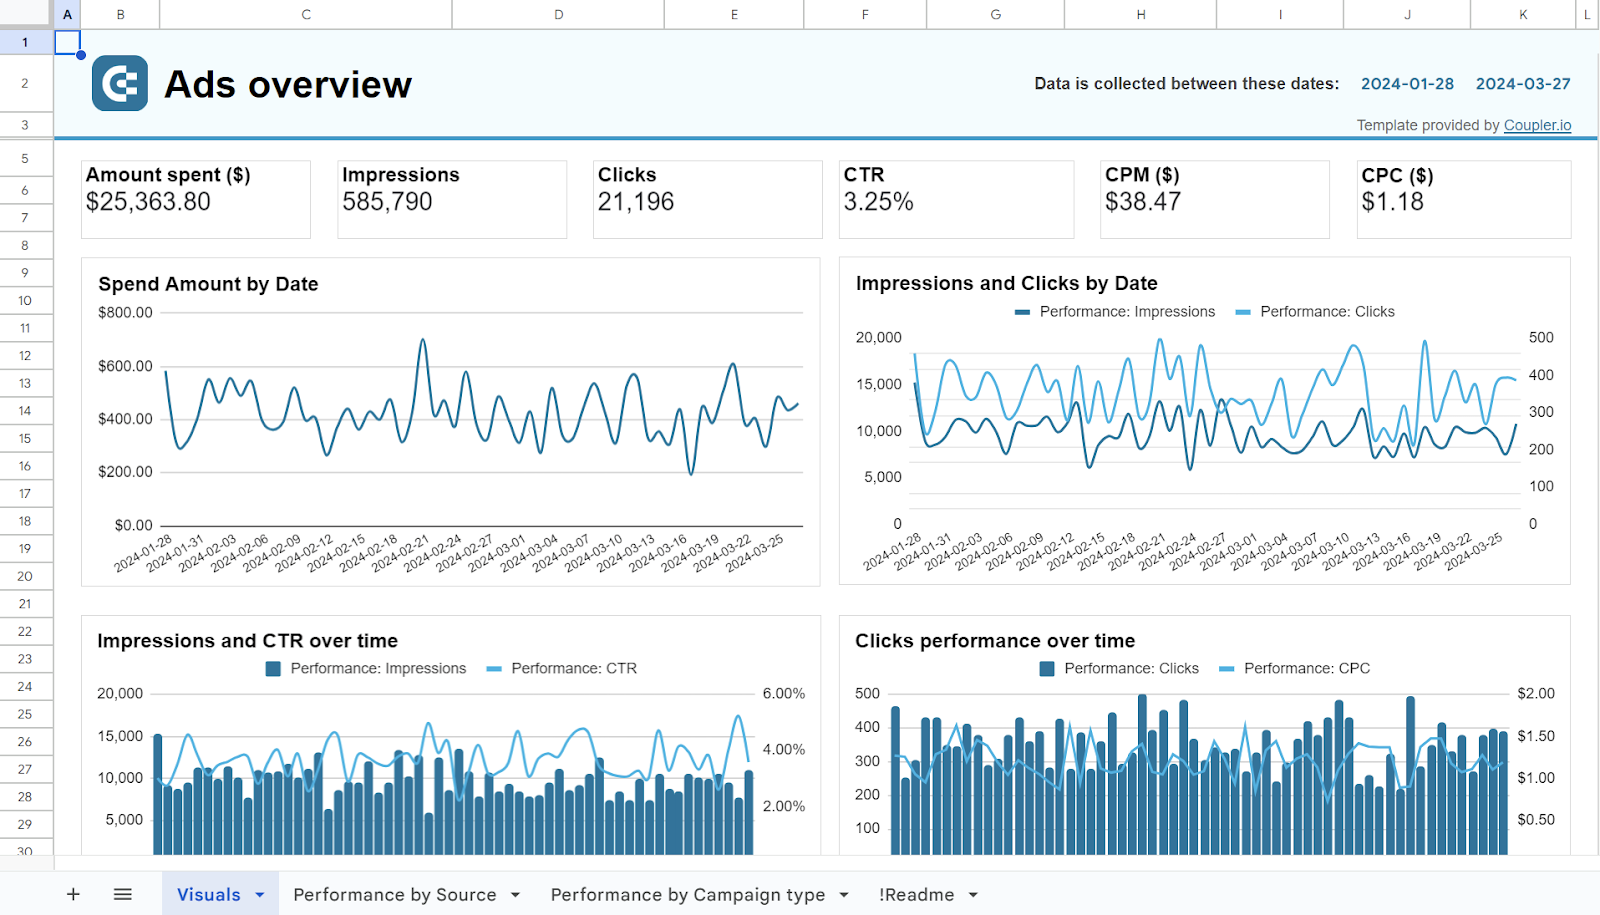
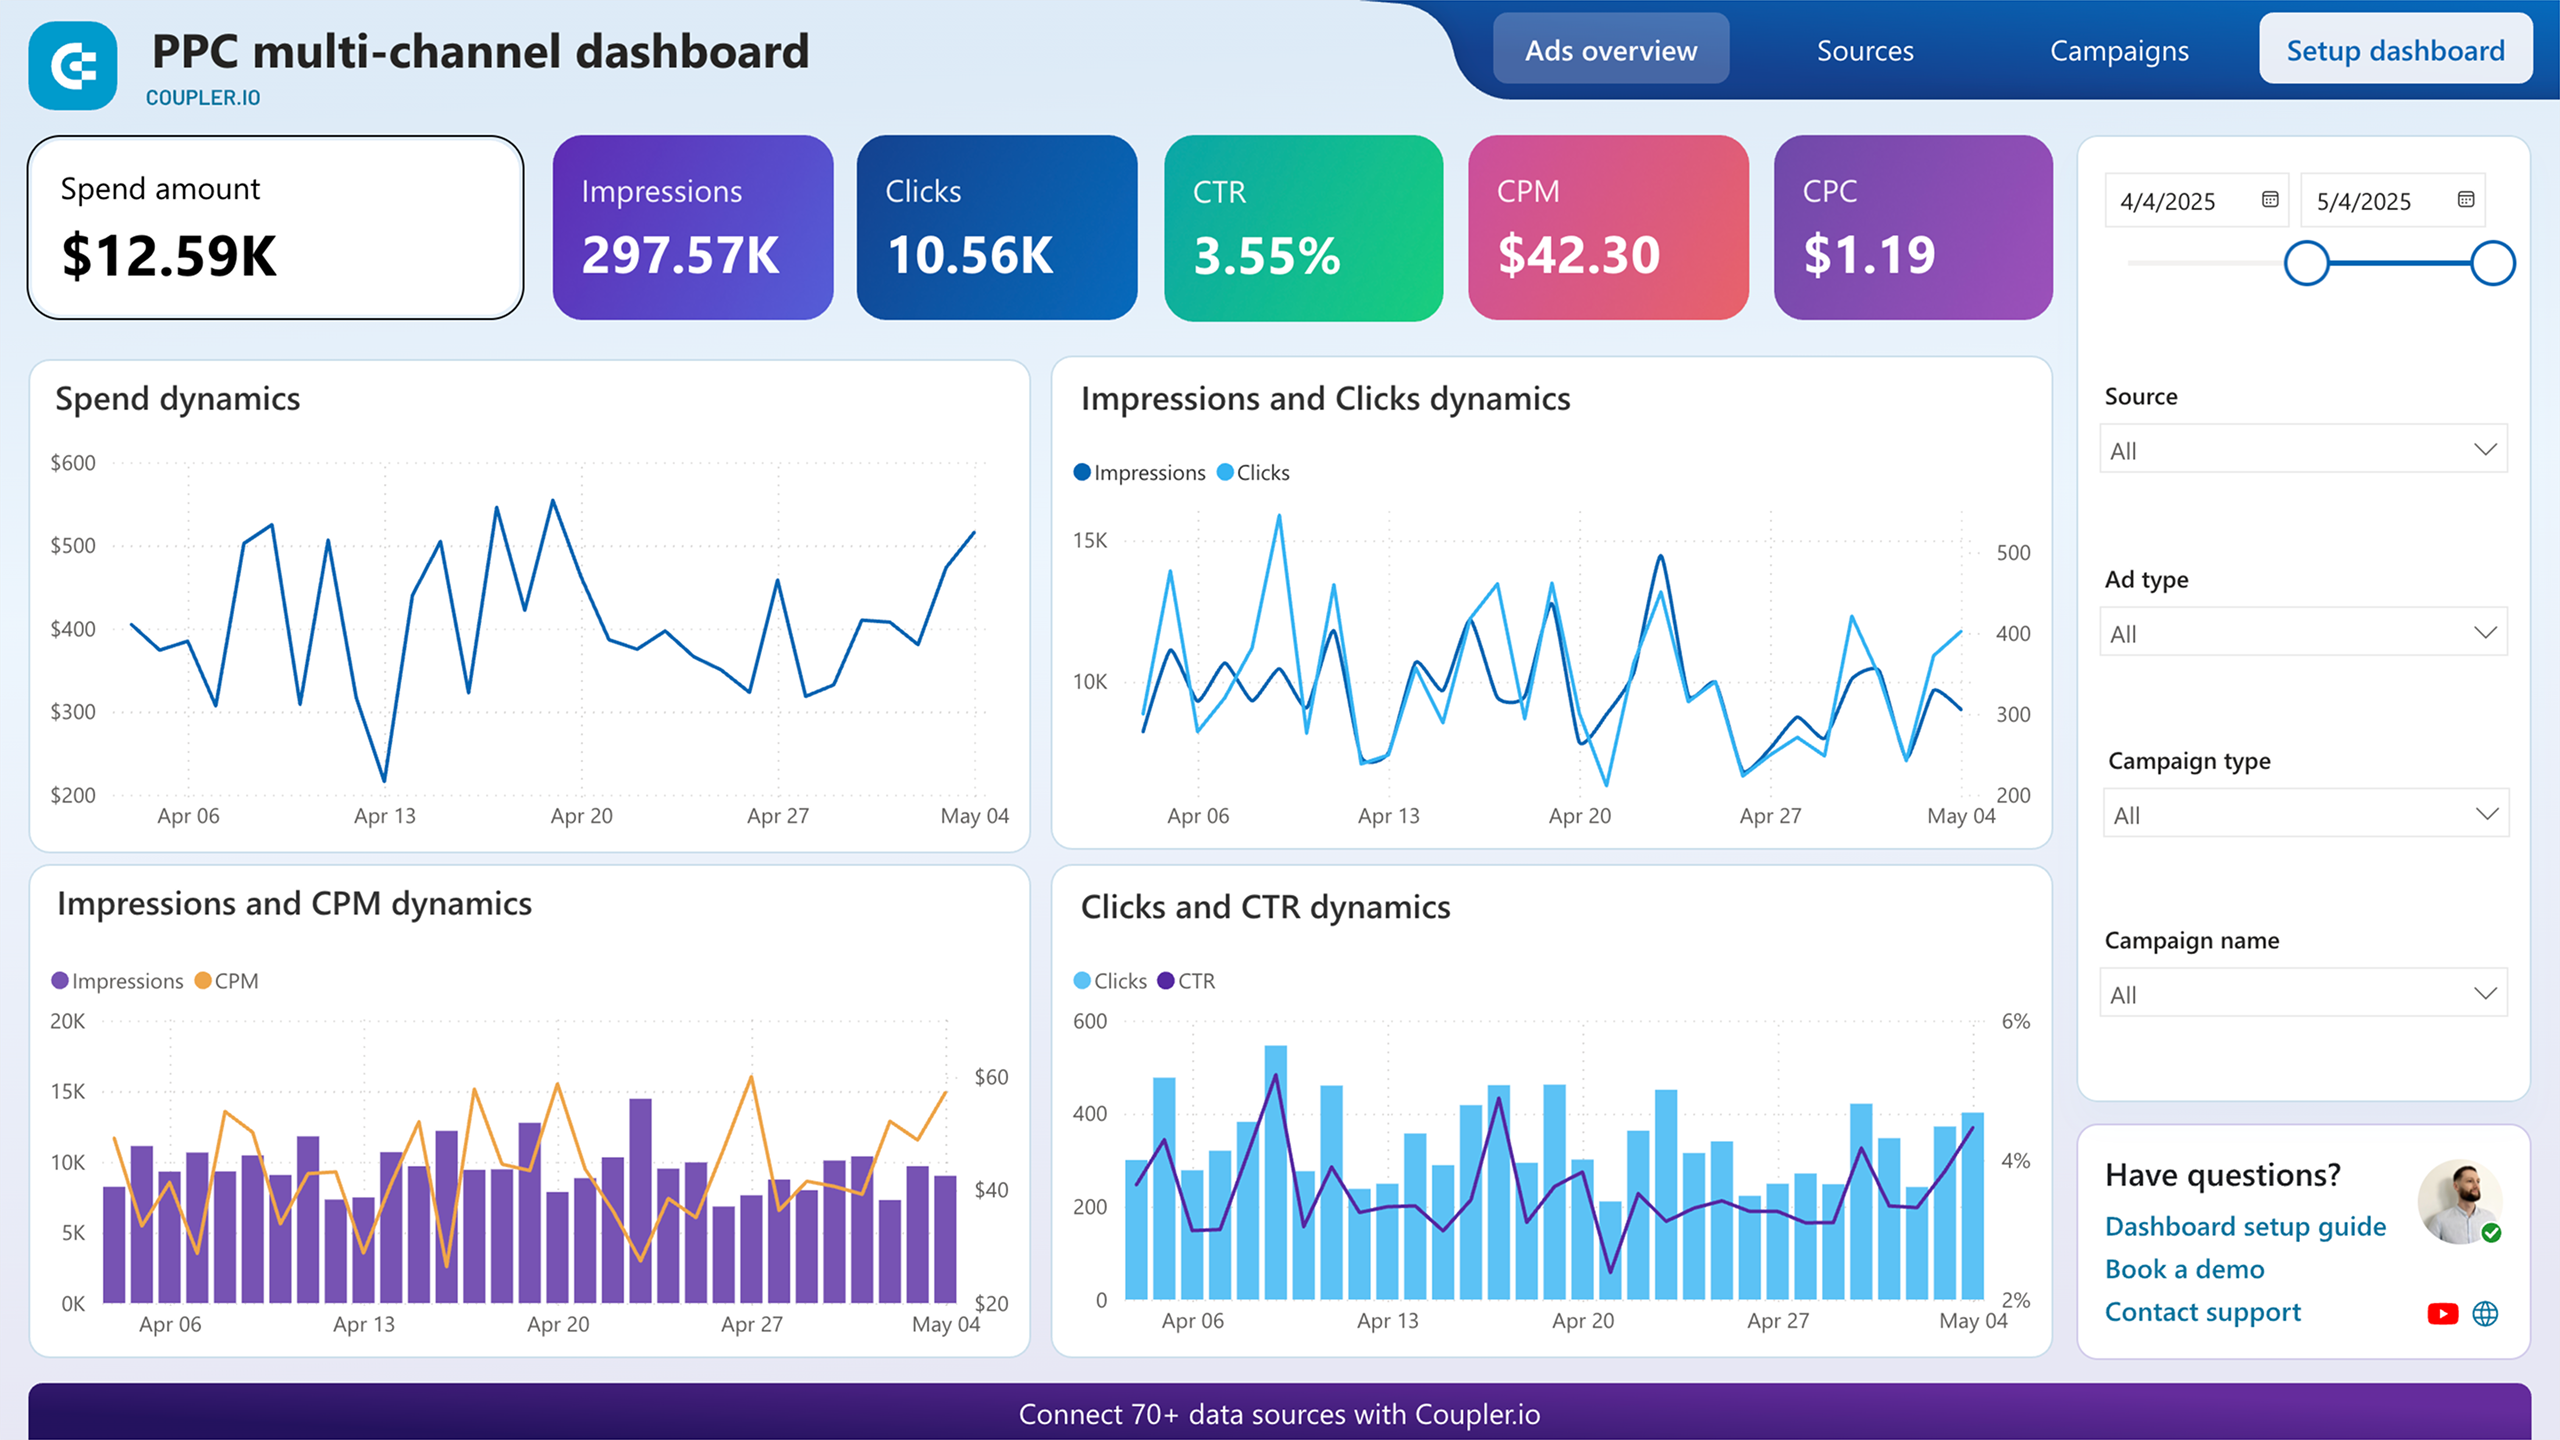
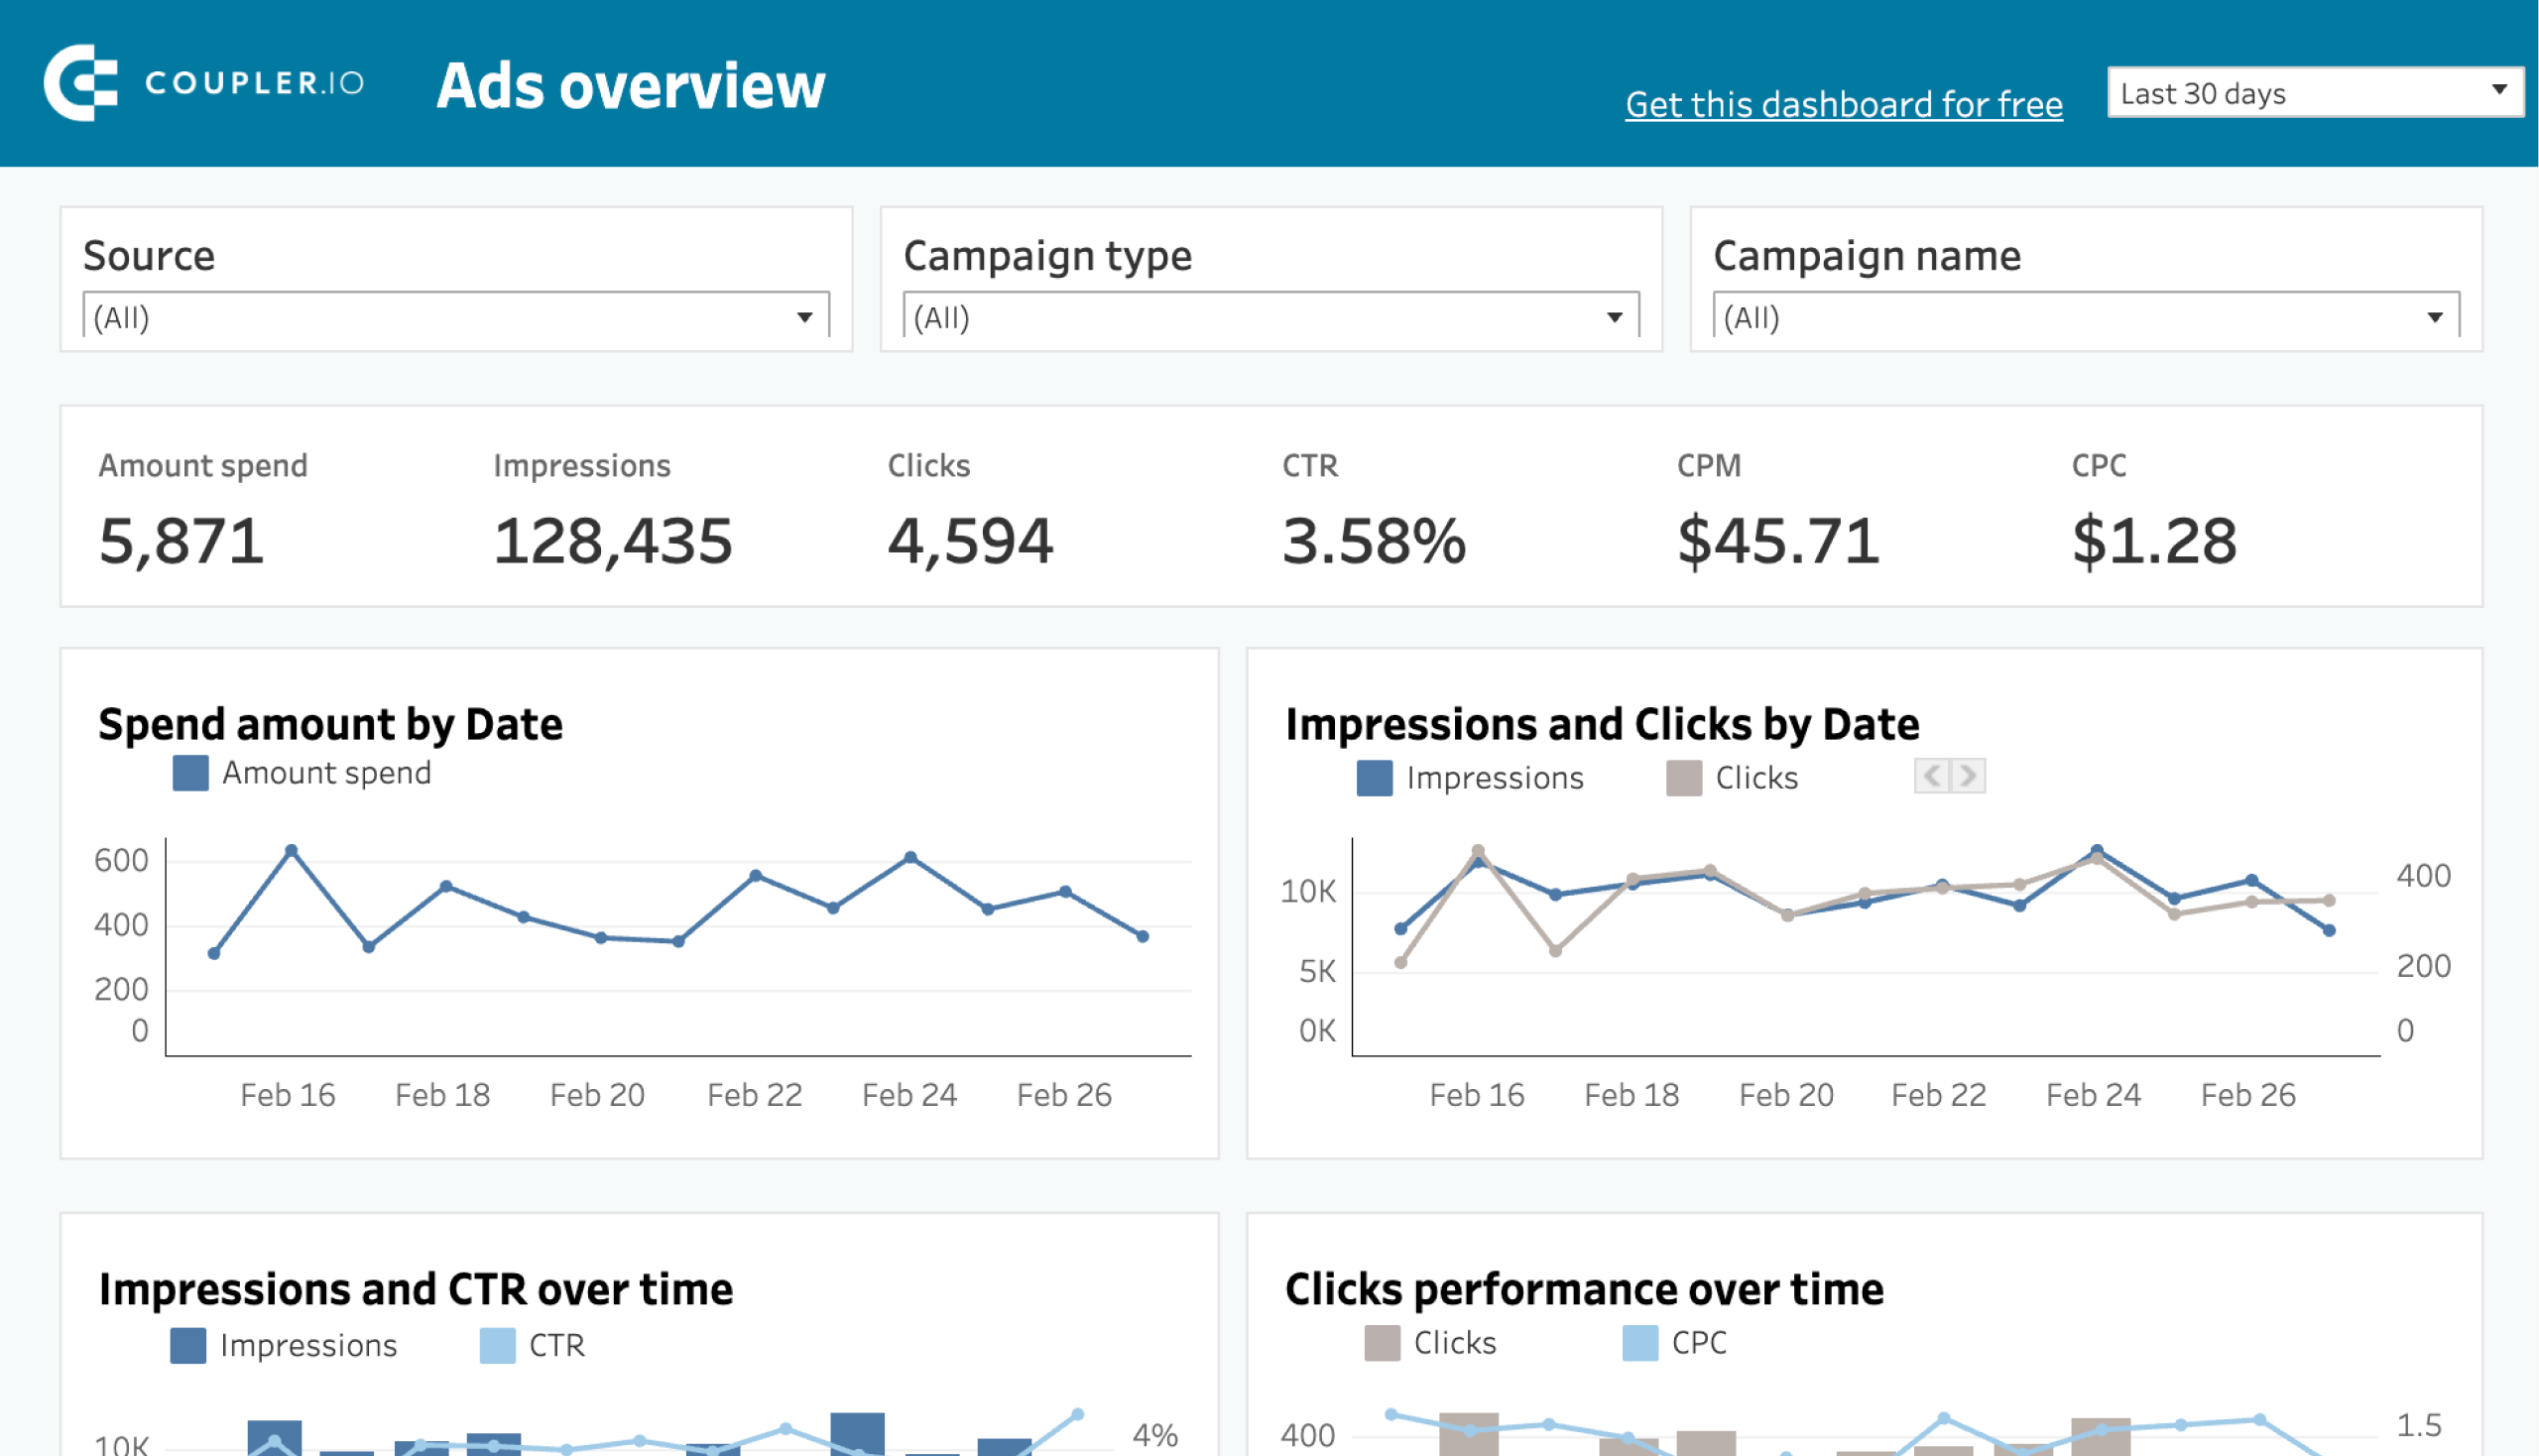
Ready-to-use templates: Coupler.io provides a number of ready-to-go PPC reporting solutions in the form of reports or dashboards designed in spreadsheets or BI tools. You can find single-source dashboard templates for Facebook Ads analytics:


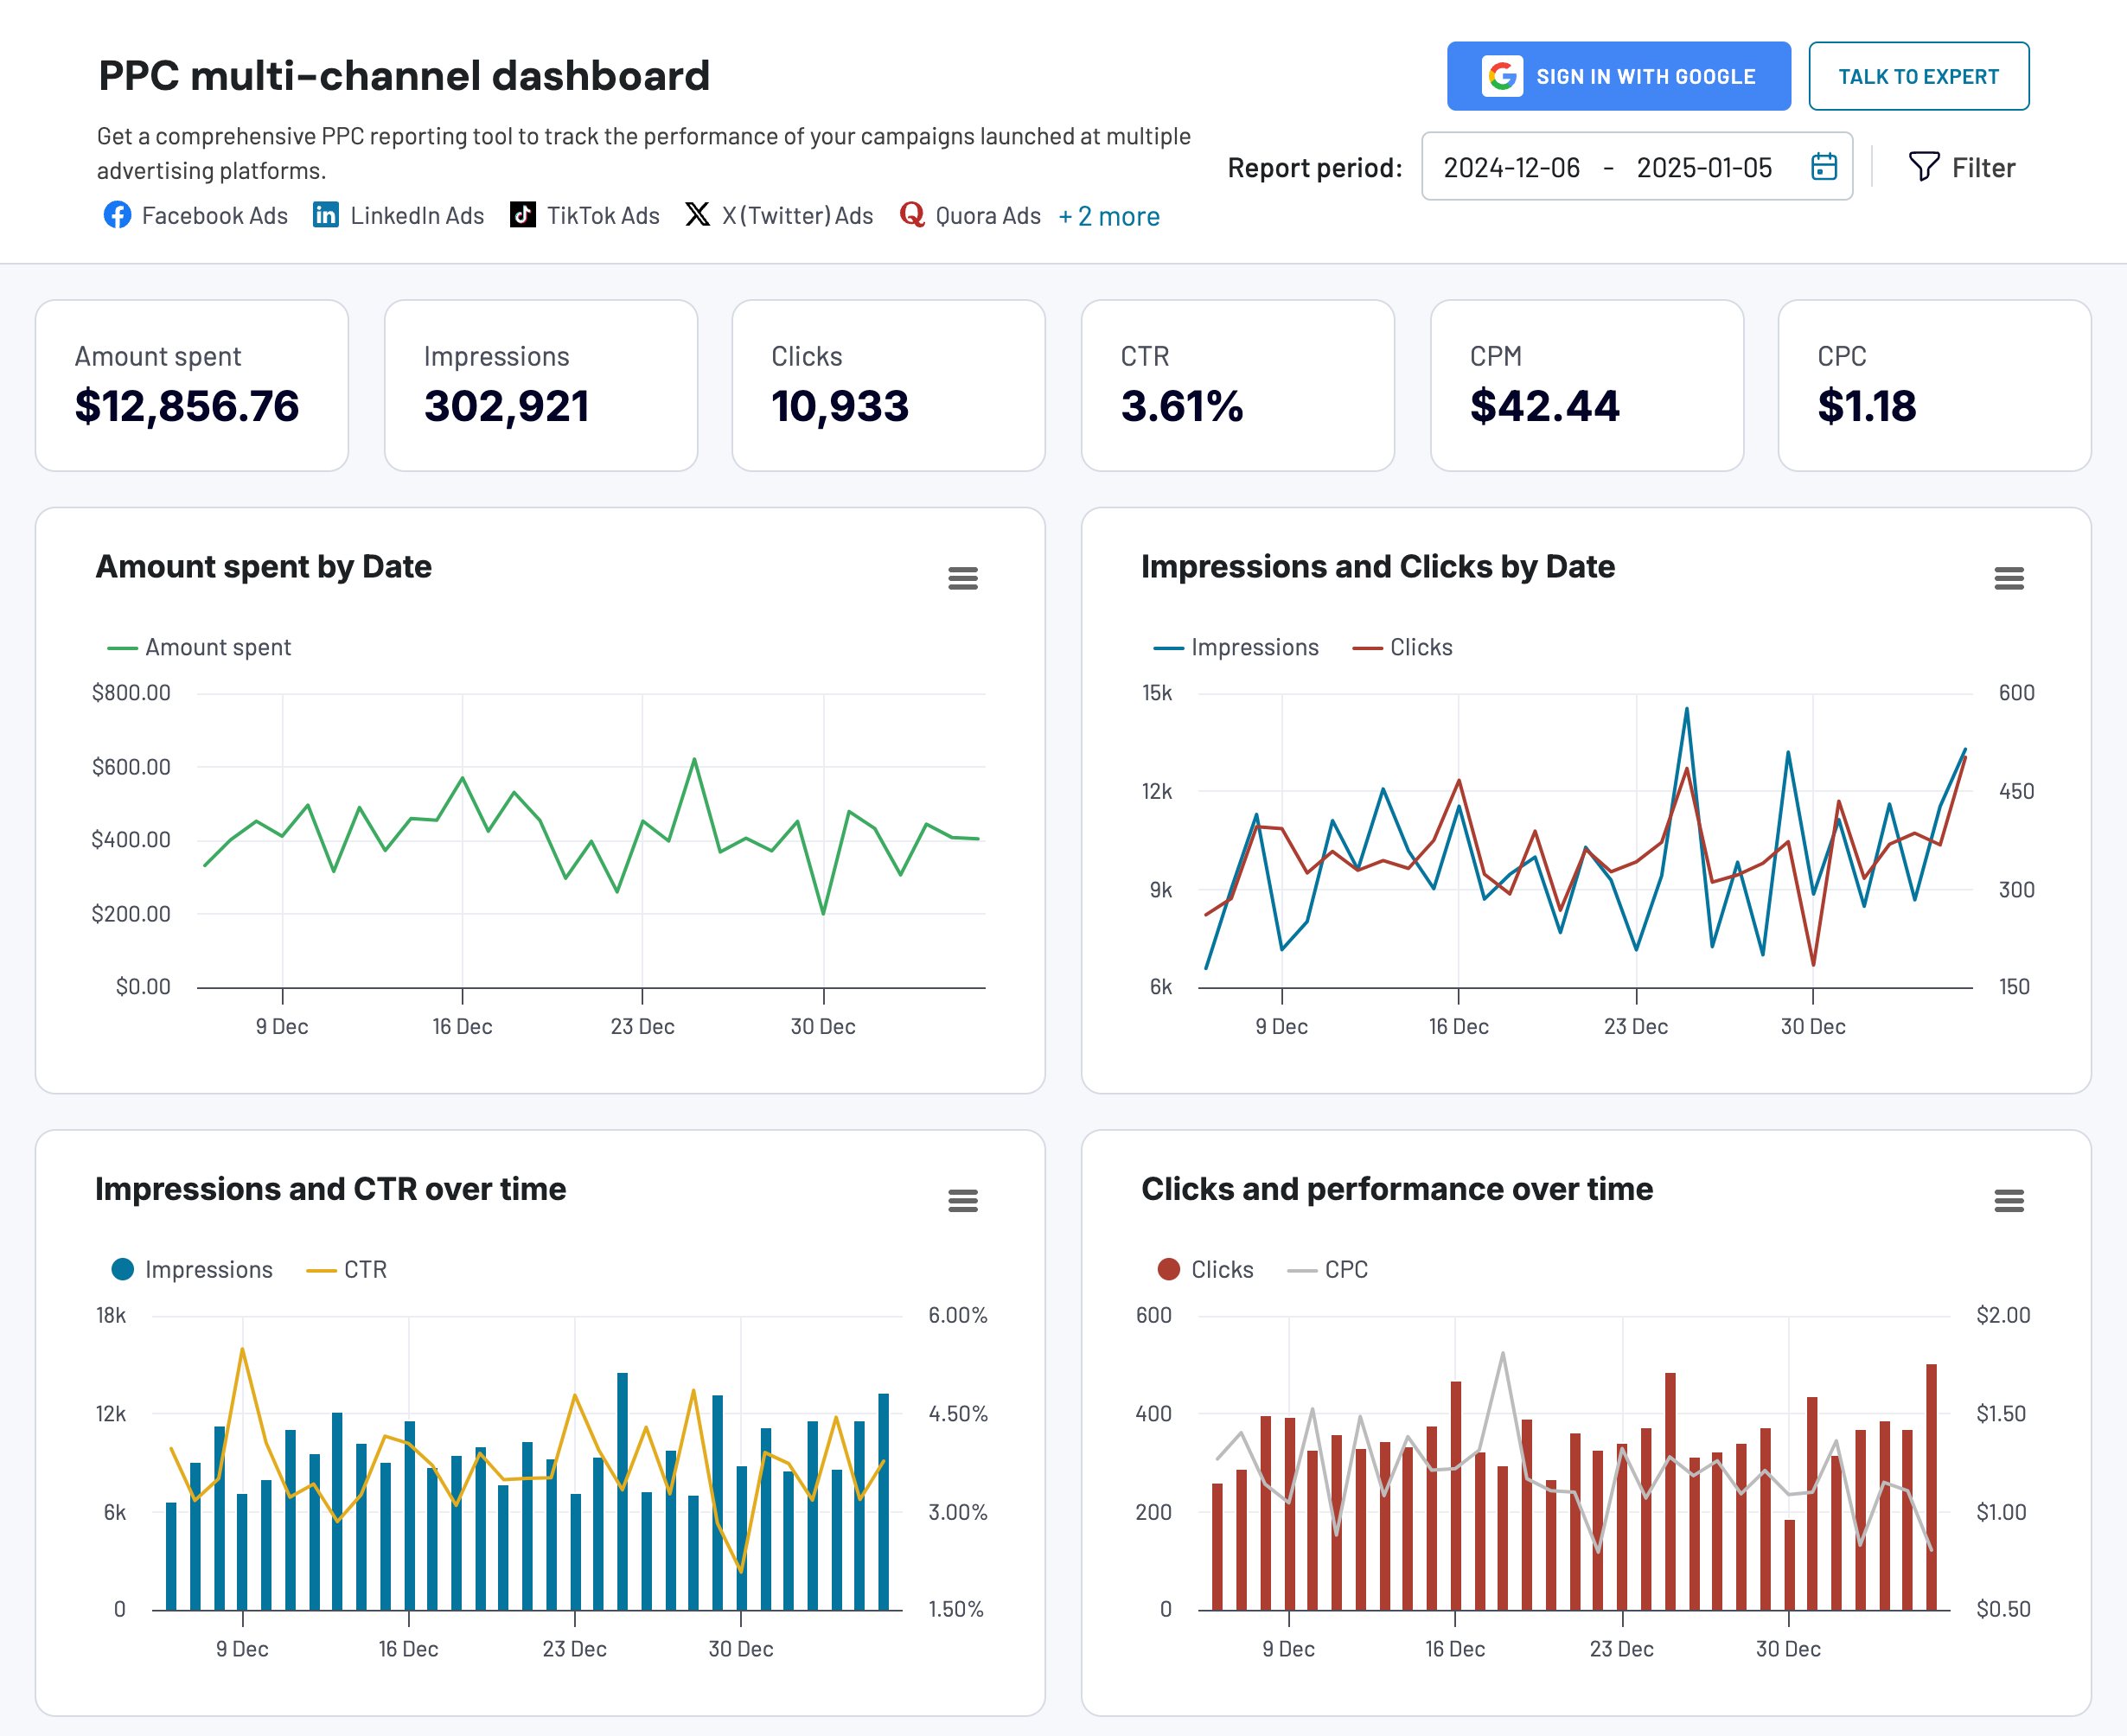
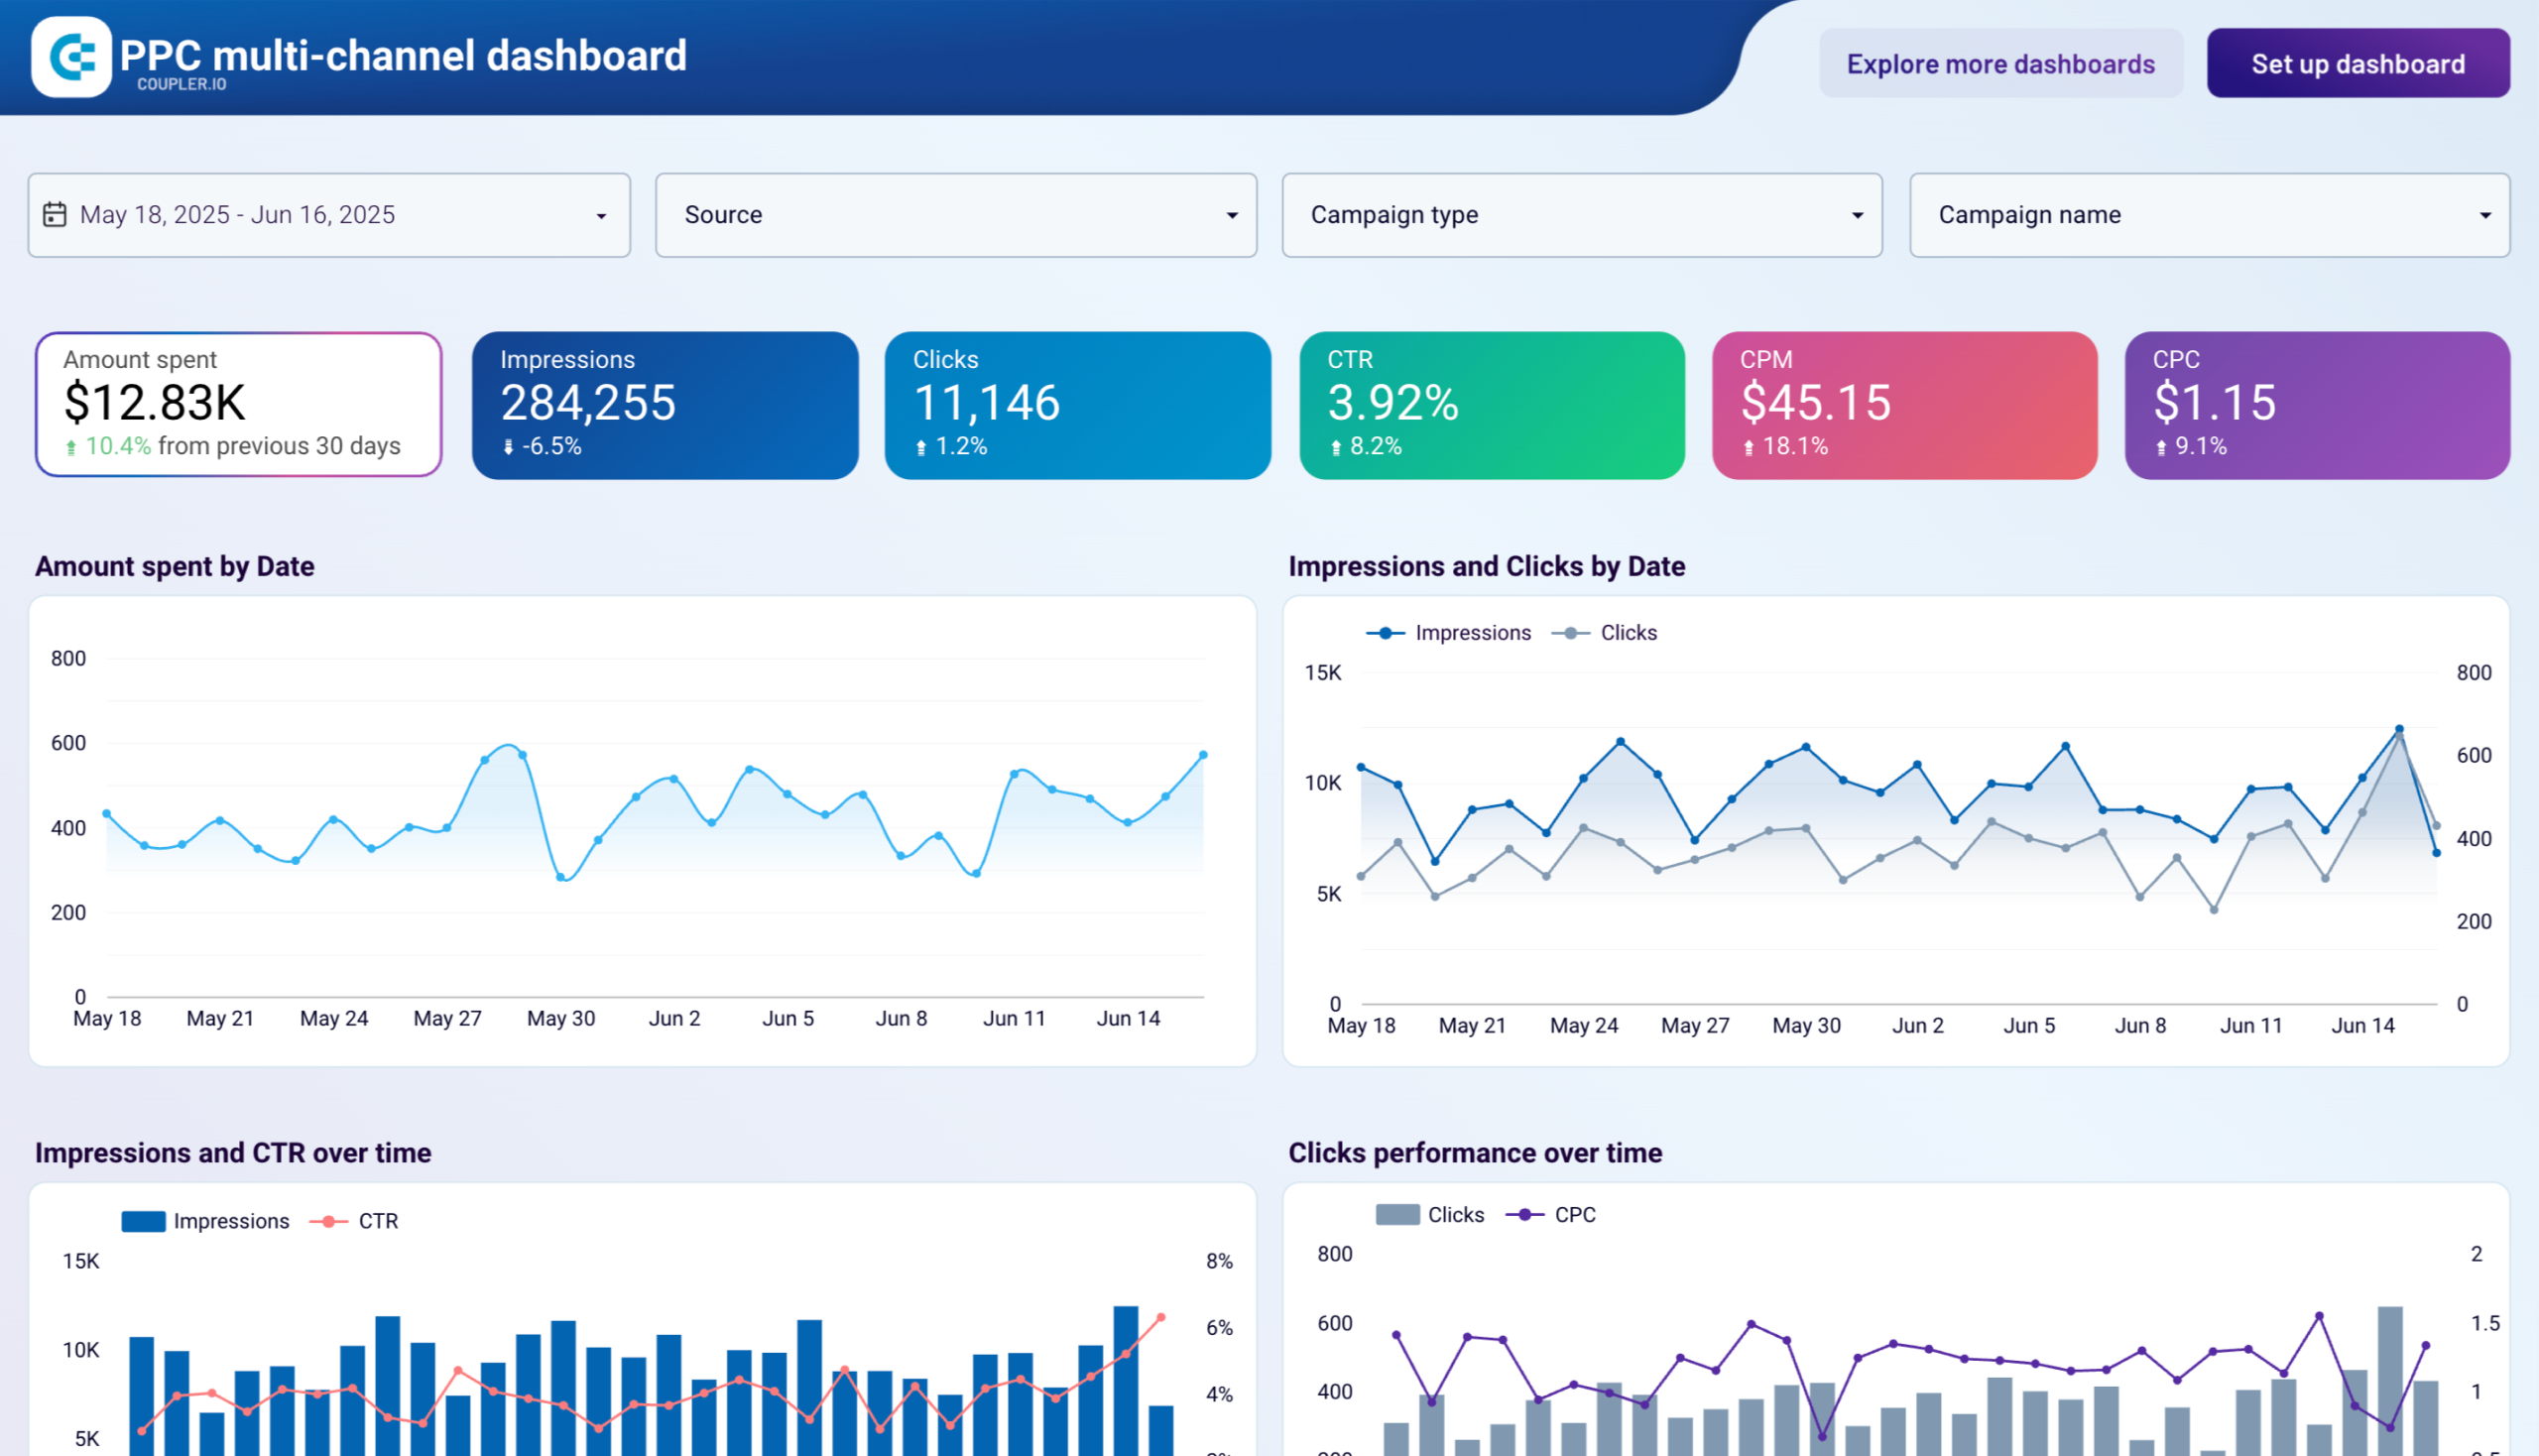
And multichannel PPC reports that let you monitor your campaign performance across different platforms:


Pros of Coupler.io
- Coupler.io is easy to use, even for non-technical users. The step-by-step guides and intuitive user experience make creating data integration workflows a breeze.
- It offers a wide range of options for data sources, making it easy to connect with various apps.
- Coupler.io integrates seamlessly with Airtable, which is great for scheduling and data extraction.
- The customer service team is responsive and helpful, which is especially valuable when encountering issues that need resolution.
Cons of Coupler.io
Currently, Coupler.io only supports around 60 integrations. However, this list is increasing regularly to provide users with more connection capabilities.
Coupler.io pricing
You can start using Coupler.io with a free 7-day trial on the Team plan and then upgrade/downgrade to one of the following subscriptions:
- Free: 1 user, 1 data connection, 100 rows per run, and manual data refresh.
- Personal: $24/month, 1 user, 5 data connections, unlimited rows per run (1,000 rows for high-volume sources), and daily data refresh.
- Professional: $49/month, 5 users, 20 data connections, unlimited rows per run (10,000 rows for high-volume sources), and daily data refresh
- Team: $99/month, unlimited users, 50 data connections, unlimited rows per run (100,000 rows for high-volume sources), and data refresh every hour.
- Business: $249/month, unlimited users, 250 data connections, 20 data connections, unlimited rows per run, and updates every 15 minutes.
Social Status
Social Status is a social media analytics tool that automates social media reporting for marketing agencies and brands. The tool provides multi-channel reports, paid and organic breakdowns, and social competitor benchmarking, making it easy for users to measure their overall social media performance.
As a specialist social media analytics tool, Social Status provides in-depth actionable insights into Facebook Ad Manager’s campaign objectives and all campaigns, ad sets, ad creatives, and Facebook ad metrics like reach, awareness, CTR, and conversions.
Features of Social Status
Supports all campaign objectives: Social Status supports all 14 Facebook campaign objectives. You can see all your ads in one place, sorted by your preferred metrics, with the help of Ads Feed.
Multi-channel social media reports: Social Status provides a feature to generate and schedule reports that cover multiple channels like Facebook, Instagram, TikTok, YouTube, LinkedIn, and Twitter. These reports are customizable and can include both paid and organic breakdowns.
White-labeled & customized reports: Social Status allows users to customize and white-label reports, making them perfect for agencies and brands with complex requirements. They also offer fully customizable reports tailored to a user’s specific needs.
Pros of Social Status
- The reports are comprehensive and easy to use and the best part is you can download them as a PDF or an editable PowerPoint presentation.
- The analytics dashboards are simple to understand and make decisions faster.
- Competitor benchmarking is a good and fast approach to evaluating the performance and engagement of competitor users.
Cons of Social Status
The interface may be overwhelming with so many features and dashboards for new users.
Social Status pricing
Social Status offers a range of pricing plans, including free and paid plans starting at $49 per month. The free plan allows users to analyze up to three Facebook pages, while the paid plans offer additional features and more page analysis.
For more details on the pricing front, you can have a quick look at the snapshot below or visit the social status pricing page.
GreyMetrics
GreyMetrics is an automated marketing reporting tool that helps agencies and marketing professionals create reports and dashboards. You can choose from over 20 report templates and add data from different sources like Facebook ads account, Google Ads, Analytics, Instagram, Twitter, Mailchimp, and LinkedIn.
With GreyMetrics, you can easily generate insightful marketing reports, track key performance indicators (KPIs), view analytics, and measure Facebook ad performance. It also lets you add clients and team members and create a client portal with controlled access levels to share or display reports before finalizing.
It gives you actionable insights and data analysis right from the top of the funnel, which helps agencies and marketing pros to set sales targets, forecast revenue, and budget for marketing expenses.
Features of GreyMetrics
Multi-channel reporting: With 20+ marketing integrations, including Facebook, Google Ads, Analytics, Instagram, Twitter, Mailchimp, LinkedIn, and more, GreyMetrics enables users to generate reports that provide a real-time view of marketing data across multiple channels.
Multi-client management: With GreyMetrics, managing multiple clients is a breeze. You can do it all from one dashboard, making generating and sharing reports with clients super easy.
Drag and drop report creator: It also allows users to create custom reports without any coding skills. The drag-and-drop report creator makes building a dashboard that fits your needs easy.
Pros of GreyMetrics
- If you are an agency working with multiple clients all the time, GreyMetrics is just the Facebook ad reporting tool for you. It can remove the chaos and implement a streamlined Facebook ad reporting flow for all your clients.
- The extensive range of Facebook ad report templates, from full digital marketing reports to individual platforms (Facebook, Twitter, TikTok, etc.) reports is a gold mine to generate reports instantly, which helps in conversion attribution.
- Creating separate portals for team members and clients is a great way to avoid confusion and set clear boundaries. This way, you can control what your clients can see and what they can’t, which helps streamline operations.
Cons of GreyMetrics
They do not support custom integrations, which can be a huge road blocker for marketers using different tools.
GreyMetrics pricing
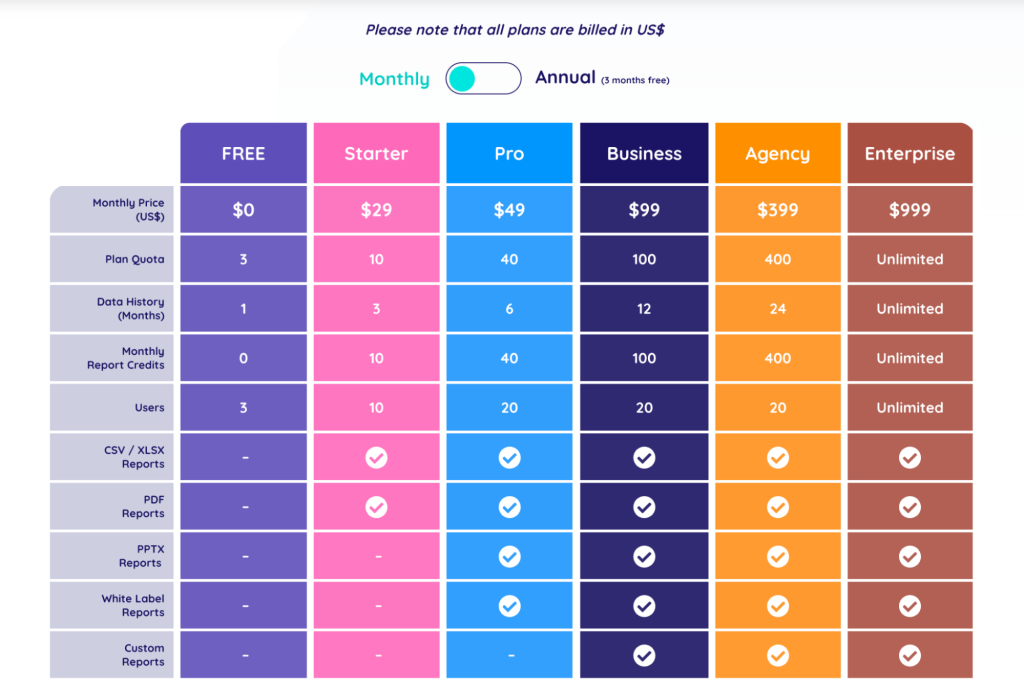
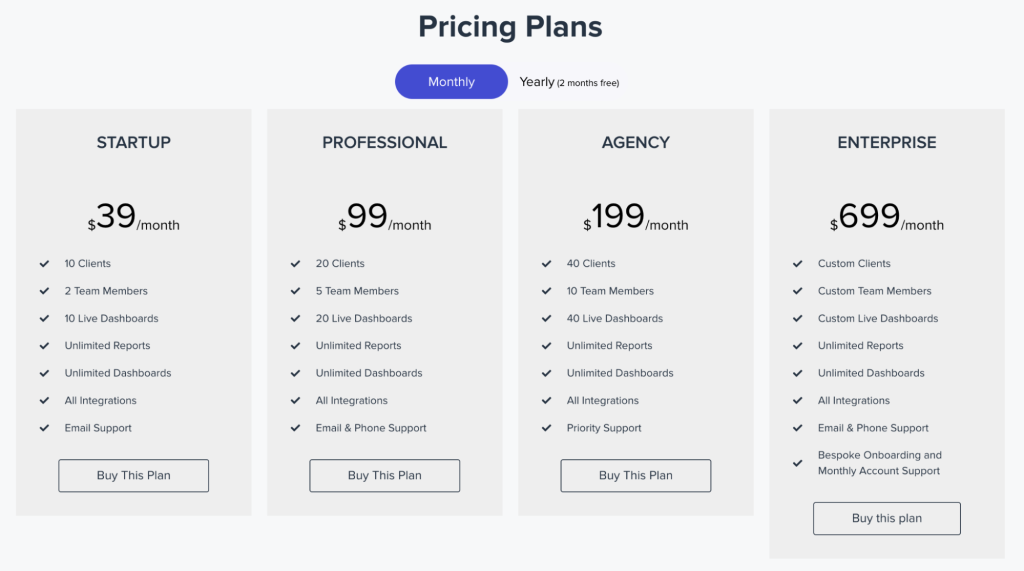
While you can have a free GreyMetrics account forever, the features are limited in the free version. The paid subscriptions start from $39 to $699 per month. Refer to the snapshot below for more details.
Metrics Watch
Metrics Watch is another marketing reporting platform for agencies and marketers. But it is email based, which means all the reports will land in your inbox (manual and automated) instead of traditional PDF reports.
With more than 28% of work time already spent on writing emails, Metrics Watch saves all that time by automating exporting reports and sending emails to clients.
This platform helps to generate comprehensive Facebook Ad reports that showcase the results of their marketing campaigns in an intuitive way.
If you want to get a look and feel of the Metrics Watch reports, request a sample report on their website. But if you want to test the water with your own data, sign up for a 14-day free trial with no credit card.
Features of Metrics Watch
Email-based reports: Reports are email-based and don’t require PDF attachments or third-party links. This means that you can receive reports directly to your inbox.
Codeless drag-and-drop widget editor: With Metrics Watch, you can easily create customized reports using a codeless drag-and-drop widget editor. This makes adding and arranging data visualizations, such as charts, tables, and graphs, easy.
Free white-label options: Metrics Watch offers free white-label reports for all plans, which means that you can customize the reports with your own branding and logos. This is especially useful for agencies who want to provide reports that look like they were created in-house.
Pros of Metrics Watch
- The email-based reports can save the hassle of emailing reports to clients.
- Pre-made reporting templates make creating unique and handy reports easy for beginners.
- You can use multiple filters like Average session duration, Hits, Pageviews, Unique page views, etc., to customize reports as needed.
- If you spend a lot of time sending similar reports like weekly/ monthly reviews to different clients, MetricsWatch has made this easy; where you can put client information in a simple CSV file (template will be provided) or use the API.
Cons of Metrics Watch
The integrations are limited to only social media platforms. They have not included MarTech or task management tools like Hubspot, Mixpanel, Tableau, etc.
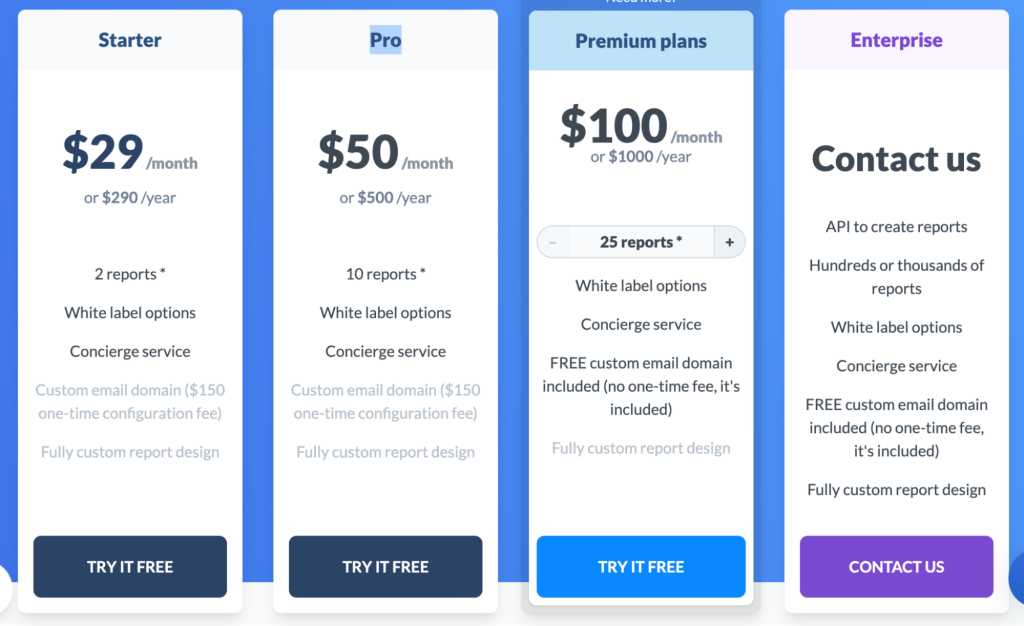
Metrics Watch pricing
They have a 14-day free trial to explore the features of Metrics Watch. After the free trial, subscribe to a paid plan to continue using Metrics Watch.
- Starter – $29 per month
- Pro – $50/ month
- Premium – $100/ month
- Enterprise – Custom pricing
Mixed Analytics
Mixed Analytics provides a Google Sheets API connector that connects to various APIs, like Facebook’s Ads Insights API. Basically, it allows you to easily import data into your Google Sheets and create customizable reports without having to be a coding whiz.
The API Connector is a great way to pull conversion metrics for different demographics from Facebook’s Ads Insights API and add it to your Google Sheet for further analysis and reporting. This way, you can gather data from multiple sources, like Facebook ads, Google ads, and other marketing data, all in one place.
Features of Mixed Analytics
No-code interface: API Connector allows users to connect to almost any API using a no-code interface, making it easy for non-technical users to use and benefit from it.
Automate your reporting: API Connector allows users to automate their reporting by setting triggers to pull from APIs at hourly, daily, weekly, or monthly intervals.
Access controls/permissions: The platform comes with access controls/permissions, allowing users to define who has access to what data.
API lifecycle management: The platform also offers API lifecycle management, enabling users to manage APIs from creation to retirement.
Dashboard: API Connector comes with a dashboard that provides users with an overview of their API performance and usage.
Developer portal: The platform includes a developer portal that allows users to collaborate and share resources with other developers.
Pros of Mixed Analytics
- Mixed Analytics API Connector allows users to connect to almost any API through a no-code interface.
- The extension is easy to use, and users can start quickly with a library of ready-to-use APIs or create custom connections to the data sources they choose.
- Mixed Analytics API Connector is dynamic and customizable without needing code, allowing users to create custom connections to almost any API.
Cons of Mixed Analytics
Mixed Analytics API Connector has a visual field editor, which may not be suitable for some advanced users who prefer to edit code directly.
Mixed Analytics pricing:
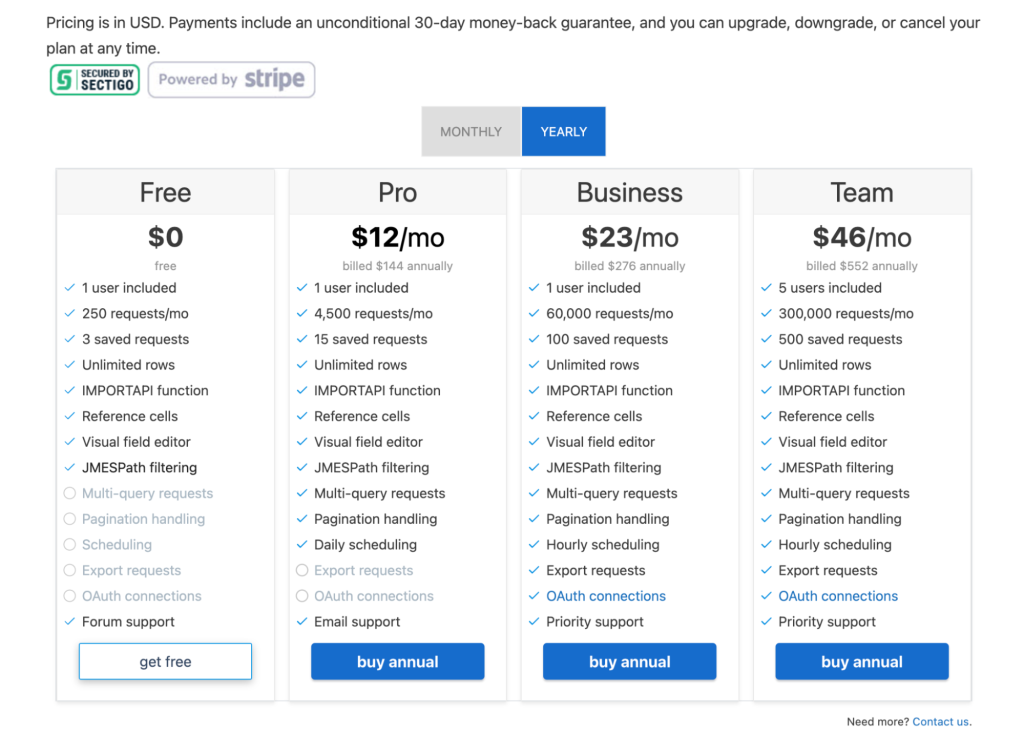
Mixed Analytics offers a free version but has limited features. If you want access to all of the features Mixed Analytics offers, you’ll need to upgrade to one of their paid subscription plans from below.
- Pro – $12 per month
- Business – $23 per month
- Team – $46 per month
Shape.io
Shape.io is a PPC (Pay-Per-Click) Budget Management Software Suite that provides businesses with solutions to take control of their PPC spend and performance. It offers powerful tools and widgets to manage and automate PPC budgets, eliminating the need for complicated spreadsheets, scripts, and manual adjustments.
The Shape.io PPC Budget Management Software Suite consists of two primary products:
- Budget Management and Automation Dashboard – The platform allows users to organize campaign spending across channels into custom budgets and transform all PPC and Facebook ads data into insightful dashboards through a single reliable pipeline.
- Advertising Data Infrastructure – It provides incredibly robust ad platform data that can be easily accessed through the processing power and speed of Google BigQuery, allowing one to access historical ads data in no time.
With Shape.io, it is easy for digital marketers to manage and automate their PPC and Facebook ad budgets across eight ad platforms. It offers an easy-to-use budget designer tool and provides solutions to eliminate manual adjustments and time-consuming tasks.
Features of Shape.io
AutoPilot: This feature automatically adjusts campaigns based on current spending to ensure users hit their target budget without overspending or underutilizing it.
CruiseControl: Users can set specific thresholds for key metrics, such as cost-per-click or click-through-rate, and CruiseControl will adjust bids automatically to achieve those goals.
Budget Pacer: This feature helps users manage campaigns with recurring monthly spending targets or limited-time budgets.
Budget Booster: This tool analyzes historical data to suggest budget changes that could improve campaign performance.
Pros of Shape.io
- Shape.io offers a suite of solutions that helps manage PPC budgets in a better way. Users can utilize these solutions on their most challenging client accounts at no cost.
- It helps in optimizing the ad budget and avoiding overspending.
- The storage mechanisms are so effective that ad data, like vector graphics, never lose quality when reopening and editing vector files.
Cons of Shape.io
- The premium pricing costs $299/ month, which may be expensive for a few marketing agencies and marketers.
- The integrations are limited to only Ad platforms and not to other tools.
Shape.io pricing
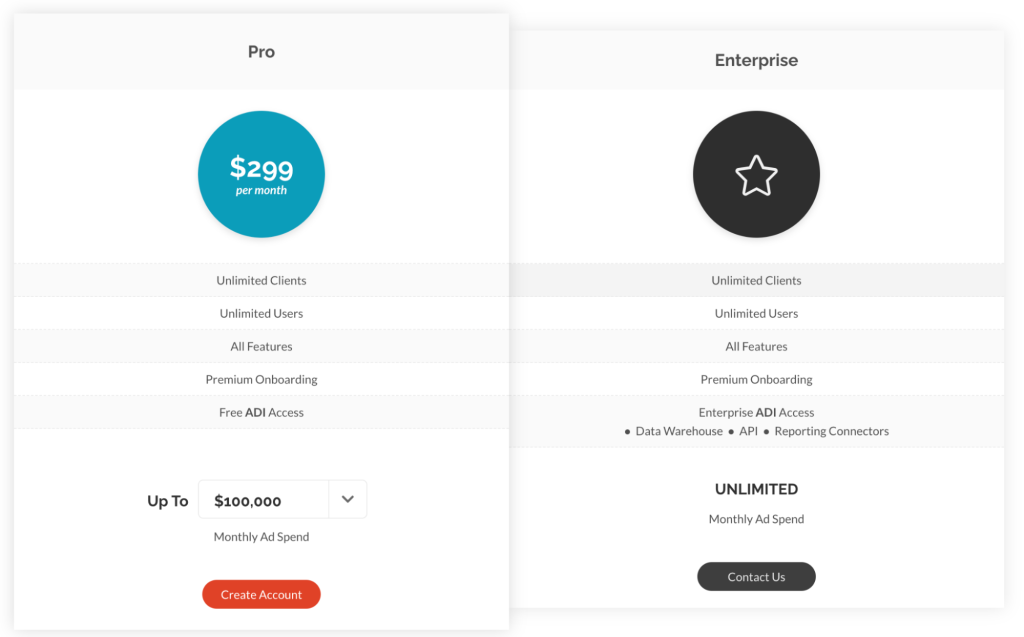
They offer a free account that can accommodate only 1 client. If you want to use Shape.io for multiple clients, you’ll have to choose from the paid subscription plans below:
- Pro – $299 per month
- Enterprise – custom pricing
Swydo
Swydo is an automated reporting and monitoring platform designed for online marketers that enables them to create professional marketing reports and dashboards, save time, and show the impact of their campaigns. The platform is trusted by over 2,000 companies in more than 80 countries. It empowers marketers to communicate meaningful and actionable Facebook insights through powerful reporting and monitoring that is easy to use.
It gathers data from multiple ad sources and generates customised reports that can be shared daily, weekly, or monthly. Swydo integrates with platforms such as Facebook Ads, Instagram, Google Analytics, LinkedIn Ads, and more to provide full-funnel visibility. Its integration with CRMs and marketing platforms (e.g., HubSpot) further enhances its value for client-servicing teams.
Managing multiple clients? Swydo offers dynamic report templates, customizations, and integrations, making it the perfect Facebook Ads reporting tool for your needs.
Features of Swydo
Dynamic report templates: Change your master template once and update hundreds of client reports automatically.
Customisable reports and dashboards: Build dashboards that match your branding & layout requirements; integrate multiple data sources into unified visuals.
Integration and data-source management: Connect via API to ad platforms, CRMs, sheet-data; monitor data-source health & maintain accuracy. 30+ integrations included.
“AI-driven” insight layer: With Swydo AI, the platform now analyses your data & surfaces clear actionable insights (e.g. campaign anomalies & scaling opportunities)
Cross-platform metric consolidation: Combine data from multiple ad platforms into a single metric (for example total cost, total conversions) for overview clarity.
White-label communications & branding: Customise everything from report headers to email signatures to embed your agency/brand identity.
Pros of Swydo
- High level of customisation: templates can be adapted and linked for unique client needs.
- White-label email scheduling and branding make it agency-friendly and client-ready.
- Automation and monitoring reduce manual effort and improve transparency on campaign performance.
Cons of Swydo
- The pay-per-data-source pricing model requires close tracking of usage to avoid unexpected costs.
- There is a steep learning curve to fully utilise the advanced features.
Swydo pricing
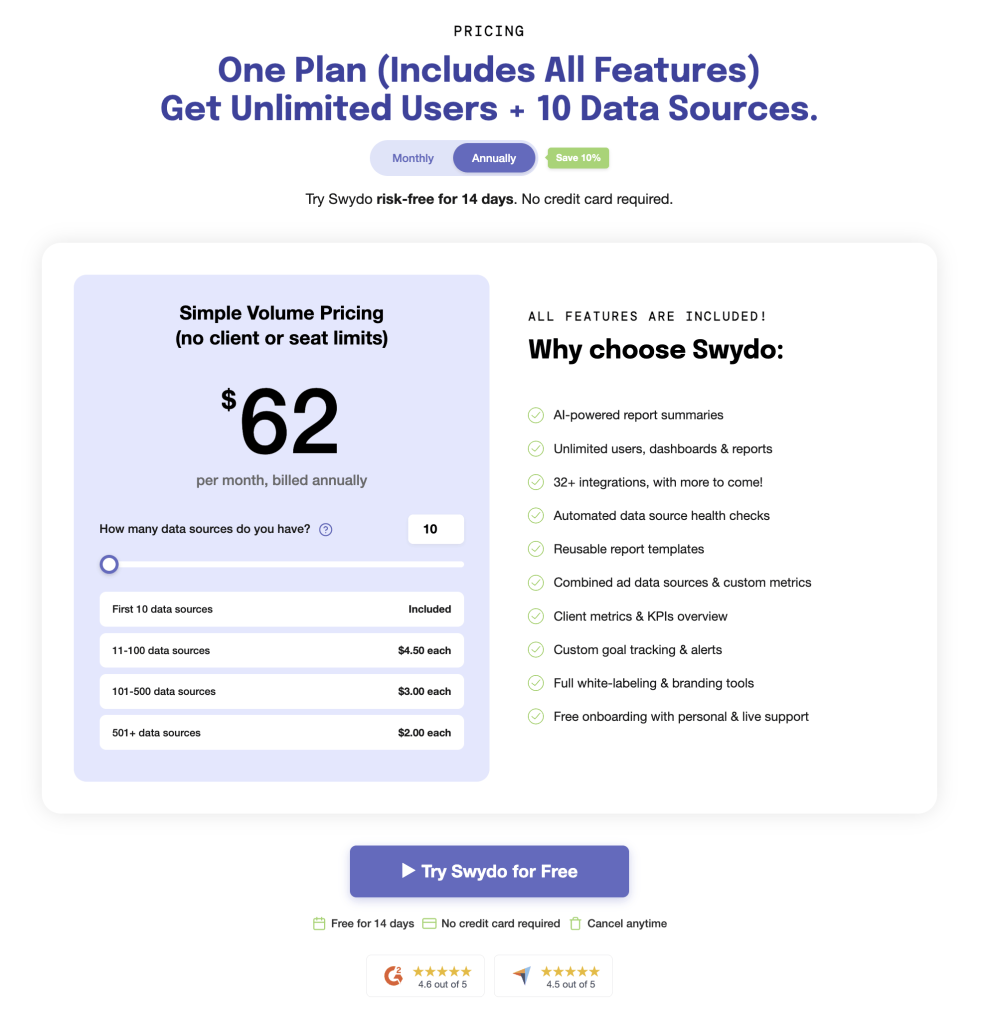
Swydo gives you access to all features, unlimited users, dashboards, and reports under a single plan. Your bill scales only as your data source usage grows.
The base price is €69 per month and includes 10 data sources. Additional data sources are priced as follows:
- 11–100 data sources: €4.50 each
- 101–500 data sources: €3.00 each
- 501+ data sources: €2.00 each
Airbyte
Airbyte is a versatile open-source data integration platform that offers reliable ELT (Extract, Load & Transform) pipelines for bringing data from multiple sources to your desired destination. The user-friendly interface, cost-effectiveness, and emphasis on data security make it an ideal solution for organizations of all sizes.
Launching its cloud service makes it even more accessible and hassle-free for users. Airbyte’s commitment to data security has also garnered attention, as it has built its platform to ensure data safety and privacy.
If you are keen on customization options to analyze and make reports of Facebook ad data, you can consider Airbyte as Facebook ads reporting software for its versatility.
Features of Airbyte
ELT Tool: Airbyte’s ELT (Extract, Load, Transform) tool allows companies to set up all their ELT data pipelines in minutes, reliably. The platform is open-source, scalable, and fast, catering to growth companies and enterprises alike.
Data Connectors: Airbyte provides over 165 pre-built data connectors that allow users to replicate data from various sources like Facebook Ads and Google ads into their desired destinations. Airbyte also allows users to create new connectors easily, taking only a matter of hours.
Airbyte Cloud: Airbyte also offers a hosted service that takes all the features of the open-source version and adds hosting and management, making it easier for companies to use the platform.
Integration with Databricks: Airbyte provides integration with Databricks to help break down data silos like different FB campaigns of the same objective, allowing users to replicate data into the Databricks Lakehouse Destination to process, store, and expose data throughout the organization.
Pros of Airbyte
- Airbyte is an open-source tool that is free to use and has strong community support.
- It has a wide range of data connectors, with over 150+ connectors available, making it easy to transport data from any source to any destination.
- For Airbyte, data security comes first. Its platform is designed to protect data movement, with a focus on system availability, processing integrity, and data confidentiality.
Cons of Airbyte
- While the platform is easy to use, modifying or building new connectors may require more steps and performance costs.
- Being a new platform, Airbyte might lack the maturity and stability of established tools.
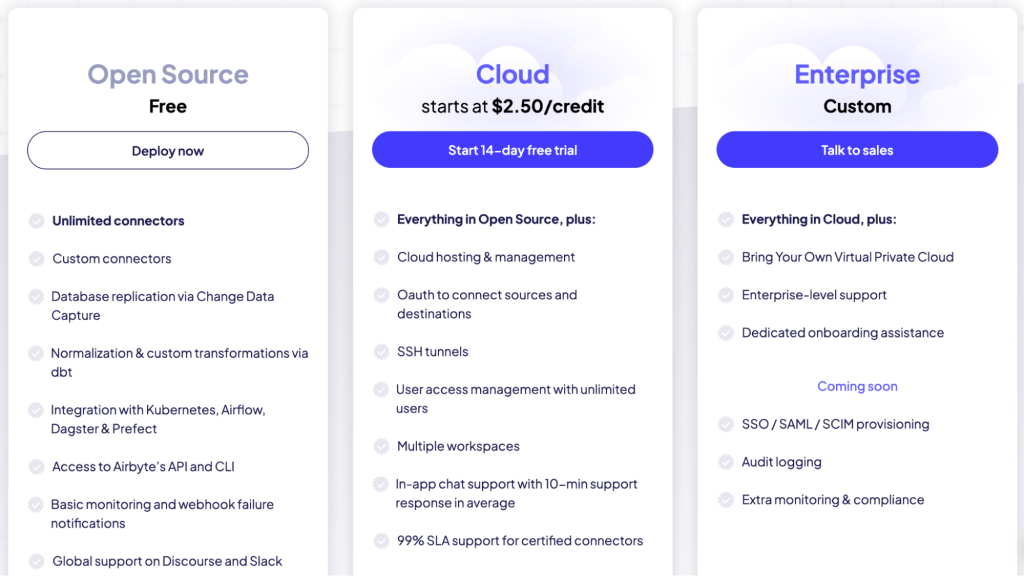
Airbyte pricing
Being open-source, Airbyte has a free version. The paid plans are based on credit, starting at $2.5 per credit.
A Credit is defined as a data operations unit measured in a million rows or GBs. Refer to the table below for how credits are calculated for different actions.
| Data operations type | What does on credit stand for? |
|---|---|
| Read API source | 6 credits per million rows |
| Read database, warehouse & file source | 4 credits per GB |
| Read custom source | 6 credits per million rows |
| Write database & warehouse destination | free |
You can also use a price estimator by Airbyte to estimate the monthly charges. The paid plan starts at $2.5 per credit and is charged based on usability.
Singer.io
Singer.io is an open-source Extract, Transform, and Load (ETL) tool that provides a simple and composable way to move data between databases, web APIs, files, and other data sources and destinations. It was created by Stitch, a company that provides ETL services, and it has since been released as an open-source project for the wider community to use and contribute to.
Singer.io follows a standard approach for writing data extraction and loading scripts, which are respectively called “taps” and “targets.” The communication between taps and targets is done through a standard JSON-based data format, allowing for flexibility between tools like Facebook and Google ads.
Features of Singer.io
Taps and Targets: Singer.io follows a simple architecture of data extraction scripts called Taps that extract data from any source and write it to a standard stream in a JSON-based format, and data loading scripts called Targets that consume data from taps and load it into a file, API, or database.
Incremental extraction: It allows efficient and incremental data extraction from various sources by maintaining the state between invocations.
Simple and composable ETL: Singer.io provides a simpler approach to unifying data manipulations, making building and maintaining modular data pipelines easier.
Pros of Singer.io
- The code is freely available and can be customized to fit specific use cases.
- It also has a large community of developers actively contributing to the project and supporting users.
- It improves the performance of ETL jobs and reduces the amount of data that needs to be processed.
Cons of Singer.io
- Singer.io can have a steep learning curve, especially for users unfamiliar with the JSON-based data format used by the tool. Users may need to spend time learning the basics before they can effectively use Singer.io for ETL.
- While Singer.io has a large community of developers contributing to the project, support options may be limited compared to commercial ETL tools. Users may need to rely on community forums and documentation to troubleshoot issues.
- Singer.io is a relatively simple tool that may not offer all of the features some users require for ETL.
- Using Singer.io as a Facebook ad reporting tool can be challenging without proper technical knowledge.
Singer.io Pricing
You can get in tune with your Facebook ad data for free with Singer.io.
Reportz.io
Reportz.io is a white-label reporting solution designed to simplify the reporting process, reduce stress, and elevate the overall quality of reports. It offers an intuitive and highly-automated reporting experience, providing real-time access to data from multiple sources and integration with various marketing tools, enabling users to create reports in under 3 minutes. The features, such as customizable dashboards, scheduled reports, and notifications, make it an ideal choice for marketers, SEO specialists, and digital agencies. They also conduct regular webinars to understand how to set up your account and build a functional dashboard.
Features of Reportz.io
Create Detailed Reports: Reportz.io allows users to combine different widgets to create comprehensive digital marketing reports that outline all the metrics specified by the user. This feature provides detailed and accurate insights into the performance of your digital marketing campaigns.
Filter, Merge, and Display Any Data: With the custom widget builder, you can filter, merge, and display any data you need to analyze digital marketing campaigns. This feature helps users get only the information they want in as much detail as needed.
Real-Time Automatic Marketing KPI Dashboards: Reportz.io provides real-time automatic marketing KPI dashboards that users can access anytime. This feature saves time and resources on assembling weekly and monthly reports. Users can share these dashboards with clients and never worry about reporting again.
Integration with Trusted Services: You can integrate their trusted services with Reportz.io for a more comprehensive view of their digital marketing campaigns.
Pros of Reportz.io
- Saves time and resources on manual reporting processes.
- Provides ever-accessible, real-time automatic marketing KPI dashboards.
- Users can customize their dashboard with custom widgets and filter the needed data.
- Offers white labeling options and password-protected dashboards for each customer.
- The support is responsive and helpful to use the platform effectively.
Cons of Reportz.io
The learning curve to use Reportz.io effectively is steep, and it may require more tutorials or documentation on how to use it.
Reportz.io pricing
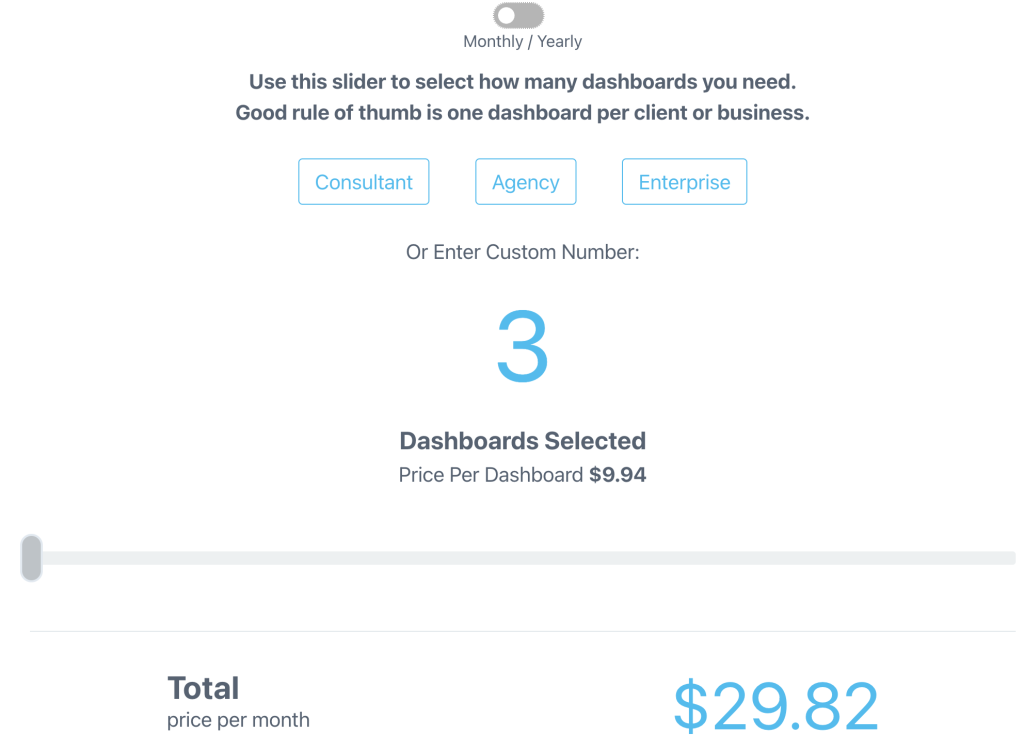
Reportz.io offers a flexible pricing structure where payments are based on the number of dashboards used. If you are uncertain about how many dashboards you will require on a monthly or yearly basis, the Reportz pricing page provides recommendations based on the type of business you have.
To begin with the plan, a minimum of three dashboards is required, and each dashboard is priced at $9.94. By subscribing to an annual plan, you can receive a 25% discount on each dashboard.
How to choose the Facebook Ads reporting tool?
As digital advertising continues to be a vital component of business growth for e-commerce and technology companies, investing in the right tools to track and optimize your Facebook ad campaigns can make all the difference. With so many Facebook Ads reporting tools available on the market, it can be overwhelming to decide on the right one for your business.
From basic reporting to in-depth analytics, there are a wide variety of features and functionalities to consider when selecting Facebook ad reporting software.
To help make the decision easier, it’s essential to focus on key criteria that can truly impact the effectiveness of your Facebook ad campaigns. In this guide, we’ll explore the most important factors to consider when choosing Facebook ad reporting software.
Criteria to consider to choose the best Facebook Ads reporting tool
- Data visualization: A good Facebook ads reporting tool should be able to present data in an easy-to-understand, visually appealing way. Examples include graphs, charts, and infographics that make it easy to digest large amounts of information at a glance. Check out how this may look in the example of Looker Studio Facebook Ads templates.
- Customization options: Look for a reporting tool that allows you to customize your reports to fit your needs. This could include selecting the metrics you want to track, choosing specific time periods, or adding your own branding to the reports.
- Integrations: As a business, you might be using other tools for social media, content, workflows, etc. Make sure the Facebook ads reporting tool can integrate with your existing tools. This will save you time and make tracking all your data in one place easier.
- Metrics: The right metrics will depend on your specific business goals, but a good Facebook ad reporting tool should allow you to track various metrics. Examples include reach, engagement, conversions, and ROI.
- Automated reports: Manually creating reports can be time-consuming, so look for a tool that allows you to set up automated reports sent to you regularly. This will save you time and ensure you’re always up-to-date on your advertising performance.
- Collaboration: If you work with a team, look for a reporting tool for collaboration. This could include sharing reports with team members or assigning tasks related to your marketing efforts.
- Support: Finally, ensure that your reporting tool offers good customer support. This could include a knowledge management system, FAQs, or live support options like chat or email.
How to use Facebook Ads reporting software effectively?
Just signing up for a tool is not enough to streamline your Facebook Ads reporting. It is crucial to learn how to use the Facebook Ads reporting software effectively.
To get started, make sure you’ve got the basics of ad reporting right like campaign objective, relevant metrics, etc. for different demographics and target audiences. You can move on to explore the tool’s features and analyze data. By taking it step by step, you can use Facebook Ads reporting software like a pro and get the most out of your marketing efforts.
- Set clear campaign objectives: Clear objectives are crucial before starting a Facebook ad campaign, whether to increase website traffic, boost sales, generate leads, or improve brand awareness. This helps you measure success and make necessary adjustments to your strategies.
- Focus on relevant metrics: While Facebook Ads Reporting Software offers many metrics, such as impressions, clicks, and conversions, not all are equally essential. To focus on your goals, prioritize metrics like cost per acquisition (CPA) and return on ad spend (ROAS) for driving sales versus likes and shares for engagement.
- Create custom reports: While Facebook Ads Reporting Software provides pre-built templates, custom reports catered to your unique requirements can be more beneficial. Automating the process of generating reports can save time and enable you to concentrate on essential metrics.
- Analyze data regularly: Analyze your Facebook ad campaign data frequently to identify trends, optimize strategies, and make informed decisions. Automate the process using a data integration tool like Coupler to import data into analytical tools such as Google Sheets, Excel, or Tableau, saving time and effort.
- Test and iterate: Test, analyze, iterate: the key to successful digital marketing. Stay ahead of the game by experimenting with different tactics and optimizing your campaigns to achieve better results over time.
Facebook ad reporting tools play a crucial role in helping advertisers track and analyze the KPIs of their campaigns. The 10 best Facebook ads reporting tools highlighted in this article offer a range of features and capabilities to help businesses optimize their ad spend and achieve their marketing goals.
From granular performance metrics to customizable Facebook Ads dashboard examples, these tools provide valuable insights that enable advertisers to make data-driven decisions and improve their ROI. By leveraging these tools, businesses can gain a competitive edge in the crowded digital advertising landscape and maximize the impact of their Facebook ad campaigns.

Automate Facebook Ads reporting with Coupler.io
Get started for free