If you’re a project manager, regardless of the industry you’re working in, Gantt charts can be a very useful tool for managing your projects. But creating your own Gantt chart from scratch can take up a lot of your time. Instead, you can download and use the Gantt chart Excel templates discussed below.
Automated Gantt chart templates in Excel (FREE download)
Our Excel Gantt chart templates below are fully “automated”. All you have to do is provide input. The task bars will update automatically, showing a visualization of your project schedule. See the list below.
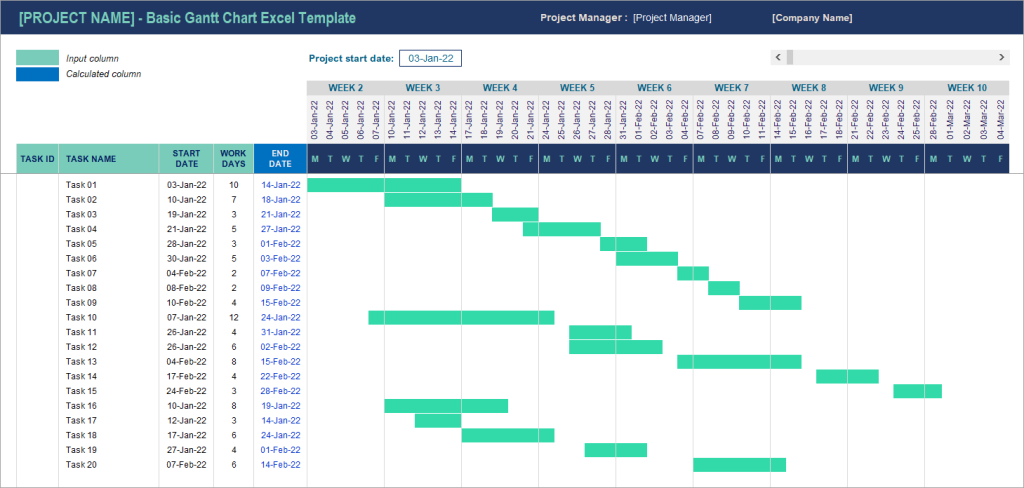
Basic Gantt chart Excel template
Download: Basic Gantt chart Excel template
This Microsoft Excel Gantt chart template contains the essential elements needed to create a Gantt chart. It has basic features to visualize your project tasks in a daily timeline.
There are no progress tracking, subtasks, dependencies, and resource management features. However, this template is powerful enough to visualize your project schedules. You can see all the works mapped out and how long the whole project will take.
The daily timeline shows only workdays (Monday to Friday). You can change the range of the dates displayed in the timeline area by using the scroll bar on the top-right. As the timeline shows daily granularity, this template is best for planning short-term projects.
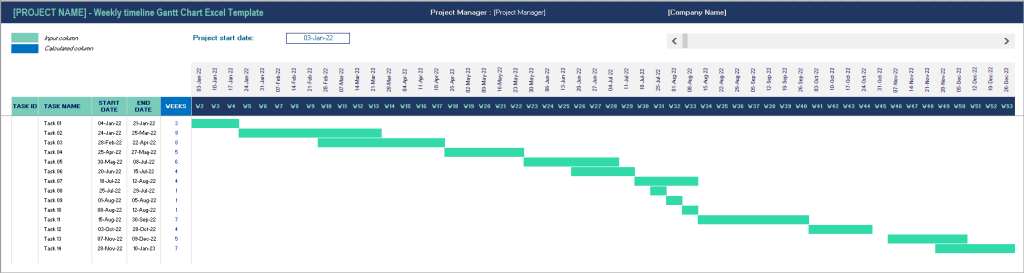
Weekly timeline Gantt chart Excel template
Download: Weekly timeline Gantt chart Excel template
This template is excellent for short and medium-term projects. By default, it gives you a weekly timeline that covers one year, with the scroll bar at the top-right allowing view periods up to four years long. The bars show the total weeks each task will take based on the start dates and end dates you inputted.
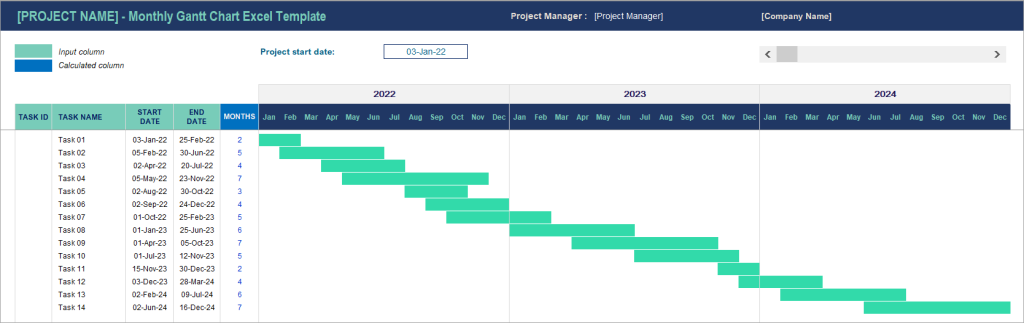
Monthly timeline Gantt chart excel template
Download: Monthly timeline Gantt chart Excel template
A monthly timeline template is a great way to stay on top of your projects. The high-level overview allows you to know what needs to be done for the next few months. It can also guide planning and mapping smaller tasks, so you never miss any deadlines.
This template has a monthly timeline spanning three years, but you can remove or add more years as needed. You can also use the scroll bar to see a range of future years in the timeline area.
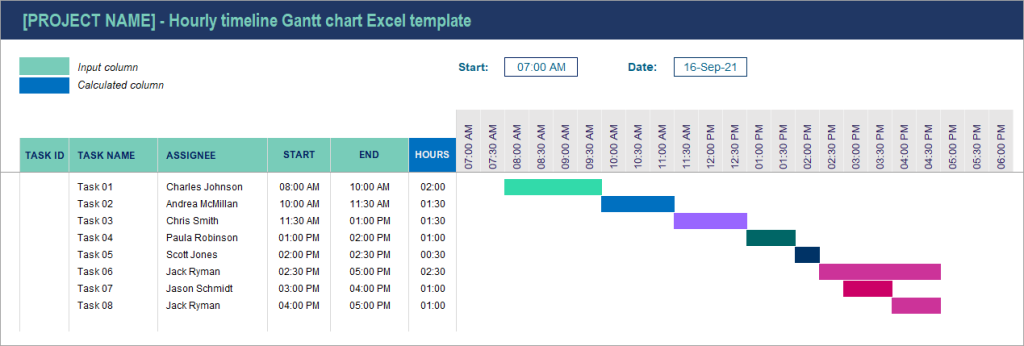
Hourly schedule Gantt chart Excel template
Download: Hourly Gantt chart Excel template
This project schedule Gantt chart Excel template with an hourly timeline can help you plan daily activities in small time increments. Use this template to plan short-duration tasks and map them to a timeline under 24 hours. You can also use it for hourly labor scheduling.
The bar colors in this template are based on the assignee name. Each person has a different bar color, making it easy to spot when someone has multiple tasks at the same time.
Project management Gantt chart Excel template
Download: Project management Gantt chart Excel template
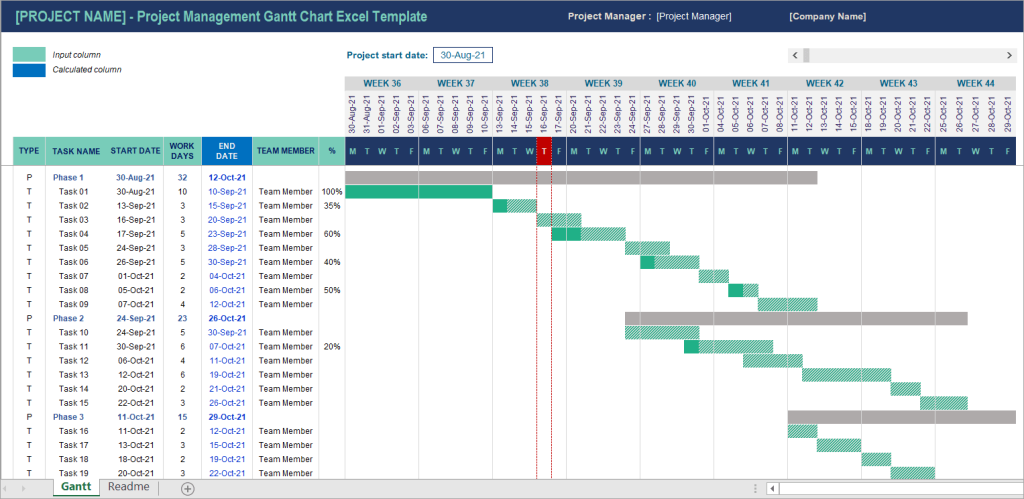
This professional Gantt chart Excel template for project management has quite valuable features to help you manage and track the progress of your projects, such as:
- You can organize tasks into phases.
- You can input which member of the team member is responsible for each task.
- You can enter the completion of each task by inputting a value in the % completed column. By doing this, the pieces you’ve done will also have a different color.
- There are also vertical lines that indicate the current date. Thus, by looking at the bars, you can immediately see what should have been done by today’s date. Some tasks that are behind schedule will be easy to spot, so you can take action to get them back on track.
In addition, this project management Excel Gantt chart template shows how to use the following formulas to calculate the start date and duration of each phase based on its tasks’:
- Start date of a phase:
=MIN(all_of_its_tasks_start_dates)
- Number of workdays:
=NETWORKDAYS(the_phase_start_date,MAX(all_of_its_tasks_end_dates))
The above formulas will make the bar of each phase update automatically when its tasks’ durations change. However, you can also enter the start date and duration of each phase manually if you prefer.
Gantt chart Excel template with subtasks
Download: Gantt chart Excel template with subtasks
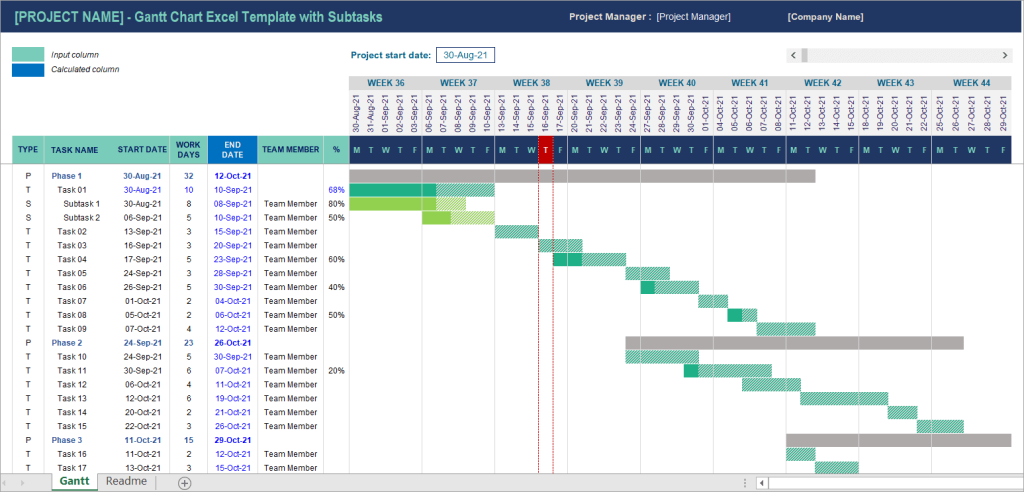
This template has similar features as the Project Management template above. The main difference is adding subtasks and breaking your project into more detailed and manageable items. The template also shows how to calculate the start date, duration automatically, and % completed of a task based on its subtasks. Still, you can enter them manually if you prefer.
Gantt chart template with dependencies
Download: Gantt chart Excel template with dependencies
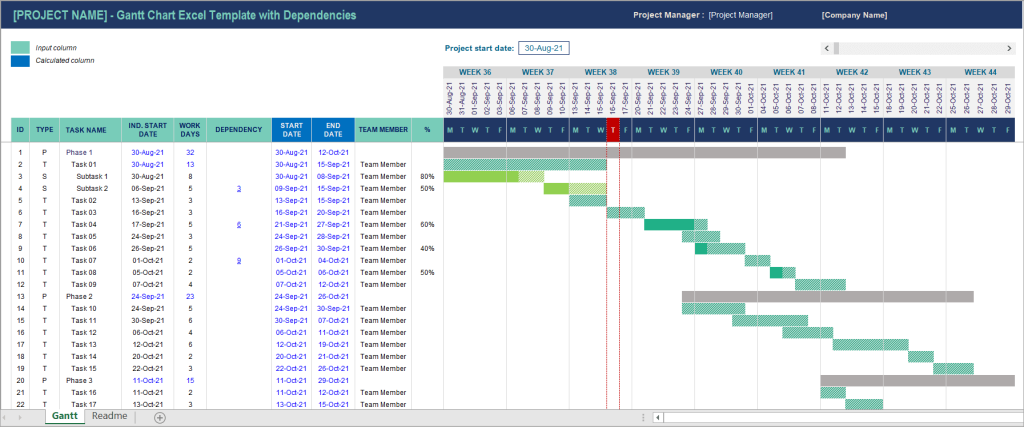
In a project, often, there is a task that cannot start until another has been completed. Some tasks may depend on another, and luckily, ensuring task dependencies can be done using formulas in Excel.
This template provides you an easy way to define the predecessor of a task, subtask, even a phase.
The ID column in this template is unique and defined using a formula. You will need to enter a cell reference to an ID value in the DEPENDENCY column to add a dependency.
The bars on the right are based on the START DATE and END DATE columns, calculated automatically based on IND. START DATE, DEPENDENCY, and WORKDAY values.
You can see how a delay in one task might impact the schedules of other tasks, even an entire Phase.
For more detail on how to use this template, please check the Readme worksheet in this template.
Construction Gantt chart Excel template
Download: Gantt chart template in Excel for planning a construction project
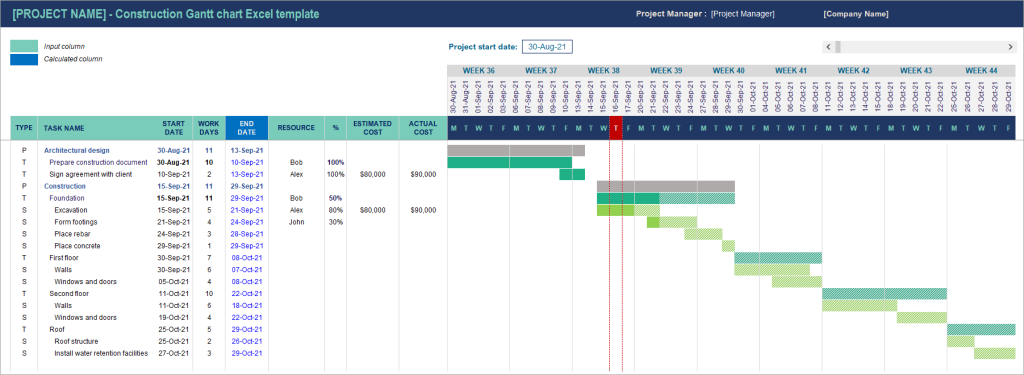
Gantt charts are also popular and widely used in the Construction industry. The simplicity and visual clarity of the chart make it a valuable tool for displaying job schedule information.
An activity or a task might be as large and complicated as laying the foundation of a building. It could also be much more straightforward, like erecting formwork for one footing. A Gantt chart helps you estimate and visualize those activities, making delays less likely to occur.
Our Construction Gantt chart template has example tasks defined for a Construction project. When using it, you can use Phases to group tasks based on a category you like. For example, for a high-rise building construction, you can group tasks based on the construction area, floor, responsibility, etc.
The template makes it easy to assign who’s responsible for each task. You can also estimate the cost of a task and enter its actual cost as your work progresses.
Marketing Gantt chart Excel template
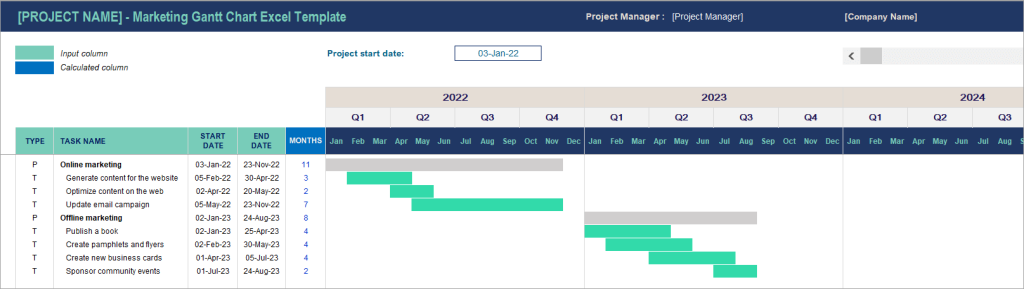
Download: Marketing Gantt chart Excel template
This Microsoft Excel Gantt chart template has a monthly timeline with quarterly info and helps plan your long-term marketing project. Just enter your tasks, including their start dates and end dates. You can also group your tasks into phases, such as online marketing, search engine optimization, offline marketing, and so on.
Event planning Gantt chart excel template
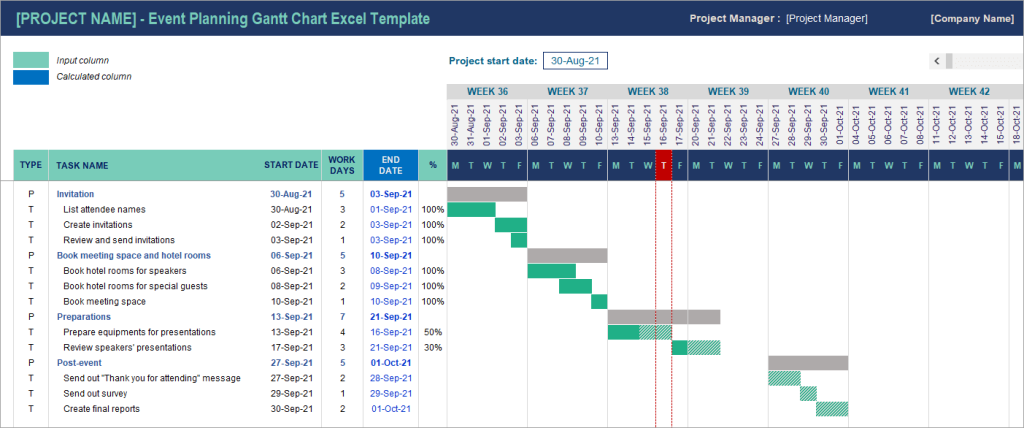
Download: Event planning Gantt chart Excel template
When planning an event, it doesn’t matter how many people will attend. All events require careful preparation for unforeseen circumstances that could arise on your special day! A Gantt chart can help you ensure everything is organized in advance!
Use this template to plan all activities needed for your big day. It has pre-defined tasks as examples, making it easy for you to follow and add more tasks of your own.
How to create a Gantt chart in Excel from our template
There are various types of Gantt charts – some are basic and easy to build, while others are complex with different granularity. Irrespective of the complexity of the Gantt chart, the process of building one in Excel from our template is standard and simple.
One of the prerequisites to creating a Gantt chart in Excel is to have data in Excel. If you are using different applications to manage your projects, import that data to Excel.
Follow the steps below to create a Gantt chart from our Excel templates.
- Go to File => Save As => Download a copy.
- Open the downloaded XLSX file.
- Read the getting started instructions in the “Readme” worksheet.
- Start inputting your project data and save your file as an Excel document.
You just need basic Excel skills like how to copy-paste a row. If you want more control over the formatting, such as changing the bar colors, you need to understand basic conditional formatting in Excel.
How to import data to Excel from your data source
Excel is user-friendly and helps manipulate data easily. Teams use it to organize project tasks and track timelines. You can build Gantt charts to analyze and understand data of a single or multiple projects.
Even if you have project data outside Excel, you can directly import it from project management apps like Jira and Trello using Coupler.io to Excel and create near real-time Gantt charts. You can do this in 3 simple steps.
1. Collect project management data
Select the desired project management app for ‘Source’ and click on Proceed in the form below. You need to log in to your Coupler.io account or create a new one for free.
For example, if JIRA is your source, add details like source account, basic settings, and advanced settings.
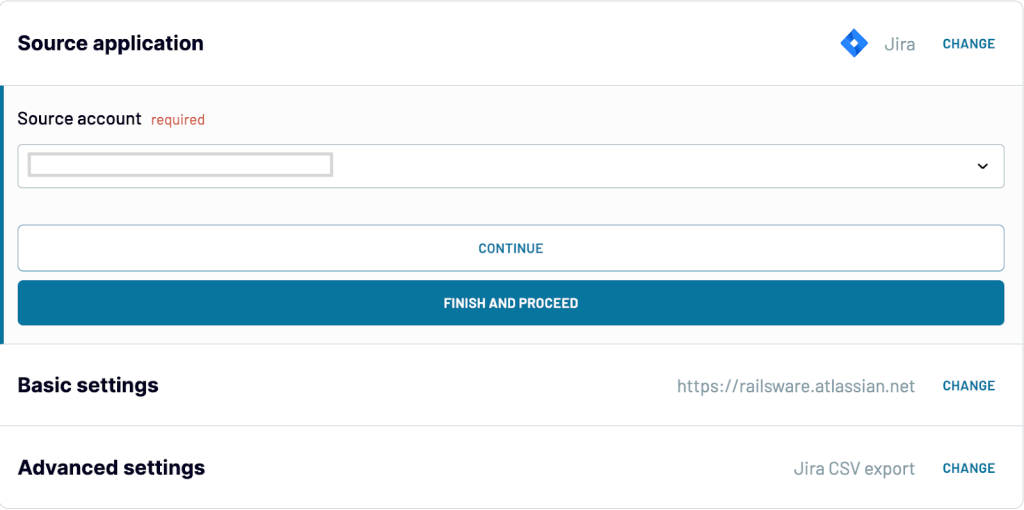
Here you can add more than one source and transform it in the next step.
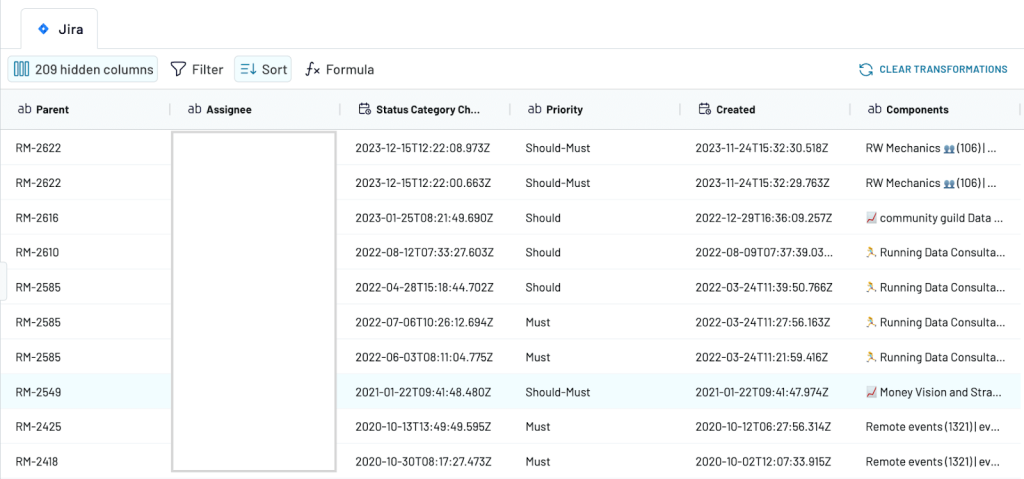
2. Organize data
Before you export your data, make sure it’s set up the way you need it. You can:
- Change column names, move them around, hide some, or add new ones.
- Use filters and sort your data.
- Add new columns with your own formulas.
- Combine data from different accounts or apps.
In the destination settings, connect your Microsoft Excel account. Choose the workbook and the worksheet where to load data. Optionally, you can select cell address and import mode.
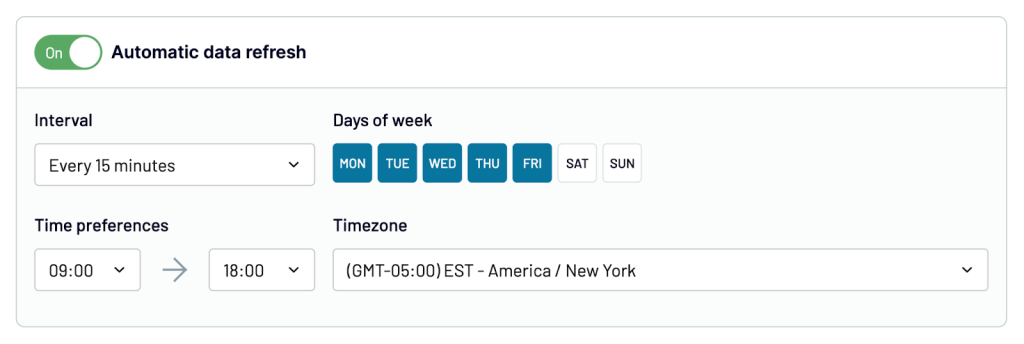
3. Schedule data updates
Enable automatic data refresh to have updated data in your Gantt charts. Specify the update interval from every month to every 15 minutes.
To know more about importing data to Excel using Coupler.io, check out the complete list of Microsoft Excel integrations.
Other examples of Gantt chart templates in Excel
Unlike the above templates, the Gantt chart examples discussed in this section can be used directly by entering your data in the cells. To use the free Gantt chart Excel template, just download the template and open it in Excel.
Scrum Project Management Gantt Chart Template
Download: Scrum project management Gantt chart Excel template
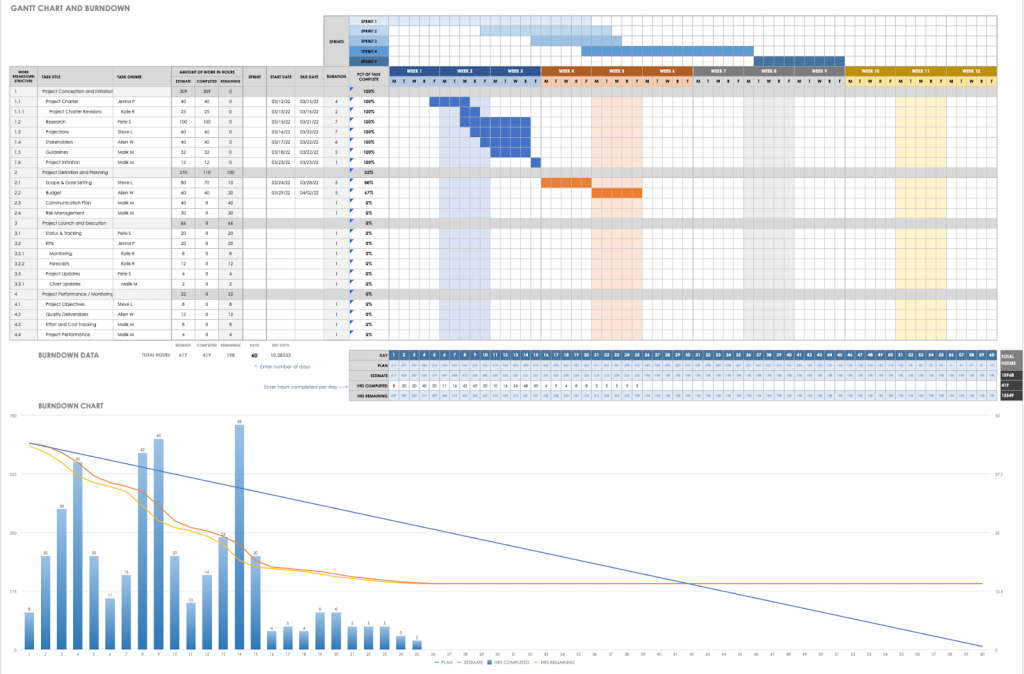
When handling an agile project, scrum masters and project managers can use the scrum project management Gantt chart template. You can plan, coordinate, and track sprint tasks and milestones. While the Gantt chart helps monitor project progress, the Burndown chart helps in mapping the remaining work against time. The ‘release backlog’ section can be used to prioritize the backlog items.
Overall, this template can be useful for delivering software development projects efficiently on a schedule. It is also easier for the stakeholders to quickly understand the progress of the project.
Gantt Chart Product Launch Plan Template
Download: Gantt Chart Product Launch Plan Template
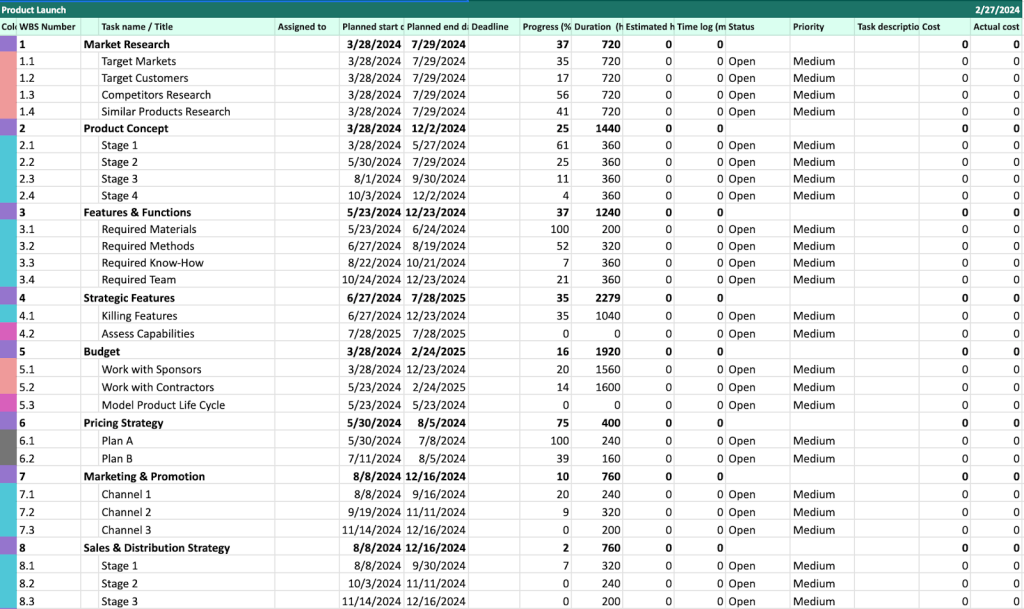
Launching a product comes with a long task list. It starts from market research and goes on till you release it. A product launch Gantt Chart template helps product managers, developers, and marketing teams streamline the launch process. In this example, we divided the tasks into major categories and assigned team members for each task with start and end dates. You can also see columns for duration, status, priority, and costs to manage resources effectively.
You can visualize the project timeline, understand task dependencies, make sure that deliverables are met, and keep the launch on budget. With a roadmap of the entire project with all tasks and deadlines, the teams stay organized and communicate effectively.
Gantt Chart for Retail Business
Download: Gantt Chart for Retail Business Template
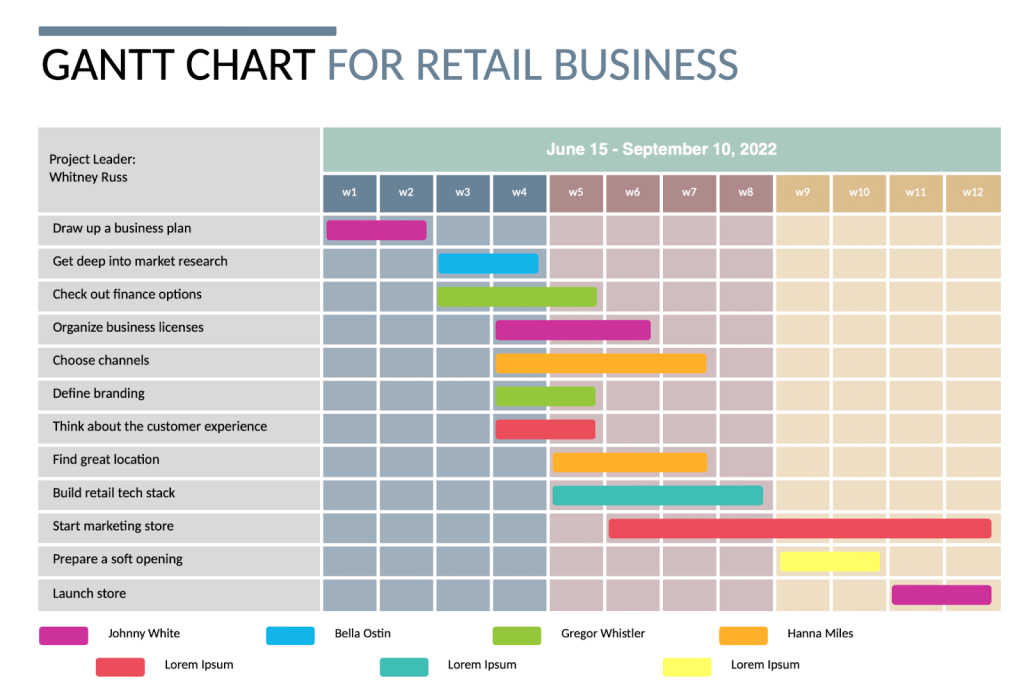
This Gantt Chart for Retail Business is perfect for planning and tracking all the activities of starting and running a retail store. Each activity is given a different color bar to indicate the different team members responsible for the task. It helps to understand the progress and makes sure that tasks do not overlap while opening a retail store. Everyone in the team can easily coordinate their efforts and hit deadlines.
Agile Project Plan Template
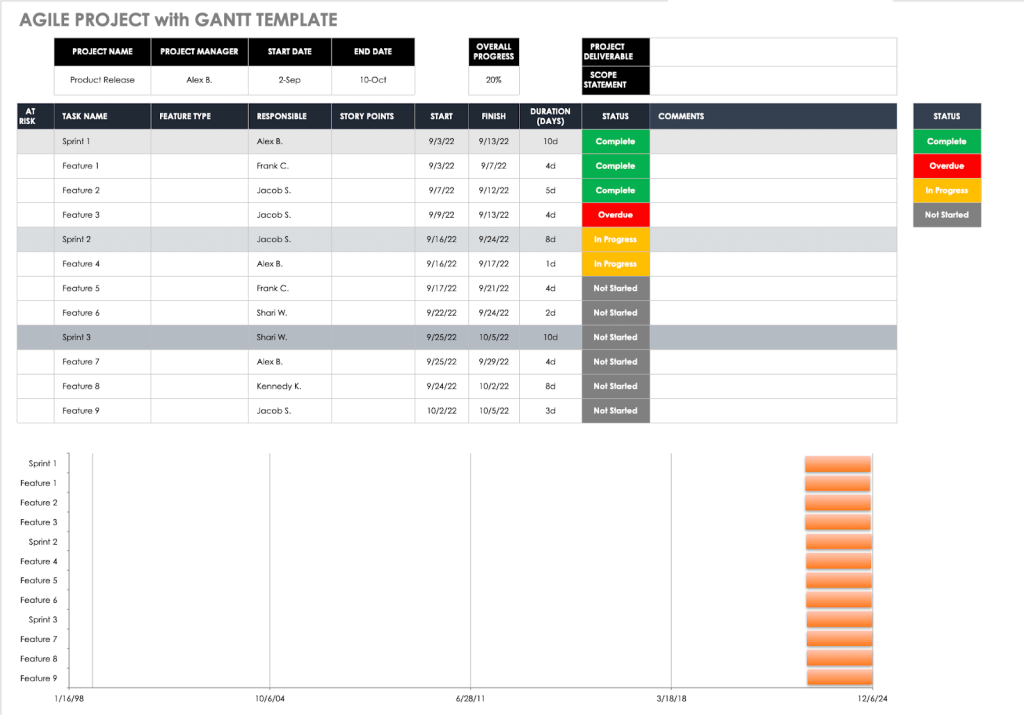
Download: Agile Project Plan Template
The Agile project plan template in Excel is for agile teams to plan and monitor project tasks. Project managers can assign tasks, set timelines, and track progress using story points. It helps in task management and keeps the project on schedule.
It is a bit different from the Scrum project management template we discussed earlier in this section by giving a broader view of the project, including risk assessment and more detailed tracking of individual tasks.
School Assignment Gantt Chart Template
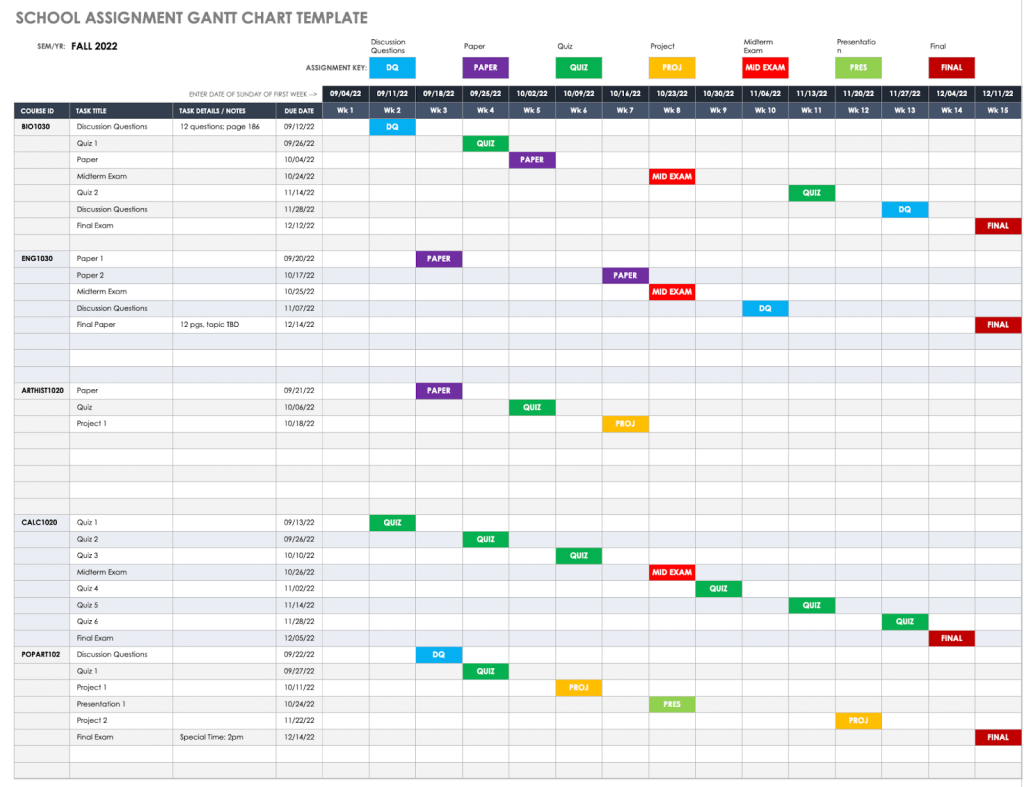
Download: School Assignment Gantt Chart Template
The School Assignment Gantt Chart Template organizes academic deadlines and helps students and educators visualize the semester’s workload. You can plot out due dates for quizzes, papers, and exams across different courses, with color-coded bars to indicate each assignment’s duration. This template helps balance study schedules, prioritize tasks, and ensure timely submission of work.
Wrapping up: Gantt chart template in Excel for your project
A Gantt chart is a valuable tool to help you plan, track, and communicate your project schedule. They can also help you identify any potential problems that may arise before it’s too late.
Creating Gantt charts from templates can save you precious time. We hope that the templates in Excel we provide are great for helping you plan out your project in an organized and visually appealing way.
Finally, when you already have a list of tasks in Jira or other project management apps and want to import them in Excel to create a Gantt chart visualization, try Coupler.io. This integration tool also allows you to automate the import process on a schedule to be more efficient!

Automate data export with Coupler.io
Get started for free