Creating custom dashboards in Universal Analytics was easy. You could simply import a template from the Google Analytics Solutions Gallery and analyze website performance in minutes. In contrast, Google Analytics 4 (GA4) dashboards can feel overwhelming due to the variety of available report widgets and the complexity of the event data tracking.
This guide explores native GA4 dashboards and what you can do with them. We’ve also included five Looker Studio templates that you can use for free to visualize your Google Analytics data.
How does Google Analytics 4 work?
Google Analytics 4(GA4) is Google’s native tool for marketers to track website performance metrics, user interactions, and events.
Unlike its predecessor, Universal Analytics, GA4 monitors and records real-time events users perform across your website or app. This offers you more detailed information than older versions of the tool.
You can easily integrate GA4 with other Google tools, including Google Ads, to monitor conversion rates across multiple campaigns. This makes measuring marketing attribution for organic search and paid campaigns easy inside one comprehensive Google Analytics dashboard.
How to set up Google Analytics 4
Setting up Google Analytics 4 is straightforward. When you follow Google’s documentation, you can complete it in just a few steps without technical expertise.
First, you need to create a free Google Analytics account if you don’t already have one. Next, create a new GA4 property for your website or app in the settings area of your account. You’ll then need to configure the data streams you want to track. These can include your website or mobile apps.
The final step is adding the Google Analytics 4 tag to your website or app to start collecting data. You can use the Google Tag Manager tool to do this.
Adding the Google tag enables data to flow from your website to GA4, where you can monitor it using various graphs and reports.
Getting started with Google Analytics 4 dashboard
Google Analytics 4 comes with pre-set dashboards that include specific reports for tracking important metrics, such as organic search traffic, referral traffic, specific page views, active users, and e-commerce revenue.
You can customize dashboards by adding and removing Google Analytics data widgets or create custom reports using the Explore section in GA4.
Pre-built reports
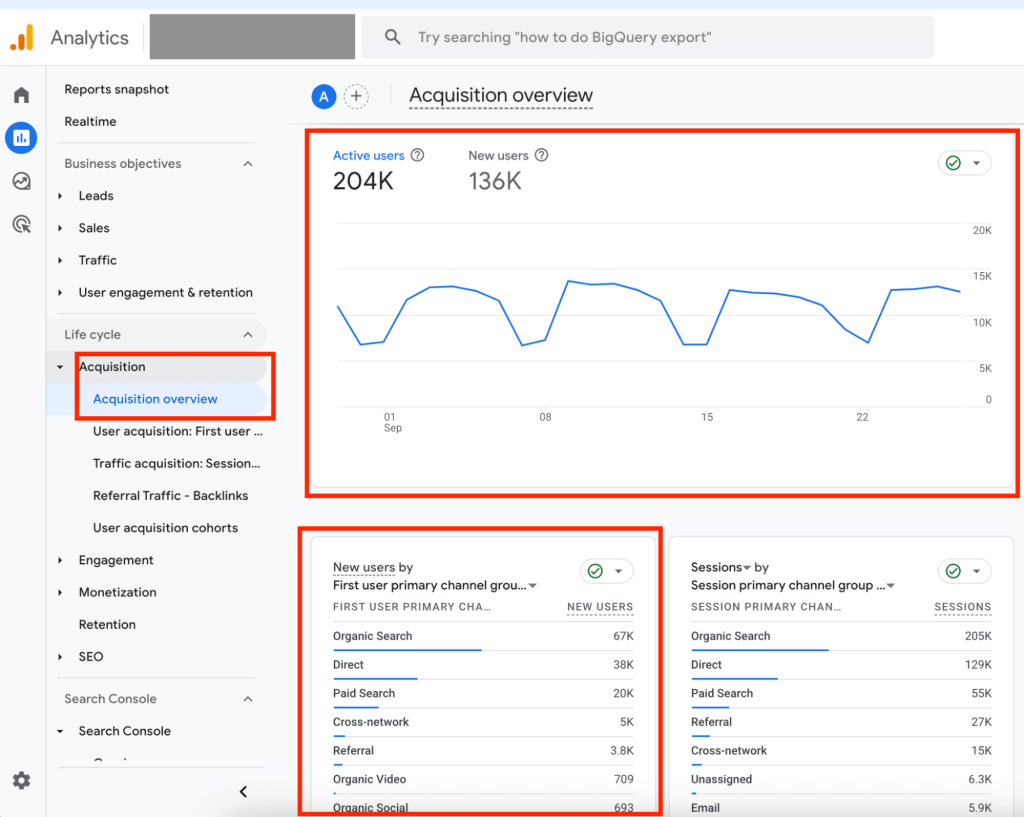
The pre-built reports in Google Analytics 4 focus on performance metrics across four main customer lifecycle stages: acquisition, retention, engagement and monetization.
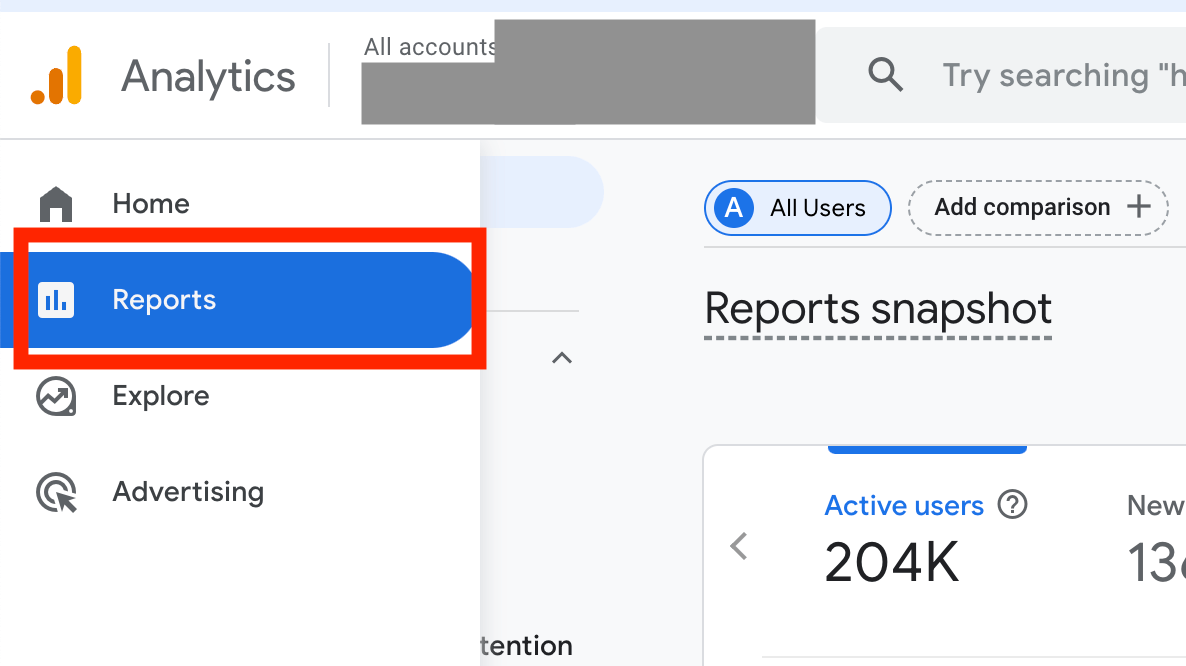
You can find these in the Reports section inside your account.
Each dashboard is set to track specific data points using reporting widgets. These widgets enable you to visualize the data for a particular date range in multiple formats, including bar charts, tables, and line graphs.
For example, the Acquisition report includes a New Users report widget that displays the total number of new users across a specific date range. It also features a New User distribution widget that shows the total number of new users split based on acquisition source or other criteria.
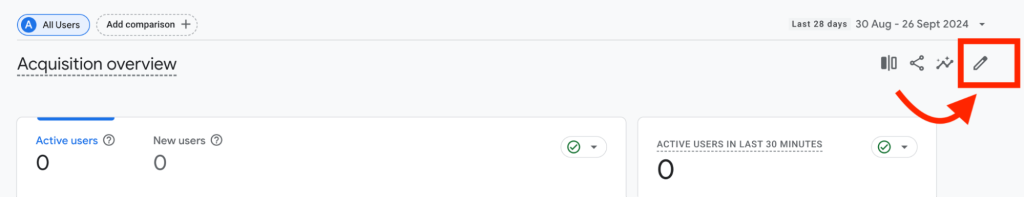
You can easily add widgets to build a customized reporting dashboard by clicking on the pen icon in the upper right corner of each dashboard.
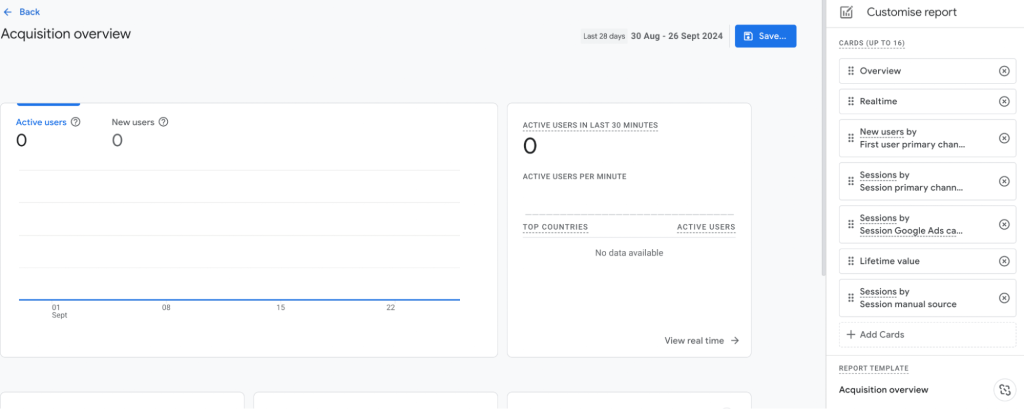
This will open a sidebar with all available report widgets you can add to your dashboard. You can’t create specific report widgets here; you’re limited to the existing ones created by Google.
Custom reports builder
If you want to visualize specific data points and none of the pre-built reports suffice, you can use the Explore reports in Google Analytics to access a custom report builder.
Navigate to the Explore section using the left-side menu inside your account to get started.
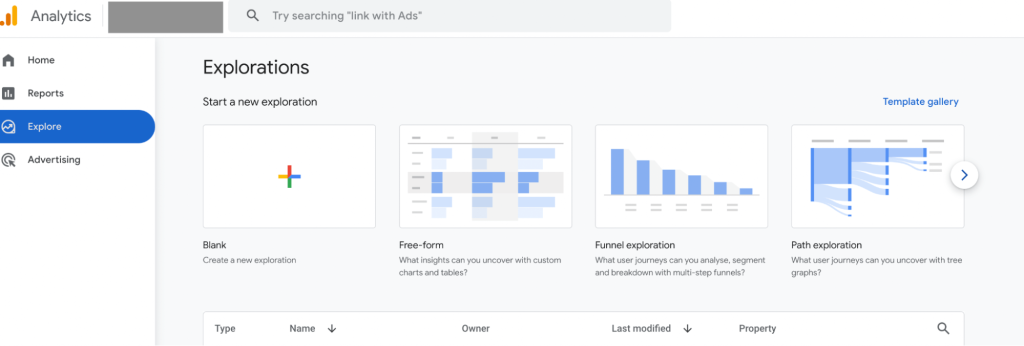
You can use the blank canvas report to mix and match specific dimensions and metrics to visualize available data.
Alternatively, choose a template from the gallery and add your required customizations. Google offers comprehensive reports in its templates, including funnels, paths, cohorts, and free-form reports.
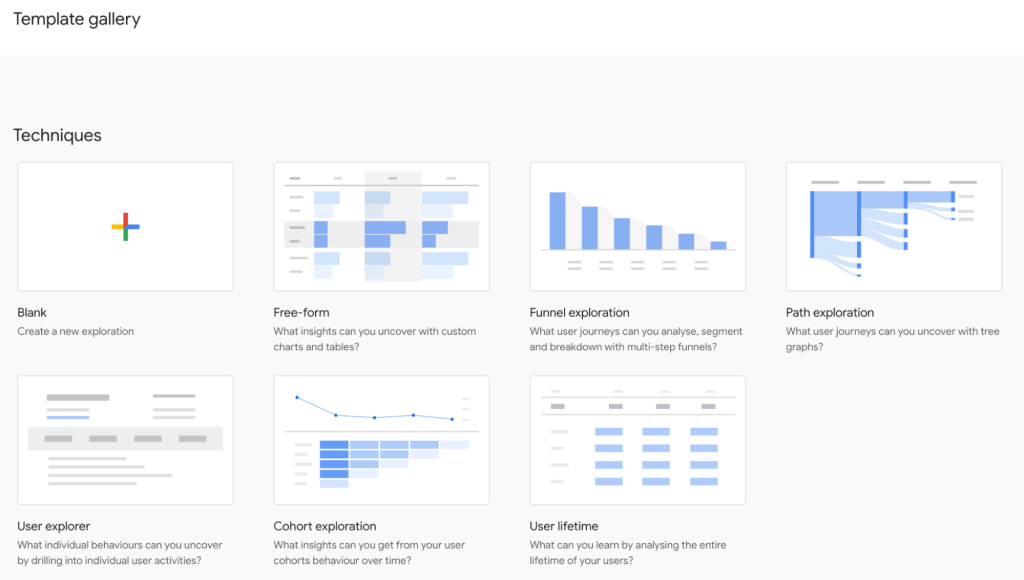
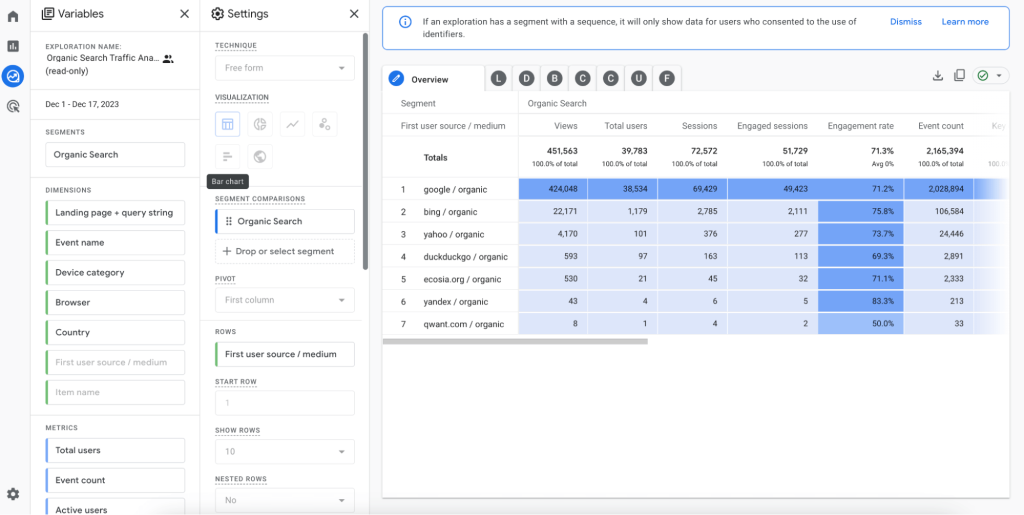
For example, a free-form table report works well when analyzing multiple metrics across specific segments in one view. This enables you to easily track several performance KPIs for multiple segments.
Both Google Analytics 4 pre-built and custom reports offer comprehensive views of your data, helping you analyze and act on data to enhance your marketing efforts.
The problem? Having so many widgets plus not knowing which dimensions or metrics are compatible inside the same report can be overwhelming.
This makes it hard to properly analyze data and get the needed insights.
The solution? Instead of wasting time trying to figure out Google Analytics native reports, use a dashboard template customized to visualize specific GA4 data inside Looker Studio.
Free GA4 dashboard templates
Free GA4 dashboard templates can be an excellent alternative to native Google Analytics dashboards if you want to build custom reports fast. Templates allow you to get started quickly and visualize data without being limited by available reports in GA4.
You can also collaborate and share dashboards without needing to give external contributors access to your Google Analytics account.
The best GA4 dashboard templates for digital marketing teams use Looker Studio as a data visualization tool. This is because it offers great functionality and ease of use when it comes to creating custom Google Analytics reports.
Here’s our curated list of the best templates to choose from for your new dashboard:
All-in-one dashboard for Google Analytics 4
This all-in-one marketing dashboard offers a performance overview of your marketing efforts across multiple channels. It collects data from Google Analytics, Google Search Console, advertising platforms, social media apps, email tools, and YouTube.

Using this dashboard will give you a more comprehensive view of your marketing campaigns, as you won’t be analyzing GA4 metrics alone.
For example, the All channels section provides a high-level summary of the performance across all your marketing channels. The pie chart shows a share of overall traffic across each channel.
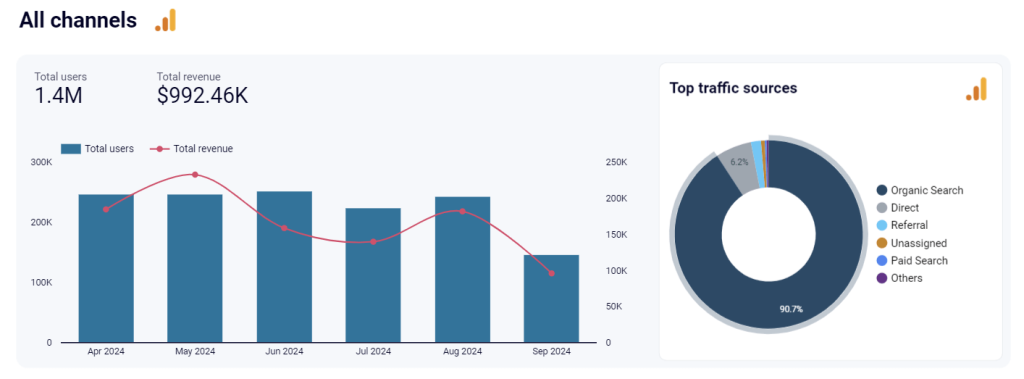
You can then track the performance of your PPC marketing through key metrics, including the amount spent, impressions, clicks, cost per click, and click-through rate.
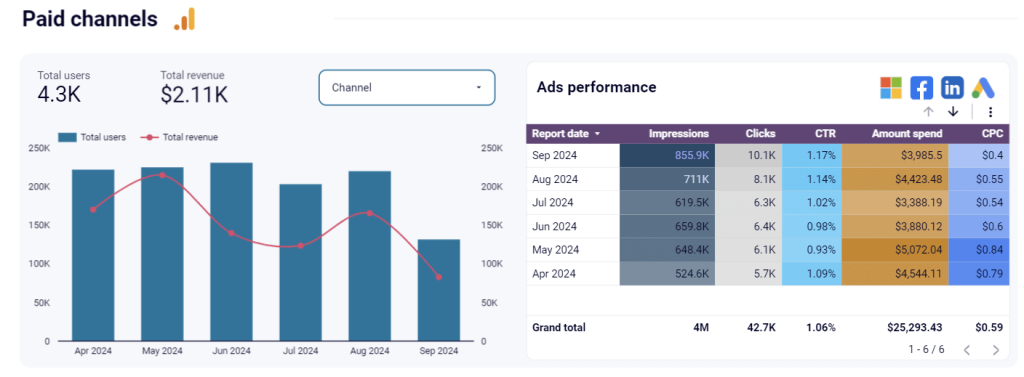
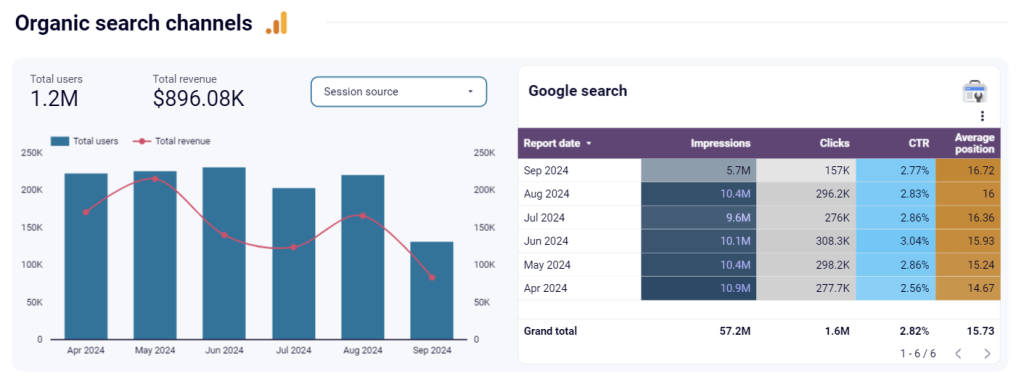
It also includes organic search performance, which lets you track impressions, clicks, CTR, and average position based on data from Google Search Console.
This report is available in Coupler.io and as a template in Looker Studio. Try it right away for free!
GA4 key event insights dashboard
The GA4 key event insights dashboard helps you track how users interact with key elements on your website. It provides a clear breakdown of high-value actions like form submissions, button clicks, purchases, or video plays to measure engagement and conversion trends.
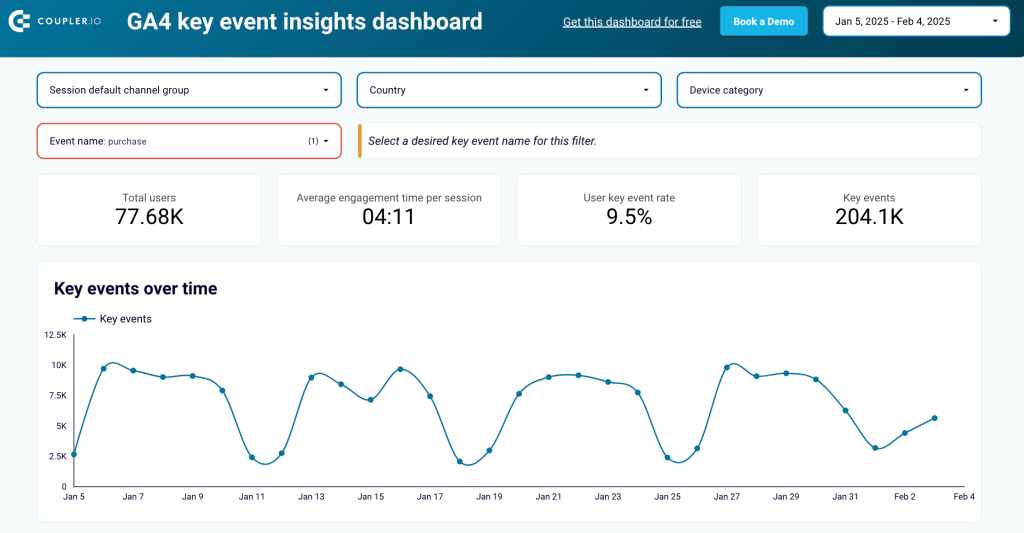
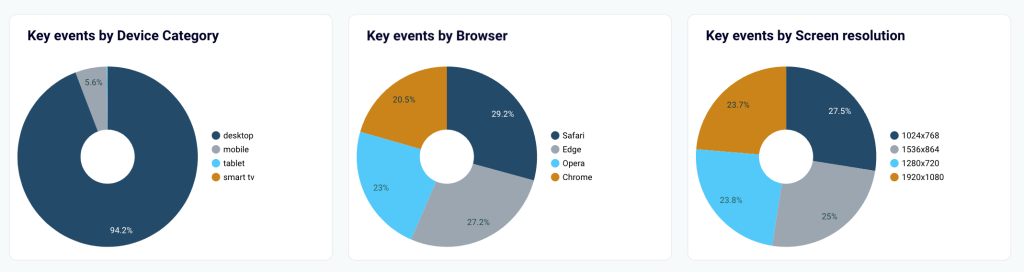
Use this dashboard to analyze traffic sources driving key events, compare user behavior across different devices, and monitor event completion rates over time. You can filter data by event type, traffic channel, and user segments for a deeper understanding of performance.
The dashboard integrates with Looker Studio and connects via Coupler.io, ensuring automated updates with fresh GA4 data.
Website traffic from YouTube – performance analysis dashboard
This YouTube traffic dashboard helps you measure data from GA4 and analyze metrics for traffic coming to your website from YouTube. It allows you to estimate how well your YT content drives users to your website and how much revenue you get from this traffic.
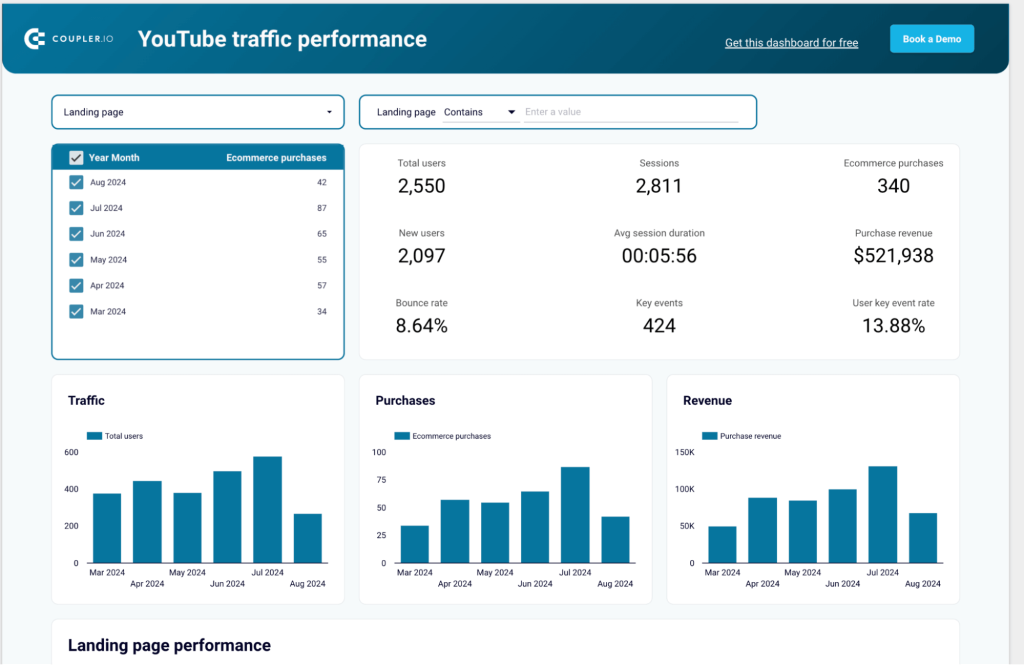
Use this template dashboard to understand how users who click on specific links on your YouTube channel behave on your website. You can track how long they stay there, whether they make a purchase, or if they perform any actions / key events.
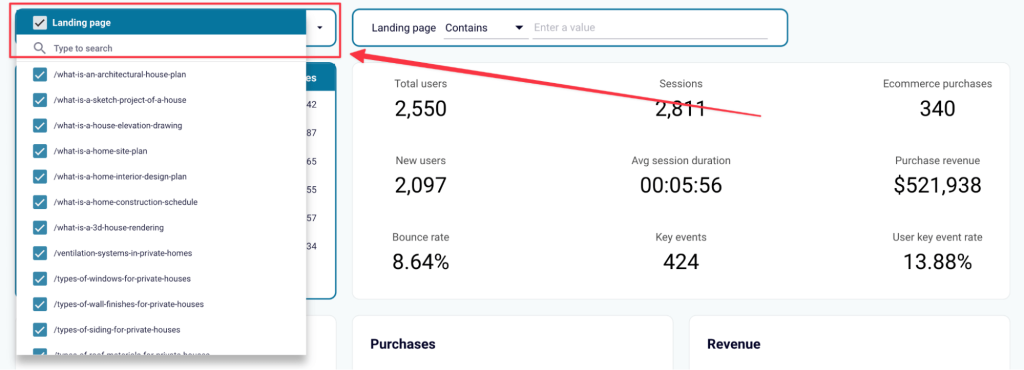
Select the landing page (website page) from the drop-down filter, and the dashboard will show metrics for this specific page.
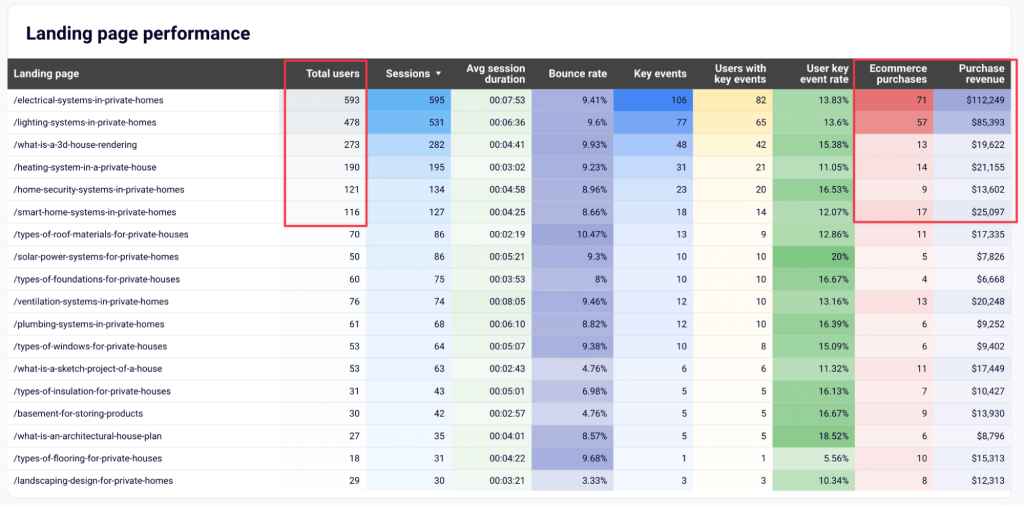
Sort data by Clicks, Ecommerce purchases, and Purchase revenue to see which website pages produce the best results.
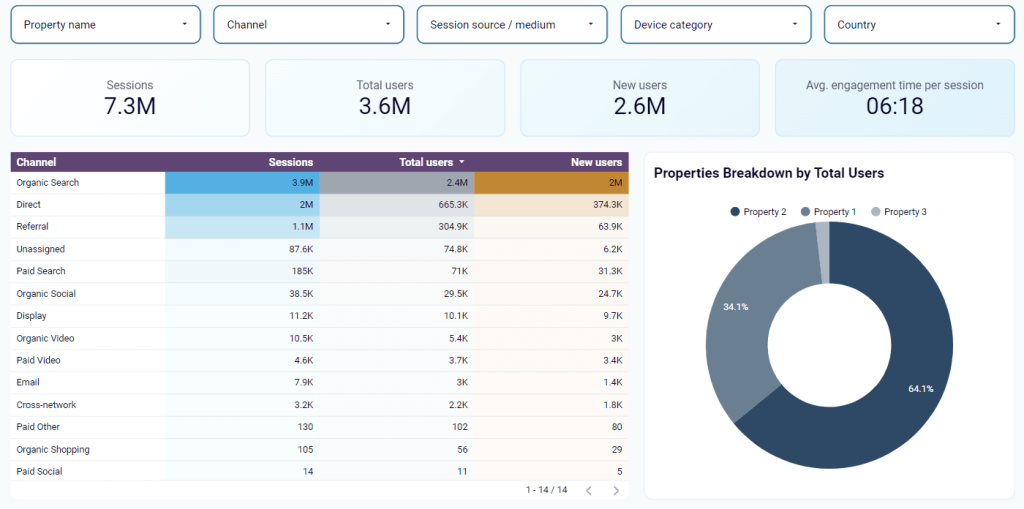
Multi-website GA4 dashboard
The multi-website dashboard provides aggregated GA4 data of several websites on a single page. You can see the traffic and engagement of all your websites on the same dashboard.
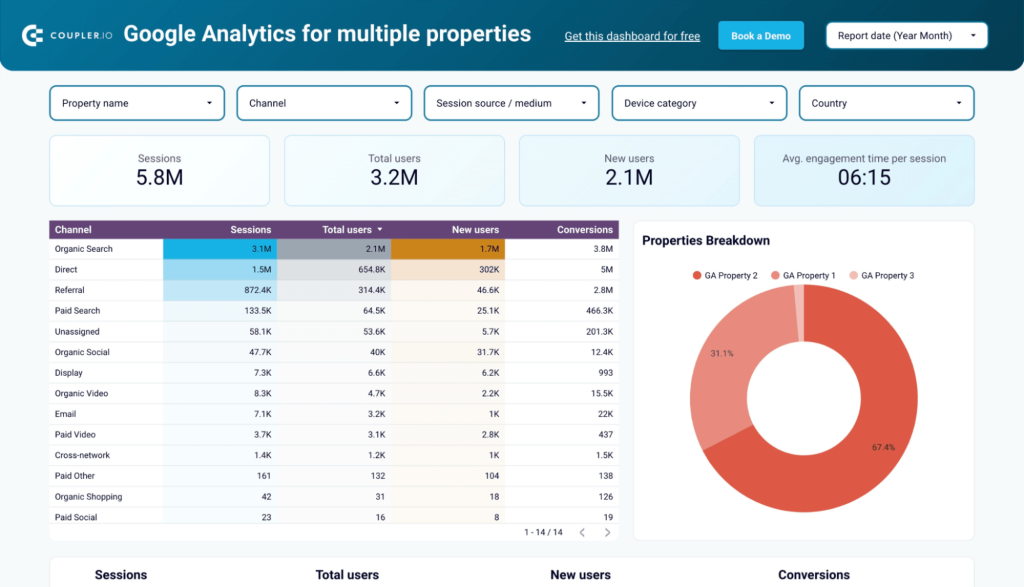
Agencies can use the dashboard to track the total traffic of their client portfolios. Multi-product companies and multi-website media can also use it to track total traffic and total awareness, respectively.
For example, you can get an overview of the main performance metrics and filter them by properties (websites), channels, and other criteria.
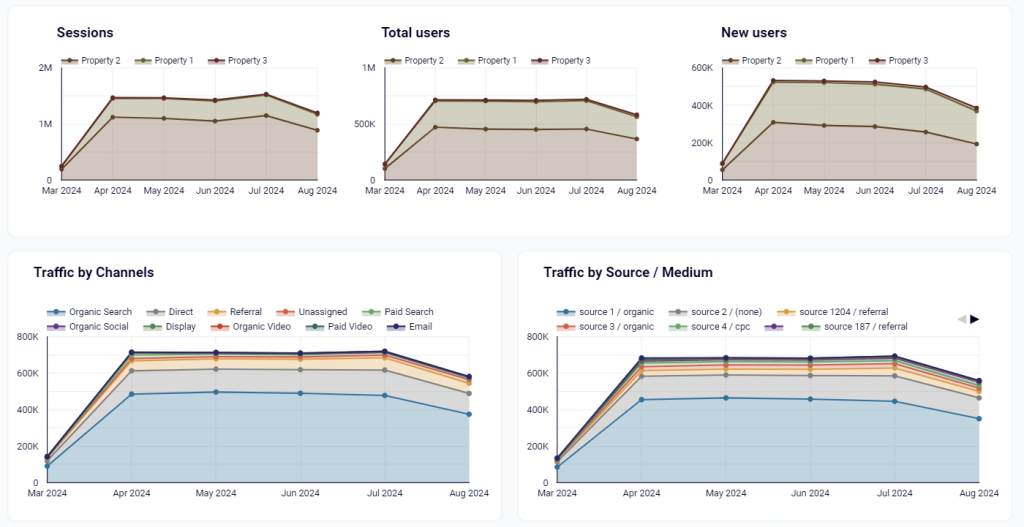
You can also monitor traffic growth for all your websites by month.
This makes it easy to spot traffic drops or spikes, allowing you to act and adjust your SEO marketing campaigns for long-term growth.
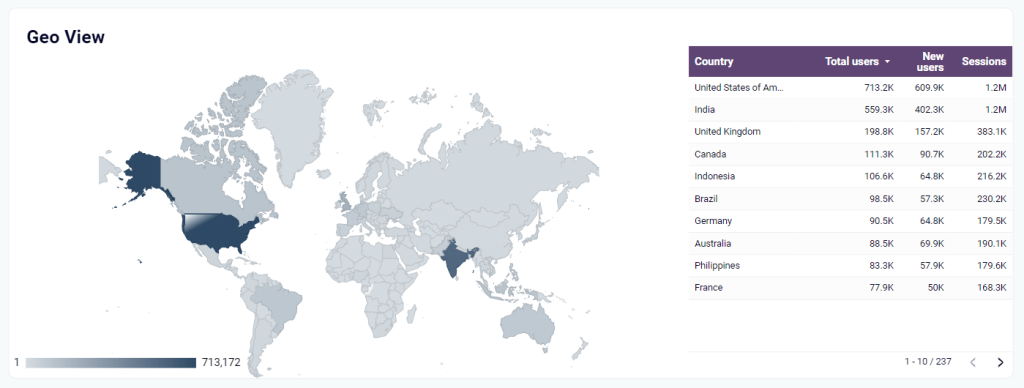
This GA4 dashboard includes a geomap showing where most of your traffic comes from for smart decision-making on localization efforts.
Web analytics GA4 dashboard
The web analytics dashboard template gives you an overview of daily updates on key product and marketing metrics. Track daily search engine traffic growth and conversions and gain insights into your users’ behavior and engagement.
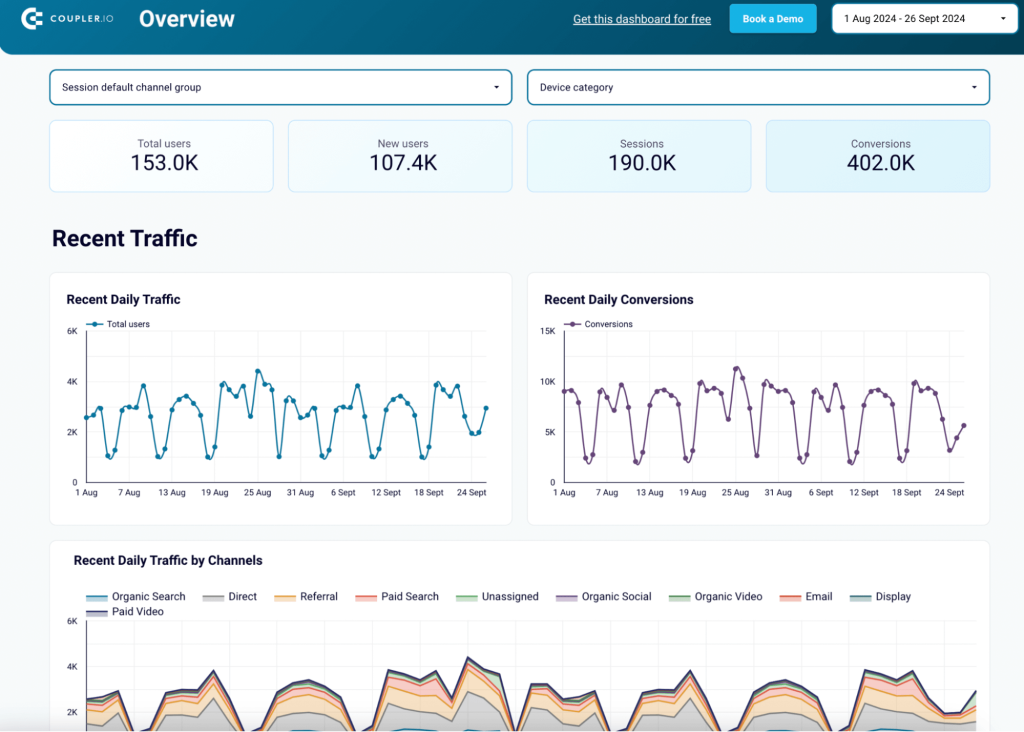
This dashboard is great for marketers looking to analyze website performance and gain the insights needed for successful optimization strategies.
For example, check the acquisition reports on the dashboard to understand where your audience comes from. This includes traffic sources, channels, and demographic data.
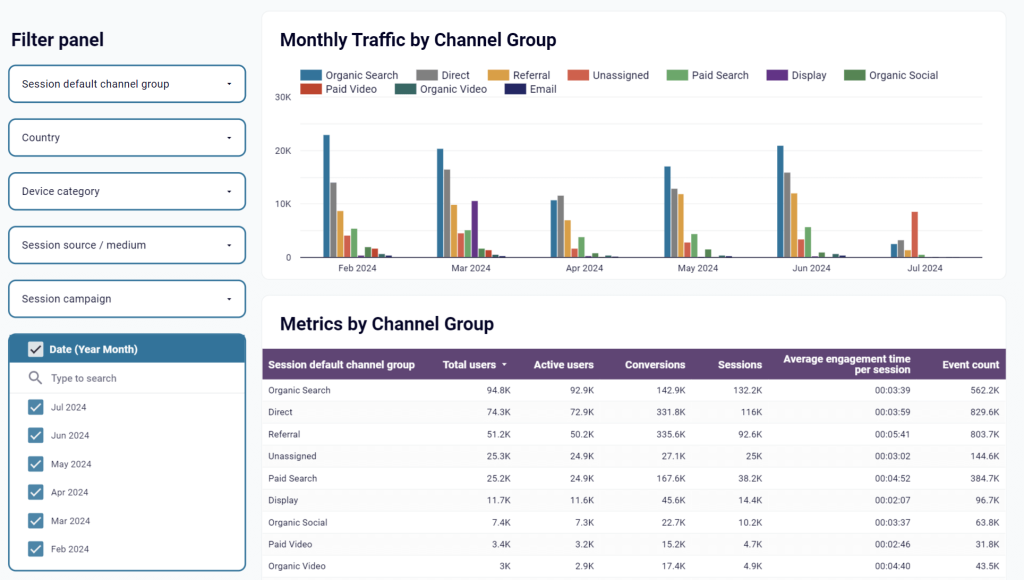
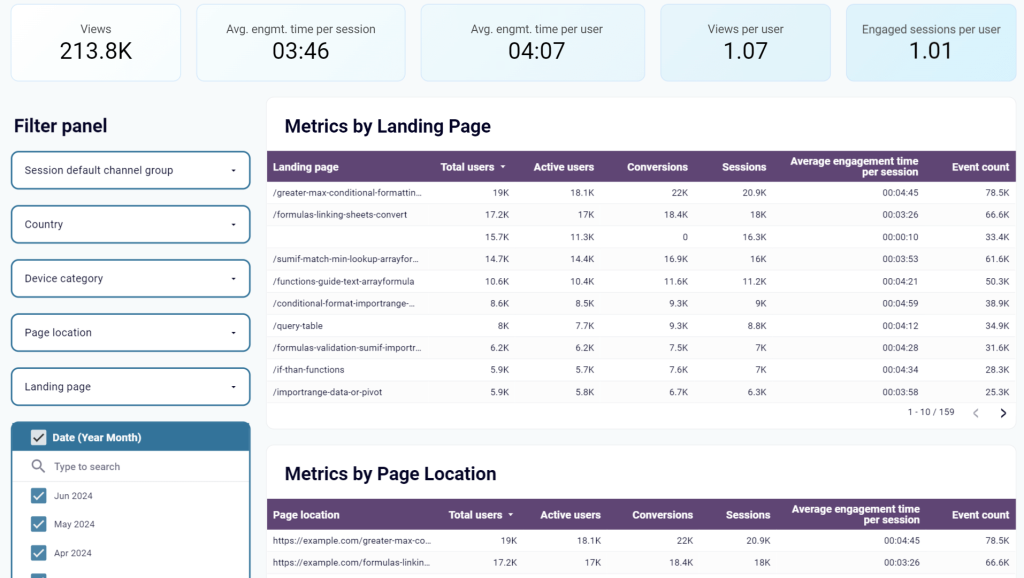
For further insights, you can analyze engagement metrics by landing page or location.
Then, use the conversion funnel analysis to understand where users drop off.
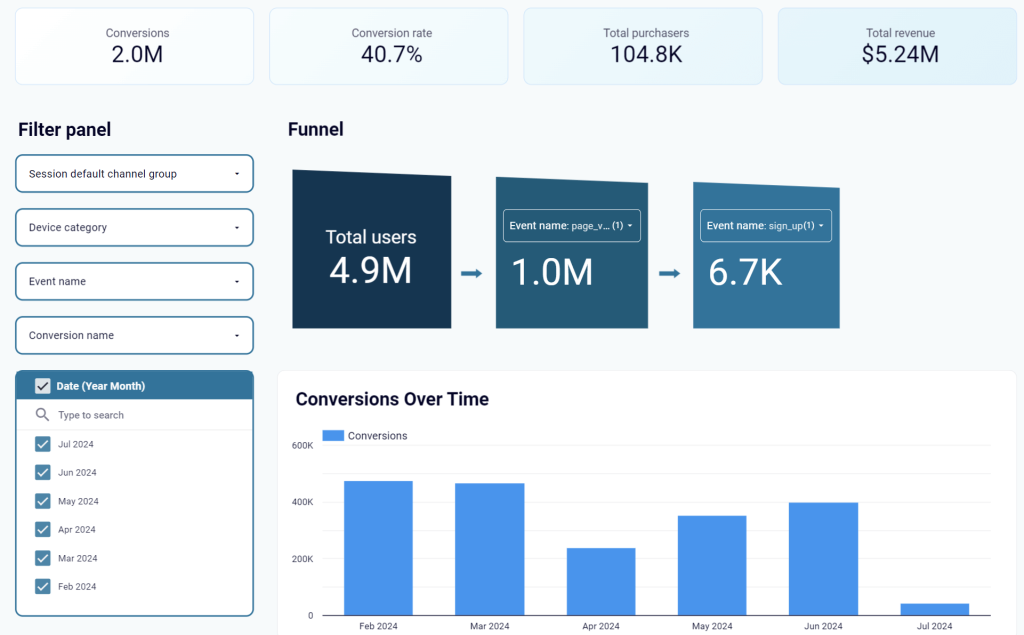
Use the web analytics GA4 dashboard for in-depth reports on acquisition, behavior, engagement, and conversion metrics in a single view.
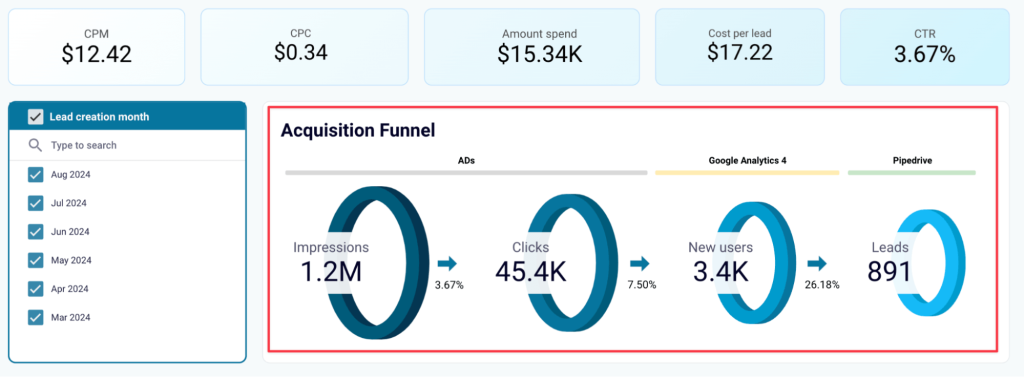
Multi-source sales dashboard
The multi-source sales dashboard combines Pipedrive data with marketing data from GA4 and all major ad platforms, including Facebook, LinkedIn, and Google Ads.
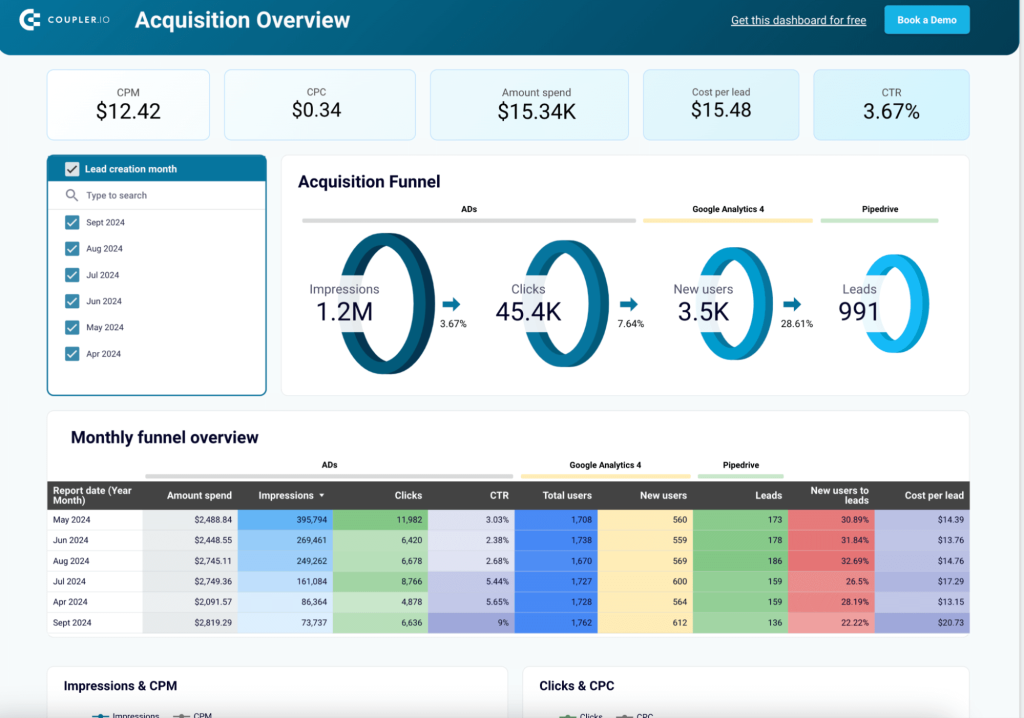
This helps you uncover correlations between marketing and lead-generation activities.
For example, track funnel performance changes over time to identify the best-performing month and link it to specific marketing initiatives or campaigns that may have driven higher sales results. Look at how many leads you get from total traffic and how many convert and at what cost.
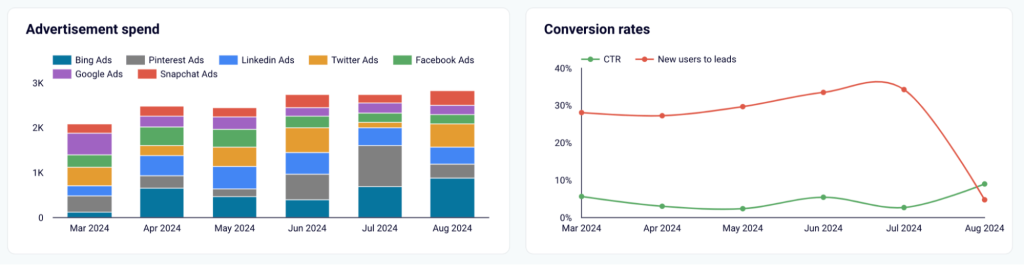
You can also compare spending costs on different platforms and conversion rates for the same period. For example, the chart below shows that Bing campaigns in August had the largest spend, but lead conversions dropped.
How to build an external dashboard with GA4
To build and customize an external dashboard, you can connect Google Analytics 4 to Looker Studio or other data visualization tools.
You don’t need any technical skills to set this up.
Here’s how you can use Coupler.io automation tool to automatically export GA4 data. Select the desired destination app in the form below and click Proceed. You’ll be offered to create a Coupler.io account for free with no credit card required.
After that, you only need to complete 3 steps:
Step 1. Extract data from GA4
- Connect your GA4 account and grant the requested access permissions. This is needed for importing your data into Looker Studio. Then, select one of the Analytics accounts available in your Google Analytics account. Choose the property you want to export.
- After this, choose up to 9 dimensions and up to 10 metrics you want to include. You can also specify the period for your report. By default, Coupler.io will export data for the last 30 days.
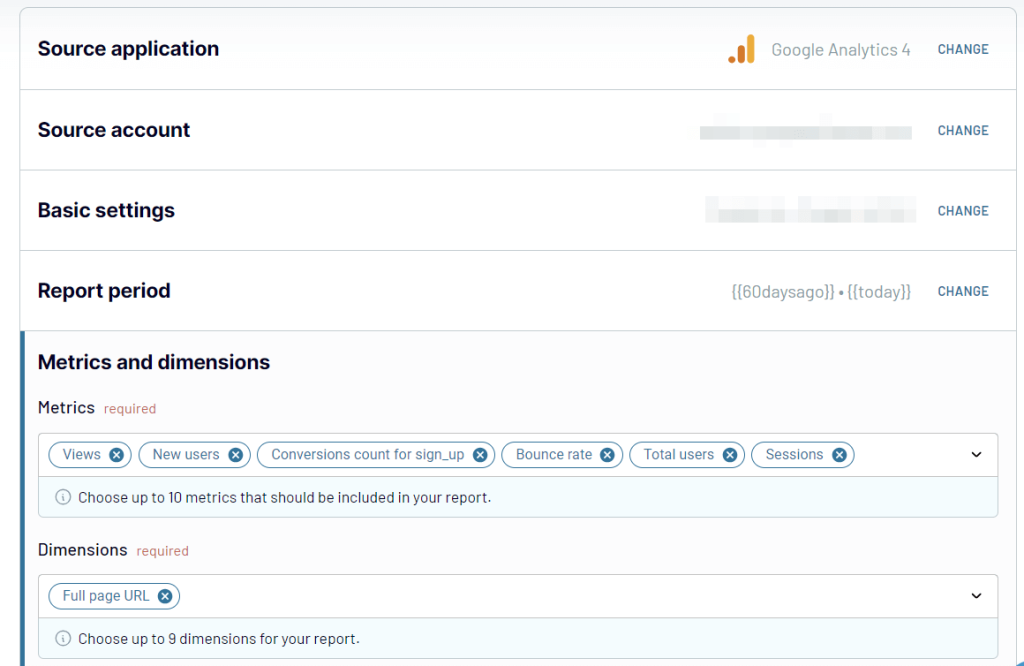
You can specify your preferences in the Summarize metrics field if you want your report to have a separate row showing the minimum, maximum, and/or total values of the selected metrics.
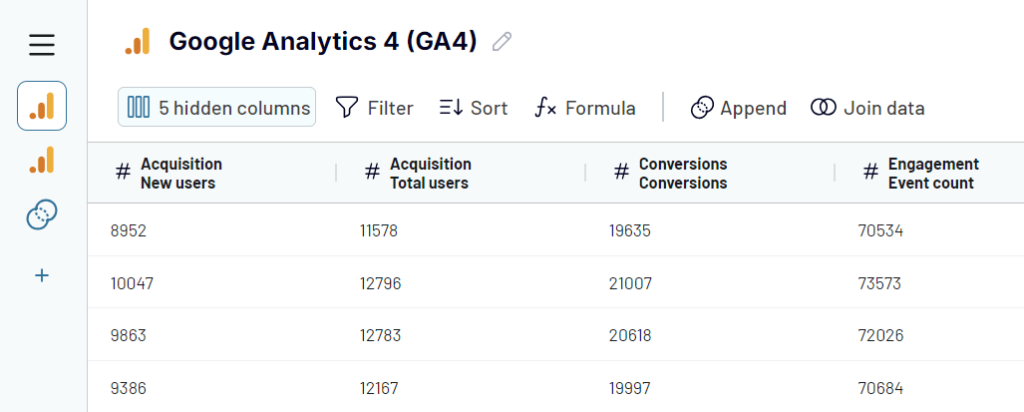
Step 2. Transform data before loading it into Looker Studio
Before loading data into Looker Studio, you can preview and even transform it:
- Hide, rename, and reorder columns, and change their data type.
- Add new columns using supported calculation formulas.
- Sort and filter data based on the selected criteria and specified values.
- Aggregate data from multiple GA4 properties, different applications, and sources.
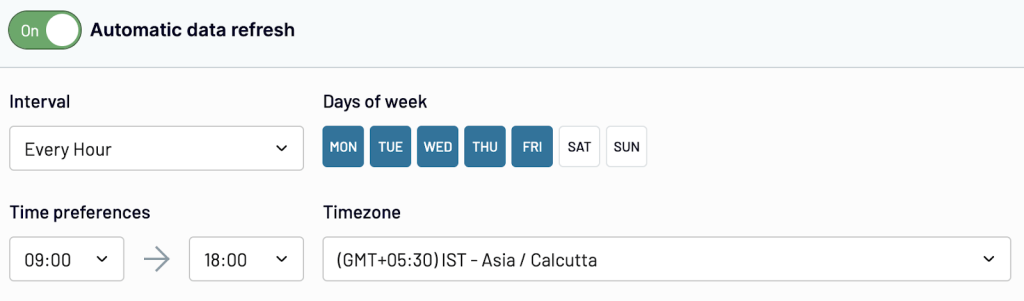
Step 3. Load data and schedule refresh
For the last step, you need to connect your Looker Studio account.
Turn on the Automatic data refresh and configure the desired schedule. This will automate exports of data from Google Analytics 4 to Looker Studio at the selected intervals.
Once everything is ready, press Continue, then Save and Run. Your exported data will be available in Looker Studio, and you can use available visualization graphs, charts, and tables to create a Google Analytics Dashboard for your needs.
Which approach is best to get started with a Google Analytics dashboard?
We’ve covered pre-built GA4 reporting dashboard and its limitations. This option is enough if you’re only looking to occasionally track website traffic and engagement.
The alternative is to use automation platforms to import data in real-time to data visualization tools like Looker Studio.
Coupler.io is perfect for creating self-updating dashboards, calculating custom metrics, and analyzing Google Analytics 4 data. If you want to create advanced visualizations and share them with multiple stakeholders, create a free account and get started in just minutes with our ready-to-use templates.
Automate buisness reporting with Coupler.io
Book a demo


