Google Looker Studio is a great reporting tool until you try pulling data from multiple apps and realize how quickly things fall apart. Native connectors cover only a handful of sources.
I’ll walk you through the most practical ways to load data to Looker Studio and keep it up to date. Learn what actually works for your reporting needs, so you can stop chasing data across apps and start acting on it.
Choose the right method to load data to Looker Studio
The best approach depends on your reporting needs, technical resources, and how often your dashboards need updating. Some methods to connect data to Looker Studio work well for quick manual reporting, while others are built for automated pipelines or advanced analytics.
Here’s when each method typically makes the most sense:
| Import method | Best for | Automation | Technical effort |
| Coupler.io partner connector | Automating imports from CRMs, ad platforms, e-commerce, spreadsheets, and other apps into Looker Studio with scheduling, transformations, and historical data support | ✅ Yes | Low |
| Native connectors | Pulling data from Google products like Analytics, Ads, Sheets, or BigQuery for basic dashboards | ⚠️ Limited (depends on connector) | Low |
| Non-Coupler.io partner connectors | Connecting niche platforms or tools to Looker Studio | ⚠️ Depends on provider | Low/Medium |
| Custom API via storage layer (Sheets or BigQuery) | Building custom ETL pipelines for sources without connectors, with control over data structure and refreshes | ✅ Yes (requires setup) | High |
| Custom direct API connector | Real-time dashboards or proprietary systems where intermediate storage is not an option | ✅ Yes (requires custom scheduling) | High |
If you need to keep dashboards updated, combine data from multiple sources, and minimize manual work, Coupler.io is a versatile solution that handles most scenarios without coding.
Connect your app data to Looker Studio with Coupler.io
Get started for freeHow you can connect your business apps with Looker Studio using Coupler.io
Coupler.io is a data integration platform and AI analytics that provides a partner Looker Studio connector. It lets you collect data from over 400 business apps, organize and structure data sets, and automate data refresh for your Looker Studio reports. On top of data integration, Coupler.io provides dashboard templates, AI analytics, and more. It takes only a few clicks to connect data to Looker Studio.
Try it out for free right away. Choose a source app in the form below and click Proceed:
Next, sign up for Coupler.io (no credit card required) and follow the steps below. 👇
Step 1: Collect data
Connect your source app account following the in-app instructions. Then select a specific data entity, i.e., type of data you want to connect, from the dropdown list. Complete the other required settings, and proceed.
Coupler.io also lets you connect multiple sources in a single data flow. You can merge records from different data types and accounts within one source app, or across various apps.
Step 2: Organize your data
Data from sources often comes with extra details that aren’t immediately useful or don’t match your reporting requirements. To make it an analysis-ready data set, Coupler.io lets you transform the data as follows:
- Filter – Keep only the records relevant to your analysis, e.g., filter out test data or focus on a specific segment.
- Sort – Arrange rows by date, revenue, or other key metrics to make trends easier to spot.
- Hide or remove unwanted columns – Exclude unnecessary fields to reduce clutter and simplify your dataset.
- Rename or rearrange columns – Adjust field names or column order to make the dataset more consistent and clear.
- Aggregate data – Gain quick insights by applying functions like sum, average, count, min, or max, for example, to calculate total sales or average session duration.
- Add calculated columns – Create custom metrics directly from your raw data, such as conversion rate per segment or revenue per active user.
- Combine data sources – Enrich your dataset by merging records from multiple data entities, accounts, or apps for a more complete view of your business performance.
This step is optional yet quite efficient to organize your data for visualization.
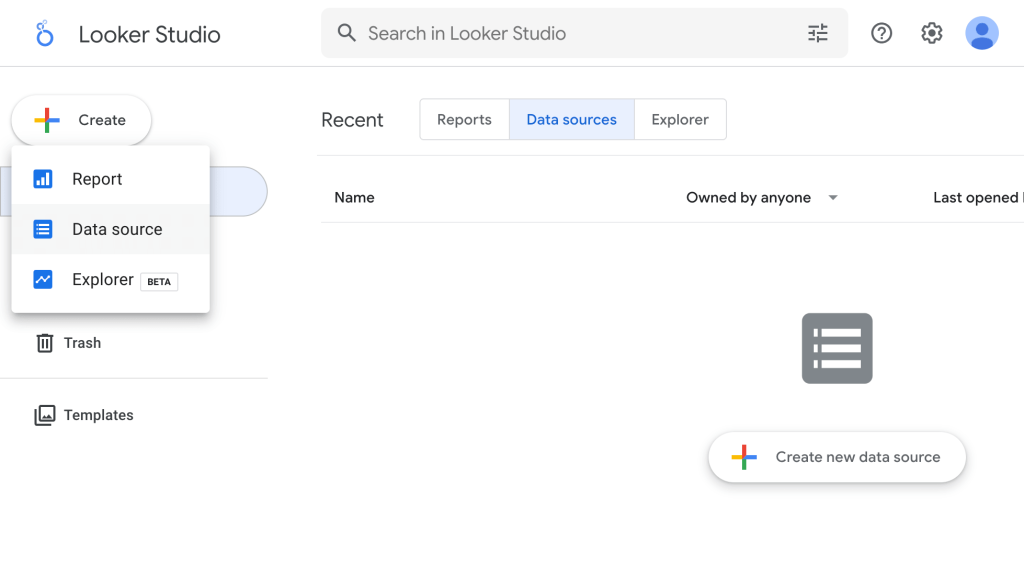
Step 3: Load data to Looker Studio and automate refresh
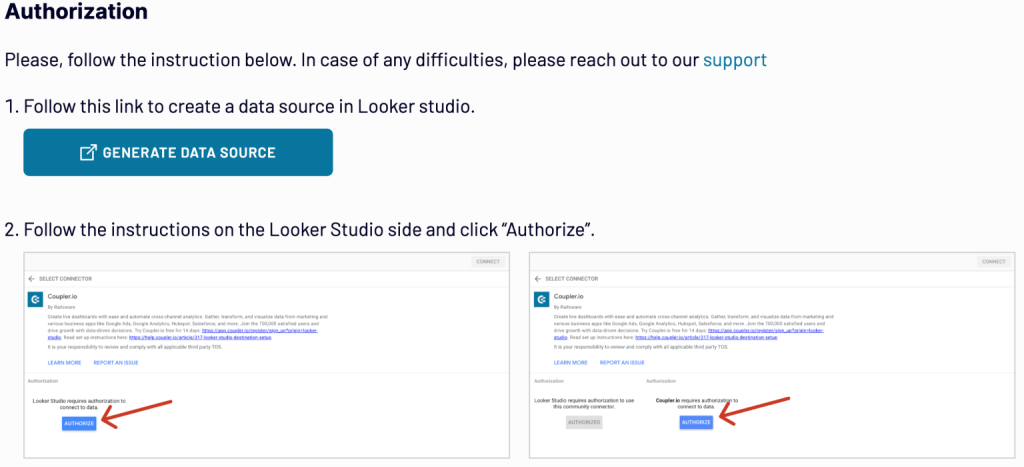
Sign in to your Google account to authorize the Looker Studio connector and generate a data source by following the in-app instructions.
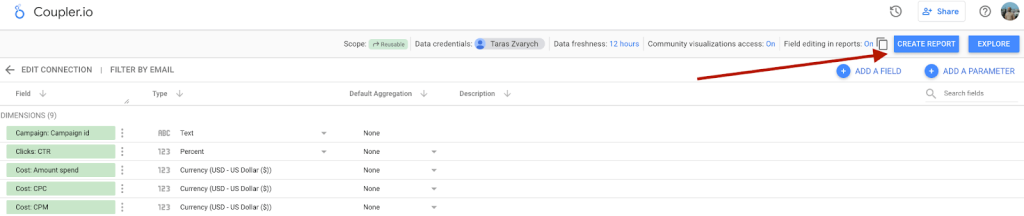
When you connect your data source, click the Create report button.
To keep your records in Looker Studio up to date without manual work, go back to Coupler.io and proceed to turn on automatic data refresh. Then select the interval, days, hours, and appropriate time zone. By default, data refreshes daily. However, you can set it to update more frequently, up to every 15 minutes for almost live reporting.
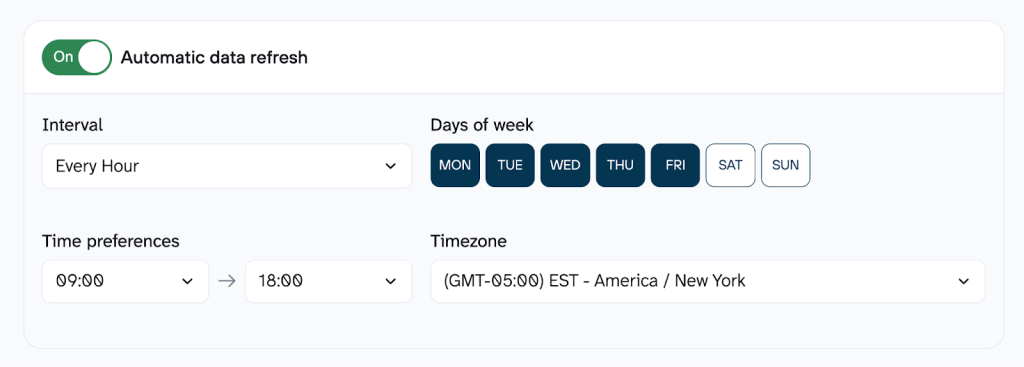
Make sure you click to save and run. Only then will your automation be active.
Bonus: Analyze data with the AI Agent before importing to Looker Studio
Charts in your Looker Studio reports don’t always tell you why something happened. A revenue spike on a dashboard raises a question; it doesn’t answer it. To dig deeper, you’d normally export the data, open a spreadsheet, and start slicing manually.
Coupler.io’s AI Agent lets you skip that step. It sits on top of the same data that feeds your Looker Studio reports. So, you can talk directly to your dataset and get answers. This allows you to validate whether a trend is real, investigate what’s behind an anomaly, or check which segments are driving a metric, all without leaving Coupler.io.
For example, you can ask “Which records contributed the most to revenue last month?” “What are the top-performing campaigns?”, or “Which entries show unusual changes over time?”, and receive immediate answers based on your dataset.
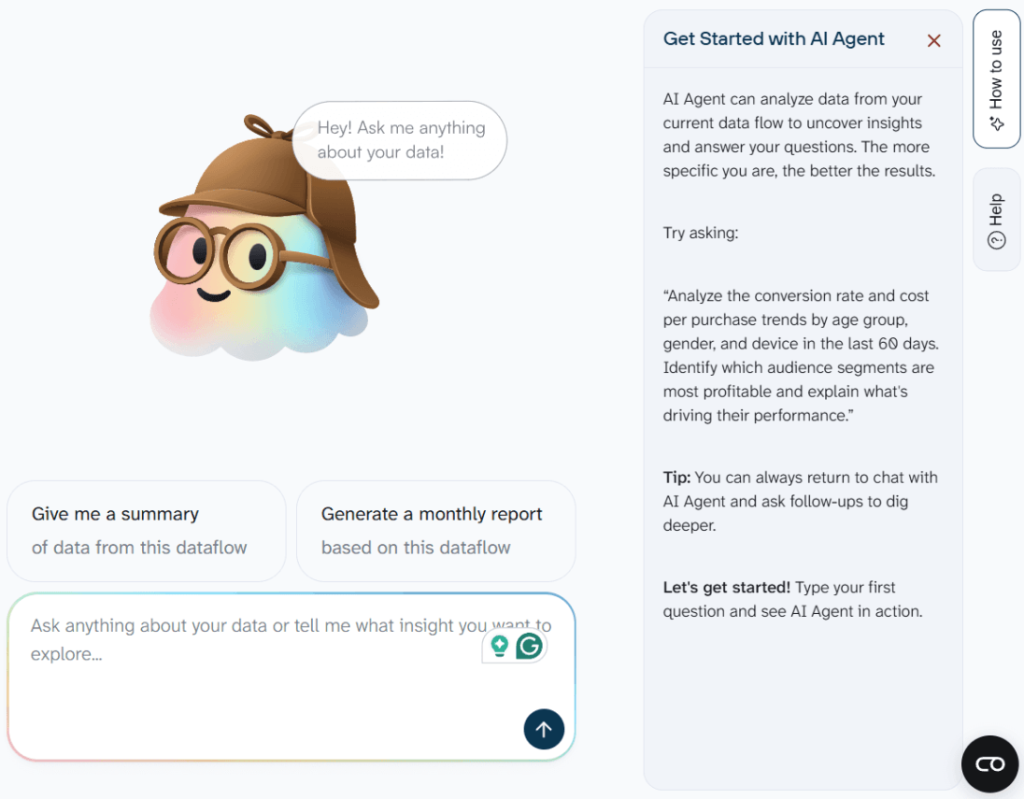
The AI Agent relies on an internal analytics engine that queries the data, performs calculations, and produces validated results. No manual formulas required on your side.
From where can you import data to Looker Studio?
Coupler.io allows you to load data from 400+ source apps across the following categories:
- CRM: GoHighLevel, Pipedrive, HubSpot, Salesforce, Intercom, etc.
- E-commerce: Shopify, WooCommerce, Chargebee, eBay Finance,
- Revolut Merchant, etc.
- Email: Klaviyo, ActiveCampaign, Braze, Mailchimp, SendPulse, etc.
- Finance & accounting: QuickBooks, Xero, Stripe, Braintree, Zoho Billing, etc.
- Marketing: Google Analytics, Google Search Console, Amplitude, Segment, Serpstat, etc.
- PPC: Google Ads, Microsoft Ads, Meta Ads, TikTok Ads, Snapchat Ads, etc.
- Social media: Instagram, Facebook, LinkedIn, Vimeo, YouTube, etc.
- Time tracking: Harvest, BambooHR, Clockify, TimeTonic, Toggl, etc.
- Spreadsheets, databases, and data warehouses: Google Sheets, Excel, Smartsheet, BigQuery, Redshift, etc.
Blend data across sources before loading to LS
When you use LS, you know it lets you combine datasets. But this often slows down dashboards, limits flexibility, and makes problems hard to trace, especially when multiple sources in Looker Studio are involved.
With Coupler.io, you can blend data for Looker Studio reporting, which improves performance, increases accuracy, and removes limitations.
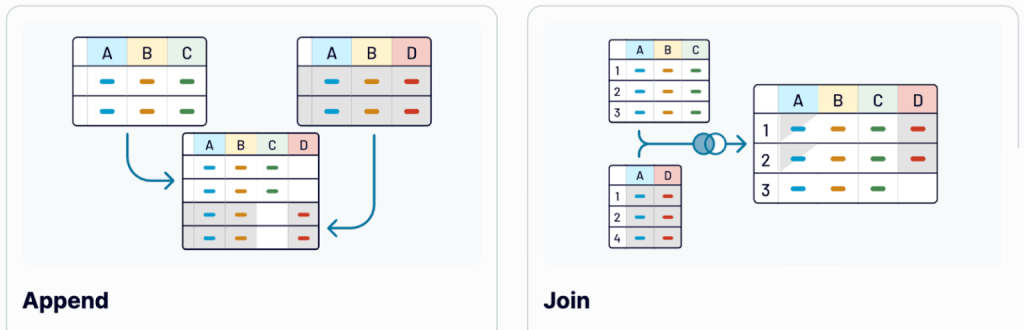
Once you’ve extracted data from several sources through Coupler.io, you can blend it using one of two modes – Append or Join:
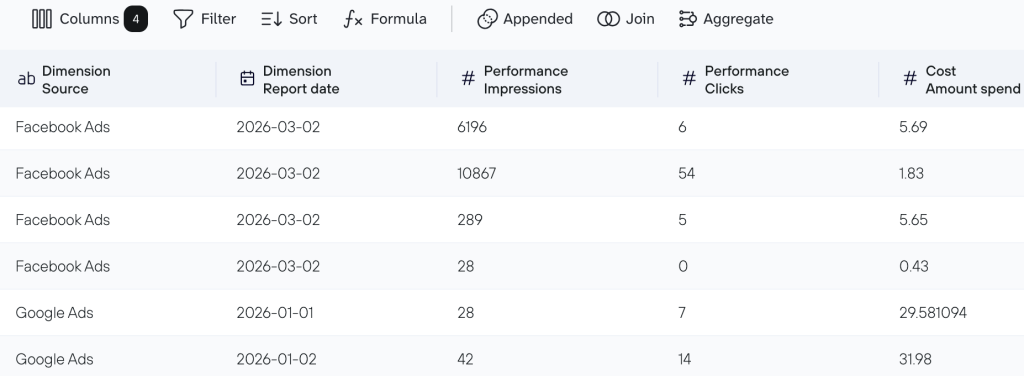
- Append – Creates a dataset where data from one app is placed below the data rows from another app. Columns with identical names are matched and combined, while unmatched columns are included as-is.
For example, use Append to create a report for the performance analysis of campaigns on Facebook Ads and Google Ads. It will stack both datasets into a single table for a complete view of your ad results.
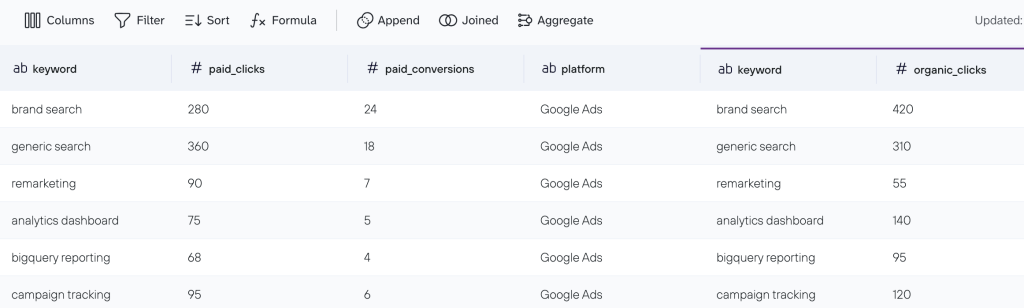
- Join – Combines data using the left join key. This keeps all records from your main dataset and adds only the matching elements from other sources. Columns that don’t meet your specified conditions are excluded.
For example, use Join to enrich your Google Ads keyword data (paid clicks, conversions) with organic clicks from Google Search Console. It will keep every keyword from Google Ads and pull in the matching organic clicks from GSC.
Connect your data to Looker Studio with Coupler.io
Get started for freeDataset templates to get structured data into Looker Studio
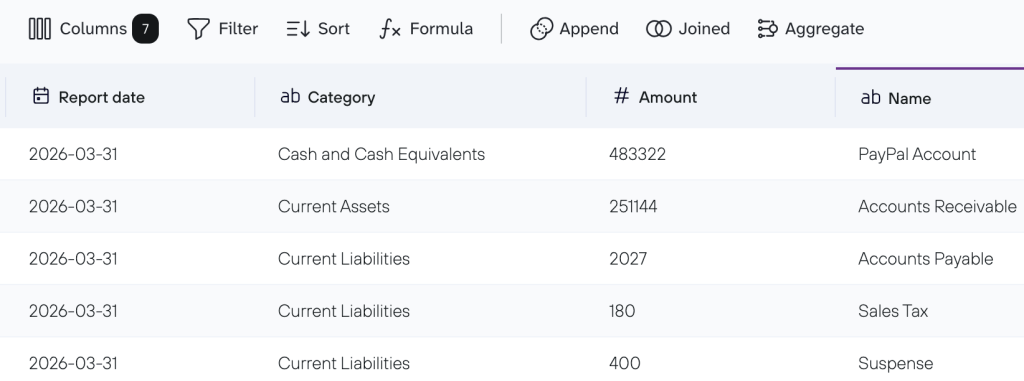
Coupler.io’s data transformation options let you structure information before loading it to Looker Studio. But if you’d rather skip the manual setup of metrics, calculations, and aggregations, data set templates give you a shortcut. Each template is a preconfigured package of data sources, transformations, and ready-made report views assembled by Coupler.io’s data analysts.
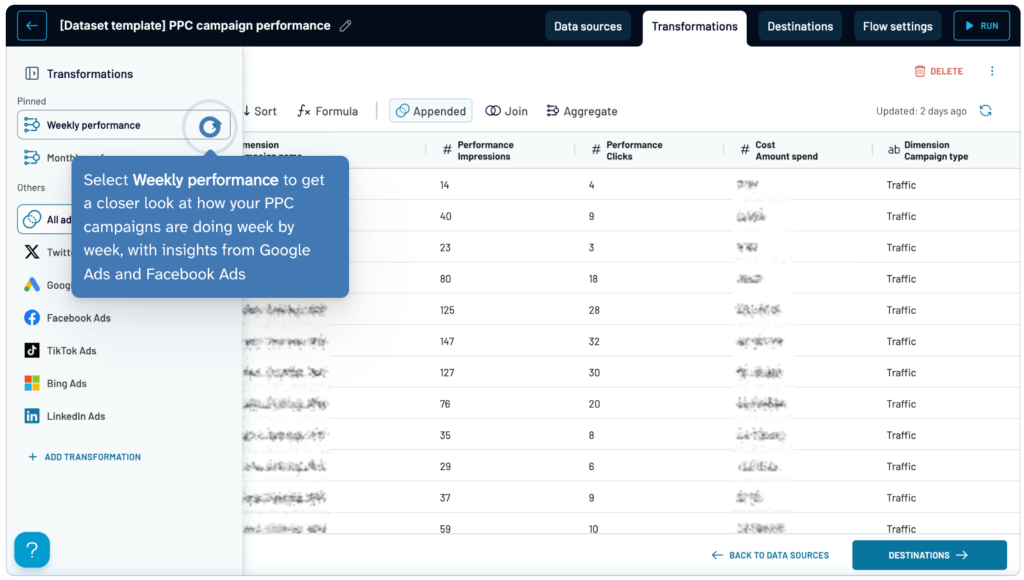
You connect your accounts, and the template handles the rest, turning raw records into a clean, organized report table you can send straight to Looker Studio.
Here are some examples across different domains:
- Shopify top customers — consolidates order-level transactions into a ranked list per buyer, with metrics like average order value, gross sales, discounts, and net sales.
- Pipedrive Deals + Persons + Organizations overview — joins deals, contacts, and companies from separate Pipedrive entities into a single unified CRM dataset.
- YouTube videos performance — aggregates video-level metrics into totals by video, month, week, and weekday so you can spot channel-level trends early.
- PPC campaign performance — regroups daily ad metrics from Google Ads and Meta Ads into weekly or monthly views for easier trend analysis.
- Top pages performance — simplifies Google Search Console data into switchable total, monthly, and weekly stats for your top-performing pages.
- Mailchimp campaign performance — aggregates send-level data into deliverability and engagement metrics broken down by campaign type and list name.
- QuickBooks P&L Detail This / Last month — surfaces only the records that matter for recent financial performance, with sortable accounts and aggregated snapshot views.
Dashboard templates for data visualization in Looker Studio
After you import data to Looker Studio, turning it into a clear visual report can take hours, especially when your figures come from multiple sources.
Coupler.io’s prebuilt Looker Studio templates solve this by automatically syncing data from your sources into ready-made, self-updating dashboards. Take a look at some examples. 👇
PPC campaign performance comparison across channels
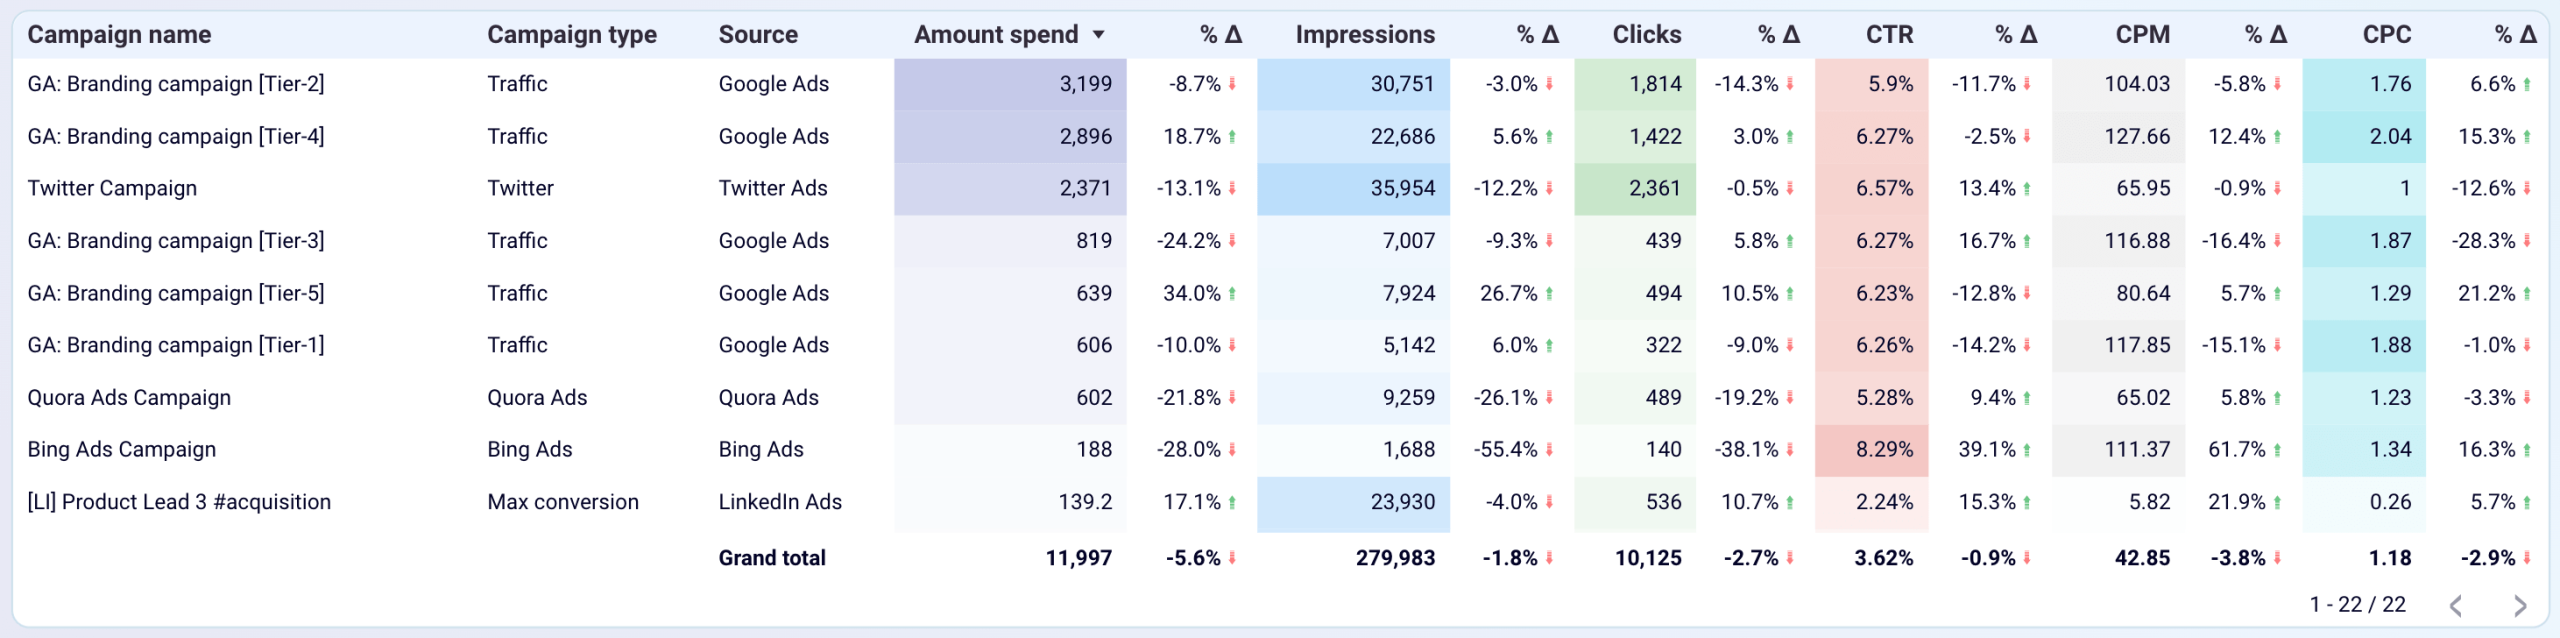
Paid ad metrics are locked inside each platform’s own reporting interface: Google Ads shows Google data, LinkedIn shows LinkedIn data, and never the two shall meet. This makes it nearly impossible to fairly compare spend efficiency, reach, and engagement across channels when each source uses its own filters, date ranges, and metric definitions.
Instead, Coupler.io’s PPC multichannel dashboard template consolidates all active campaigns into a single ranked table covering:
- Amount spent and percentage change vs. prior period
- Impressions and clicks with trend indicators
- CTR, CPM, and CPC each with period-over-period deltas
- Campaign type and source for instant channel filtering
Social media performance overview
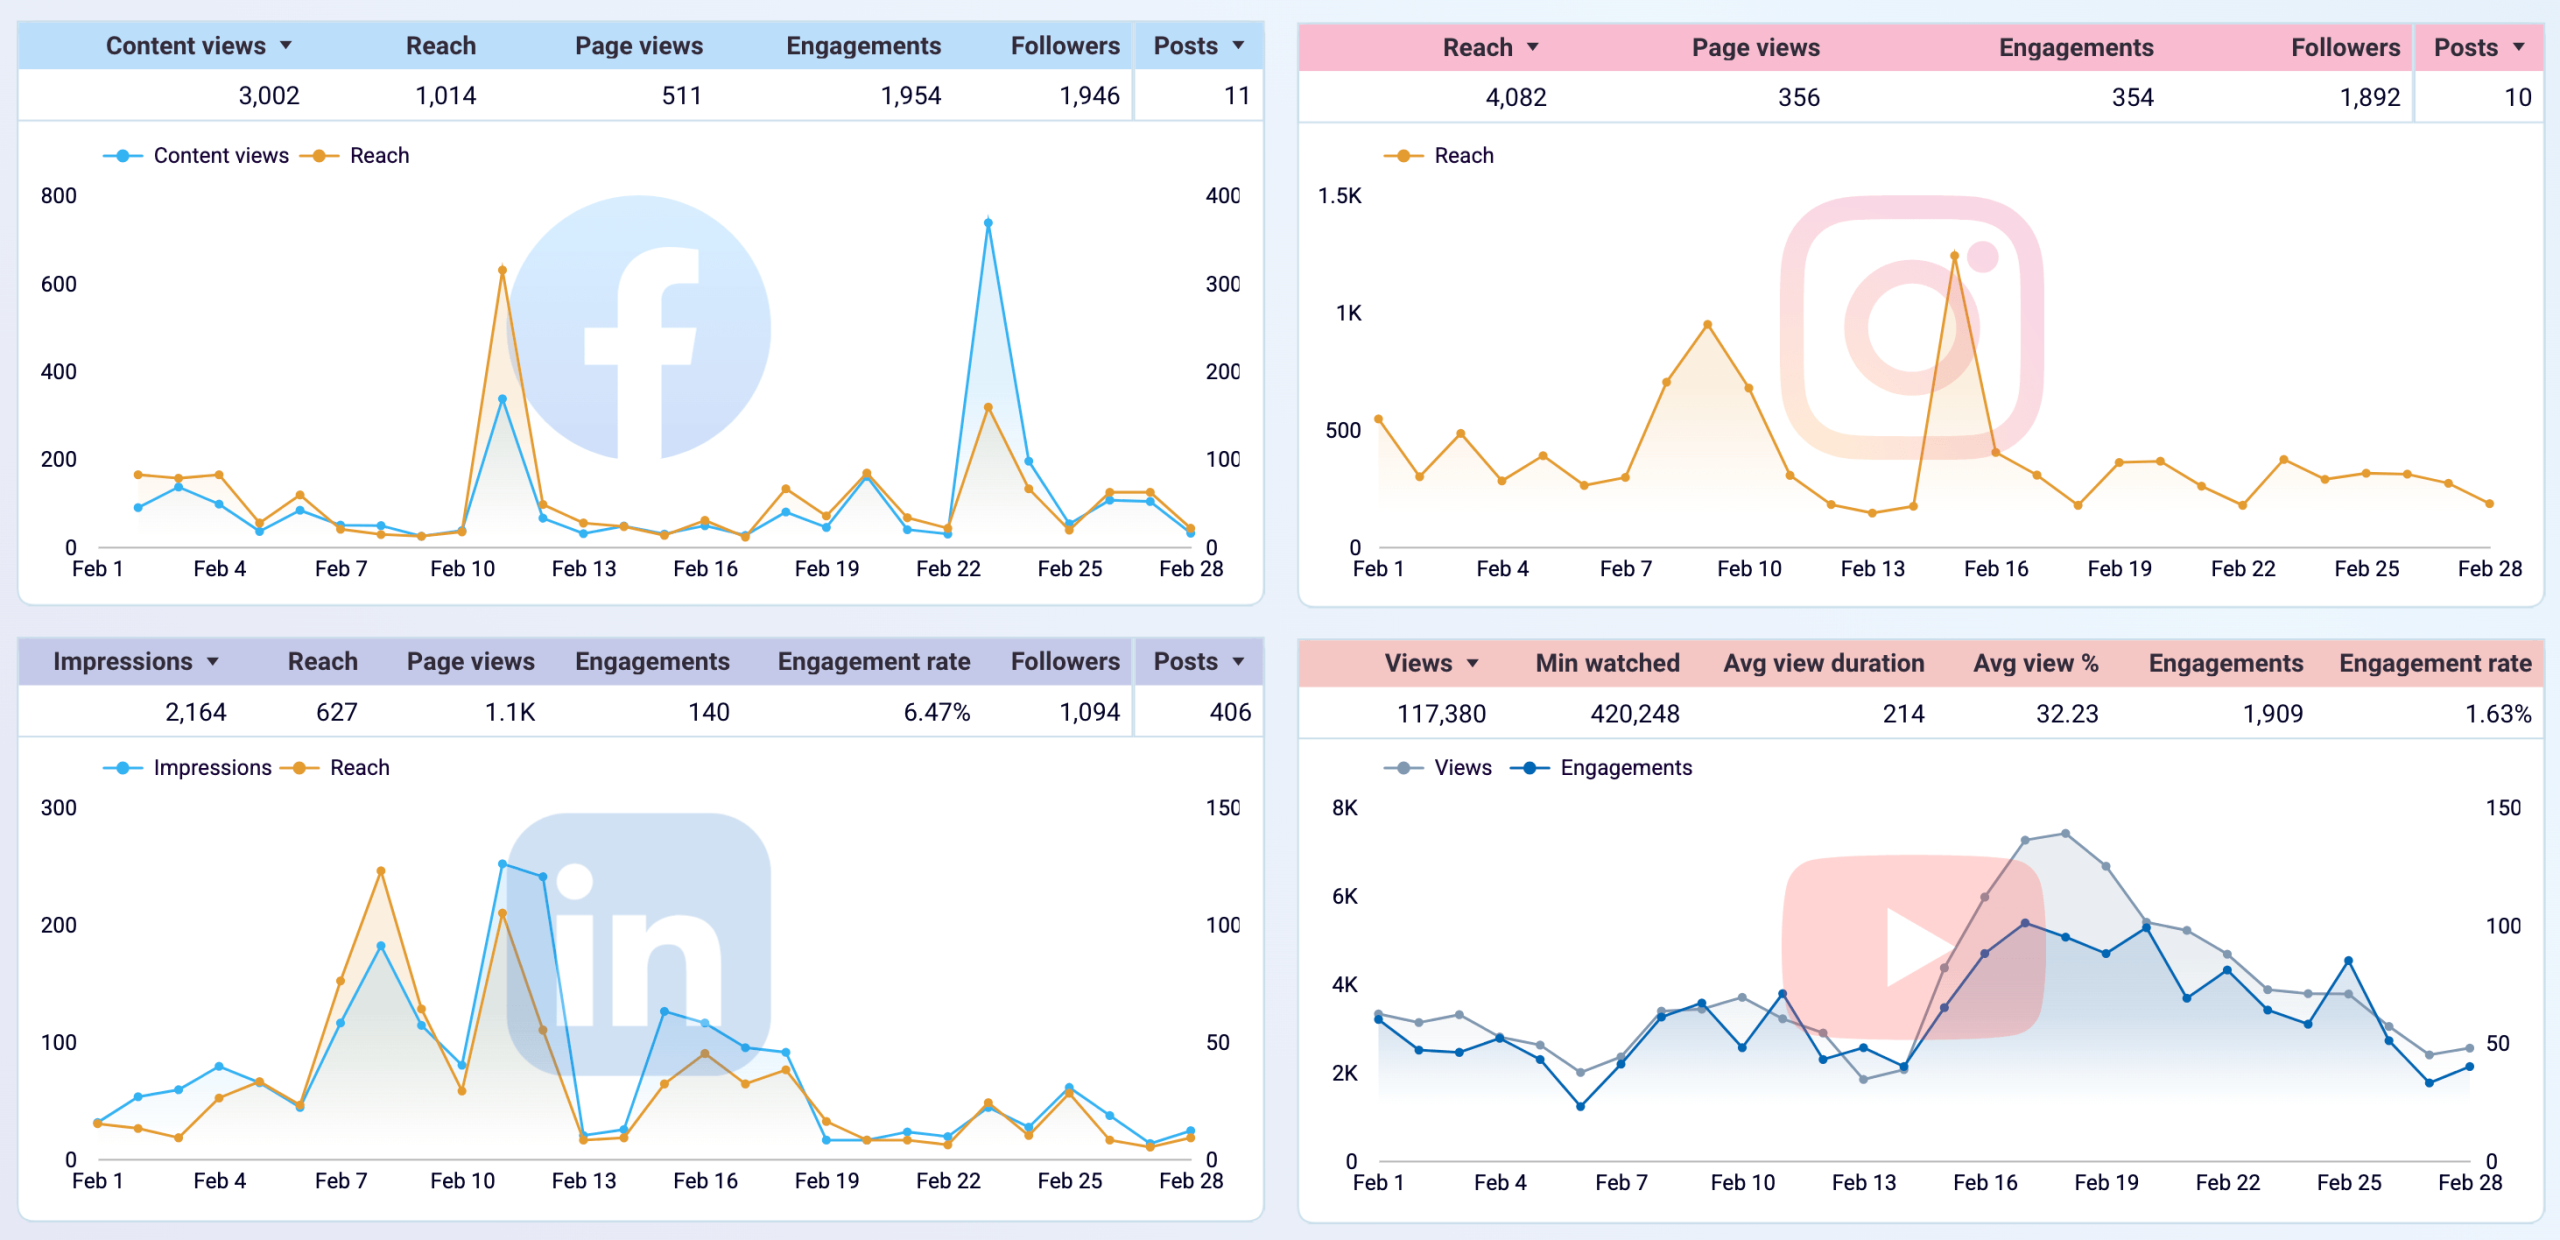
By default, social media analytics are siloed inside each platform’s native reporting tool. Meta Business Suite, LinkedIn Pages, and YouTube Studio each tell only part of the story. Switching between three dashboards is not useful if you want to spot which channel had a reach spike this week or compare engagement rates side by side.
Coupler.io’s All-in-one social media analytics dashboard displays multiple channels together in time series views:
- Facebook – content views, reach, page views, engagements, followers, and posts
- Instagram – reach, page views, engagements, followers, and posts
- LinkedIn – impressions, reach, page views, engagements, engagement rate, followers, and posts
- YouTube – views, minutes watched, average view duration, average view percentage, engagements, and engagement rate
All-in-one social media analytics dashboard
 Preview dashboard
All-in-one social media analytics dashboard
Preview dashboardLanding page effectiveness analysis
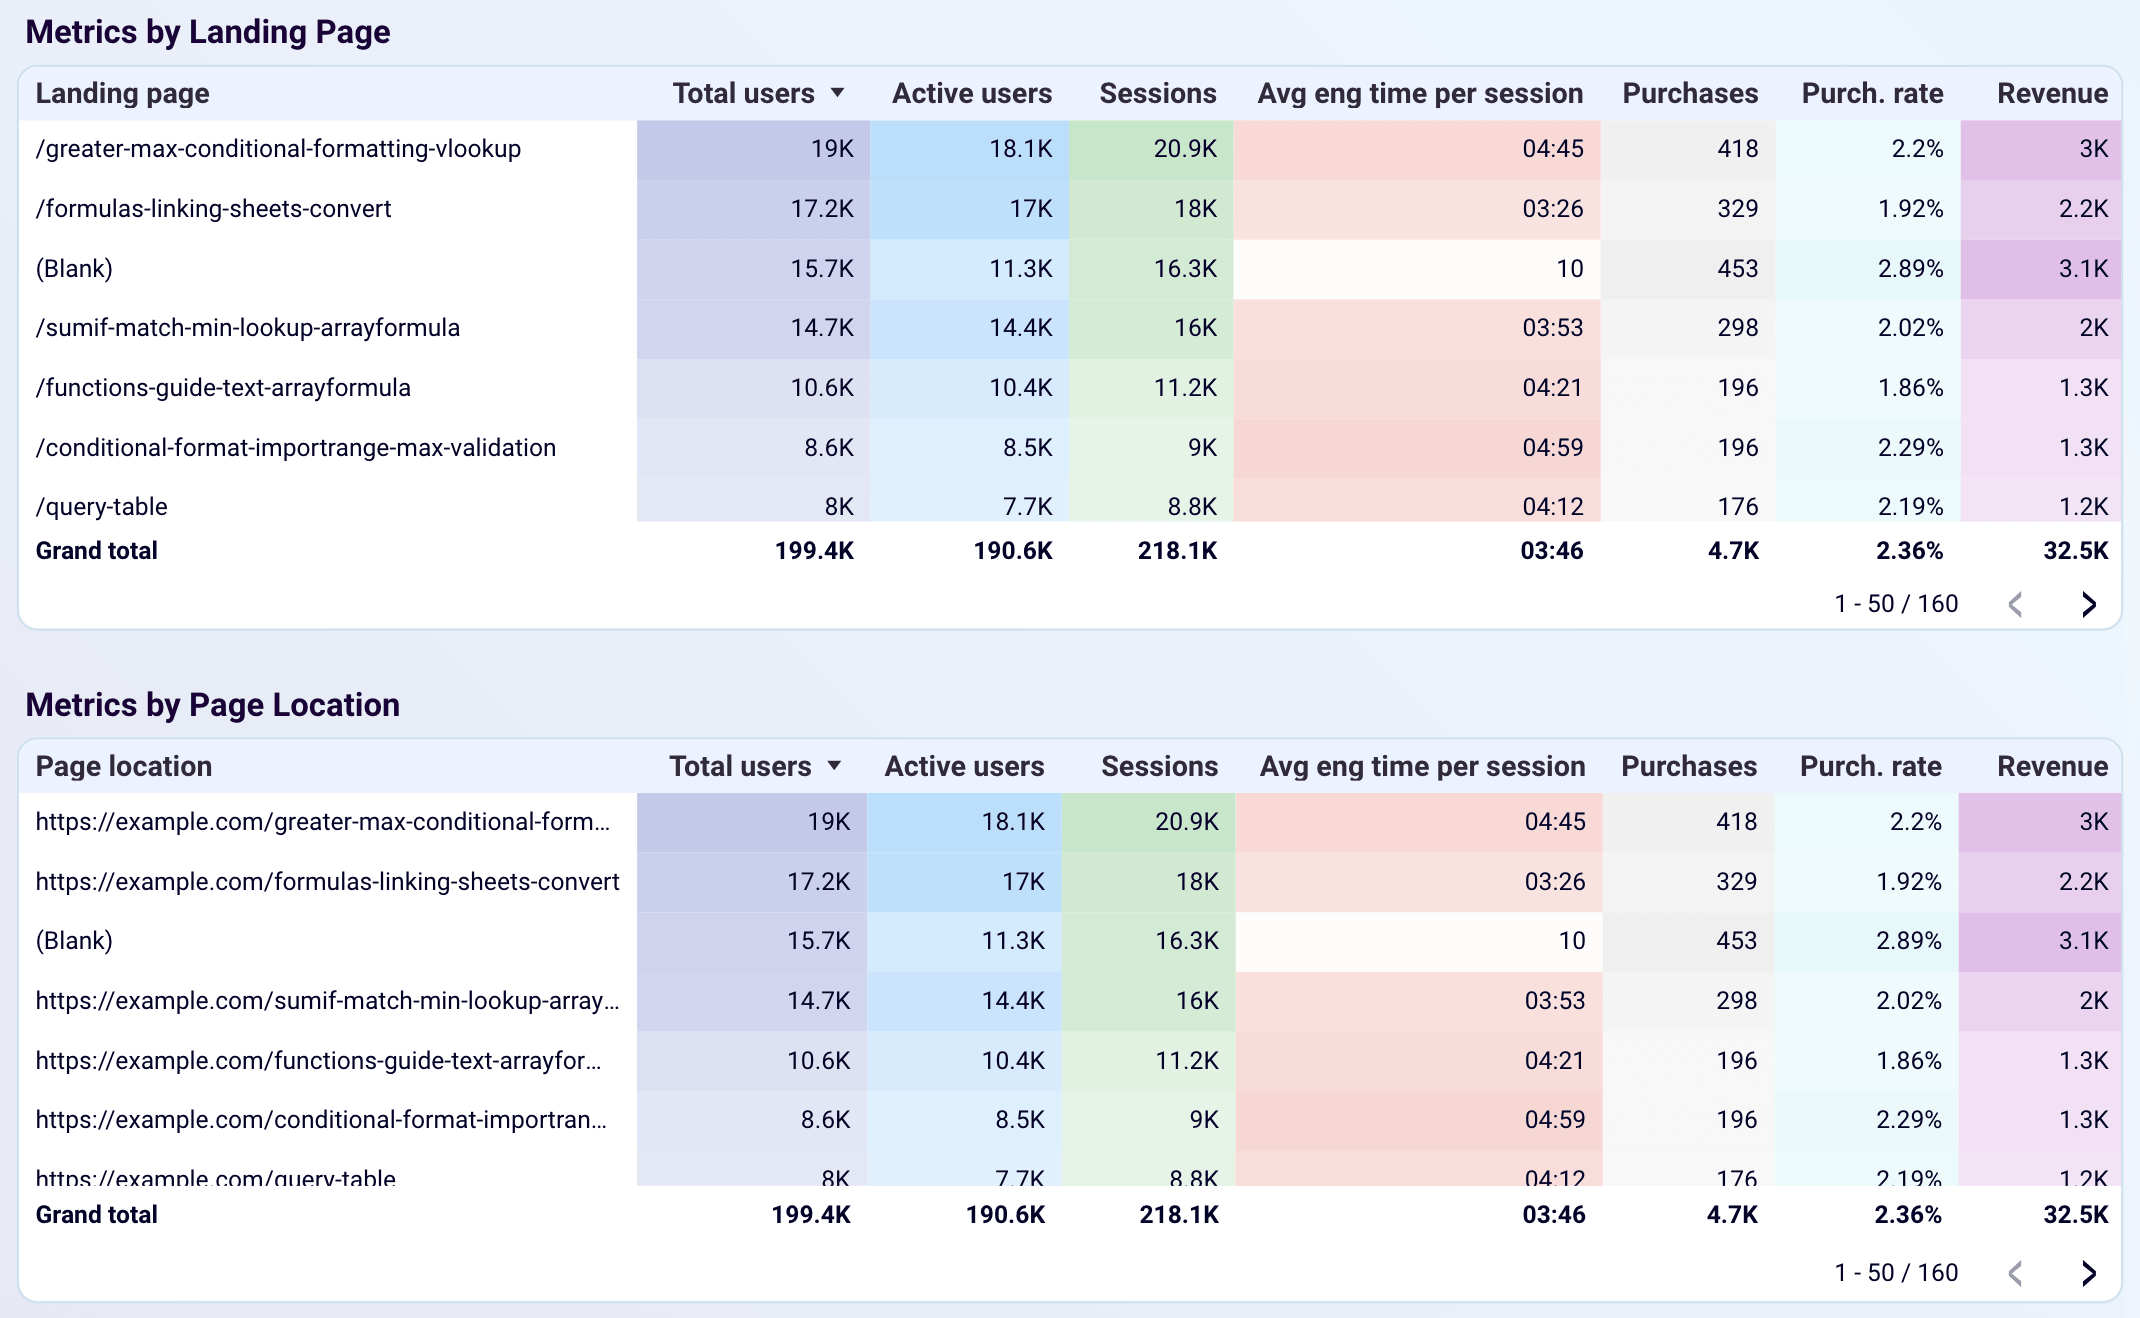
Website analytics data from GA4 is organized around individual events and sessions. This complicates understanding which specific pages are actually responsible for bringing in users and converting them into customers. Your site’s overall traffic numbers are not useful if you can’t pinpoint which landing pages are your highest-performing acquisition entry points or which URLs generate the most purchases.
To solve this, Coupler.io’s Web analytics dashboard template surfaces page performance at two levels of granularity in a single view:
- Metrics by Landing Page – ranked by total users, showing active users, sessions, average engagement time per session, purchases, purchase rate, and revenue per entry-point slug
- Metrics by Page Location – the same metrics mapped to full URLs for precise page identification and deep-linking into specific content
Coversion analytics
Google Ads reporting surfaces a flood of metrics across campaigns, ad groups, and keywords. This makes it easy to lose sight of the three numbers that matter most to any paid search manager: how many conversions you’re generating, how much you’re spending to get them, and whether that cost per conversion is moving in the right direction over time.
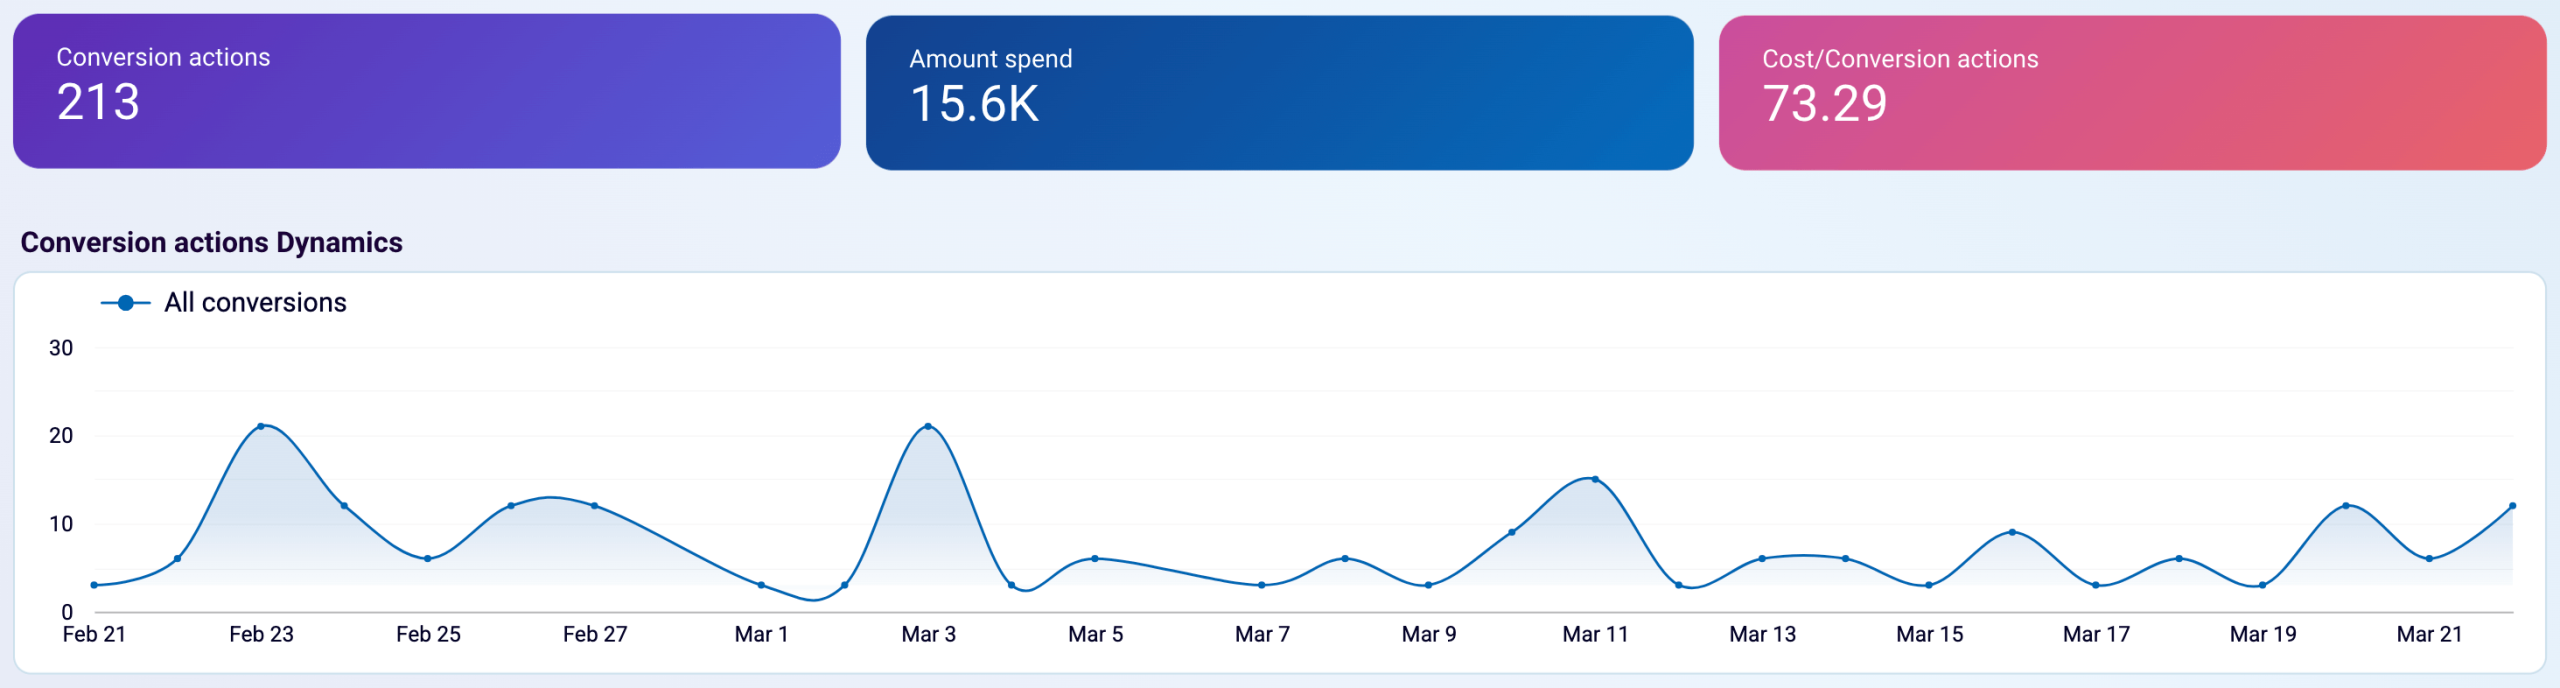
Coupler.io’s Google Ads dashboard template leads with a clean summary paired with daily dynamics:
- Conversion actions – total conversions recorded in the period
- Amount spent – total ad spend across all campaigns
- Cost per conversion action – the efficiency metric that ties the two together
- Conversion actions dynamics – a day-by-day trend line revealing peaks, drop-offs, and recurring weekly patterns across the full reporting window
Customer acquisition funnel breakdown
The journey from a paid ad impression to a new Shopify customer spans three completely separate platforms: your ad platform, Google Analytics, and your store. Each tool shows only its slice of the funnel. It is hard to understand where prospects are dropping off, what your true ROI is, or how a change in ad spend ripples through to actual orders and new customers.
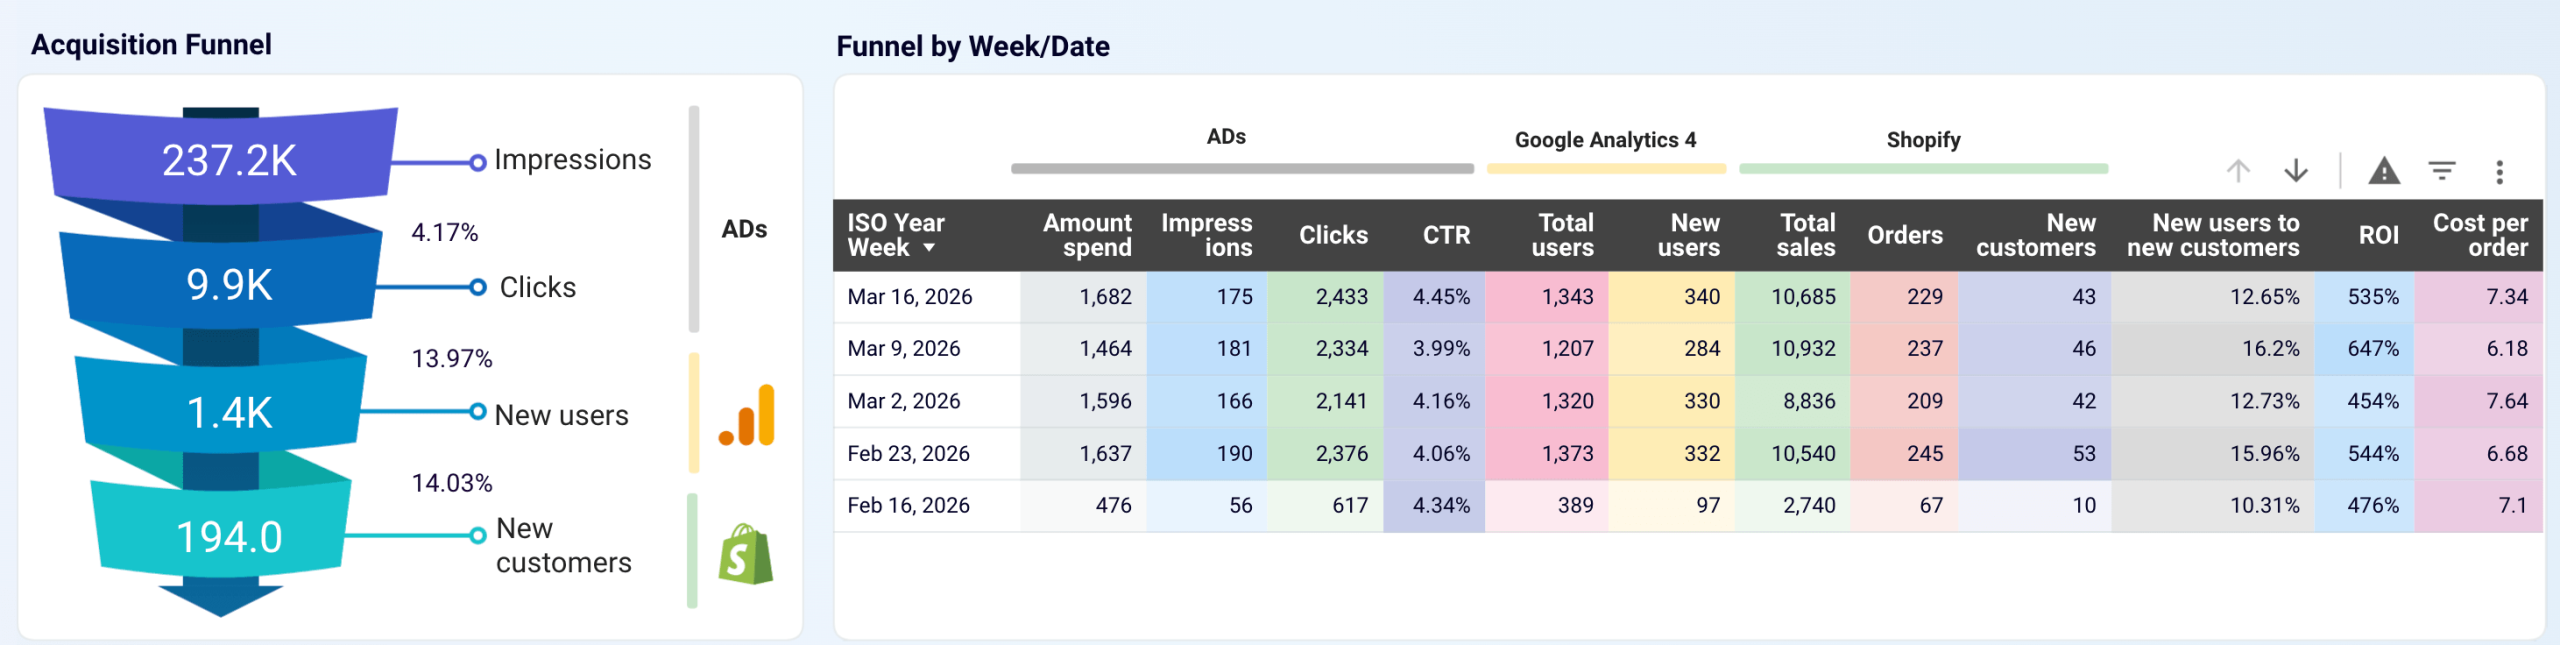
Luckily, Coupler.io’s Shopify marketing funnel dashboard template combines a visual funnel with a detailed weekly breakdown across all three platforms:
- Acquisition Funnel – a visual stage-by-stage drop-off view from impressions through clicks, new users, and down to new customers, with conversion rates between each stage
- Funnel by Week/Date – weekly metrics unified across three source groups:
- Ads – amount spent, impressions, clicks, and CTR
- Google Analytics 4 – total users and new users
- Shopify – total sales, orders, new customers, new users to new customers rate, ROI, and cost per order
Shopify marketing funnel dashboard
 Preview dashboard
Shopify marketing funnel dashboard
Preview dashboardThese are just a few examples of what you can get visualized with Coupler.io. There are many more dashboards available across different categories, from finance and sales to customer support. To save time on data visualization for your specific use case, explore the full gallery of Coupler.io Looker Studio templates and find the one that fits your needs.
Get your data visualized in Looker Studio
Explore templatesOther ways to import data to Looker Studio
While tools like Coupler.io simplify data integration, there are several alternative methods to connect data to Looker Studio. Each approach has its own strengths and trade-offs, so let’s explore them in detail.
Native connectors by Google
Native connectors come built into Looker Studio. They provide direct access to popular Google products and a limited set of external platforms:
- Looker
- Google Analytics
- Google Ads
- Google Sheets
- Excel
- Tables (available in beta)
- BigQuery
- Apigee
- AppSheet
- CSV
- Amazon Redshift
- Campaign Manager 360
- Cloud Spanner
- Cloud SQL for MySQL
- Display & Video 360
- Extract Data
- Google Ad Manager 360
- Google Cloud Storage
- Microsoft SQL Server
- MySQL
- PostgreSQL
- Search Ads 360
- Search Console
- YouTube Analytics
How it works: You select a data source inside Looker Studio and authenticate your account. The platform then pulls data directly into your report.
This method can be useful when:
- You work mainly within the Google ecosystem
- You need a quick and simple setup
- Your reporting requirements are basic
Limitations:
- Limited number of supported sources
- Restricted access to historical data in some connectors
- Limited control over refresh frequency
Partner connectors
Partner connectors are third-party Looker Studio integrations. Coupler.io is also one of those, as it extends the list of supported data sources beyond native options.
How it works: You choose any partner connector from the gallery and connect your account. The connector, just as Coupler.io, acts as a bridge between your source app and Looker Studio. Data flows through the partner’s infrastructure into your reports.
This method can be useful when:
- Your data source is not supported by native connectors
- You need access to niche platforms or tools
Limitations:
- Quality and reliability vary by provider
- Data freshness and transformation capabilities depend on the partner’s system
Custom API integration
Custom API integration is a manually coded approach where you write scripts or programs to pull data directly from a source application’s API and route it into Looker Studio. It offers the highest level of flexibility, as it works with virtually any data source.
How it works: You extract data from a source application using its API. This usually involves sending requests to the API endpoints and retrieving structured data (like JSON or CSV files). Then you send this data to a storage layer such as Google Sheets or BigQuery. After that, you connect the storage layer to Looker Studio using a native connector. In some cases, you can build a custom Looker Studio Community Connector using Google Apps Script to fetch API data directly.
At the same time, Coupler.io provides a no-code way to connect API to Looker Studio.
This method can be useful when:
- You need full control over data extraction and transformation
- Your data source has no existing connector
- You require custom logic or advanced processing
Limitations:
- Requires programming skills and API knowledge
- Setup and maintenance take time and resources
- Error handling and data reliability depend on your implementation
- Scaling the solution can become complex without proper infrastructure
Common challenges when connecting business data to Looker Studio and how Coupler.io solves them
Looker Studio works well for building dashboards, but connecting data from multiple apps brings real friction. Here’s what I’ve run into most often and how I’ve seen teams solve it.
Fragmented data sources
Native Looker Studio connectors support a limited number of platforms. If you rely on a mix of marketing, sales, and finance tools, you’ll hit gaps fast. For instance, I’ve seen teams pull Google Ads and GA4 data without issues but then realize their HubSpot CRM records and Stripe revenue data live in completely separate dashboards. The result: constant tab-switching and no single source of truth.
Solution: Coupler.io fills these gaps with support for 400+ apps. You can bring CRM, e-commerce, PPC, and spreadsheet data into one place without custom engineering, so your dashboards cover the full picture.
Missing historical context
Many native connectors depend on APIs with quotas, sampling rules, or performance limits. The more data you accumulate, the harder it gets to retrieve complete historical datasets. I’ve seen GA4 dashboards that only show the last 60 days because the API simply can’t return more without hitting sampling thresholds.
Solution: Coupler.io enables you to import data to Looker Studio on a schedule and append new records to previously pulled data. Over time, you build up a more complete historical dataset that lets you track growth, spot patterns, and compare performance across longer timeframes.
Unreliable or slow data refreshes
Stale data in dashboards erodes trust fast. Native Looker Studio connectors often have limited refresh schedules, and some fail silently due to timeouts or connection issues. A dashboard that looked fine yesterday might be showing last week’s numbers today, and nobody notices until a stakeholder points it out in a meeting.
Solution: With Coupler.io, you control how often your data updates. You can set flexible refresh intervals as frequently as every 15 minutes. As a result, your Looker Studio reports stay accurate and almost live.
Complex API integration and technical barriers
When native connectors don’t cover the apps you need, custom API integrations seem like the obvious next step. In practice, they’re a bigger lift than expected: permissions, API keys, tokens, OAuth flows, error handling, and ongoing maintenance all pile up. A single broken token can block an entire pipeline, and non-technical team members can’t fix it without developer help.
Solution: Coupler.io removes these barriers with a no-code interface that automates the entire ETL process. Each connector includes a guided authentication flow, allowing you to link accounts in minutes without manual configuration. You can extract, transform, and load data to Looker Studio, all without writing code.
Connect your app data to Looker Studio without coding
Try Coupler.io for free


