How to Connect Google Business Profile to Claude for AI-driven local SEO analytics

The Google Business Profile dashboard shows you calls, direction requests, and searches that led someone to your listing. What it doesn’t show you is the why behind the numbers. Why one location’s discovery traffic dropped, which search terms drive views at your top performers, and what’s moving the needle week over week.
Claude can do that analysis. Getting your GBP data into Claude is the harder part.
The performance export caps at 6 months, covers only one report type per download, and excludes reviews entirely. For a single location, that’s fine. For multiple locations or agency clients, the manual back-and-forth adds up fast.
The right way to connect Google Business Profile to Claude gives you structured and automatically refreshed data across every location, all queryable in one place.
Choose the right method to get data from your Google Business Profile to Claude
| Connection method | Setup effort | Who does the math | Best for | Watch out for |
|---|---|---|---|---|
| Coupler.io | Low: connect once, runs on a schedule | Coupler.io’s Analytical Engine | Multi-location analysis, recurring reporting, and agencies | Verified locations only |
| Manual file upload | None: download CSV, upload to Claude | Claude | One-off analysis, single location | 6-month cap, one report type per download, no reviews |
| Other third-party MCP server (Porter, Adzviser, etc) | Medium: requires Claude Pro/Team, MCP URL setup | Claude | Teams already using MCP connectors | No processing layer, no multi-destination, maintenance falls on the provider |
| API scripts | High: OAuth setup, scripting, ongoing maintenance | Claude | Custom pipelines with full control | Requires engineering resources to build and maintain |
Note: Google hasn’t published a native connector for Google Business Profile in Claude’s connector directory, so there’s no first-party one-click option at the moment.

Connect your Google Business Profile data to Claude with Coupler.io
Get started for freeConnect Google Business Profile to Claude with Coupler.io
GBP splits its data across three separate report types: daily metrics, search keywords, and reviews. The manual export allows you to download only one report at a time, caps history at six months, and excludes reviews from the performance CSV. Every time you need a complete picture, that’s three separate downloads per location.
Coupler.io removes that friction. It’s a no-code data integration platform for AI analytics that connects 400+ sources, including Google Business Profile, and delivers data to AI tools like Claude, ChatGPT, and others through an MCP server. For GBP, it pulls all three report types in a single data flow and keeps them updated on a refresh schedule. You ask Claude a question; it works from structured and up-to-date data.
For multi-location setups, that difference compounds. Connect Google Business Profile to Claude once and all your verified locations come through together.
Step 1: Create a data flow for Google Business Profile
Sign up for a free Coupler.io account, no credit card required.
Create a new data flow and select Google Business Profile as the source, or use the form below.
Connect your Google account and choose the locations you want to include. Only verified locations are supported, but you can select multiple locations in a single data flow.
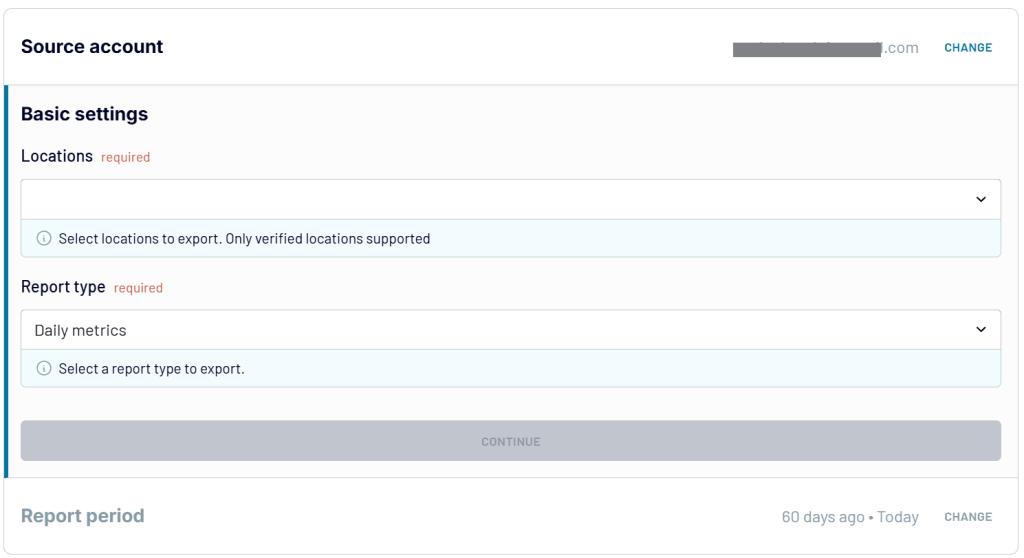
Under report type, choose from three options:
- Daily metrics: impressions, customer actions (calls, direction requests, website clicks), and search views by date
- Search keywords: the actual search terms that triggered your profile
- Reviews list: review text, ratings, and response data
Each report has its own structure, so you’ll want separate data flows for each or use Coupler.io’s append or join options to blend them into one dataset. Set your date range using the start and end date fields. Coupler.io supports macros, so you can use a rolling window like “last 90 days” instead of a fixed date.
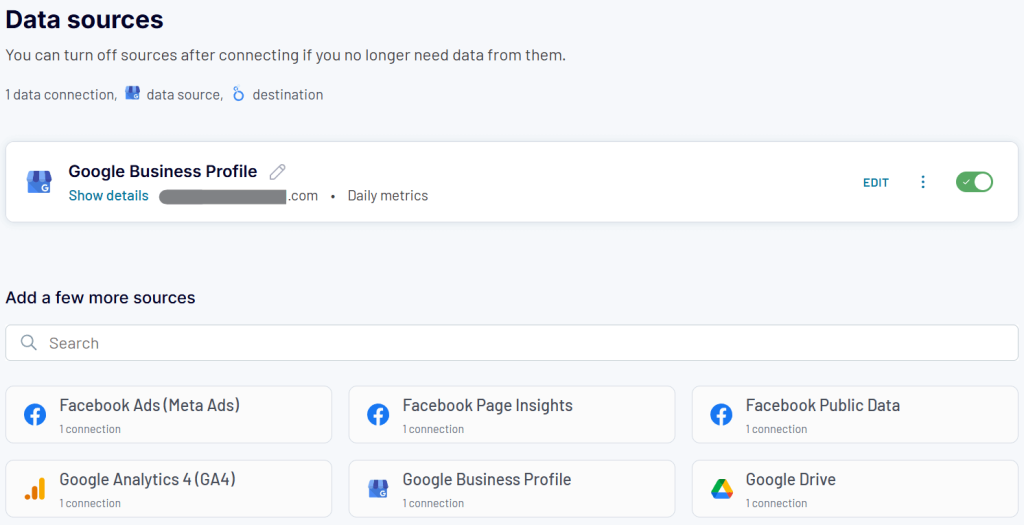
If you want to combine GBP data with other sources like Google Ads spend or GA4 traffic, you can add them to the same data flow here. Coupler.io supports over 400 Claude integrations, so the cross-channel blending happens before the data reaches Claude.
Step 2: Clean the data set and add business context
Before you can chat with your business data in Claude, use Coupler.io’s transformation features to clean and structure it. Raw GBP exports come with location IDs instead of names and column headers that don’t match how your team talks about the data.
Things you can do here:
- Rename columns: “impressions” to “Search Impressions,” location IDs to actual location names
- Filter by specific locations, date ranges, or metric thresholds
- Sort and aggregate data before it reaches Claude
- Add custom formulas for calculated fields
- Use append to merge data from multiple GBP accounts into one dataset, or join to combine GBP data with another source like Google Ads or GA4
You can also use the Context field to add business definitions that Claude reads before it analyzes anything. For example, define what counts as a high-performing location, what your call volume benchmarks are, or which locations are flagships versus new openings. Without that context, Claude sees raw numbers and treats every location the same.
The cleaner and more readable the dataset, the more specific Claude’s analysis will be.
Step 3: Connect Claude and start the conversation
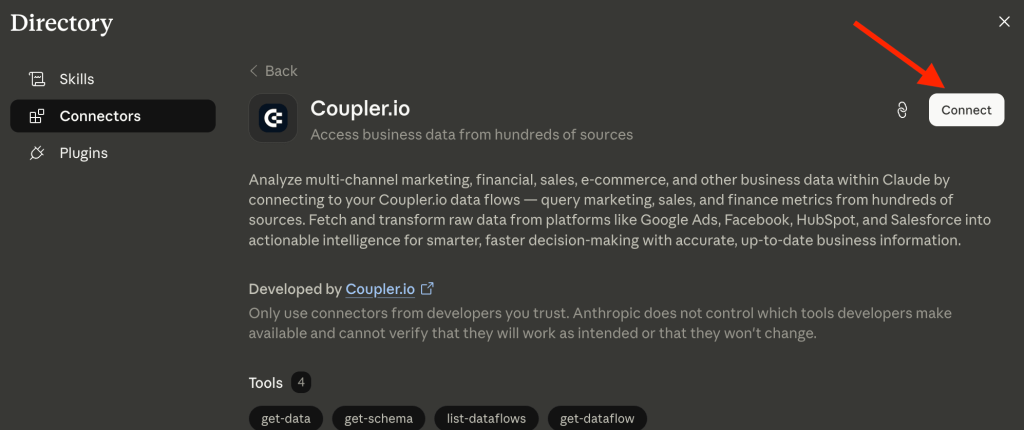
In the Destinations tab, click Get connector. This opens the Coupler.io connector page directly in the Claude app. Connect and authorize the conenctor.
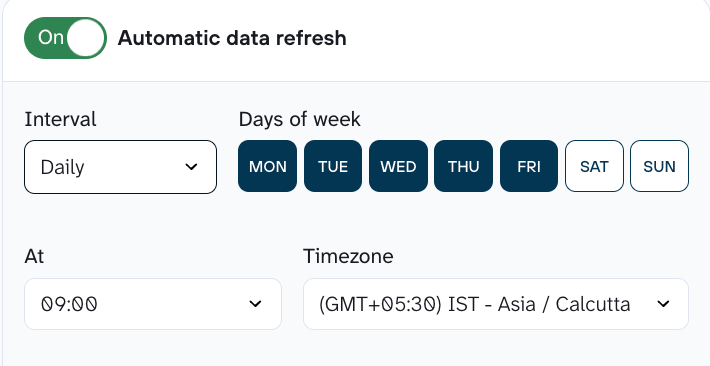
After that, go back to Coupler.io and set your data refresh schedule. Daily works well for most GBP use cases, but you can go hourly or weekly depending on how often your data changes.
Open Claude and toggle Coupler.io from the list of connectors. Now, your GBP data is queryable in plain language.
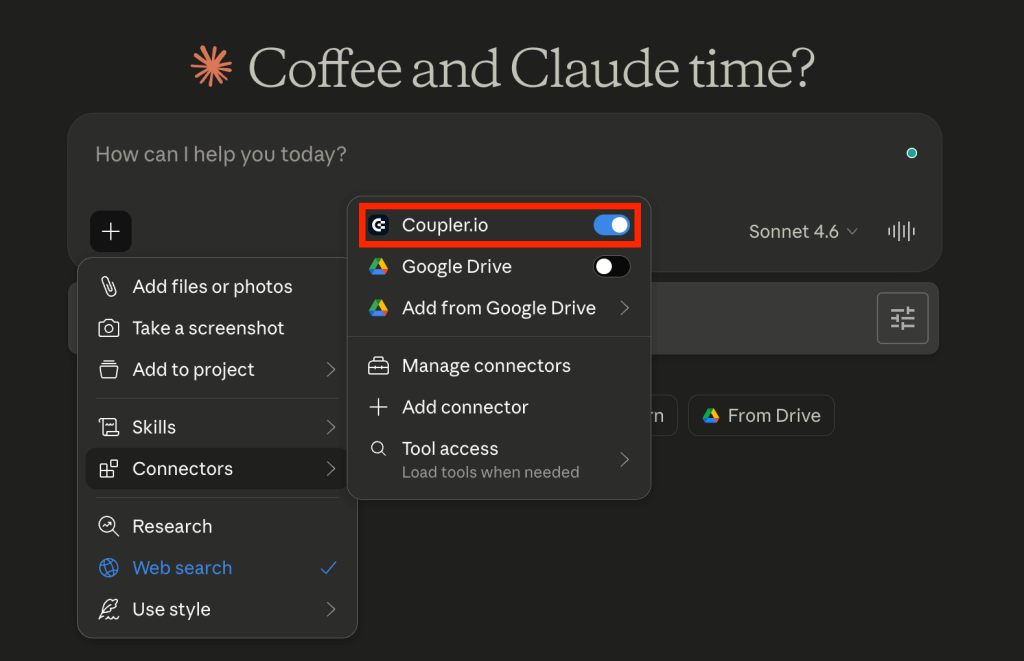
A good first prompt to test the Google Business Profile data connector:
I have Google Business Profile data connected for 4 locations. Show me a summary of discovery search impressions vs. direct search impressions by location for the last 30 days, ranked from lowest to highest discovery share. |
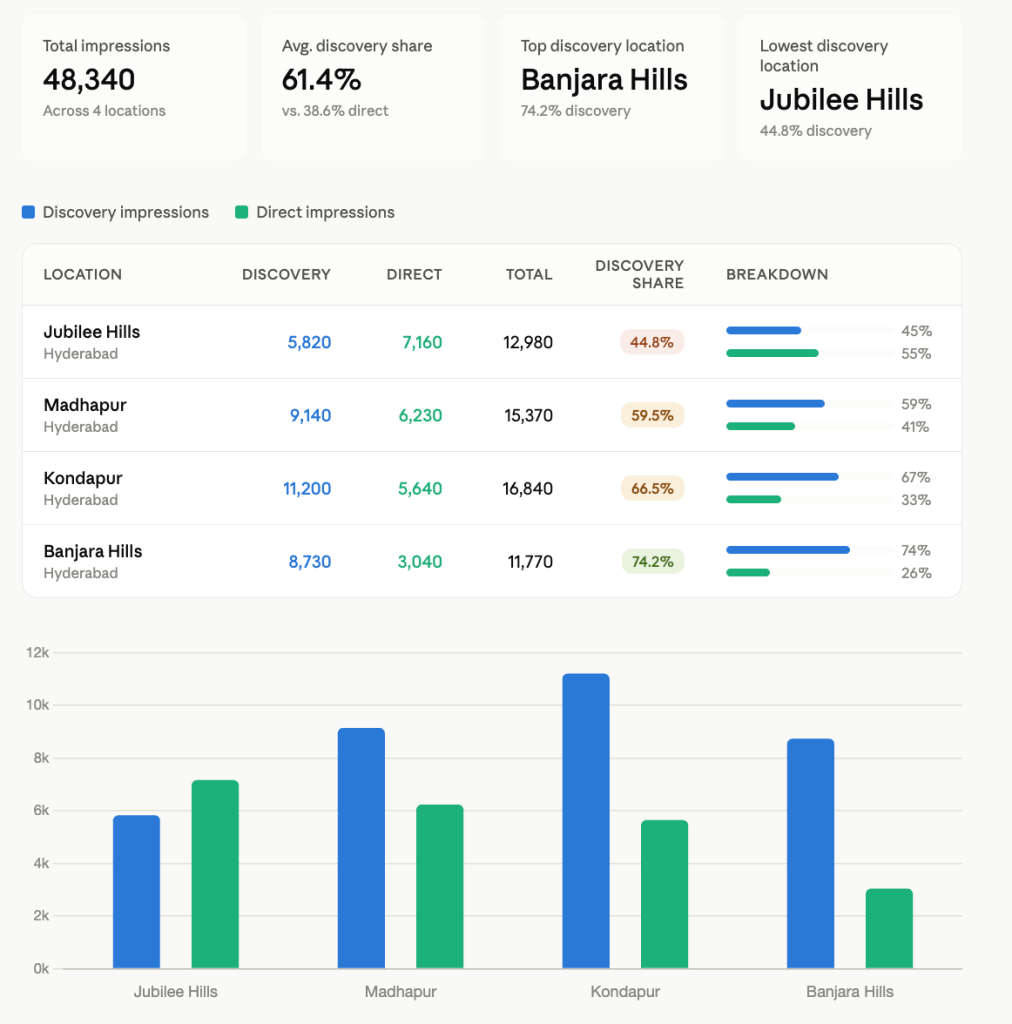
Jubilee Hills is the only location where direct impressions outpace discovery. That means most people finding it already know the brand. Banjara Hills leads at 74.2% discovery share, a strong signal for that location’s GBP optimization. Claude flags both in the same response and suggests where to dig next.
Examples of how you can analyze Google Business Profile data in Claude
The three report types Coupler.io pulls from GBP each unlock a different way to analyze Google Business Profile data in Claude. The examples below show what becomes possible when you can query all three in the same conversation.
Find which locations are losing discovery traffic and why
Discovery search share tells you what proportion of your profile views came from people who didn’t already know your business. They searched a category, service, or keyword and your listing appeared.
When that share drops, it usually means one of three things:
- your profile completeness slipped
- a competitor gained ground in your category, or
- Google’s local ranking shifted for terms you were previously showing up for.
To spot this across multiple locations manually, you must download daily metrics per location, align date ranges, and calculate the share split yourself. With Coupler.io, all the reports are already in one dataset, and Claude can run this across every location in a single prompt.
Look at discovery search impressions vs. direct search impressions across all locations for the last 60 days. Which locations show a declining discovery share week over week? Flag any location where discovery share dropped more than 5 percentage points. |
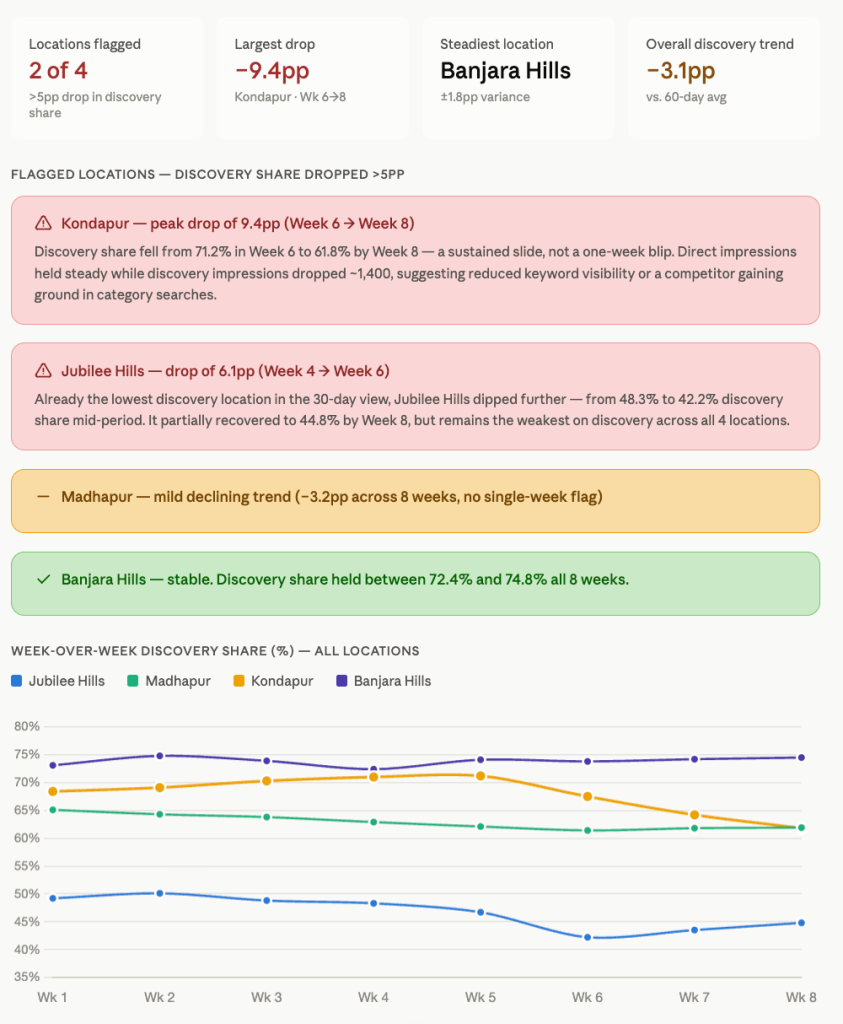
Kondapur dropped 9.4 percentage points between Week 6 and Week 8 while direct impressions were steady. The pattern prompts a check for a ranking slip in category searches or a drop in GBP engagement signals like posts or review activity. Banjara Hills held between 72.4% and 74.8% all eight weeks, making it the benchmark to audit and replicate.
Claude flags the urgent locations, separates them from the ones worth monitoring, and tells you exactly where to look next.
Review velocity and sentiment analysis across locations
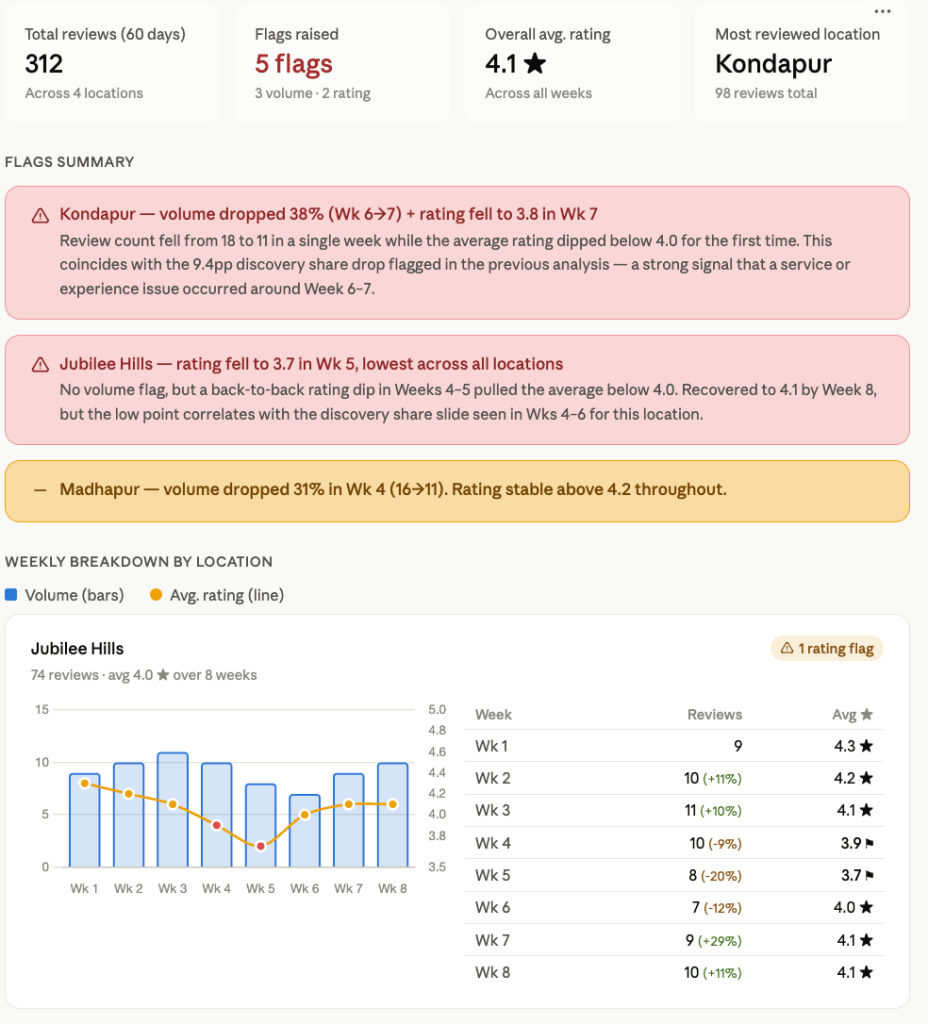
For each location, show me the number of reviews received per week over the last 60 days, the average star rating by week, and flag any location where review volume dropped more than 30% week over week or where the average rating fell below 4.0. |
This use case requires the Reviews list report type, which the manual CSV export doesn’t include at all. You either build a separate system to track review data or you miss it entirely. Coupler.io pulls the Reviews list alongside daily metrics and search keywords in the same data flow, so the data is there when you need it.
Review volume and recency are local ranking signals. A location receiving one review per month versus one per week is meaningfully different for visibility. To catch them manually across multiple locations, you’ll have to log into each profile separately and read through reviews one by one.
Claude returns a velocity table by location and week, flags the drops and low-rating periods. It can group recurring complaint themes from the review text in the same conversation. Here you can see what that looks like across four locations:
Search keyword analysis: what queries are actually driving profile views
No other analytics tool gives you keyword-level local search data without running ads. The search keywords report in GBP is the only place you can see exactly what people typed into Google before your profile appeared. Most businesses never analyze it properly because it lives in a separate report type from everything else.
This is a two-step prompt. Start by pulling the top keywords:
From the search keywords report, show me the top 20 search terms driving impressions across all locations for the last 90 days, sorted by total impressions. Include a column showing which locations each keyword appears for. |
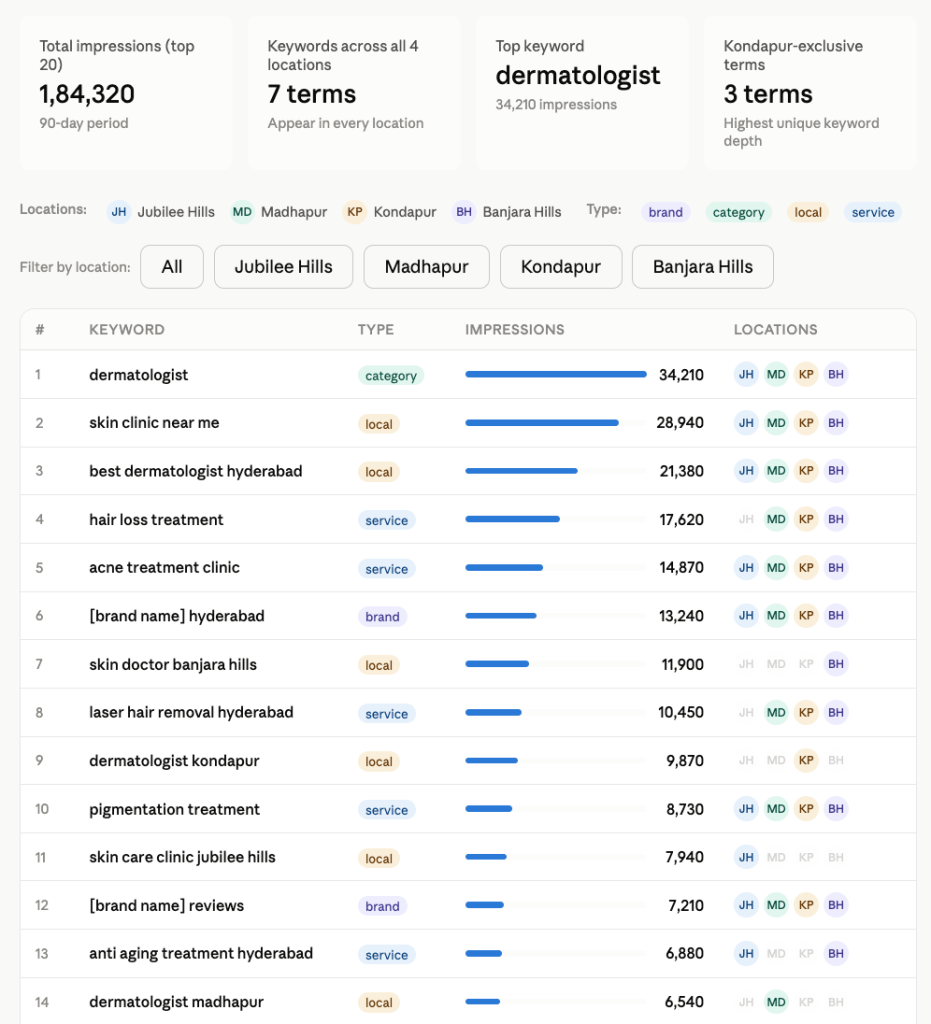
Then ask Claude to group by intent and surface the gaps:
Group these keywords by intent: branded searches, category searches, and location-modifier searches. Flag any high-volume category terms that only appear for some locations but not others. |
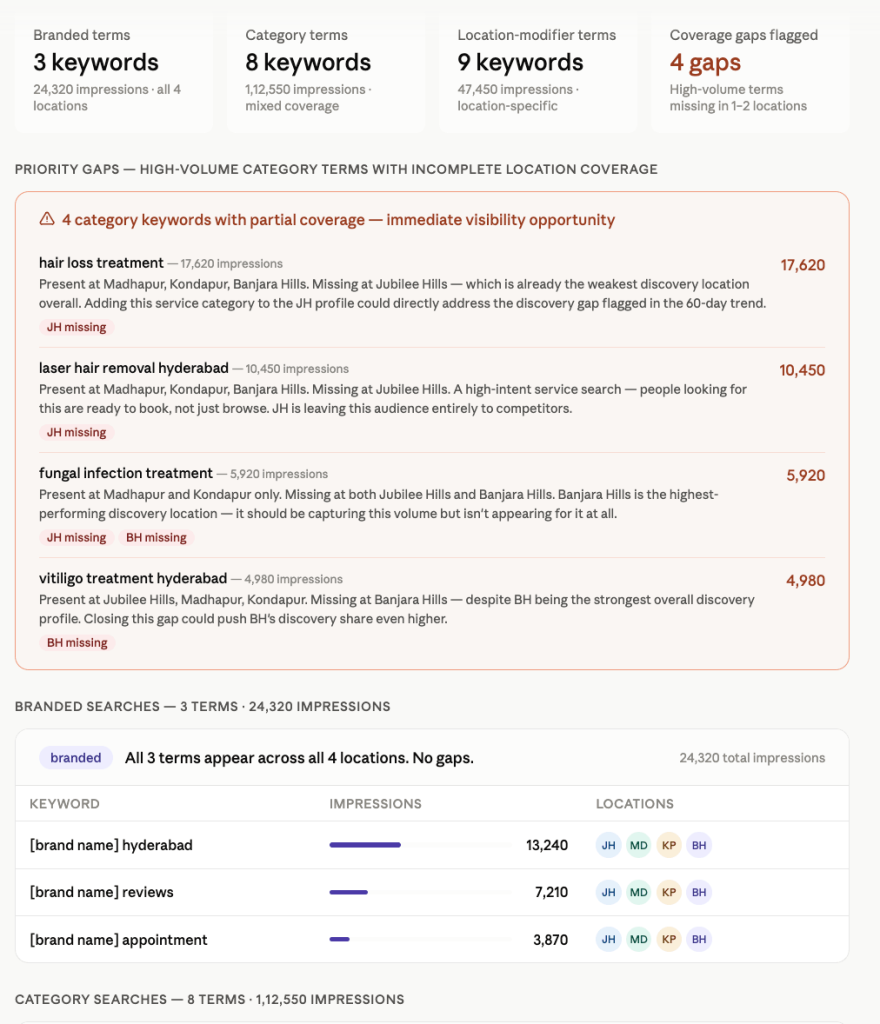
Jubilee Hills is missing from both “hair loss treatment” and “laser hair removal hyderabad,” the two highest-volume service-intent terms with incomplete coverage. That keyword gap directly explains its weak discovery share. If those services exist at the location but aren’t in the GBP service menu, fixing that is a one-day task.
Talk to Claude about your Google Business Profile performance
Get started for freePrompts to analyze Google Business Profile data in Claude
The prompts below cover different angles of GBP analysis: visibility, engagement, review management, and cross-source comparisons. Copy them directly into Claude once your data is connected, or use them as a starting point and adjust the thresholds to match your locations.
Call-to-direction ratio by location
For each location, calculate the ratio of phone calls to direction requests over the last 30 days. Flag any location where direction requests significantly outnumber calls. |
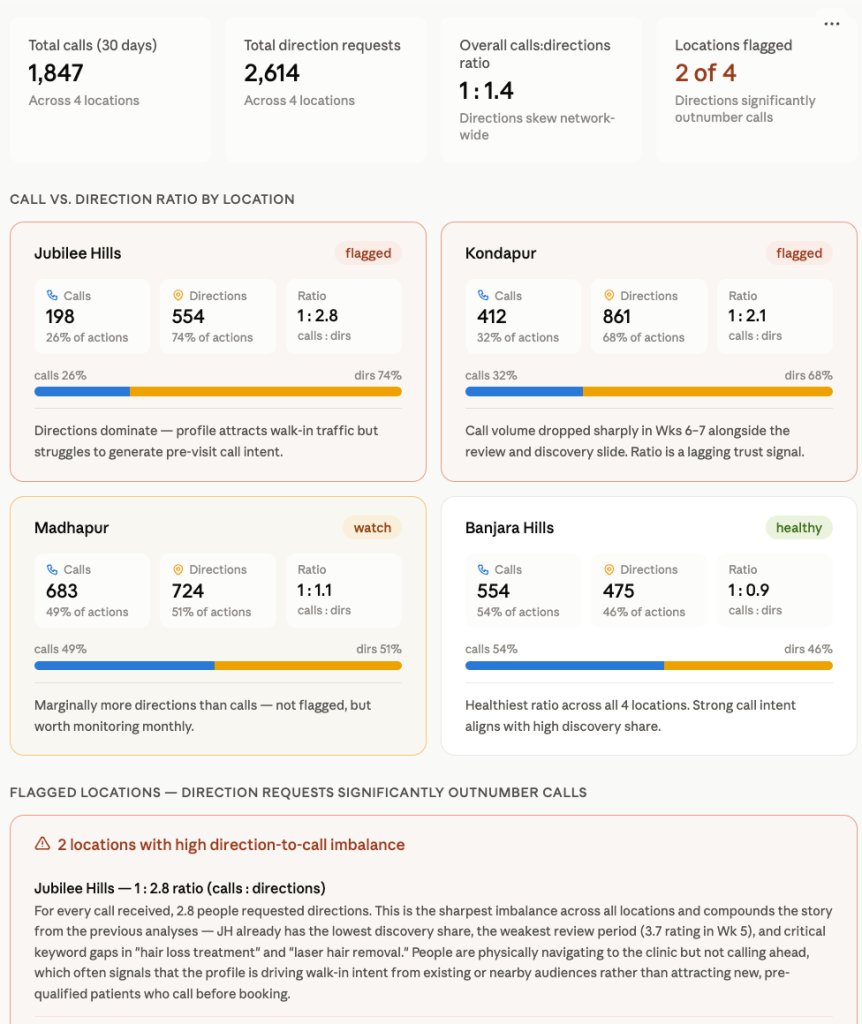
Use this when you want to understand whether your profile is driving pre-visit intent or just navigational traffic. A high direction-to-call imbalance may mean the profile is attracting people who already know you, not new customers researching and ready to book.
Week-over-week change in website clicks across all locations
Show me week-over-week website click trends across all locations for the last 60 days. Which locations show a consistent decline? Which had a sudden drop in a specific week? |
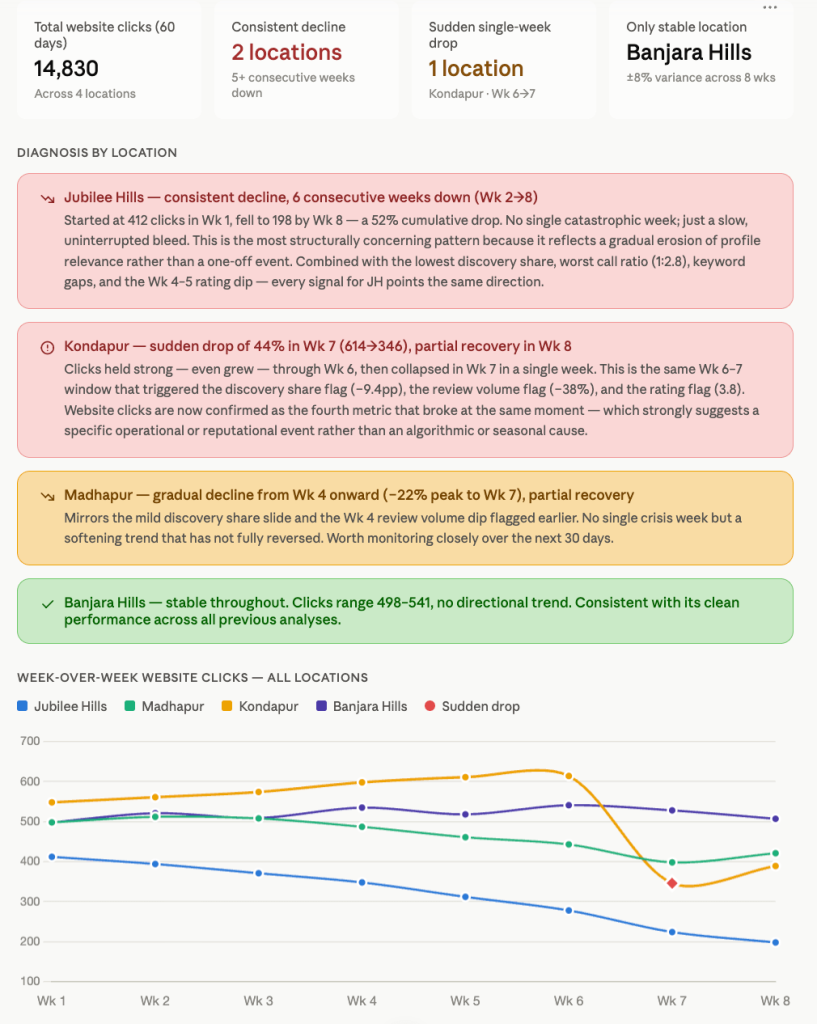
Use this when you want to separate one-off dips from structural decline. A sudden single-week drop points to a specific event: a review surge, a service disruption, or a competitor campaign. A slow multi-week bleed is harder to spot but often more damaging because no single week looks alarming enough to act on.
Calculate direct search share as a percentage of total impressions for each location. Flag any location where direct share exceeds 60%. |
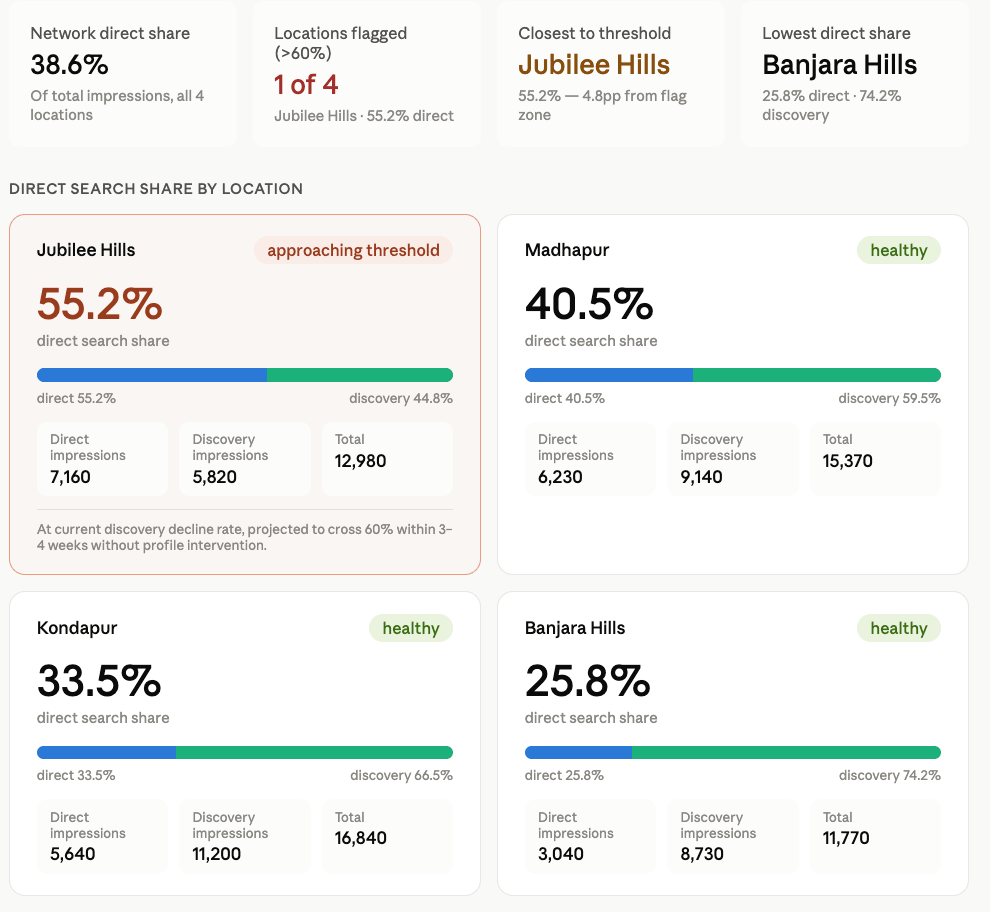
Use this prompt when you want to know if a location is reaching new customers or just being found by people who already know it. Direct searches mean someone typed your business name specifically. Discovery searches mean someone typed a category or service “dermatologist near me,” and your profile showed up. A healthy profile needs both.
Flag locations that haven’t posted an update in 14+ days
Based on the data available, identify which locations have had no new posts or profile activity in the last 14 days. Rank them by discovery share so I can prioritize which ones to update first. |
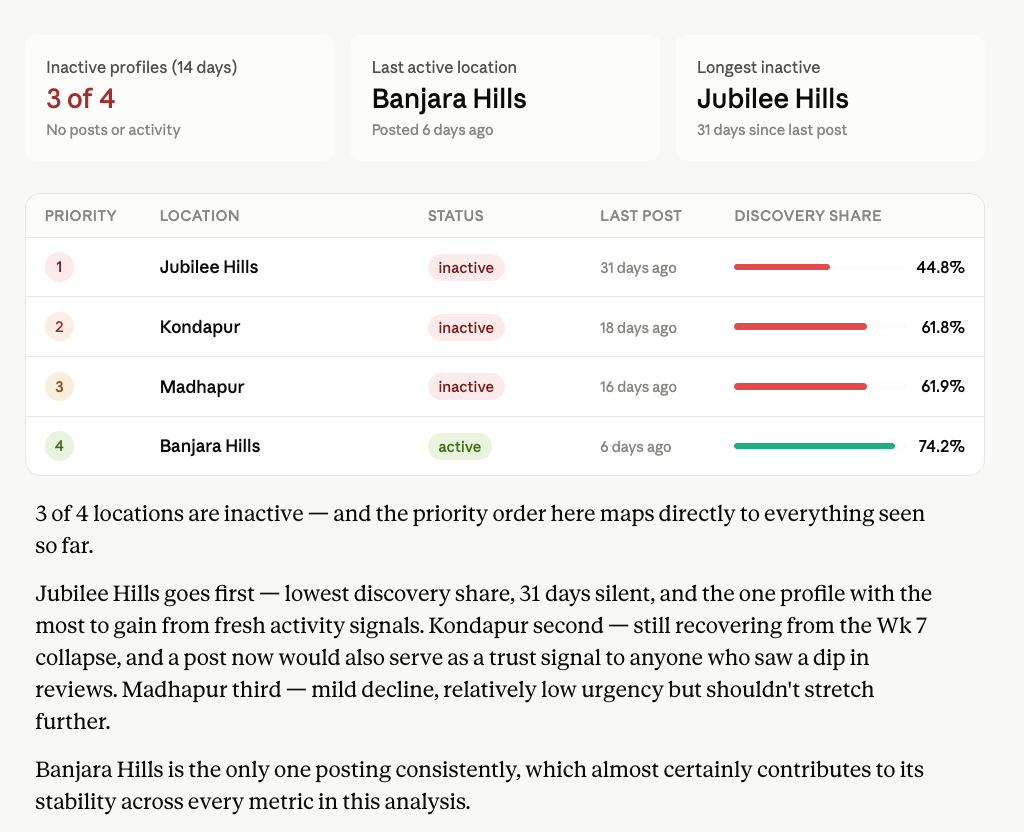
Regular posting is a GBP engagement signal. It tells Google the profile is active and gives discovery searchers a reason to engage. When a location goes quiet, it’s usually the ones already struggling with visibility that feel it first.
Cross-source: combine GBP call volume with CRM lead data to calculate GBP lead conversion rate
I have GBP call data and CRM lead data connected. For each location, compare the number of calls logged in GBP against leads marked as "phone" in the CRM for the same period. Which locations have the biggest gap between calls and logged leads? |
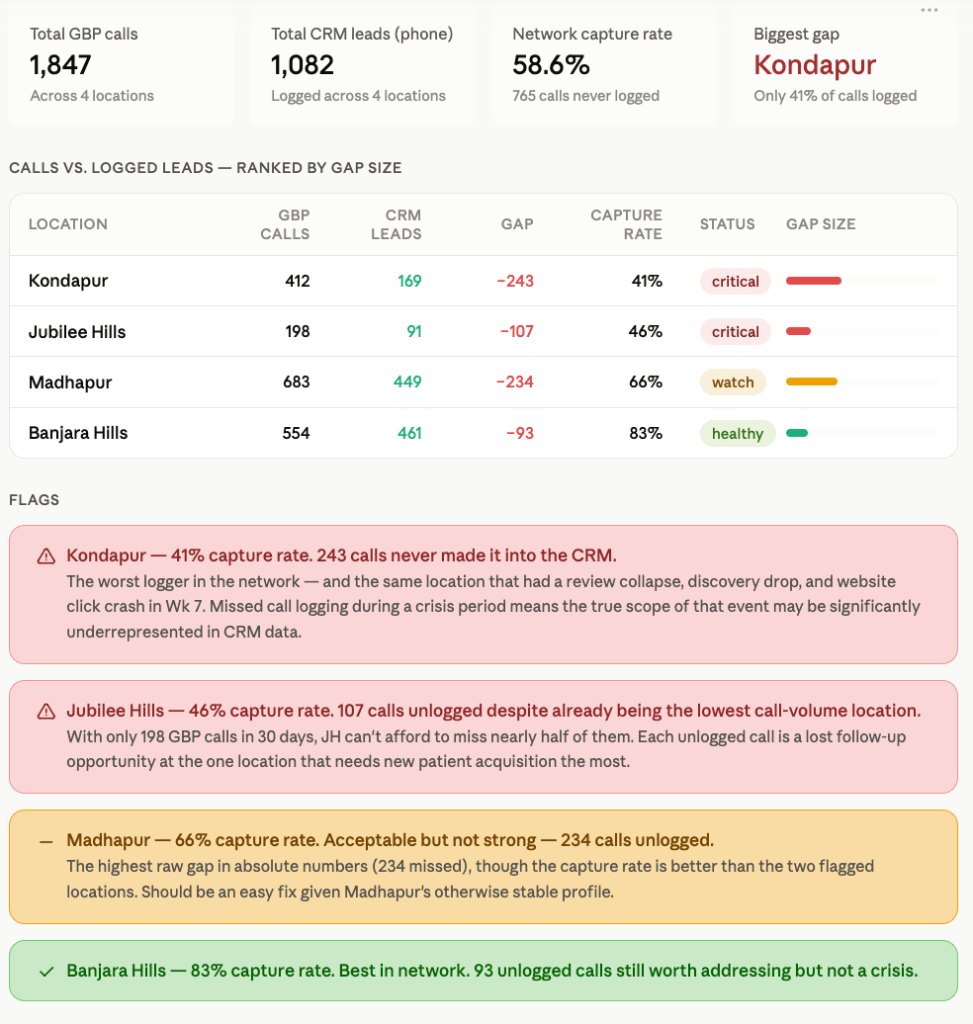
Use this when you want to know how many of the calls your GBP profile generates are actually making it into your CRM. A high call volume on GBP means nothing if the leads aren’t being logged.
This is one of the clearest examples of what Coupler.io makes possible that other single-source connections cannot. You have GBP call volume and CRM lead data in the same flow, queryable together in Claude.
Review response time analysis
From the reviews list, calculate the average time between a review being posted and a response being added for each location. Flag any location where the average response time exceeds 48 hours or where more than 20% of reviews have no response. |
Review response time is a local ranking signal and a trust signal. A prospective patient browsing a profile sees unanswered negative reviews before they see anything else. This prompt uses the Reviews list report type to measure how quickly each location responds and how many reviews go unanswered entirely.
Seasonal search keyword shifts
Compare the top 15 search keywords from this quarter against the same period last quarter. Which terms gained the most impressions? Which dropped out of the top 15 entirely? Flag any new high-volume terms that weren't appearing before. |
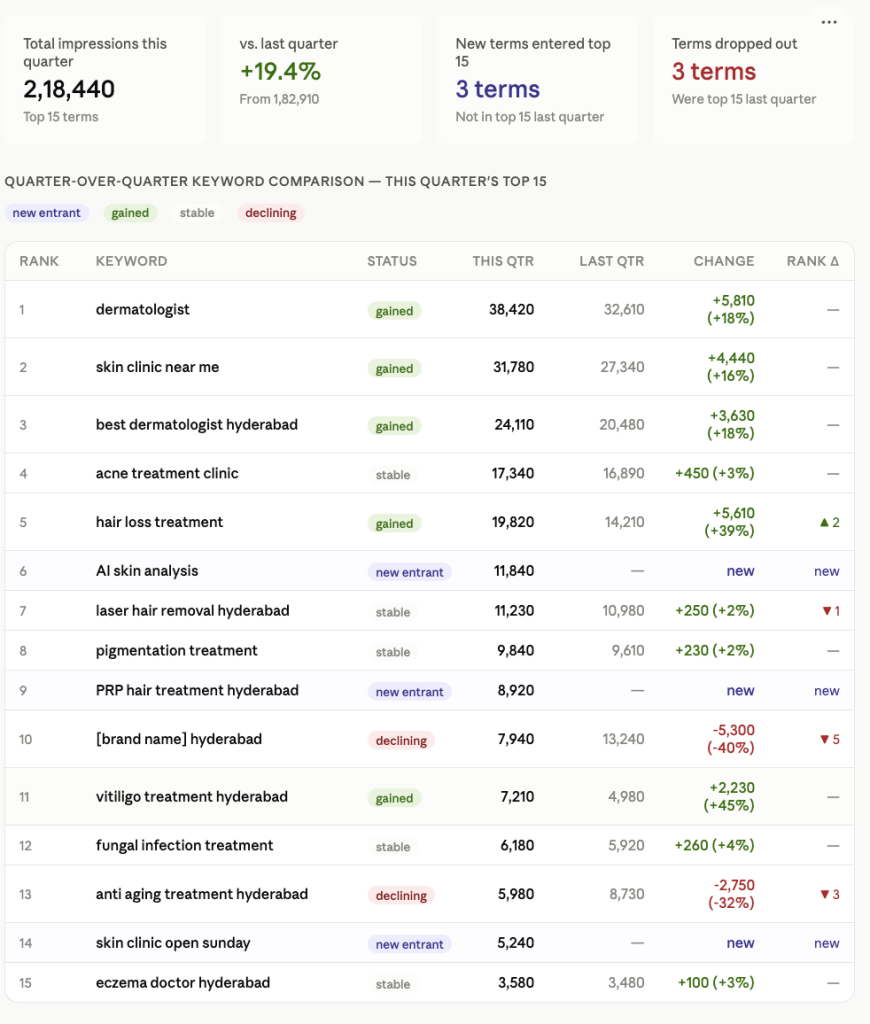
Use this prompt at the start of each quarter to catch emerging search trends before competitors do and to identify terms your profile is losing ground on. Keyword shifts in GBP often signal changes in patient behavior or market competition before they show up in any other metric.
What matters when you connect Google Business Profile data to Claude
A live connection and clean data get you to the starting line. These are the things that determine how far the analysis actually goes.
GBP metrics don’t explain themselves
A location ID tells Claude nothing on its own. A call volume number tells Claude nothing about whether it’s high or low for your category. Claude only sees column names and rows. It doesn’t know which locations are flagships, what a normal week looks like for calls, or which markets have heavy local competition.
You can fix some of this before the data even reaches Claude. In Coupler.io, rename location IDs to actual location names and rename column headers to match your reporting language. Claude then reads “Jubilee Hills” and “inbound calls” instead of “loc_id_04” and “phone_action_count.”
For the business logic that can’t be captured in a column name, use a Claude Project instead. Add a document explaining your location tiers, benchmarks, and definitions once. Every conversation inside that project starts with that context already in place.
Claude reads GBP data, but does not aggregate it
Calculating discovery share across 30 locations over 90 days means summing thousands of rows correctly, every single time. Ask Claude to do that math directly from raw daily metrics, and the numbers come out wrong sometimes, especially when a location has data gaps or the date ranges overlap.
Coupler.io’s Analytical Engine runs that calculation before the data reaches Claude. It totals the action counts, works out the search type ratios, and handles the date comparisons in advance. Claude then explains what the numbers show: which locations are slipping on discovery, and which are gaining.
Recurring location reports shouldn’t start from zero each time
If you check the same metrics every week, like discovery share, call volume, or review velocity, you shouldn’t have to start from scratch each time. The questions stay the same. The locations stay the same. Rebuilding the analysis from a fresh export every week is the real bottleneck, not the thinking behind it.
Coupler.io refreshes your GBP data on a schedule and keeps it connected to Claude. The data is ready the moment you need it. No downloading three CSVs first.
Not everyone on the team needs Claude
A local SEO manager wants to ask questions in plain language. A client wants a Looker Studio dashboard for a quarterly review. A franchisee just wants a Google Sheet filtered to their own location.
Connect your GBP locations once in Coupler.io, and send the same data to Claude, Looker Studio, and Google Sheets at the same time. Everyone works from the same numbers, refreshed on the same schedule. No mismatch between what the client sees and what Claude is analyzing.
Learn more about how to connect data to Claude.
More ways to set up Google Business Profile to Claude integration
Coupler.io is the most complete path for recurring analysis, but it’s not the only Google Business Profile to Claude integration worth knowing about.
Manual export
The manual export works through the Business Profile Manager dashboard. Select your locations, go to Actions, choose Download Insights, pick a report type, set your date range, and download the CSV. Upload it directly to Claude and start asking questions.
It’s free and requires no setup. For a one-off analysis at a single location, like checking last quarter’s performance or preparing for a client meeting, it is good enough.
You can only download one report type at a time, and reviews aren’t included in the performance CSV. For multiple locations, it comes to one download per location per report type. Nothing updates automatically, so the moment you need fresh numbers, you’re back to the same process.
Third-party MCP servers
Porter Metrics, Adzviser, and Two Minute Reports are common choices for a Google Business Profile to Claude integration outside Coupler.io. They can connect to Claude through the custom connector settings. Setup requires a Claude Pro or Team subscription.
Once connected, you can query GBP data in plain language through Claude. Third-party MCP servers pass data through directly. There’s no transformation layer, no Analytical Engine handling aggregations, and no multi-destination output. You also can’t blend GBP data with other sources in the same flow.
Coupler.io’s connector is also MCP-based. The difference is it’s available as a one-click connector in Claude’s directory, with a processing layer between the raw GBP data and Claude.
API scripts
The Google Business Profile API gives you full control over what data you pull and when. You’ll need OAuth credentials from Google Cloud Console, a service account, and a script to fetch and format the data before it reaches Claude.
It’s the right path for teams with engineering resources who need a fully custom pipeline with specific metrics, custom date logic, or integration with internal systems. The build-and-maintain cost is real, though. API changes, token refresh handling, and error logging all fall on you. For a marketing or ops team doing recurring analysis, the overhead rarely justifies the control.
Which method should you use?
If you manage a single location and only check in occasionally, the manual export works fine. Download the CSV, upload it to Claude, ask your questions, repeat next month.
Multiple locations or recurring analysis is where the manual route breaks down. Three report types across ten locations means thirty separate downloads every time you want the full picture. A third-party MCP server solves the export problem, but you’ll still hit a ceiling without verified calculations, scheduled refreshes, or a dashboard feeding off the same data.
For agencies running multiple clients, Coupler.io is the practical choice. One connection, separate data flows per client, Claude for analysis, Looker Studio or Google Sheets for client-facing reports. When a client asks why their Kondapur location dropped in Week 7, you already have the answer.
For most teams doing more than the occasional check, the manual method is what slows things down, not the analysis itself. Whichever way you connect Google Business Profile to Claude AI, the goal is the same: spend less time exporting and more time asking questions.
Get analysis-ready Google Business Profile data into Claude
Get started for freeFAQs
1. Why connect Google Business Profile to Claude?
A Google Business Profile dashboard tells you what happened: calls, impressions, direction requests. Claude lets you ask why. Why one location’s discovery share is dropping while another holds steady. Which search terms are driving visibility at your top performers. What the review sentiment looks like across all locations, in one read. This is most useful if you manage multiple locations or run the same analysis regularly and don’t want to rebuild it from scratch every time.
2. Can I connect multiple GBP locations in one data flow?
Yes. You can select multiple verified locations when you set up the data flow in Coupler.io. All of them come through in the same dataset, so you can ask Claude to compare, rank, or flag patterns across locations in a single prompt instead of running separate analyses for each one.
3. Is it safe to connect Google Business Profile data to Claude through Coupler.io?
Yes. Coupler.io connects to Claude through a read-only channel. Claude can analyze the data, but it can’t make changes to your GBP listings or any source system. The connection is token-based and encrypted, and data sent for analysis isn’t used to train Anthropic’s models. If you run the local MCP server instead, the data never leaves your own machine.