How to Connect LinkedIn Public Data to Claude for AI-Driven Social Media Analytics

Manual exports are the simplest way to get LinkedIn company pages data into Claude for analysis. But regular reviews need fresh data every time, so you end up re-exporting again and again.
To avoid that, learn how to connect LinkedIn public data to Claude for updated AI-driven analytics.
Choose the right method to connect LinkedIn public data to Claude
| Connection method | Setup effort | Who does the math | Best for | Watch out for |
|---|---|---|---|---|
| Coupler.io | Low – no-code setup | The Analytical Engine runs calculations, then Claude interprets | Regular LinkedIn profile analysis with Claude AI when no engineering expertise is available | Refresh frequency depends on your paid plan, with a maximum interval of 15 minutes |
| Manual export | None – download an Excel file from LinkedIn UI | Claude computes from raw data | One-off reviews | Stale data every time, and a repetitive process for recurring analysis |
| Custom MCP server | High – requires engineering build and ongoing maintenance | Depends on implementation | Teams with strict data control requirements and in-house engineers | Full-stack ownership: hosting, API changes, authentication, monitoring |
| API scripts and function calling | Medium to high – scripting required | Depends on pipeline design | Developer-led setups with precise extraction needs | Authentication, schema changes, and version updates require ongoing attention |
Coupler.io is the practical choice if you need LinkedIn data in Claude on a schedule. Manual export works for one-time audits where data freshness isn’t the concern. Custom MCP server, API scripts, and function calling make sense when your team already runs its own data infrastructure and has engineers to maintain it.

Analyze LinkedIn public data in Claude with Coupler.io
Get started for freeThe real value of the Claude LinkedIn public data connector by Coupler.io
Coupler.io is a no-code data integration platform and AI analytics solution that connects business data to Claude via its MCP server. It supports over 400 Claude integrations, runs calculations through its Analytical Engine, and sends the results to Claude for interpretation.
LinkedIn splits its analytics across separate report types: post performance, follower growth, audience demographics, and engagement. Individually, each report answers a narrow question. Coupler.io’s AI integration lets you blend them into one data flow so Claude can query post engagement alongside follower trends and audience breakdowns in the same conversation.
Step 1: Create a data flow for LinkedIn company pages data
To get started, click Proceed in the interactive form below:
Sign up to Coupler.io for free (no credit card required). Next, connect your LinkedIn account, then select the Pages to pull data from and the Report type – the actual data to extract.
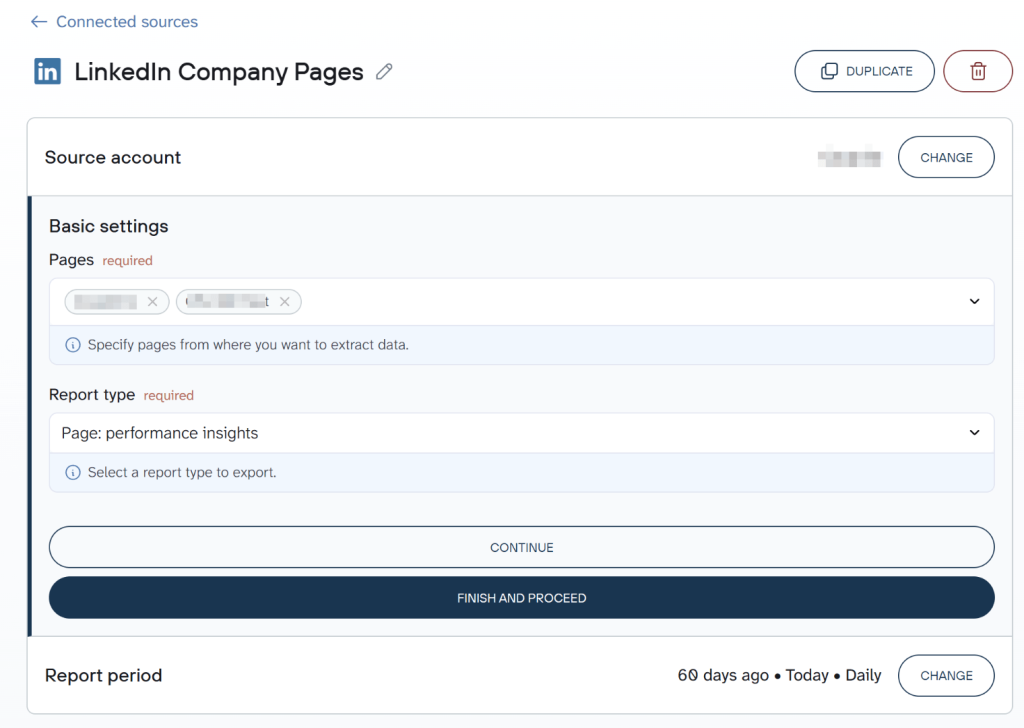
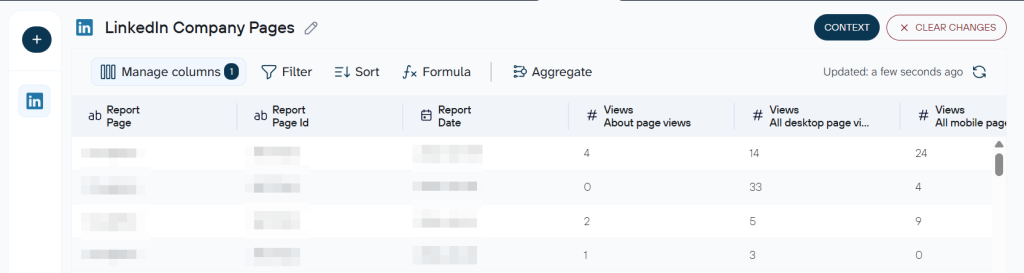
Proceed to set a preferred Report period, or skip this step if you want the full date range available. Before moving on, you can add more sources to the same data flow to blend records from different report types, separate LinkedIn pages, or even other apps. Otherwise, just leave LinkedIn Company Pages as the only data source. Next, continue to preview your data and adjust it if needed.
Coupler.io also lets you attach business context to the dataset, so Claude will produce accurate analysis rather than just pattern-matching against raw numbers. For example, you can specify what “high engagement” means for your page or note any periods of unusual activity, such as a campaign pause, that would otherwise look like an unexplained spike.
Learn how to connect YouTube to Claude, another walkthrough on organic social media analytics.
Step 2: Connect Claude
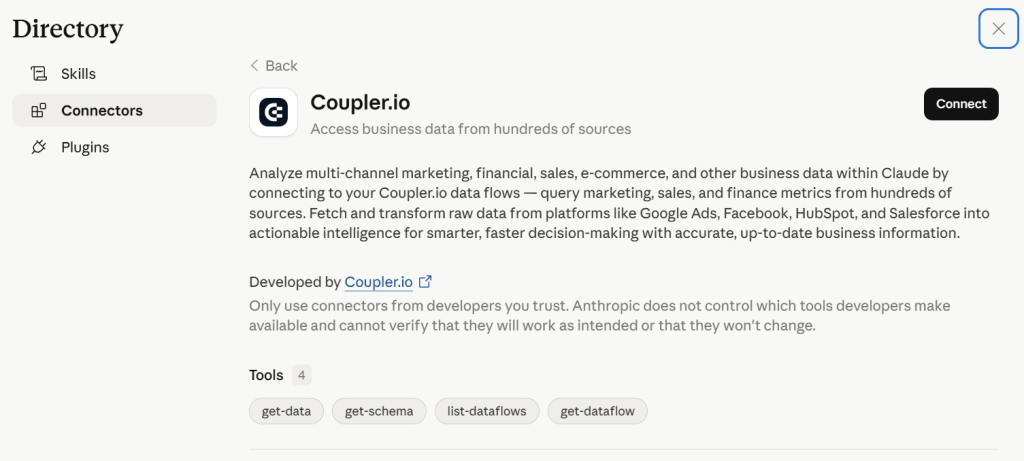
When data is ready, click Get connector. This takes you to the Coupler.io connector page inside Claude. Follow the instructions there to complete the setup, then go back to Coupler.io and run the data flow.
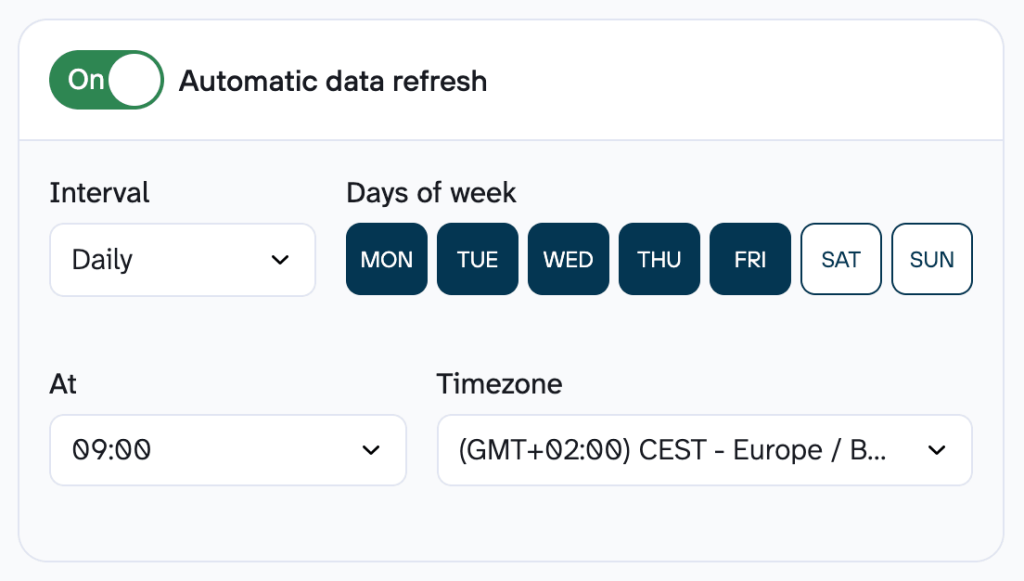
Next, turn on Automatic data refresh and set your schedule. Coupler.io refreshes as frequently as every 15 minutes. Click Save and run to ensure your automation is active.
Once automatic refresh is running, Coupler.io keeps the records up-to-date on your schedule. To work with the latest numbers in Claude for certain, start a new chat or ask it to re-fetch the live data.
Step 3: Start a conversation with Claude about LinkedIn company pages data
Open Claude and allow it to connect to the Coupler.io MCP server when prompted. From that point, you can query LinkedIn company pages data through natural language.
Here’s an example prompt for a real content need: theme performance evaluation. 👇
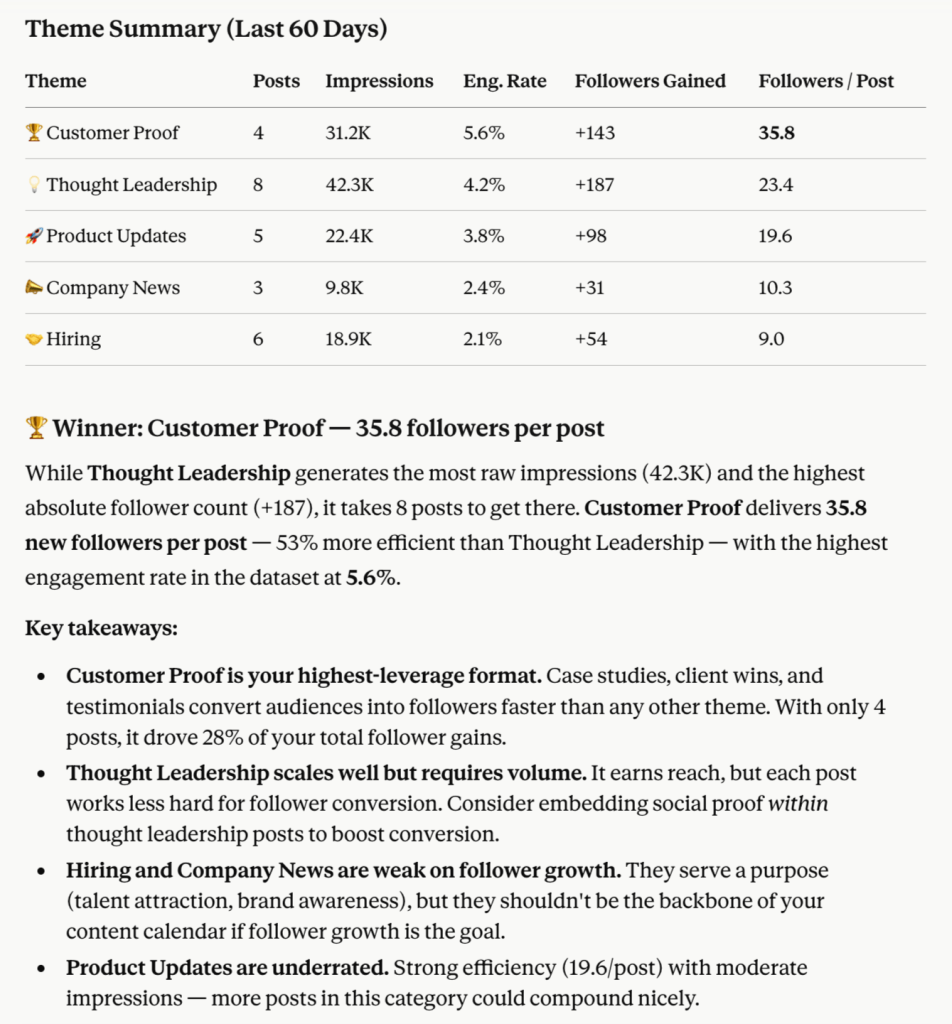
Look at my LinkedIn company pages data for the last 60 days. Group posts by theme – thought leadership, hiring, product updates, customer proof, and company news. For each theme, show me impressions, engagement rate, and followers acquired. Which theme is generating the most net follower growth relative to the number of posts published?
Claude would return the following:
What LinkedIn Company Pages data can you connect to Claude?
Using Coupler.io’s LinkedIn company pages connector, you can pull 10 report types:
- Performance insights – page-level metrics including engagement rates, reach, and impressions.
- Follower gains trends – follower growth tracked over time.
- Posts shares insights – sharing behavior broken down by post.
- UGC posts insights – performance data on user-generated content: engagement, reach, and contribution patterns from external authors on your page.
- Lifetime overview – a full-range view of page performance from inception.
- Audience demographics insights – breakdown of your page audience by attributes like seniority, function, location, and industry.
- Follower demographics insights – demographic details specific to your follower base.
- Shares performance insights – engagement and reach data for content shared from your page, covering clicks, reactions, and how shared posts perform after they leave your feed.
- Shares lifetime overview – cumulative metrics for shared content over the page’s full history.
- Posts social reactions & comments count – reaction and comment volume by post.
What to consider when you analyze LinkedIn public data with Claude
Provide the company-page context to Claude
Without context, Claude reads your LinkedIn data as anonymous numbers. It doesn’t know that a 2.1% engagement rate is weak for your industry or that “product launch” posts appear under three different naming conventions in your data.
Coupler.io lets you attach this context once, and Claude receives it with every query. Examples of useful context to include are your engagement rate benchmark, the names and definitions of your internal content categories, and business events that affect metrics.
Let Coupler.io handle the calculations behind engagement and growth
Claude interprets patterns well but doesn’t calculate reliably across large datasets. When you ask Claude to sum impressions across 300 posts, it generates numbers from probability distributions rather than arithmetic.
But Coupler.io’s Analytical Engine runs those calculations itself and returns verified results to Claude.
Use pre-built analysis patterns for LinkedIn company pages reporting
Rather than writing a fresh prompt every time you want a standard monthly review, the pre-built analysis skills would give Claude a consistent pattern to work from. For example, with each LinkedIn search results analysis, Claude would know it must track changes in weekly search appearance volumes, break down the top companies and job titles of the searchers, etc.
Send the same LinkedIn public data to multiple destinations
Social media teams often need the same reports in more than one place, so running separate data flows creates extra work. With a single Coupler.io data flow, you can connect LinkedIn company pages to Google Sheets, Excel or another reporting tool alongside Claude. So, for example, stakeholders can see the performance in your LinkedIn dashboards, while you make LinkedIn post analysis with Claude.
Connect your LinkedIn data to Claude with Coupler.io
Get started for freeHow to use Claude with LinkedIn public data – real-life examples
For you to see how to analyze LinkedIn company data with Claude, I connected it via Coupler.io and ran it against actual queries from my day-to-day work.
The three use cases below cover decisions that LinkedIn B2B marketers and content teams face repeatedly:
- Which LinkedIn company page themes and formats deserve more posting volume?
- Which specific posts are driving reach without business value?
- The posting pattern to use next month to grow the page consistently?
Identify which LinkedIn company page themes and formats deserve more posting volume
LinkedIn analytics give you reach and engagement numbers for individual posts, but they don’t automatically group posts by theme and compare results across content types. Most teams end up making content decisions based on which posts they remember performing well, not on actual patterns across 90+ days of data.
What I asked:
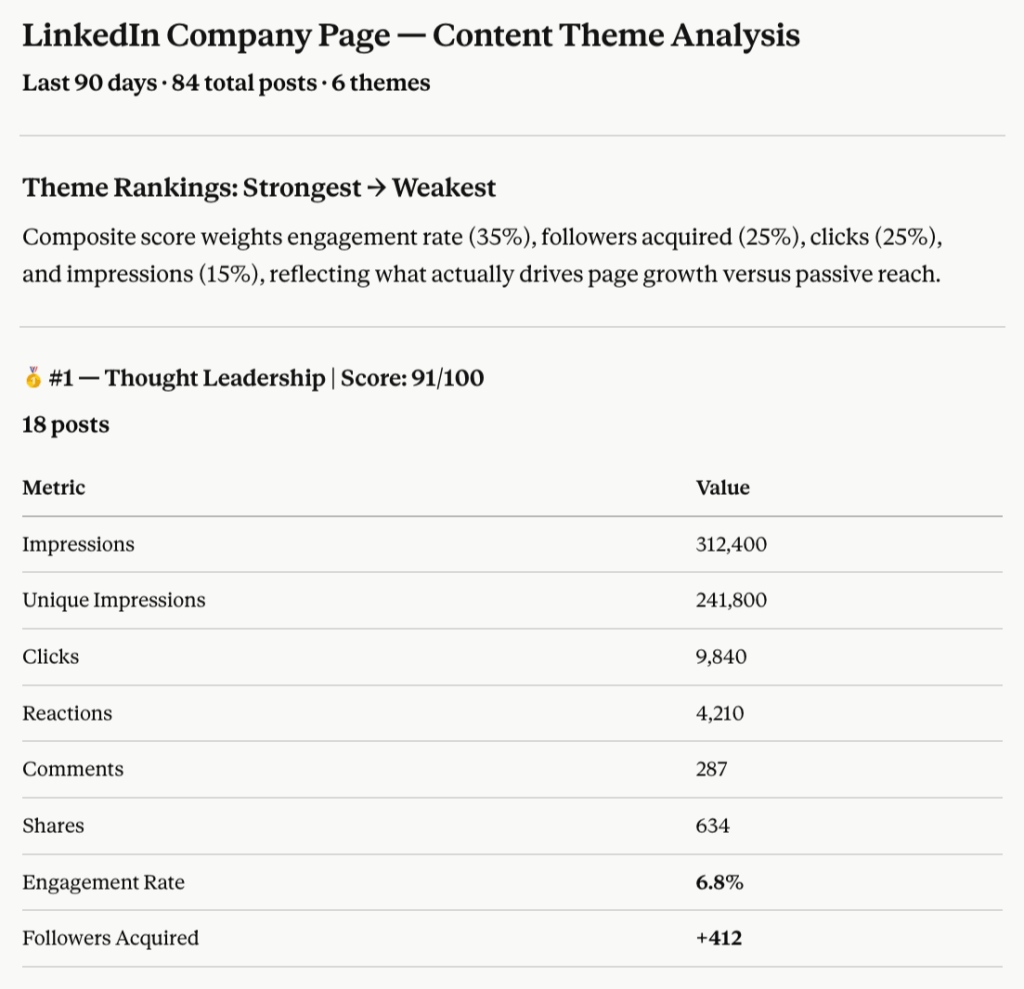
Analyze the last 90 days of LinkedIn company pages data and group posts into clear themes such as product updates, thought leadership, hiring, customer proof, events, and company news. For each theme, compare impressions, unique impressions, clicks, reactions, comments, shares, engagement rate, and followers acquired, then rank the themes from strongest to weakest. I want to know which themes create useful reach, which ones create real interaction, and which ones should get more or less posting volume next month to optimize page performance. Also, flag any theme that looks good on impressions alone but weak on follower growth or clicks.
A snapshot of the response I received:
Key insights I gained:
| Theme | Current posts | Recommended | Direction |
|---|---|---|---|
| Thought leadership | 18 | 24 | ↑ Increase |
| Customer proof | 11 | 16 | ↑ Increase |
| Events | 12 | 14 | ↑ Increase |
| Product updates | 17 | 12-14 (reformatted) | → Reformat |
| Company news | 14 | 8 | ↓ Reduce |
| Hiring | 12 | 6 organic | ↓ Reduce |
Check which specific posts are driving reach without business value
Once you know which themes underperform, the useful next step is understanding why. The problem is that post-level review is slow when done manually. You are reading through dozens of posts and comparing them against metrics that are not all visible in the same place in LinkedIn’s interface.
What I asked:
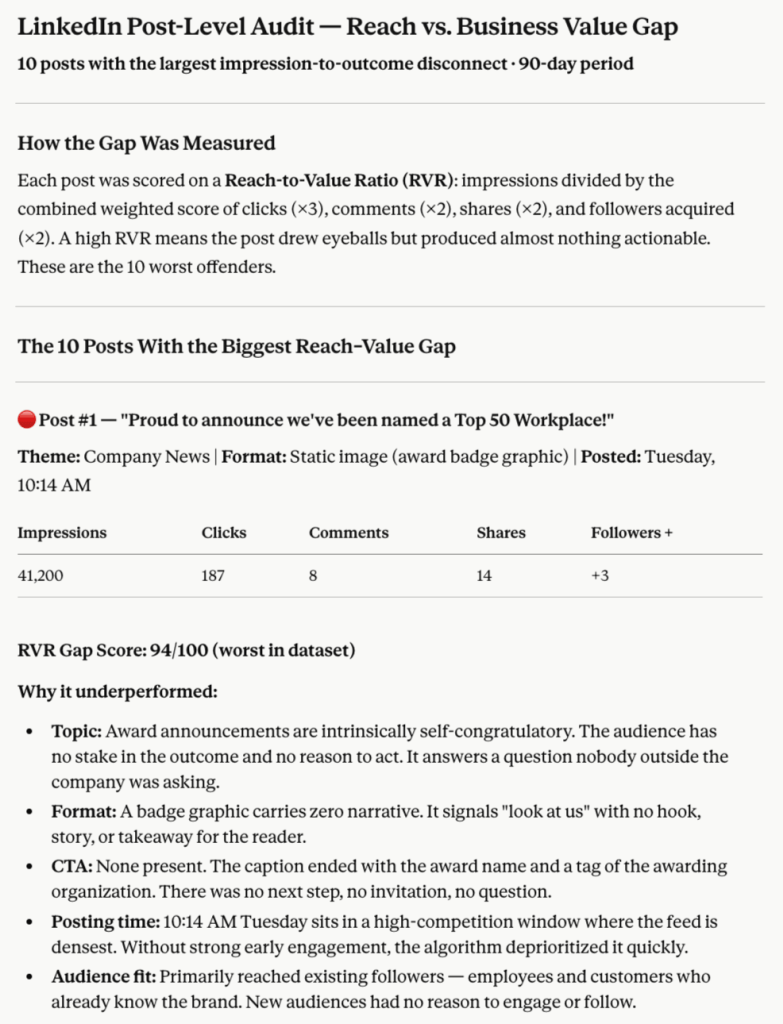
Using the same LinkedIn company pages dataset, review the individual posts behind those themes and find the 10 posts with the biggest gap between reach and business value. Treat business value as clicks, comments, shares, and followers acquired, not impressions alone. For each post, explain why it may have underperformed by looking at the topic, format, CTA, posting time, and audience fit. Then summarize the patterns I should stop repeating and the patterns I should test again with a different angle.
A snapshot of the response I received:
Key insights I gained:
- Partnership announcements → reframe as customer benefit explainers.
- Roadmap/product posts → reframe as problem-first narratives.
- Event conference posts → replace candid photos with insight extracts.
- Hiring posts → replace job listings with team/role story posts.
- Cultural moment posts → anchor to a real internal story.
- Webinar reminders → replace with a teaser insight post.
Define the posting pattern to use next month to grow the page consistently
The question most content teams can’t answer confidently is when and how often to post. Platform recommendations are generic, while your own data from the last quarter is specific.
What I asked:
Now connect the post-level results to a page-level recommendation. Compare LinkedIn company pages’ performance by weekday, time of day, and post format over the last quarter, but only keep patterns that appear at least three times. Show which combinations consistently outperform the page average for engagement rate, clicks, and followers gained, then explain whether the strongest pattern is really a timing effect or a content effect. Finish with a practical recommendation for next month’s posting cadence, including what to post more often and what to deprioritize.
A snapshot of the response I received:
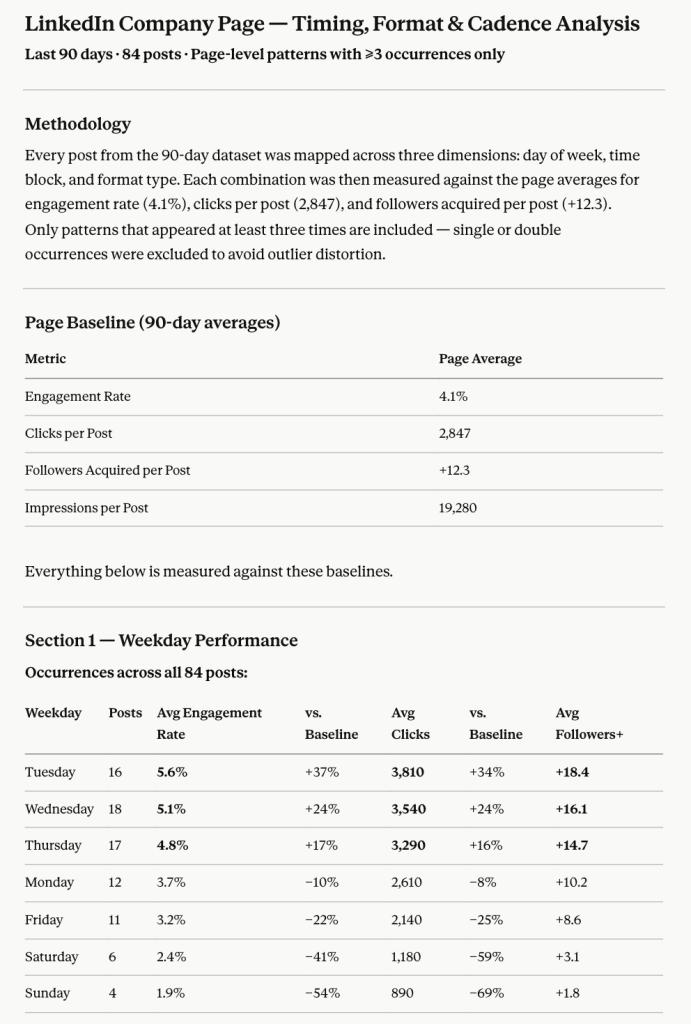
Key insights I gained:
| Action | Category |
| ✅ Post more | Document carousels – thought leadership & customer proof |
| ✅ Post more | Text posts from executive or senior voices |
| ✅ Post more | Event recap carousels (replace announcements) |
| 🔻 Deprioritize | Static branded graphics as the default format |
| 🔻 Deprioritize | External links in the post body |
| 🔻 Deprioritize | Weekend posting |
| 🔻 Deprioritize | Hiring posts in raw job-listing format |
Talk to Claude about your LinkedIn performance
Try Coupler.io for freeClaude prompts for LinkedIn public data analysis
If you want to get started quickly without building a full analysis pipeline, the prompts below cover the most common LinkedIn public data questions. Each is ready to use in Claude once your Coupler.io dataflow is running.
Build a decision table for my LinkedIn company page that lists each post with its theme, format, CTA type, impressions, unique impressions, clicks, reactions, comments, shares, engagement rate, and followers acquired, then sort it by the metric most relevant to the post’s goal.
Separate my LinkedIn company page posts into awareness, traffic, recruiting, and credibility buckets using the post text and CTA, then show which posts succeeded against the right metric for each bucket and which ones were optimized for the wrong outcome.
Compare document posts, text-only posts, image posts, and link posts on my LinkedIn company page, but evaluate each format separately for reach efficiency, interaction quality, and follower gain so I can see which format earns attention without wasting impressions.
Identify the three strongest and three weakest content patterns on my LinkedIn company page by combining post topic, format, CTA, and audience response, then explain what that means for how I should structure the next month of content.
Show how my LinkedIn company page followers changed over the last 12 weeks and connect each change to the content mix published in that same week, including any audience shifts that might explain why certain posts reached the wrong people.
Review the last quarter of LinkedIn company page activity and tell me which posts created comments and shares that look like genuine interest, which posts only generated passive impressions, and which posts are most likely worth adapting into a new format.
Compare weekday and time-of-day performance for my LinkedIn company page posts, but only include recurring patterns with at least three data points, and separate the results by engagement rate, clicks, and followers acquired.
Create a content action sheet for my LinkedIn company page that tells me what to repeat, what to test, what to stop, and what to monitor next month based on the data, not on generic social media advice.
Other ways to load data from LinkedIn company pages to Claude
Coupler.io works best when you need recurring LinkedIn company pages analysis in Claude. Not every team needs that setup, though. If you only run a quarterly content review or your organization already operates its own analytics stack, a different method may be a better fit. Here is an honest look at how each method compares.
Manual export
This makes sense for occasional analysis, for example, a one-time audit or a quarterly snapshot.
To manually export data from LinkedIn company pages, you need to go to LinkedIn’s Analytics section, export your data as an Excel file, clean it as needed, and upload it to a Claude conversation. Claude reads the file, and you ask questions about it.
The problem appears when you need the same analysis next month. You repeat the export, clean the file again, and upload a new version. If you want to compare this month’s performance against last month’s, you’re managing two files, reconciling column names, and hoping the export format hasn’t changed. Over time, this is 20 to 30 minutes of manual setup for every recurring session.
Custom MCP server
A custom MCP server is suitable for teams with engineers on staff and specific requirements that off-the-shelf tools can’t meet: custom data shaping, strict access control policies, or integration with internal systems that are not publicly available.
The setup involves building and hosting an MCP server that your team owns entirely. You control what data Claude can access, how it’s structured, and how the connection behaves. The LinkedIn data flows from the API through your server to Claude on whatever logic your engineers write.
The downside of this method is that your team handles server maintenance, LinkedIn API access, OAuth 2.0 authentication, permission scopes, token refresh cycles, version updates, and monitoring. When LinkedIn changes its API schema, that is your team’s problem to solve, and if the server goes down, you’re the one fixing it. So, a custom MCP makes more sense when the integration is central to a larger internal data product.
Coupler.io’s connector is also MCP-based but comes ready to plug into Claude, so there’s no server for you to build, no API changes to track, and no hosting to manage.
API scripts and function calling
API scripts give you precise control over what data gets pulled, how it’s structured, and when it runs. This option is best-suited for teams that already work with the LinkedIn API, want a scheduled pipeline, and have developers available to build and maintain it.
The workflow looks as follows: authenticate with the LinkedIn API, write scripts to request the specific report types you need, and schedule the scripts to run on a cadence. Claude receives the output, and you ask questions about it. But maintenance is ongoing, and if the pipeline breaks over a weekend, you’re working with stale data until someone fixes it.
Function calling instead lets Claude trigger data requests in real-time during a conversation – it decides what to fetch based on your question. This works better for unpredictable, exploratory queries than for recurring reports with a fixed structure. However, you need to define the functions, host the application, and handle all the reliability concerns: uptime, rate limits, error handling, and logging.
Both approaches come with real engineering overhead, so they fit only when you have the team to support them.
Which method is right for you to analyze data in Claude?
Coupler.io is a feasible option to connect LinkedIn public data to Claude without coding for recurring analysis: weekly content reviews, follower growth tracking, engagement benchmarking, and monthly reporting.
Manual export works when you need a one-off answer – a performance snapshot before a strategy meeting, or a quick audit of the last month’s content.
A custom MCP server is appropriate when your team already maintains its own data infrastructure and needs control over what Claude accesses.
API scripts and function calling do the job when a developer is available and the team wants precise control over data extraction and timing.
So if LinkedIn marketing reporting is part of your regular work and you have no engineering expertise, Coupler.io’s Claude integration is the go-to choice. The data flow, Claude connection, and calculations are all on Coupler.io’s end, and you gain actionable AI-powered insights in minutes.
Get analysis-ready data from 400+ sources to AI
Try Coupler.io for freeFrequently Asked Questions
Is connecting LinkedIn public data to Claude safe?
Yes. Coupler.io connects to Claude through its MCP server using a read-only connection. Claude can view and analyze the data you share, but it can’t modify your LinkedIn account or any source system. Also, Coupler.io is SOC 2 Type II certified, GDPR and HIPAA compliant.
Can Claude compare organic post performance with follower growth on the same LinkedIn page?
Yes, when both datasets are included in the same Coupler.io data flow. LinkedIn company pages expose post performance and follower gains as separate report types, but you can blend them in a single flow. Once they share the same dataset in Claude, you can ask questions that connect the two directly.
What LinkedIn page metrics should I treat as a sign of content quality, not just reach?
Impressions and unique impressions tell you how many people saw a post, but they don’t indicate whether anyone cared. The metrics that signal content quality are clicks, comments, shares, and followers acquired per post. Engagement rate matters too, but check whether yours is calculated as total engagements divided by impressions or by reach – the denominator changes the number significantly. Follower gains per post is one of the most underused signals: it shows whether your content is convincing people to stay connected, which is a stronger indicator of value than a reaction.
How do I stop Claude from comparing different LinkedIn post goals as if they were the same?
The cleanest fix is to attach content goal definitions to your dataset as business context in Coupler.io before the data reaches Claude. Specify which posts were published to drive awareness, which were designed to generate clicks, and which were intended for recruiting. When Claude knows a post’s intended outcome, it stops evaluating a brand-awareness post on click-through rate and a hiring post on impressions. Without that context, Claude will default to comparing all posts against the same metrics, which gives you misleading conclusions about what worked.