Braze stores your engagement data across campaigns, canvases, segments, and user profiles. However, it’s quite a challenge to export data from Braze. CSV exports from the dashboard fail above 500,000 users. Download links expire within 4 hours. Currents, the streaming export option, ships only on higher-tier plans and demands an S3 bucket to receive the data. The REST API returns JSON, not CSV, and requires a developer to write and maintain scripts.
Most teams skip the overhead and connect Braze to their reporting tools through Coupler.io. Here is how you can do this as well.
Automate Braze export data with Coupler.io
Coupler.io is a data integration platform AI analytics that automates data flows from over 400 business sources. It pulls your Braze data into spreadsheets, BI tools, warehouses, and AI tools on a schedule you control. You won’t mess with API keys, S3 bucket configuration, and other complex things. The setup only takes 3 simple steps.
Step 1: Collect data from Braze
Just create a data flow in Coupler.io. You can do this right away in the form below. Choose your destination for the Braze data and click Proceed.
You’ll be offered to sign up to Coupler.io for free with no credit card required.
Connect your Braze account by entering your REST API key and the appropriate Braze instance endpoint.
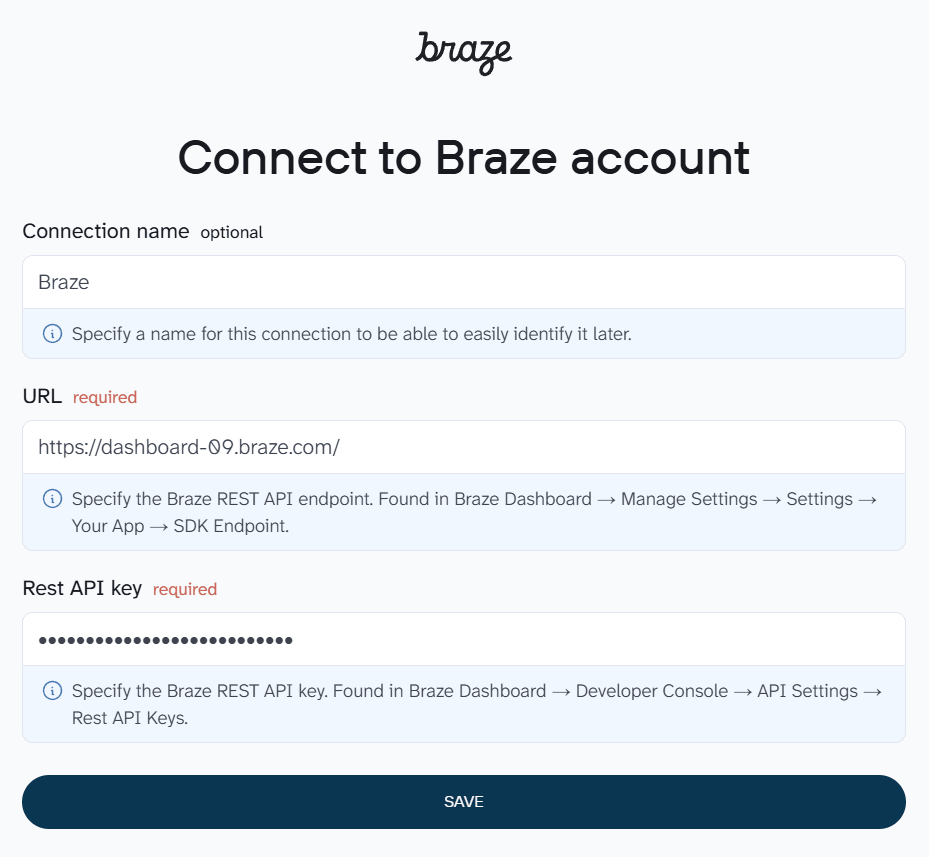
Once connected, choose the data entity to export and the start date for your Braze data export. If you need campaign-level engagement metrics, select Campaigns analytics. For user segment breakdowns, pick Segments analytics. And so on.
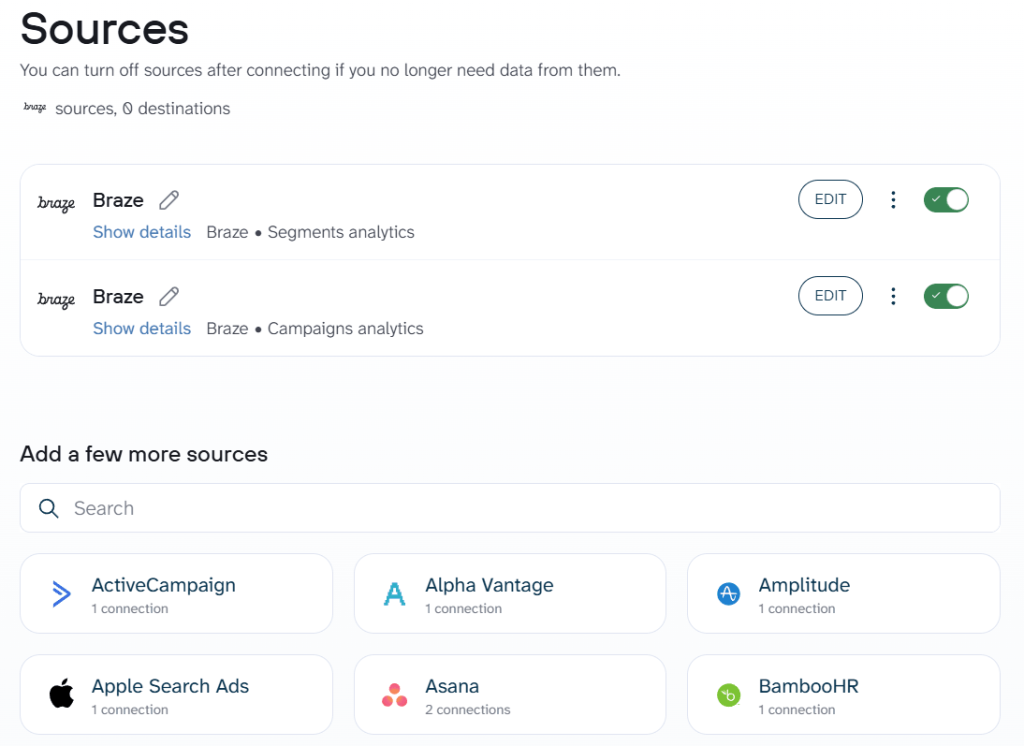
Coupler.io also lets you add multiple data sources to a single data flow. So you can pull campaigns and canvases together or combine Braze data with records from other apps.
Step 2: Organize your Braze data
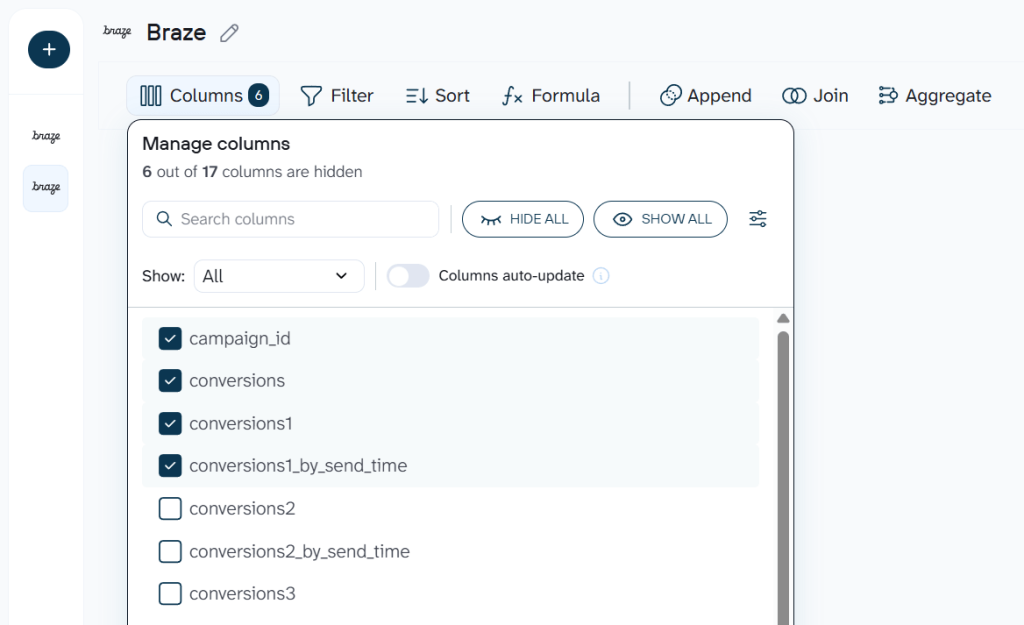
Raw Braze exports include columns you probably won’t need for your report. At the this step, you can clean and organize your data set before it reaches your destination.
- Drop columns like internal identifiers or SDK metadata that clutter your spreadsheet
- Rename fields so “
conversions1_by_send_time” becomes “Conversions by Send Time” in your report - Filter rows to isolate a specific campaign or date range
- Aggregate send counts and conversion rates by week or month
- Add calculated columns for metrics like conversion rate (conversions / sends)
- Join Braze campaign data with ad spend from Google Ads or Facebook to calculate cost per conversion
Step 3: Load data to your destination and schedule refresh
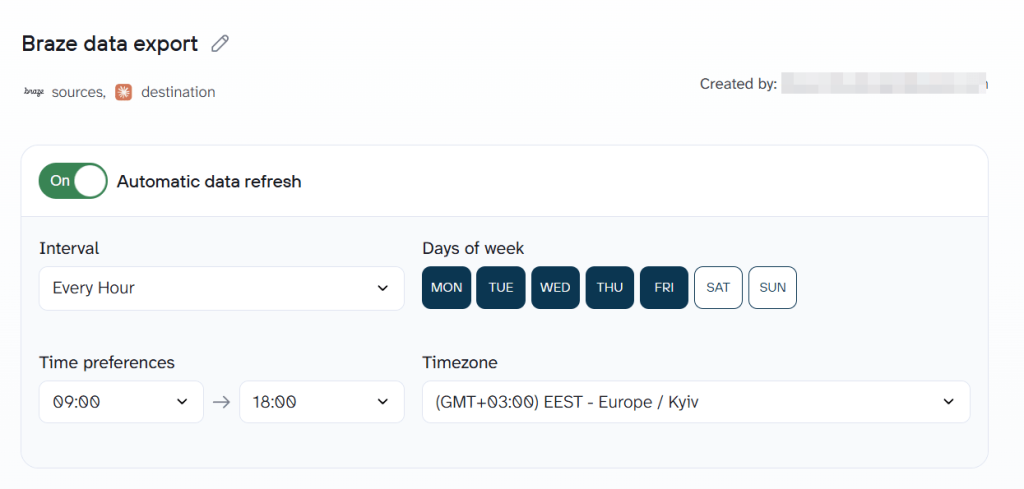
Follow the in-app instructions to connect your destination. Run the data flow to load the first batch and turn on Automatic data refresh. From this point, your Braze export data will run on the schedule you set. No more manual CSV downloads or expiring links.
Bonus step: Ask questions about your Braze data with AI Agent
With the active Braze data flow, open AI Agent. It is a conversational analytics assistant built into Coupler.io so you can ask questions about your Braze data. For example, here is the response to the question “Which campaign had the highest open rate last month?”
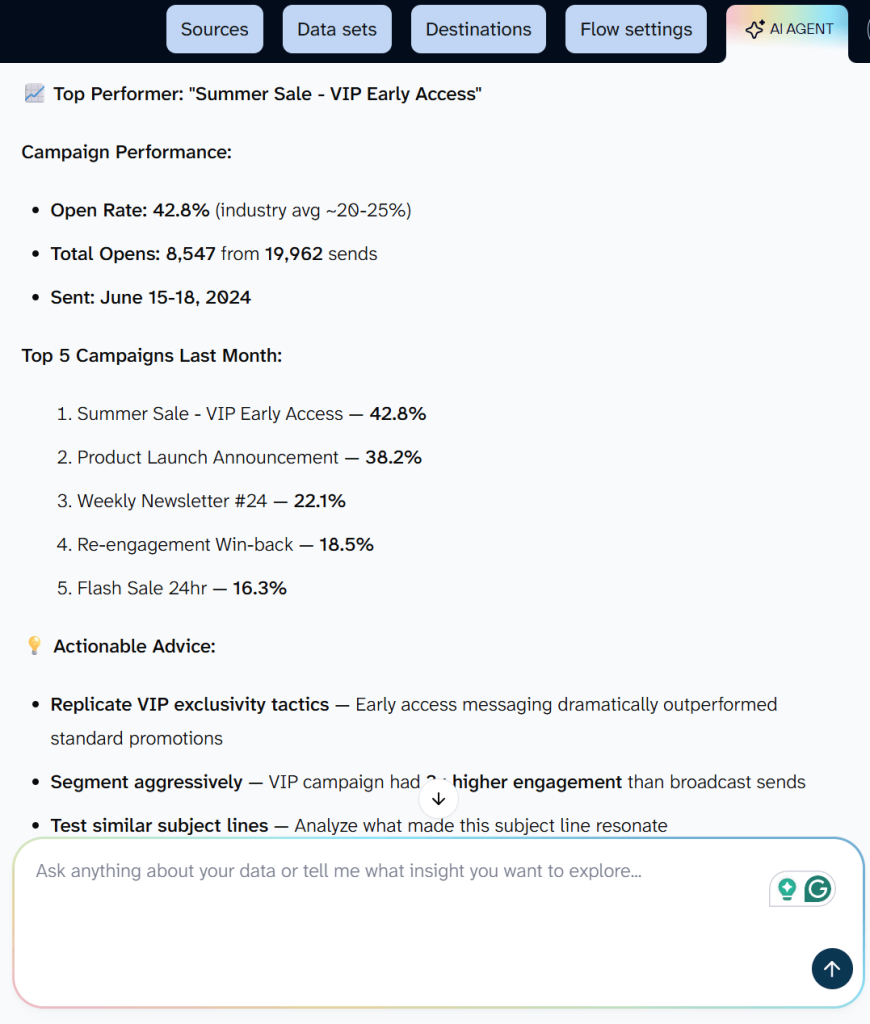
Here is how AI agent works:
- AI translates your question into a structured query.
- Coupler.io’s Analytical Engine runs the calculation and validates the result.
- Then AI formats the verified answer into a readable response. It works with any data flow regardless of destination.

Automate Braze data export for conversational analytics
Get started for freeWhat data can you export from Braze?
The Braze data connector gives you access to these data entities:
- Campaigns: full list of campaigns with names, channels, statuses, and creation dates. Use this to inventory active and archived messaging efforts.
- Campaigns analytics: send, delivery, open, click, bounce, and conversion metrics per campaign. This is your go-to entity for tracking which email, push, or SMS campaigns drive engagement.
- Campaigns details: audience segment, channel configuration, message variants, and scheduling rules for each campaign. Useful for auditing how campaigns were set up.
- Canvases: list of all Canvas flows with names, statuses, and tags. Canvases are Braze’s multi-step automation journeys, and this entity lets you track them at a glance.
- Canvases analytics: step-by-step engagement data across each Canvas, including entry counts, conversion rates, and drop-off at each stage. Helps you spot where users abandon a journey.
- Canvases details: full Canvas structure with entry criteria, branching logic, and variant configurations. Export this when you need to document or compare Canvas setups.
- Events: custom events tracked in your Braze workspace, such as “
added_to_cart” or “completed_onboarding.” Gives you a reference list of all event types your app sends to Braze. - Events analytics: daily counts and trends for each custom event over time. Useful for monitoring product adoption or feature usage patterns.
- Kpi daily new users: daily count of new user profiles created in Braze. Track growth velocity alongside your acquisition campaigns.
- Kpi daily active users: daily active user totals. Pair this with campaign data to measure whether messaging lifts engagement.
- Kpi daily app uninstalls: daily uninstall counts. Monitor churn signals and correlate spikes with specific campaigns or app updates.
- Cards: Content Card details including titles, descriptions, and click actions. Content Cards are persistent in-app messages, and this entity tracks what you’ve published.
- Cards analytics: impression, click, and dismissal metrics for each Content Card. Measure how in-app messages perform over time.
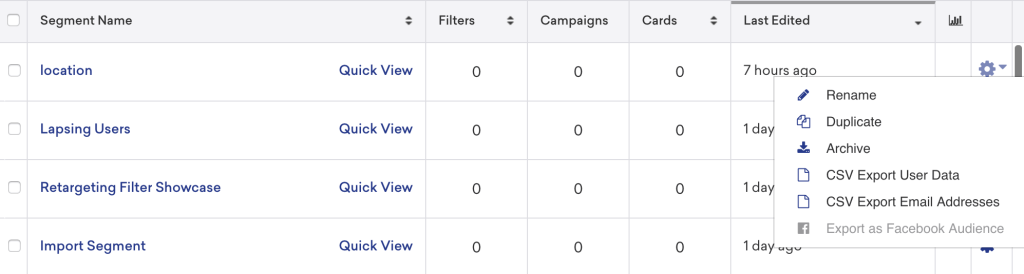
- Segments: list of segments with names, sizes, and statuses. Export this to get a high-level view of your audience structure.
- Segments analytics: segment membership trends over time. Track whether a segment is growing or shrinking, and by how much.
- Segments details: filter criteria and configuration for each segment. Export this to document your targeting logic or audit segment overlap.
Where you can export data from Braze
Once Coupler.io collects your Braze data, you can send it to any of these destinations:
- Spreadsheets (Google Sheets, Microsoft Excel, CSV). Your marketing lead already lives in spreadsheets. A weekly Google Sheet with campaign open rates and click rates gives them a report they can read, comment on, and share without learning a new tool.
- BI tools (Looker Studio, Power BI, Tableau, Qlik, Monday.com). Dashboards with filters, charts, and drill-downs turn raw Braze numbers into something a team can act on. Build a Looker Studio dashboard that visualizes Canvas conversion funnels and refreshes daily.
- Data warehouses (BigQuery, Snowflake, PostgreSQL, Redshift).When you need to join Braze engagement data with product usage or CRM records, a warehouse is where that happens. Store historical campaign metrics in BigQuery to analyze engagement trends over quarters or run SQL queries across sources.
- AI tools (Claude, ChatGPT, Gemini, Cursor, Perplexity, OpenClaw). Skip the dashboard entirely and ask questions in plain language. Connect Braze campaign data to Claude and ask “
Which message variant drove the most conversions in March?“
Key challenges for Braze users and how Coupler.io solves them
❗ Pain point 1: CSV exports cap at 500,000 users
✅ Solution: Coupler.io pulls data through the Braze API behind the scenes, with no file size caps. Your full segment data arrives in your destination intact.
❗ Pain point 2: Currents requires an expensive plan and cloud storage setup
✅ Solution: Coupler.io connects to Braze on any plan that provides API access. No S3 bucket, no Azure Blob, no streaming infrastructure to configure.
❗ Pain point 3: The REST API returns JSON and needs developer resources
✅ Solution: Coupler.io handles API authentication, pagination, and data formatting. You get clean, tabular data in your spreadsheet or warehouse without writing code. Every Braze export data request runs on the schedule you set.
❗ Pain point 4: No scheduled exports to spreadsheets or BI tools
✅ Solution: Set your refresh frequency from every 15 minutes to monthly. Your reports update on schedule without anyone logging into Braze.
❗ Pain point 5: Engagement data is siloed from revenue and ad spend
✅ Solution: Blend Braze data with information from 400+ other sources in a single data flow. Build cross-channel reports that show the full customer journey.
Other ways to export Braze data
Coupler.io handles scheduled, no-code Braze data export for most reporting workflows. But depending on your setup, a manual export or the API might be the right call.
Manual CSV export from the Braze dashboard
If you need a one-time data pull for a quick analysis or ad hoc request, Braze’s built-in CSV exports cover several data types. Campaign results are available from each campaign’s analytics page: open the campaign, scroll to the performance section, and click the CSV export icon. You get metrics like sends, deliveries, opens, clicks, and conversions broken down by variant. Canvas data works the same way: open the Canvas, go to analytics, and export step-level or summary metrics.
Braze generates the CSV export file in the background and emails a download link. That link expires after 4 hours. If you have Amazon S3 credentials linked, the CSV uploads to your bucket instead. Beyond campaigns, canvases, and segments, you can also export revenue data from the Revenue report page and custom event counts from the Custom Events report.
A few limitations to keep in mind:
- Exports fail for segments above 500,000 users
- No scheduling. Each export requires manual action
- Campaign analytics and Canvas data are not available through CSV export. Only segment user data is supported
- Output is a static snapshot. The data is already stale by the time you open it
Braze REST API
The Braze API is the right choice when your engineering team needs to build a custom pipeline or feed user data into a proprietary system. Authentication uses an API key created in Settings > APIs and Identifiers, with permissions scoped to specific endpoints.
Key endpoints to export data from Braze include:
/users/export/segment– export user profiles by segment_id/users/export/ids– export by external_id or braze_id/campaigns/data_series– export campaign analytics over time/canvas/data_series– export canvas analytics.
All responses arrive in JSON format. For large exports, Braze writes output to your connected S3 bucket rather than returning it inline.
Rate limits sit at 250,000 requests per hour for most endpoints. Each request payload caps at 4 MB. You will need to handle pagination, error retries, and JSON-to-tabular conversion yourself.
The API gives you granular control over exactly which fields and date ranges to pull. The tradeoff: ongoing developer time for maintenance, rate limit monitoring, and format conversion. For teams without dedicated engineering resources, a no-code connector like Coupler.io reaches the same data with a fraction of the effort.
Braze Currents
Currents is Braze’s streaming tool to export Braze data. It sends a continuous feed of engagement events (opens, clicks, sends, conversions, custom events) to a connected data warehouse or cloud storage bucket. Supported destinations include Amazon S3, Google Cloud Storage, Azure Blob Storage, and data warehouse partners like Snowflake.
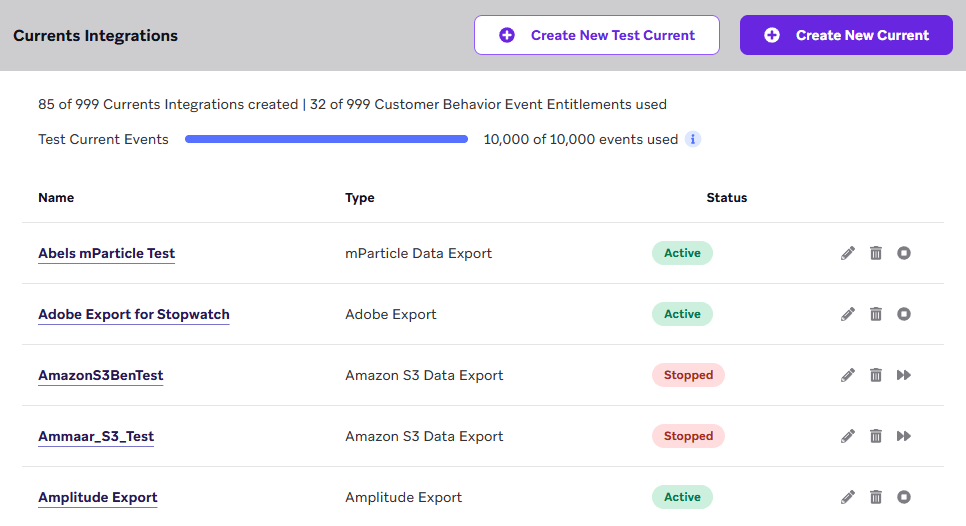
Currents is designed for high-volume, event-level data. If you need every individual push notification open or email click as a raw event row, Currents delivers that. Setup requires configuring a storage destination, enabling the Currents connector in Braze, and selecting which event types to stream.
What’s the catch?
Currents is only available on Braze’s higher-tier plans and requires cloud storage infrastructure your team must manage. It also sends raw event data, not aggregated campaign metrics, so you still need an analytics layer on top.
Which way is best for me to handle Braze data export
Use the manual CSV export when you need a one-time data pull and can wait for an emailed download link. Campaign results, Canvas analytics, segment user data, and revenue reports are all available as CSV from their respective dashboard pages. However, keep in mind that links to CSV files expire in 4 hours, and there is no way to schedule recurring exports.
Use the Braze API when your engineering team needs programmatic access to user profiles, campaign metrics, or event data for a custom pipeline or internal system. The API covers more data types and offers granular field-level control.
The downside is clear: you need developers to maintain scripts, handle JSON parsing, manage rate limits, and monitor for API changes.
Use Coupler.io when you want to automate Braze reporting & analytics. It supports over 15 destination including AI tools integrations. Common use cases for Braze data export are:
- Self-updating Google Sheets reports with weekly campaign open rates and click rates
- Looker Studio or Power BI dashboards that refresh Braze data every morning
- BigQuery or Snowflake storage for long-term Braze data retention beyond platform limits
- AI Agent conversations that answer questions about campaign and Canvas performance on demand
Setup takes minutes, and the data refreshes on the schedule you pick.
