A user can simply export Shopify data via the manual CSV download to get information almost instantly. However, this method is not suitable for regular reporting or backups. Another option is to automate Shopify data exports with Coupler.io. This data integration platform offers a no-code Shopify connector to export information to different destinations. In addition, it provides ready-to-use solutions for Shopify analytics.
How to automate data export from Shopify with Coupler.io
Create a new data flow in Coupler.io from scratch or use our preset form to get started right away. You only need to select a destination and click Proceed. You’ll be offered to get started for free with no credit card required.
Then complete the following steps
Step 1: Collect data from Shopify
Connect your Shopify account and select the data entity you want to export — for example, Orders, Products, Customers, or Inventory Items. Configure the settings accordingly. For example, for Orders, you can also specify columns to include and filter orders by statuses.
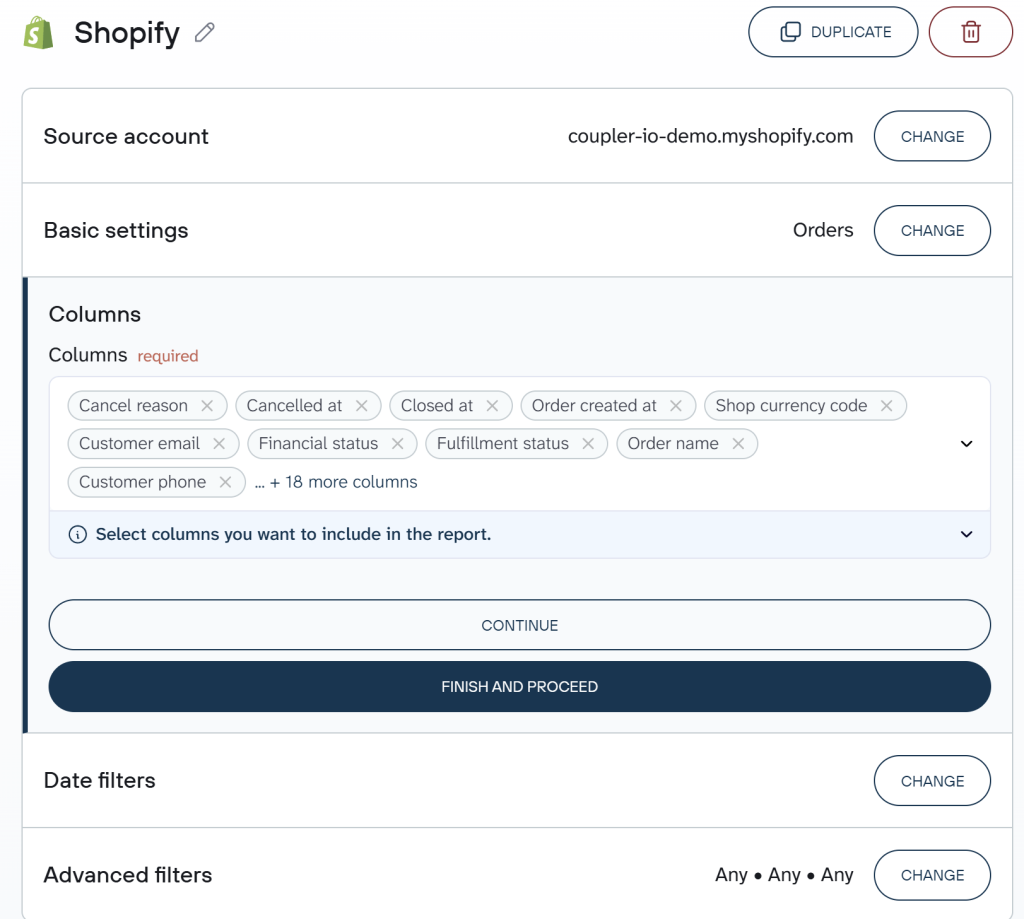
Coupler.io also allows you to add multiple Shopify accounts to the same data flow or connect other apps if you need to blend information from several sources.
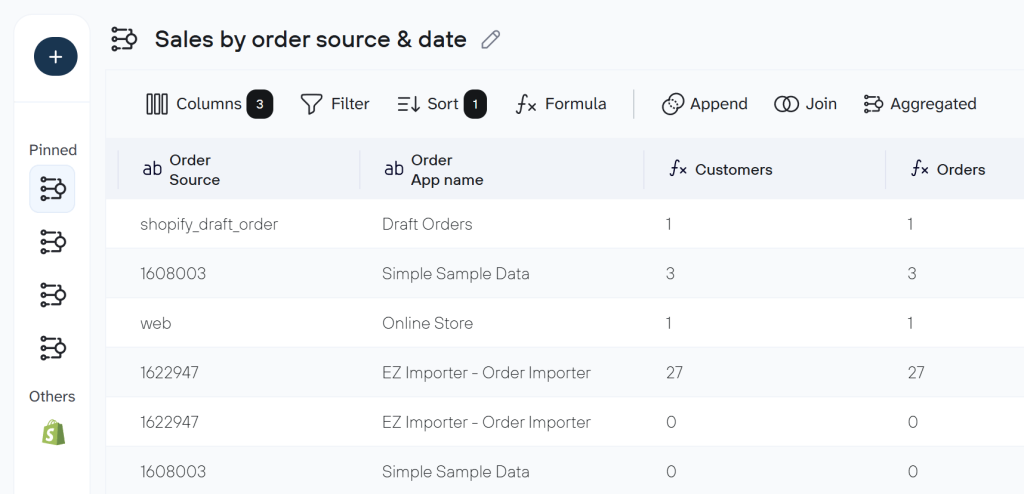
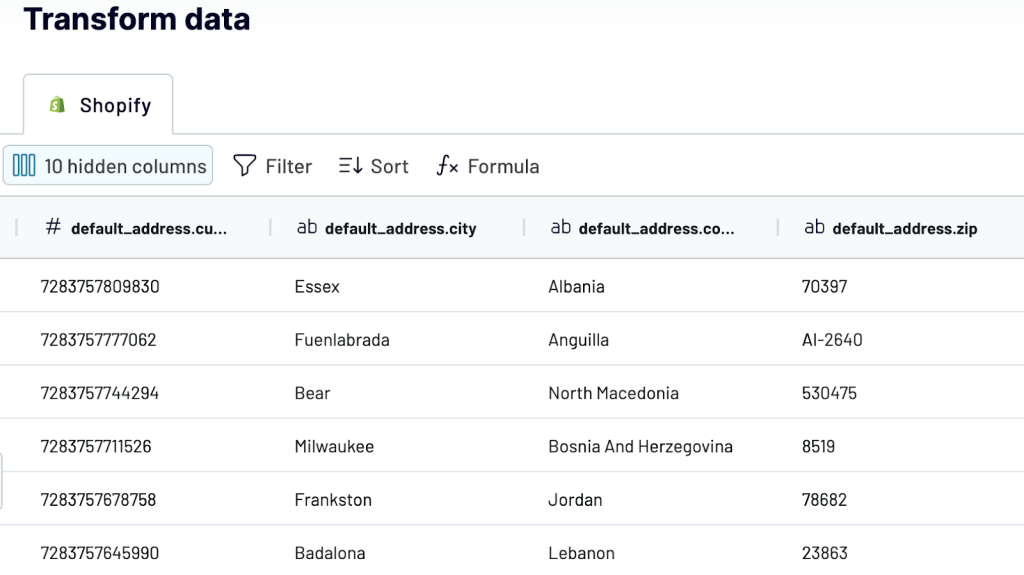
Step 2: Organize your Shopify data (Optionally)
This step is optional, and you can jump right to the destination setup. However, Coupler.io lets you transform the Shopify data before it reaches your destination:
- Hide or remove unwanted columns — drop internal IDs, variant metadata, or less-relevant fields like
admin_graphql_api_idif you’re focusing on sales performance - Rename or rearrange columns — rename
total_priceto Order Total and movecreated_atto the front for better readability - Filter rows or sort the data — filter to show only fulfilled orders, exclude test or draft orders, or sort by total_price descending to see your highest-value orders first
- Aggregate data — count orders per customer to identify your most active buyers, or sum revenue by product to spot top sellers
- Add calculated columns — create Gross Margin = (Net Sales – COGS) / Net Sales, or calculate Days Since Last Order for customer recency analysis
- Combine Shopify data with information from other apps — blend Shopify orders with Google Analytics 4 sessions data to connect website behavior with actual purchases, or join with ad platform spend to calculate true customer acquisition cost
Coupler.io provides over 20 data set templates for Shopify with the essential data transformations preconfigured.
Step 3: Load data to your destination
Choose the destination app if you haven’t done this already and follow the instructions to load your Shopify data to it. Coupler.io supports over 10 destinations for your Shopify data:
- Spreadsheets: Export Shopify to Excel or Shopify to Google Sheets
- BI tools: Looker Studio, Power BI, Tableau, Qlik
- Data warehouses: Set up a Shopify to Google BigQuery integration or load data to Amazon Redshift, PostgreSQL, Snowflake
- AI tools: Claude.ai, ChatGPT, Gemini, Perplexity, Cursor
- Other formats: JSON, CSV
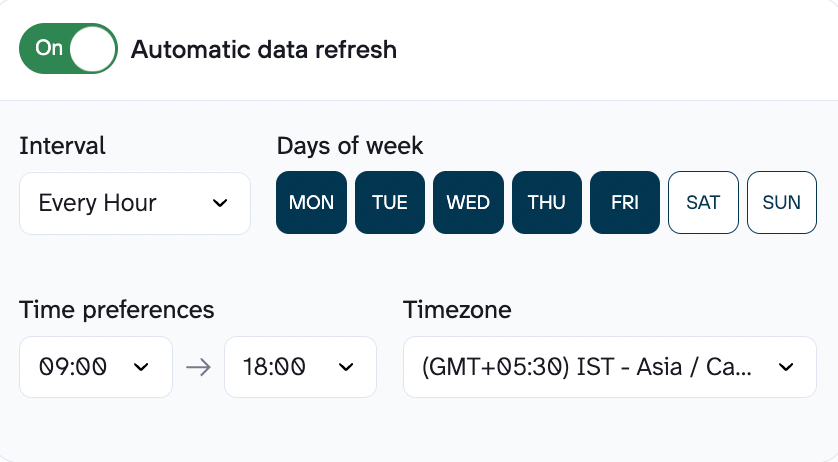
Step 4: Set automated data refresh
Turn on automatic data refresh to keep your Shopify data exports running without manual work. Choose a schedule that fits your needs — hourly, daily, weekly, or custom intervals.
Make sure you click Save and Run. Only then will your automated data export from Shopify be enabled.
Automate Shopify data export with Coupler.io
Get started for freeWhat data can you export from Shopify?
The Shopify connector by Coupler.io lets you export the following data:
Key data entities:
- Orders — all orders from your store, including financial status, fulfillment status, discounts, taxes, and shipping details
- Products — your full product catalog with titles, descriptions, product types, tags, prices, SKUs, and inventory quantities
- Inventory — stock levels and inventory tracking data across your locations
- Customers — customer profiles with contact details, order history, total spend, and tags
Order & product breakdowns:
- Products with Variants — products with individual variant details (size, color, etc.), including pricing and inventory for each variant
- Orders with Line Items — order-level data broken down to individual line items with quantities, prices, and discounts
- Orders with Activities — orders enriched with activity and timeline data
- Order Fulfillments with Line Items — fulfillment records with associated line item details for tracking shipping and delivery
- Orders with Shipping Lines — orders with detailed shipping method and cost information
- Orders Refunds Transactions — refund and transaction records associated with orders
For additional data types like metafields, marketing events, payouts, and others, you can use the Shopify REST API via Coupler.io’s JSON connector. I cover this later in the article.
Get an analysis-ready Shopify report in a few clicks
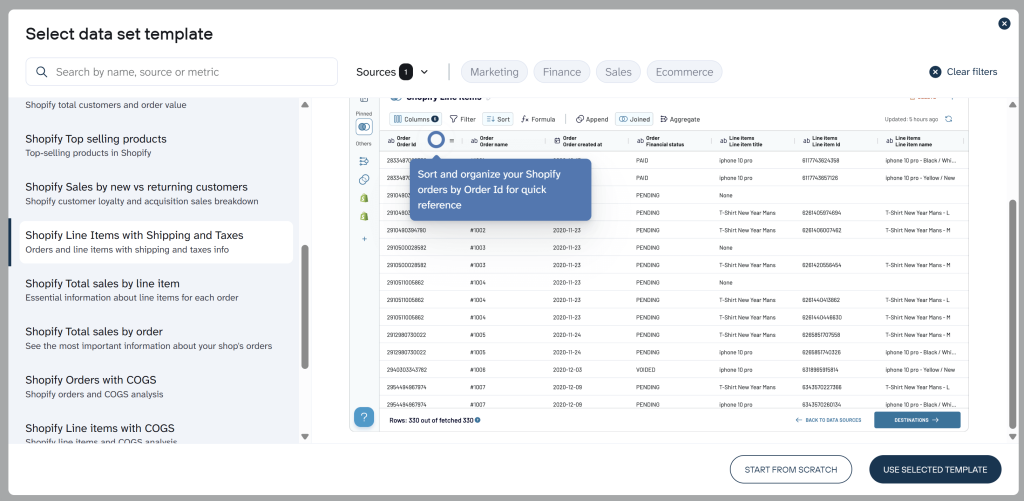
If you don’t want to configure data transformations from scratch, Coupler.io provides pre-built data set templates for Shopify. They come with your Shopify data already structured, combined where relevant (e.g., joining order data with line item details or blending Shopify with GA4), and organized for immediate analysis.
In other words, instead of exporting raw data and then spending time building formulas, aggregations, and calculations, you get a clean report with the right metrics from the start.
Click to expand the groups of Shopify data set templates that are interested to you.
To use a data set template: create a new data flow in Coupler.io and click Start with template. Browse or search the template picker for Shopify templates, then select the one that fits your scenario and click Use selected template.
Blend Shopify data with other information
One of the key advantages of using Coupler.io for Shopify data export is the ability to combine your store data with information from other apps — all within the same data flow. Coupler.io supports over 400 data sources, so the possibilities are broad. Here are a few practical examples:
- Shopify + Google Analytics 4 — connect website behavior (sessions, page views, funnel events) with actual Shopify orders to understand which user journeys lead to purchases
- Shopify + ad platforms (Google Ads, Facebook Ads, TikTok Ads, etc.) — calculate true ROAS and cost per acquisition by matching ad spend with Shopify revenue data
- Shopify + QuickBooks or Xero — reconcile store sales with accounting records for streamlined financial reporting
- Shopify + Shopify — blend data from multiple Shopify stores into one unified report if you operate several storefronts
Several of the data set templates mentioned above (like the Shopify Marketing Funnel and Shopify + GA4 Performance) already handle this multi-source blending for you automatically.
Key challenges for Shopify users and how Coupler.io solves them
❗Challenge 1: Hours wasted on manual CSV exports
Shopify’s built-in CSV export requires you to go to each data section separately, configure the export, wait for the file, and then import it into your reporting tool. For large stores, CSV files are emailed rather than downloaded, adding more delays.
✅ Solution: Set up a fully automated refresh in Coupler.io so Shopify data flows into your destination on autopilot — hourly, daily, or on any custom schedule.
❗Challenge 2: Raw data isn’t analysis-ready
Exported Shopify data comes with dozens of columns, no aggregations, and no calculated metrics. You end up spending more time cleaning data than actually analyzing it.
✅ Solution: Use Coupler.io’s built-in transformations to filter, aggregate, and calculate metrics during export. Or skip the manual setup entirely and use a pre-built data set template with expert-curated metrics like gross margin, returned quantity rate, or cost per order.
❗Challenge 3: No easy way to create cross-channel reports
If you run ads on multiple platforms and sell through Shopify, there’s no native way to see the full funnel — from ad impression to purchase — in one place.
✅ Solution: With Coupler.io, you’ll discover how to automate Shopify reports by combining data from Shopify, GA4, and ad platforms in a single data flow. The Shopify Marketing Funnel data set template does this out of the box.
❗Challenge 4: No built-in analytics intelligence
Shopify’s native analytics are limited, and building custom reports requires significant effort or third-party apps.✅ Solution: Coupler.io’s AI Agent is a conversational assistant that lets you chat with your Shopify data in plain language. Ask questions like “What was my best-selling product last month?” or “Show me the trend in returning customer rate” and get instant answers.
Automate Shopify reporting with Coupler.io
Get started for freeExport Shopify data to dashboard templates
If you want to visualize your Shopify data, select one of the supported BI tools as a destination. Coupler.io lets you connect Shopify to Looker Studio, Power BI, Tableau, and Qlik. After that, you will be able to create your Shopify data analytics visualization from scratch.
But building dashboards from scratch takes time. That’s why Coupler.io offers free ready-to-use dashboard templates that turn your exported Shopify data into actionable reports. Each template comes with a pre-configured Coupler.io connector to automate data refresh, so your dashboards always reflect the latest store activity.
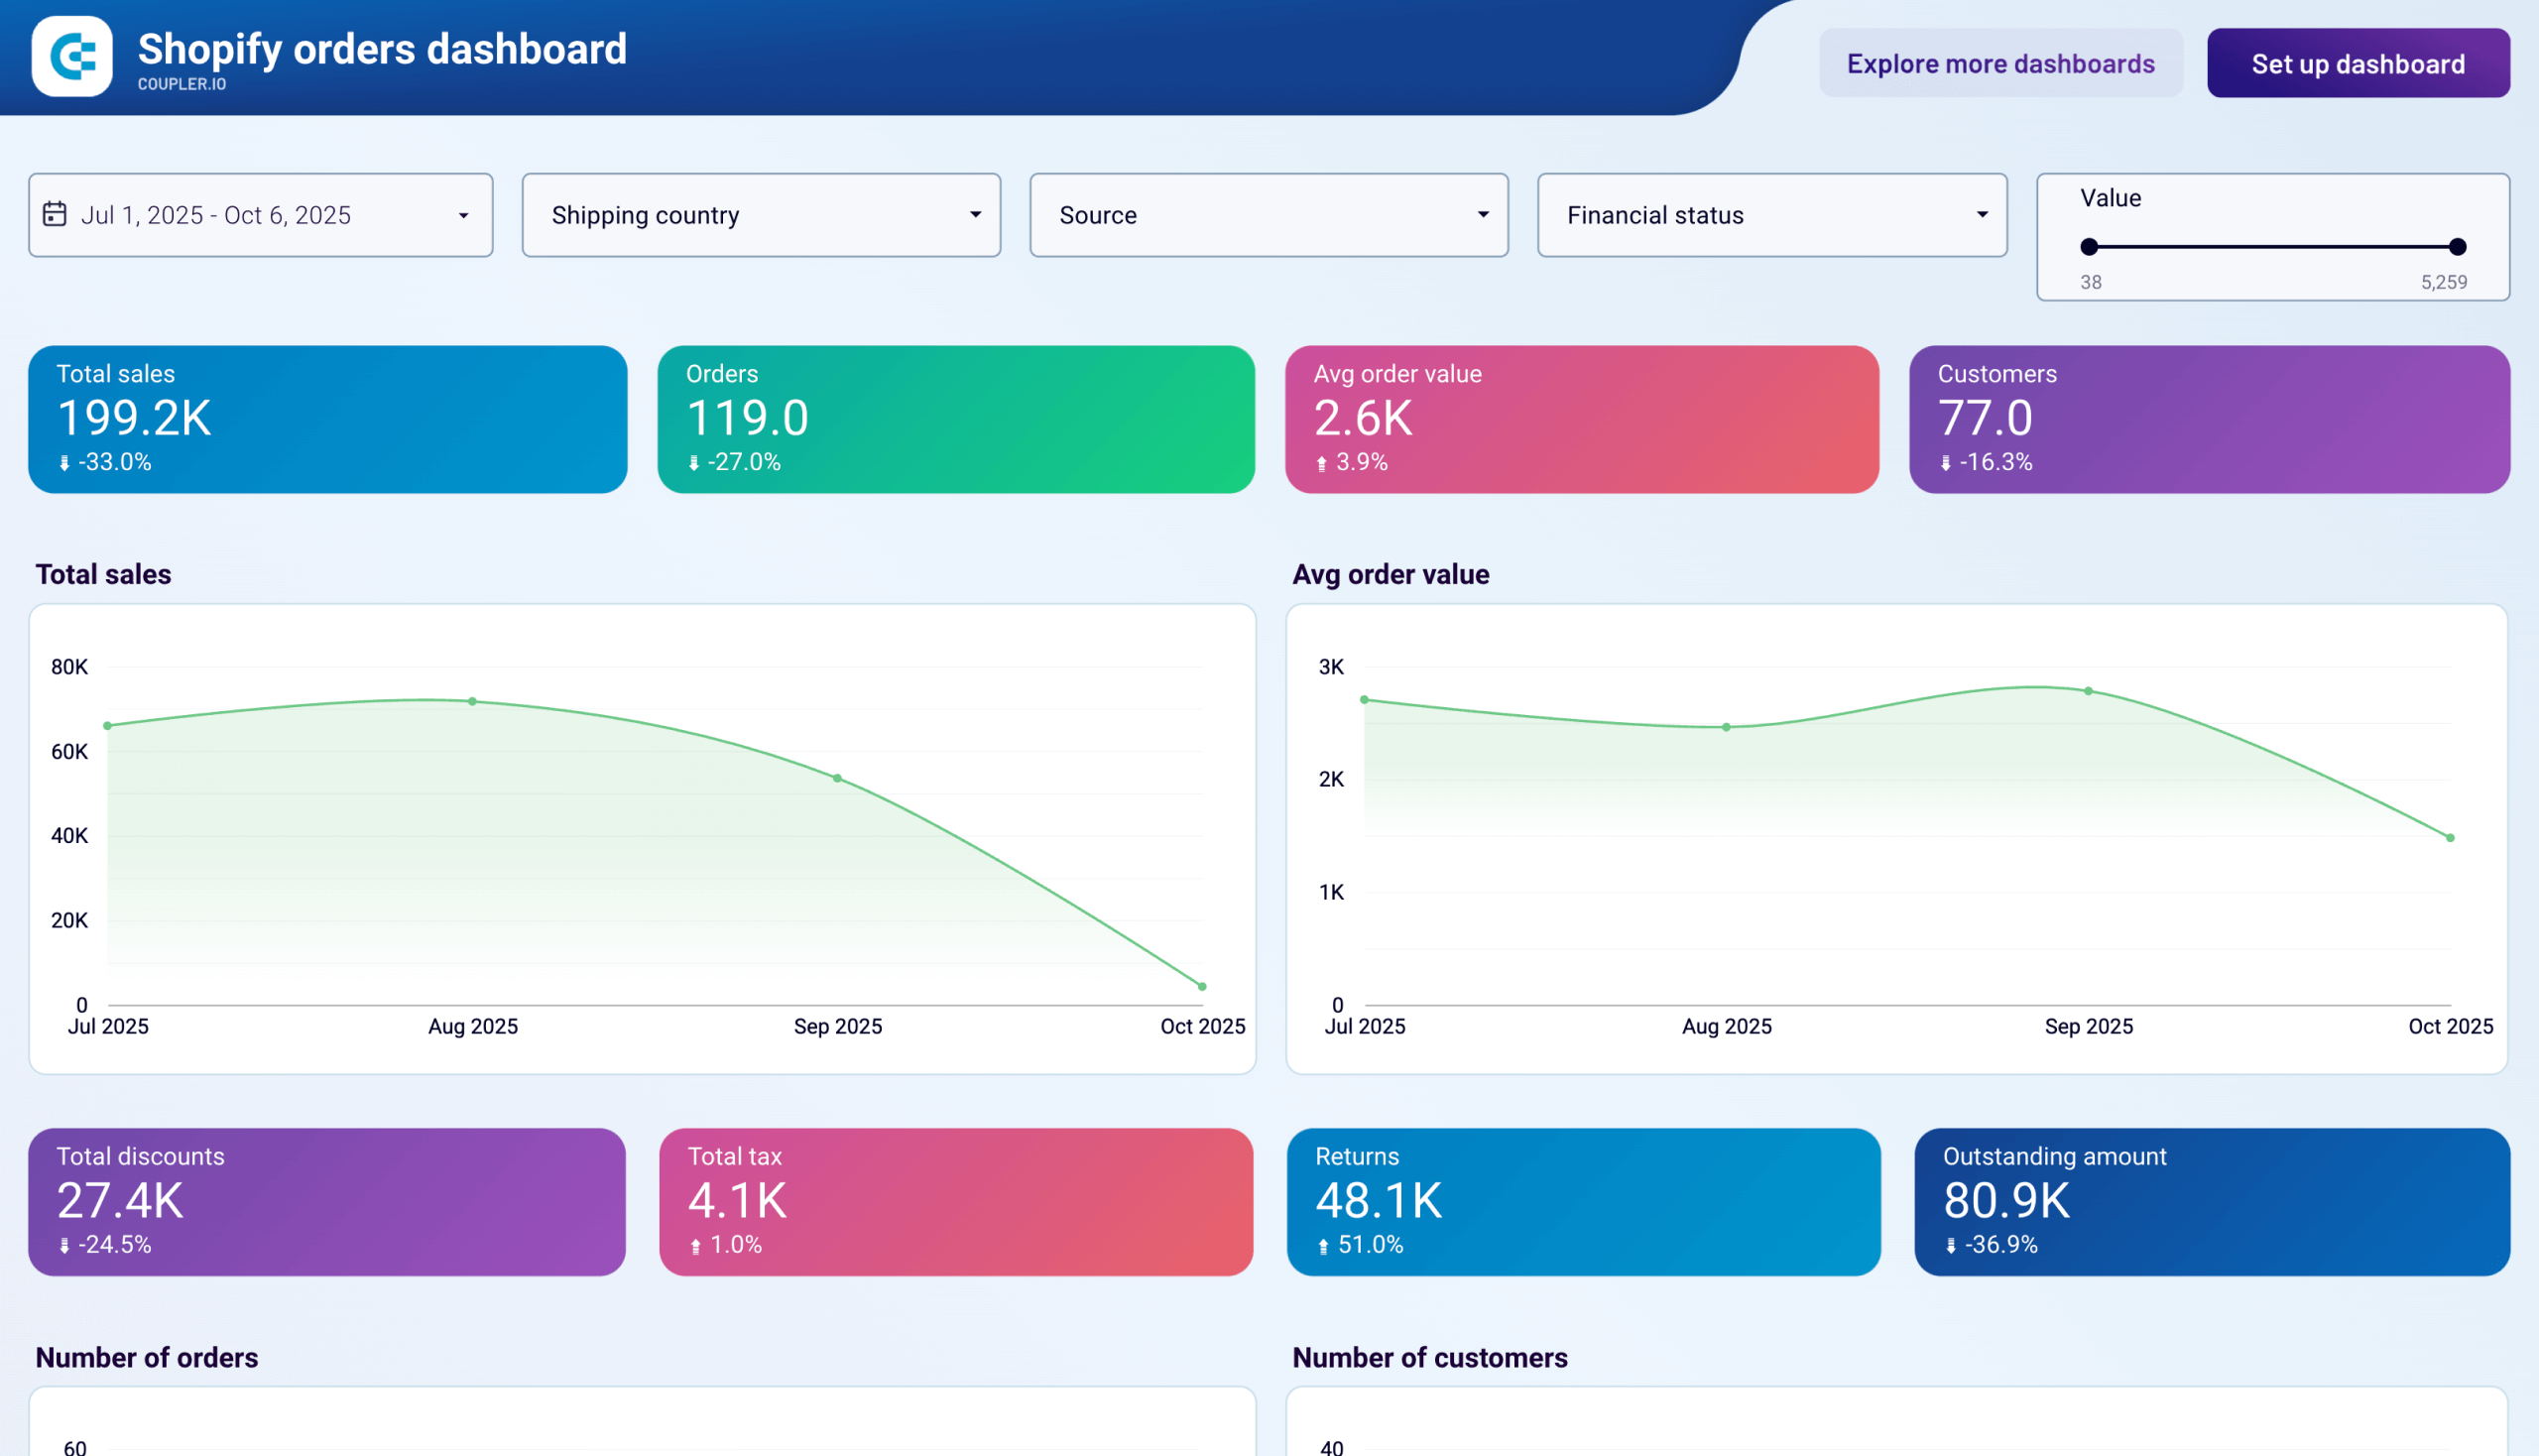
Shopify orders dashboard
The Shopify orders dashboard gives you a detailed breakdown of your store’s order activity — from revenue and fulfillment statuses to geographic distribution and marketing sources. It’s built for store owners who need to track Shopify orders and monitor day-to-day sales performance without jumping between multiple Shopify reports.
What insights you can get:
- New vs. returning customer cohorts. The Cohort analysis page reveals the distribution of sales and orders between new and returning customers, helping you balance acquisition and retention efforts.
- Geographic sales breakdown. Filter orders by shipping country to identify your strongest markets and evaluate whether shipping to low-volume regions is worth the cost.
- Financial status monitoring. Spot pending, refunded, and voided orders to unblock payment issues and find correlations between blocked purchases and specific products or regions.
- Marketing channel performance. Use the Source filter to see which acquisition channels drive the most orders and revenue, so you know where to scale your campaigns.
- Top-selling products analysis. View your best-performing products ranked by order volume and revenue, then apply additional filters to uncover patterns behind their success.
This Shopify dashboard is available as a free template in Coupler.io, Looker Studio, Power BI, and Google Sheets — each equipped with an automated Shopify connector.

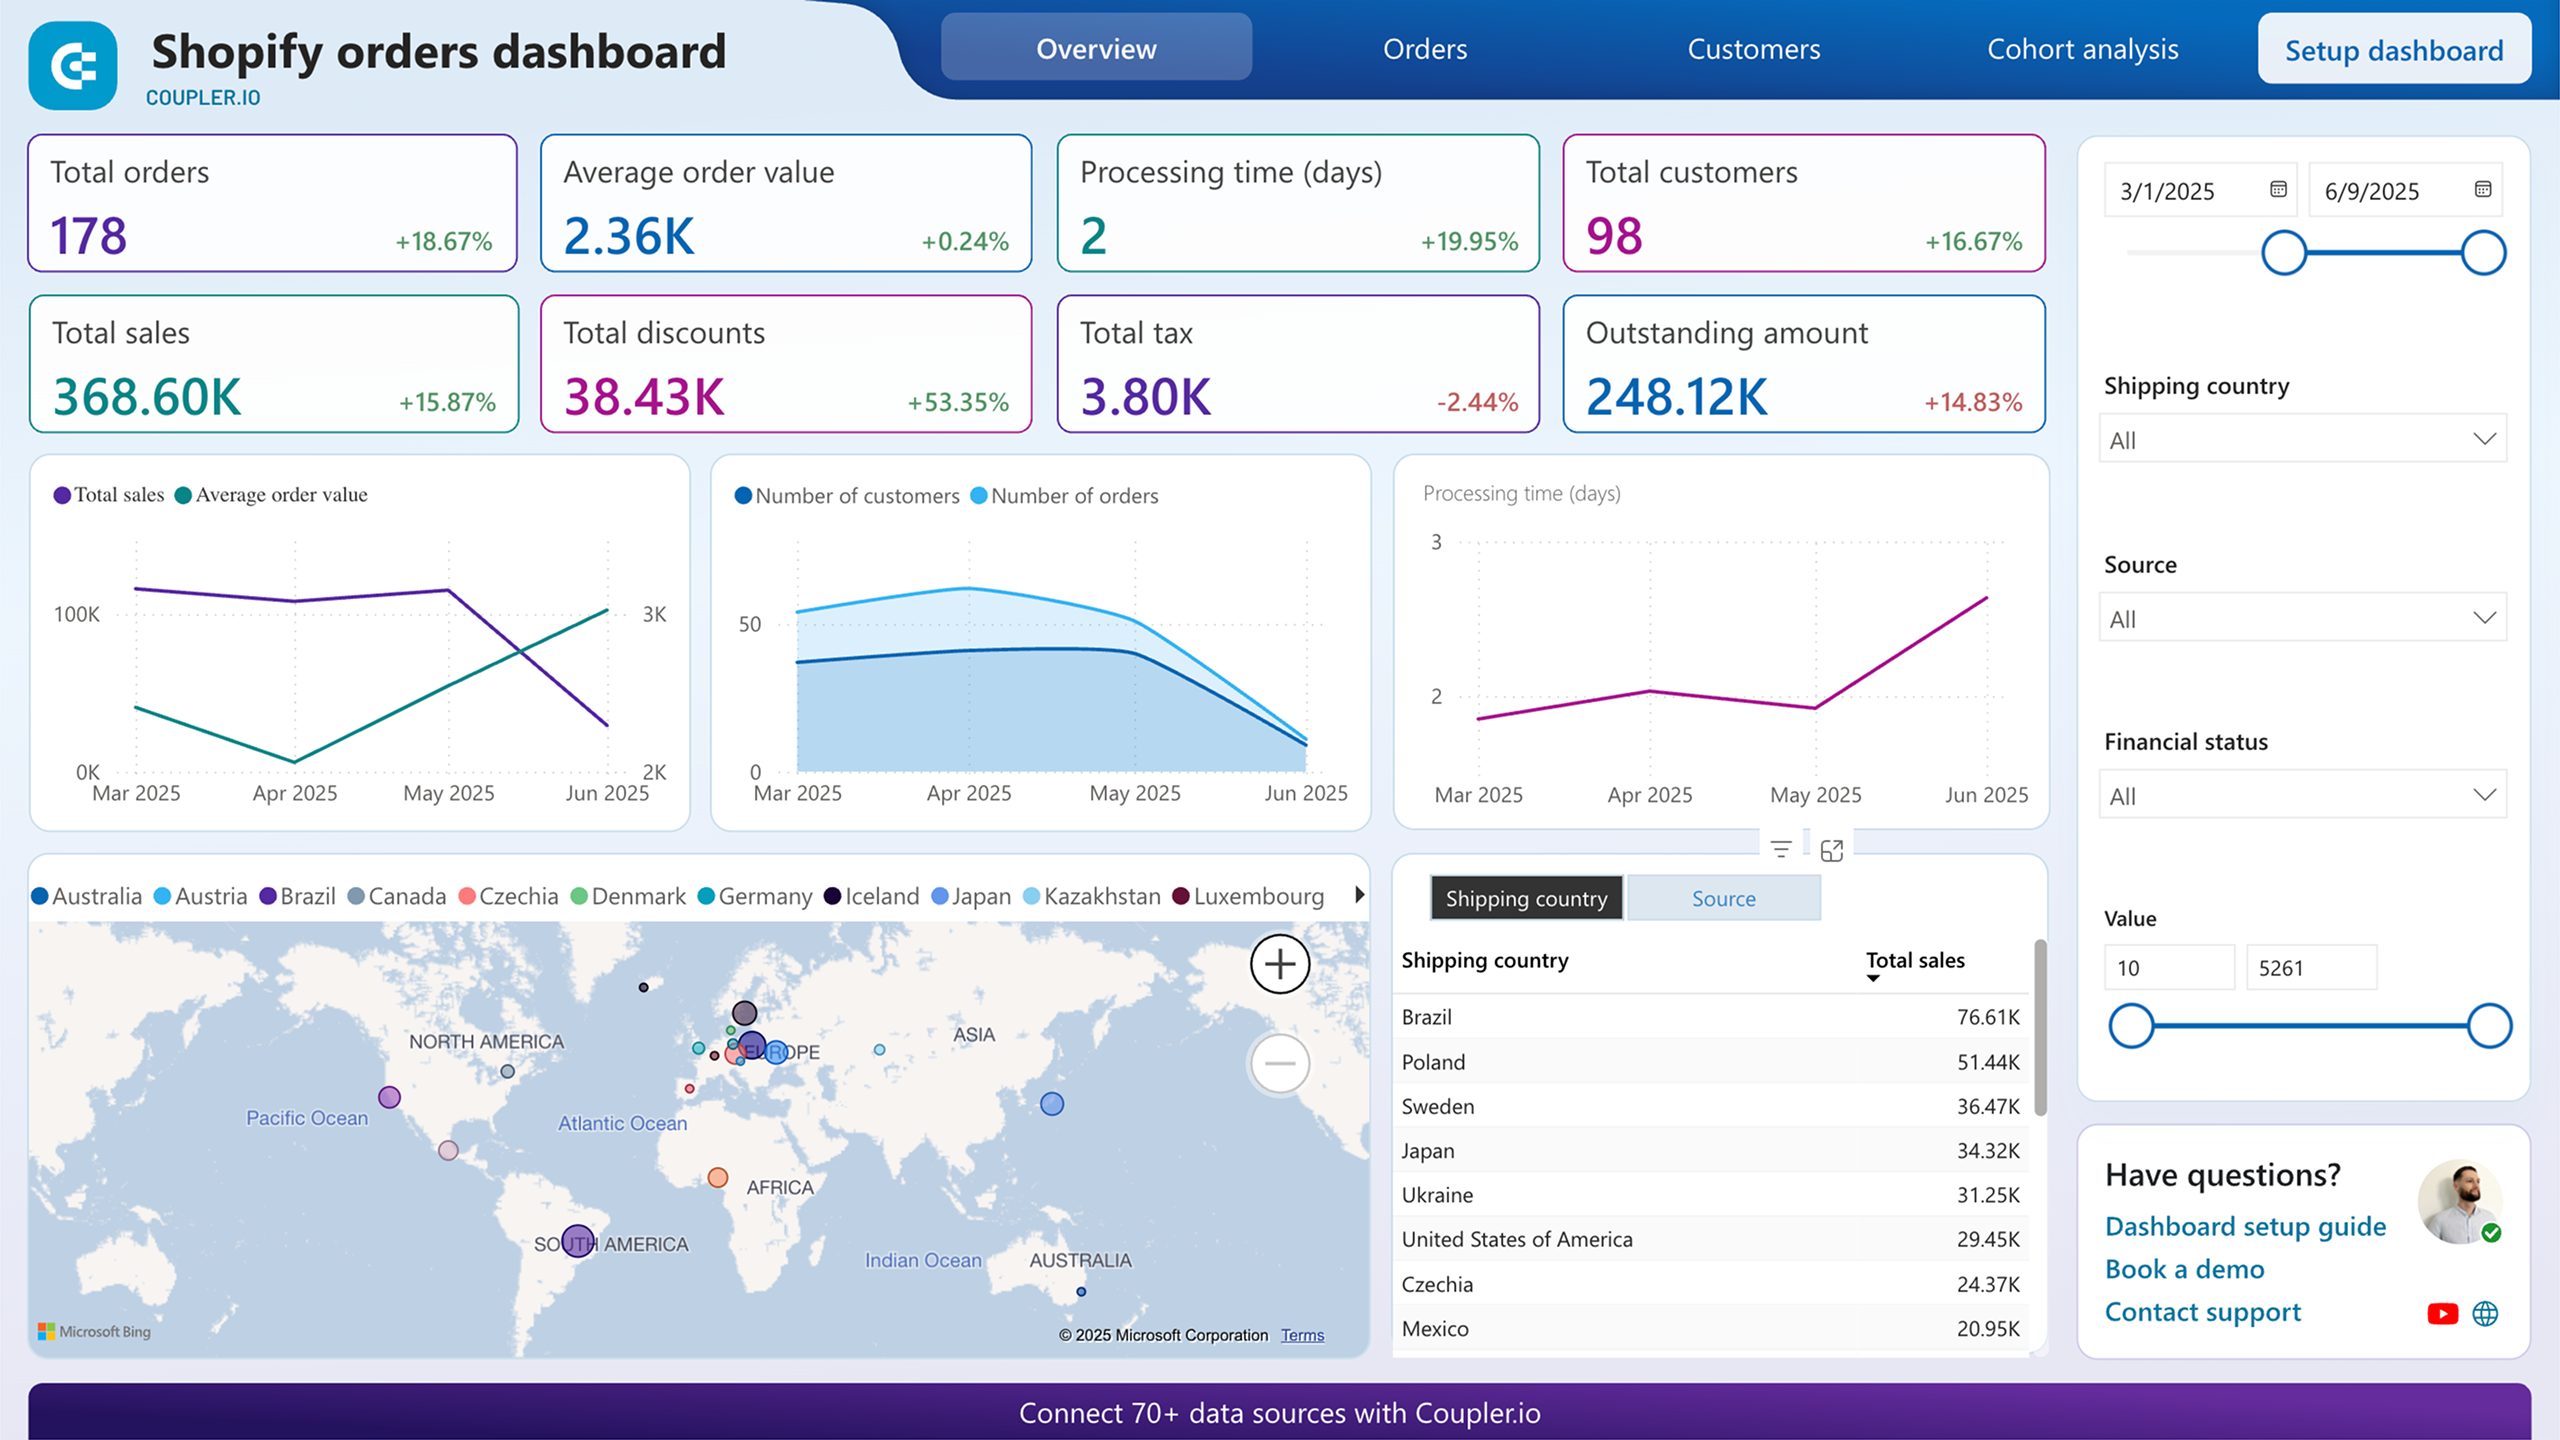
Shopify orders dashboard in Coupler.io
Monitor your e-commerce order flow with comprehensive insights into sales patterns, customer behavior, and fulfillment metrics.


Shopify orders dashboard in Looker Studio
Access the performance of your Shopify ecommerce store and uncover critical insights into how to manage your orders effectively.

Shopify orders dashboard in Power BI
Track order volumes, payment statuses, and shipping performance with detailed visualizations of your Shopify store’s transaction data.

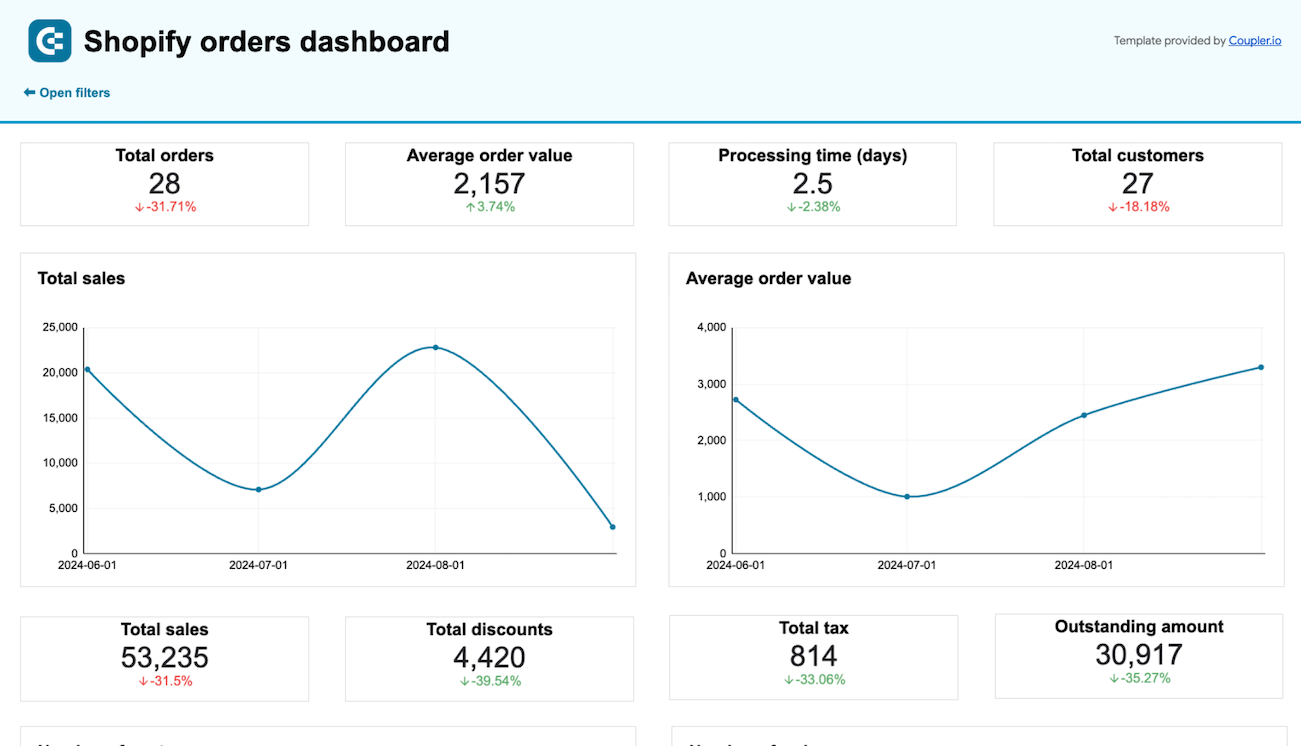
Shopify orders dashboard in Google Sheets
Monitor your Shopify store’s orders to efficiently manage sales, shipping, inventory, and identify customer trends.

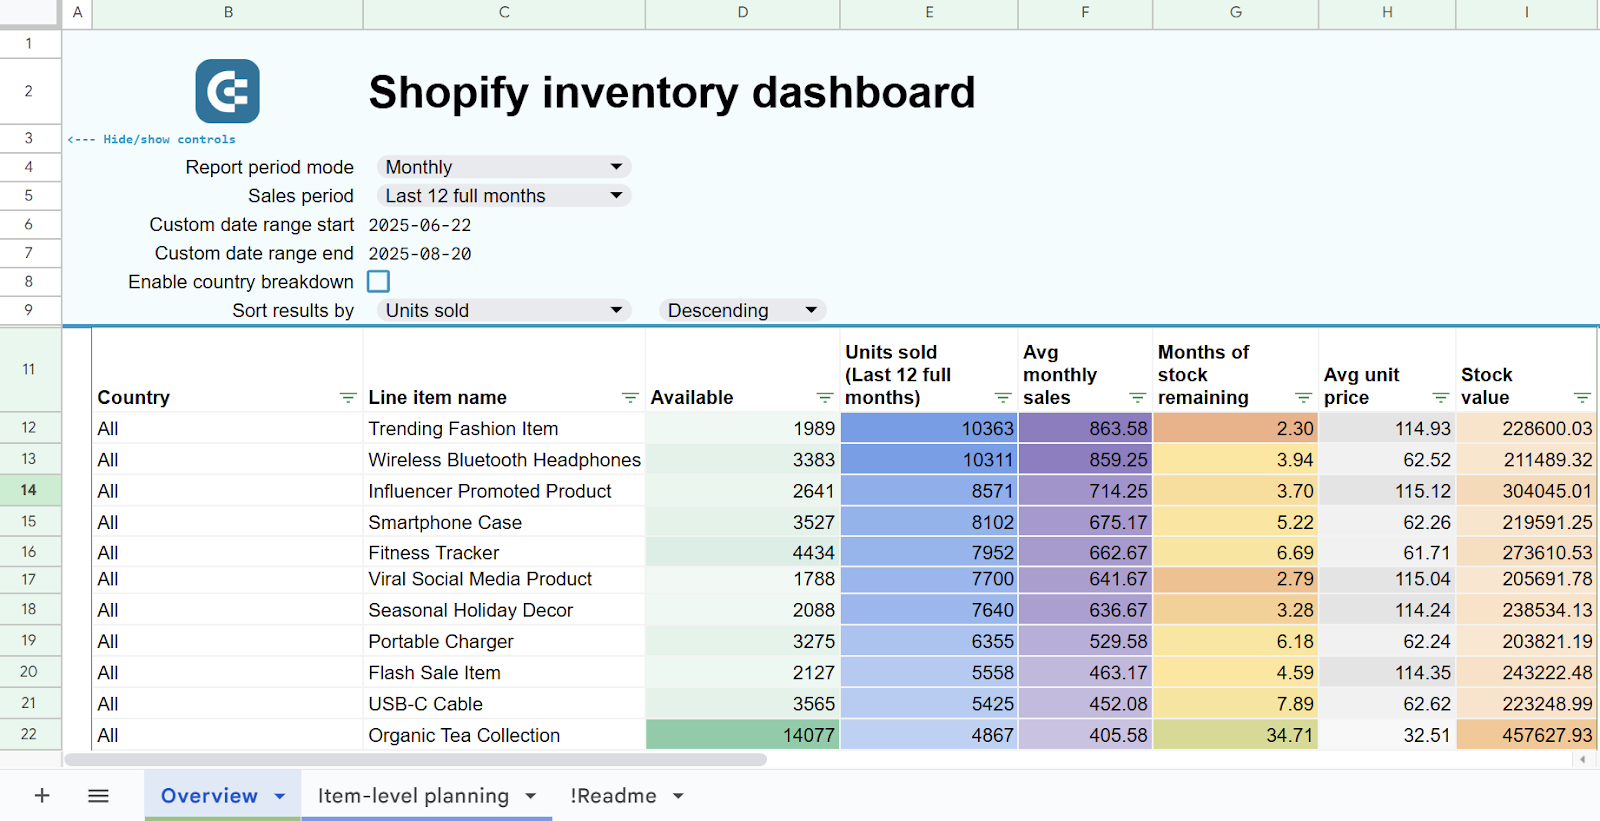
Inventory dashboard for Shopify
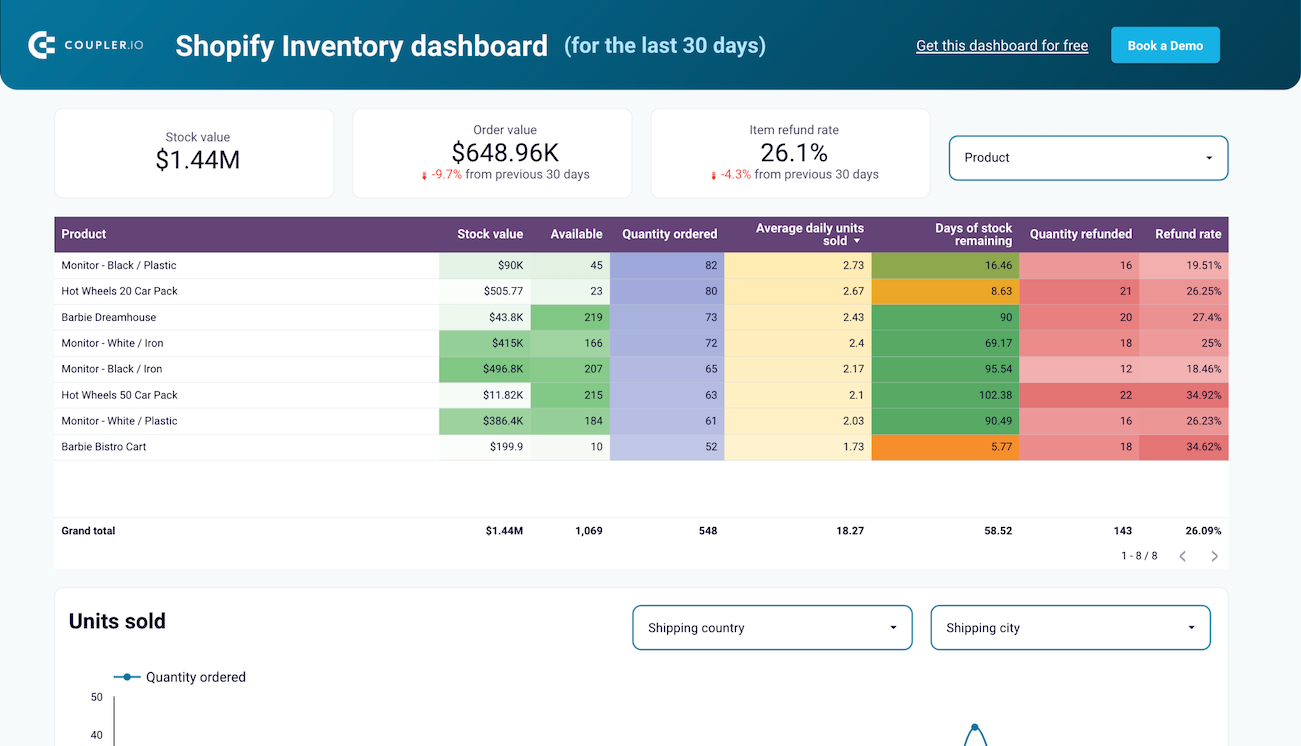
The Shopify inventory dashboard provides visibility into product stock levels, order patterns, and return rates across all your store locations. A standout feature is the SKU-level inventory report with a “Days of stock remaining” calculation — something not available in the native Shopify interface — so you can predict shortages and plan procurement before they happen.
Inventory dashboard template for Shopify
 Preview template
Inventory dashboard template for Shopify
Preview templateWhat insights you can get:
- SKU-level inventory tracking. See stock value, availability, order volumes, and daily turnover rates for every product in one organized table — data you can’t get from Shopify’s built-in reports.
- Stockout prediction. The “Days of stock remaining” column calculates how quickly each product is selling, letting you plan reorders and manage cash flow by avoiding both shortages and overstock.
- Geographic refund analysis. Identify which countries have the highest return rates, then decide whether to limit sales in problematic regions, investigate root causes, or evaluate return shipping costs.
- Daily sales pattern monitoring. Track order volumes over time with an interactive timeline chart to spot seasonality, evaluate promotion effectiveness, and flag declining trends that may need attention.
- Multi-location stock distribution. Compare inventory levels across all warehouse locations to identify imbalances — especially useful if you maintain stock in multiple countries — and optimize fulfillment efficiency.
It is one of the best Shopify Looker Studio templates. At the same time, there is a dashboard version for Google Sheets. Each is equipped with the Coupler.io connector that automates data load from Shopify.
Inventory dashboard template for Shopify in Google Sheets
Prevent stockouts and optimize reorder timing with predictive inventory analytics for your Shopify store. Track stock levels, calculate stockout probabilities, get automated reorder recommendations, and analyze sales patterns by location to maintain optimal inventory across all products.
Inventory dashboard template for Shopify in Looker Studio
Monitor real-time stock levels across all products with helpful charts and breakdowns to prevent stockouts and optimize reordering processes.
Shopify sales funnel dashboard
The Shopify sales funnel dashboard visualizes your store’s conversion process using Google Analytics 4 data. It maps the customer journey from initial page views through add-to-cart, checkout, and completed purchases across four interconnected reports: Traffic Overview, Sales Funnel by Item, Sales Funnel by Country, and Sales Funnel by Channel.

What insights you can get:
- Step-by-step funnel visualization. See exactly how many visitors progress through each conversion stage — page views, add to cart, checkout initiation, payment info, and purchase — with conversion rates between steps, so you can pinpoint where customers drop off.
- Channel-specific conversion paths. Break down funnel performance by traffic source and medium to identify which channels drive traffic that actually converts to revenue, and which bring volume without purchases.
- Geographic conversion intelligence. An interactive map with country-level funnel metrics lets you compare conversion rates across regions, identify high-traffic countries with low purchase rates, and tailor your international strategy accordingly.
- Product-level funnel performance. The Sales Funnel by Item report shows how individual products perform at each stage — revealing which items attract interest but suffer from high abandonment and which consistently convert.
- Revenue driver identification. Combine channel, geographic, and product data to understand which combinations of traffic source, market, and product produce the highest returns.
This dashboard is available as a free template in Looker Studio with an automated GA4 connector by Coupler.io.
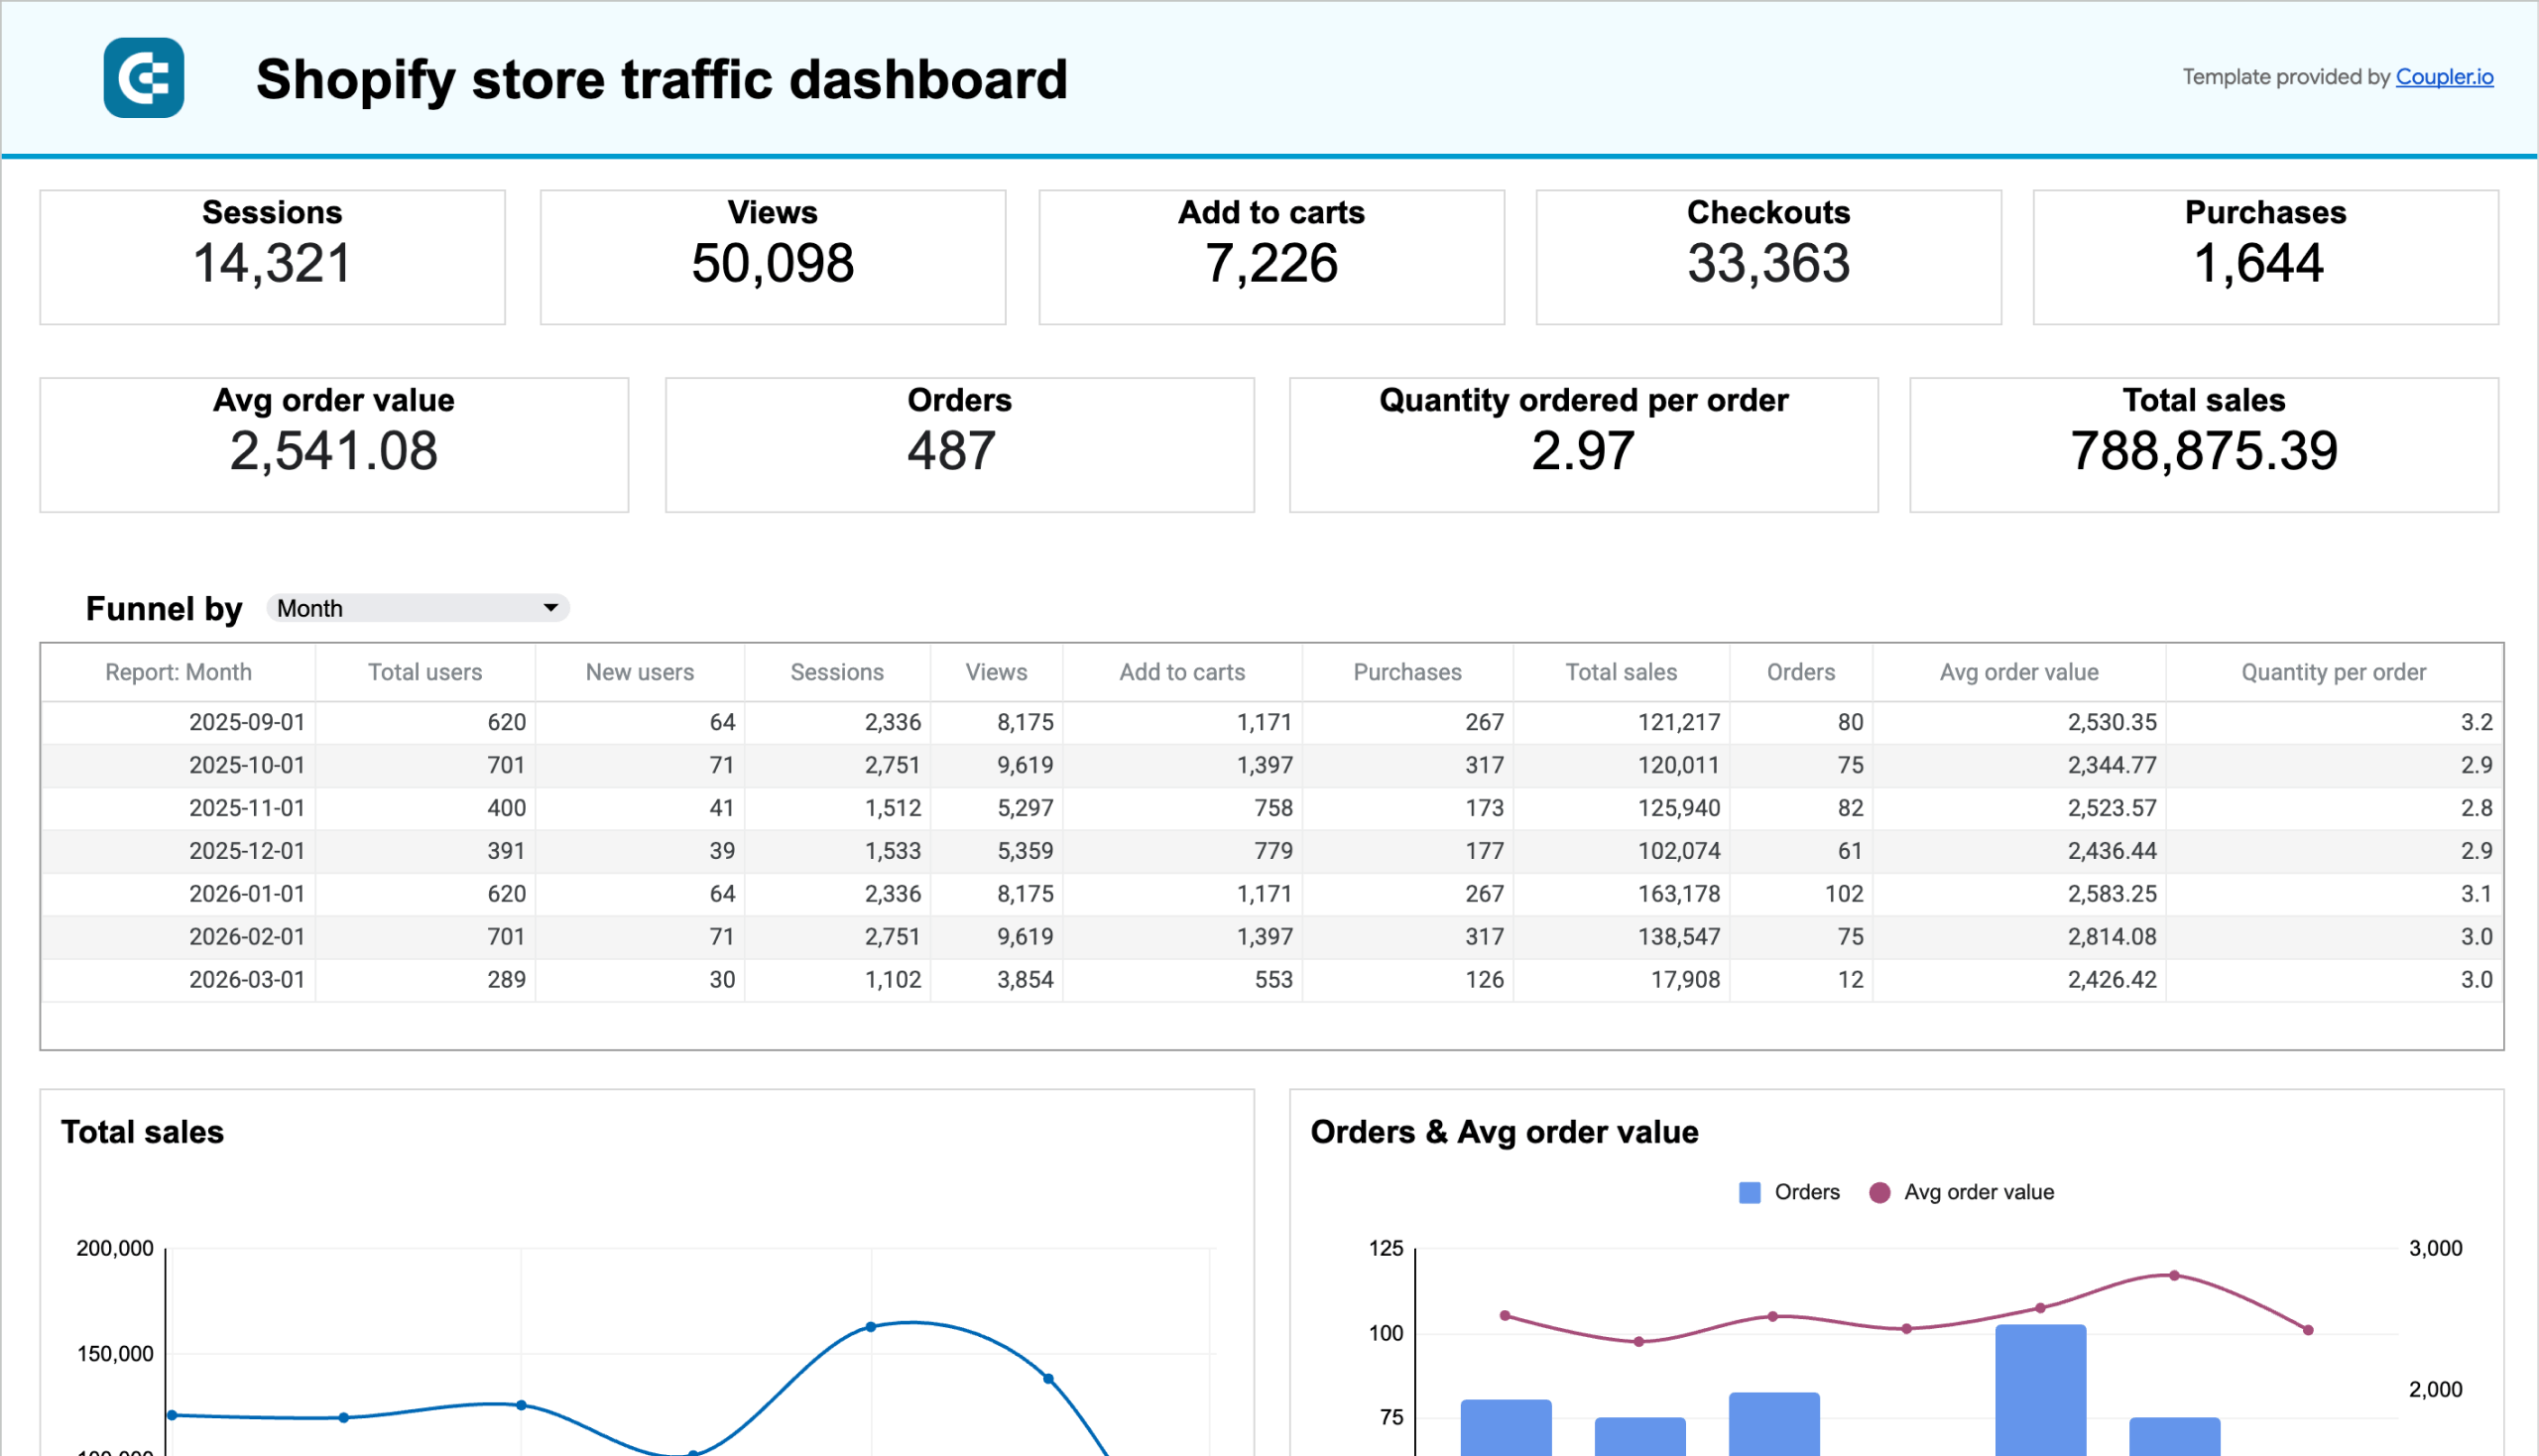
Shopify store traffic overview dashboard
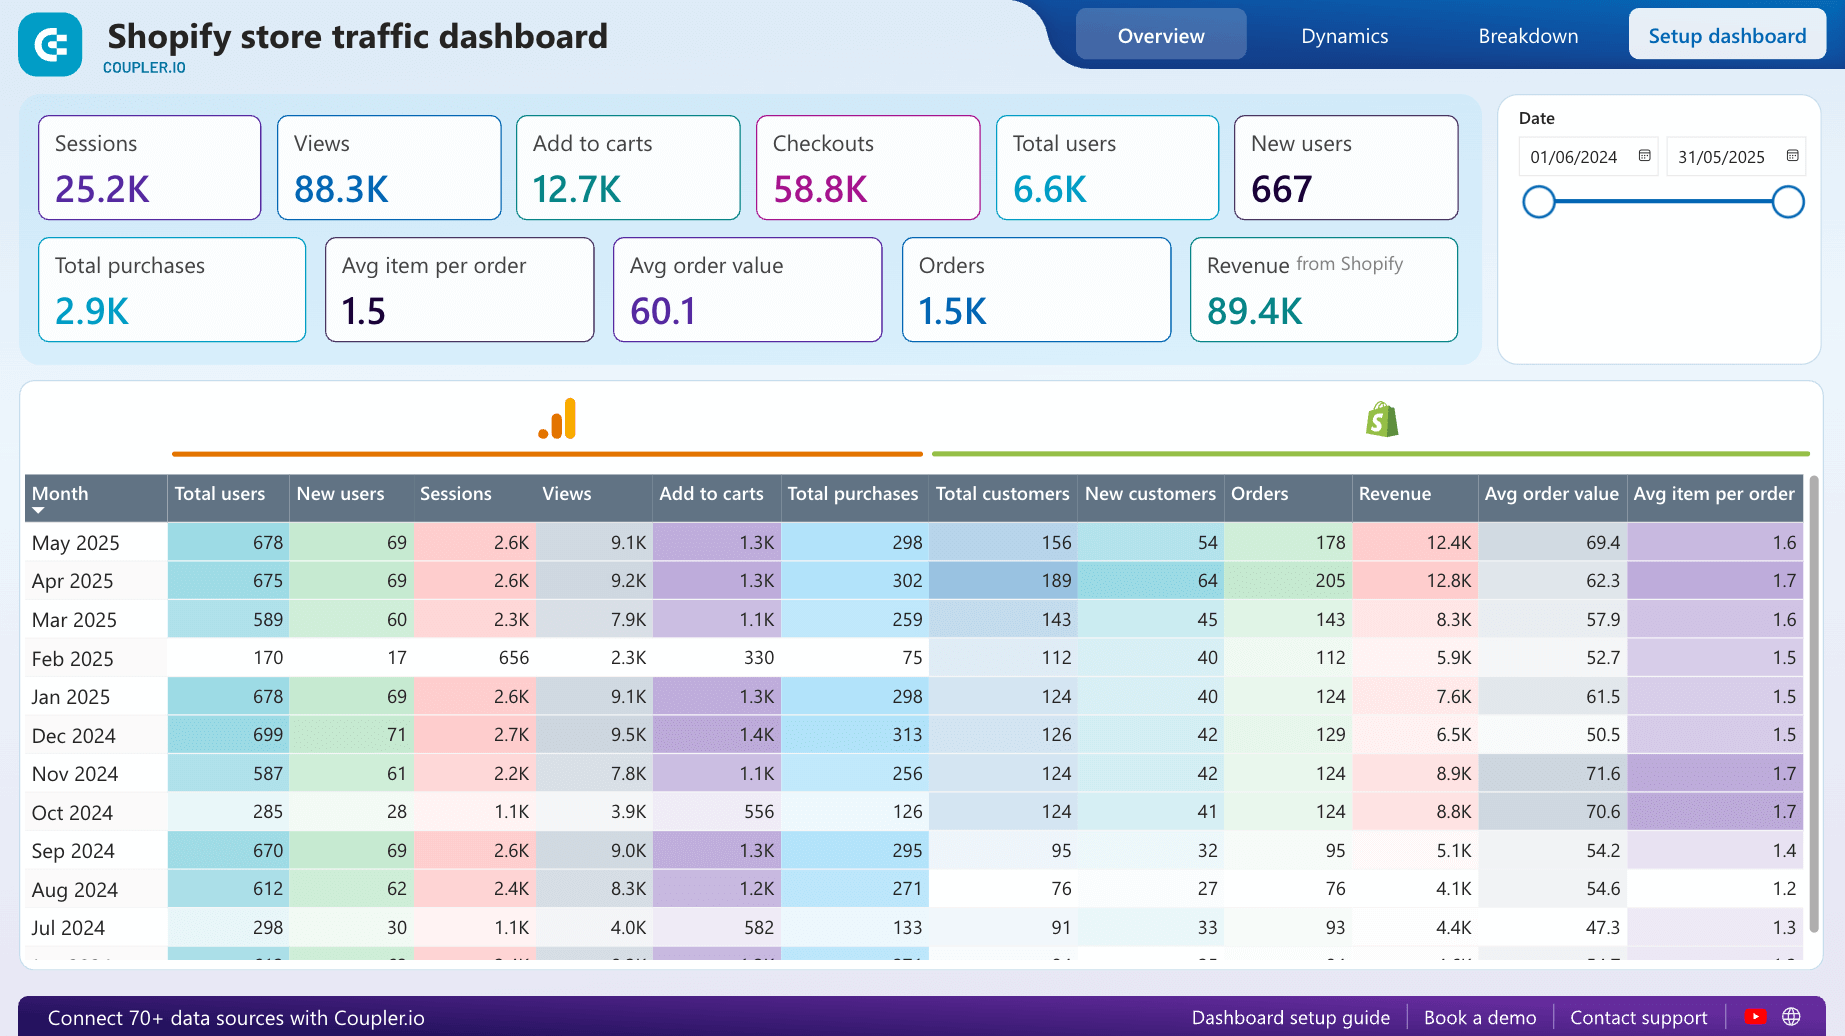
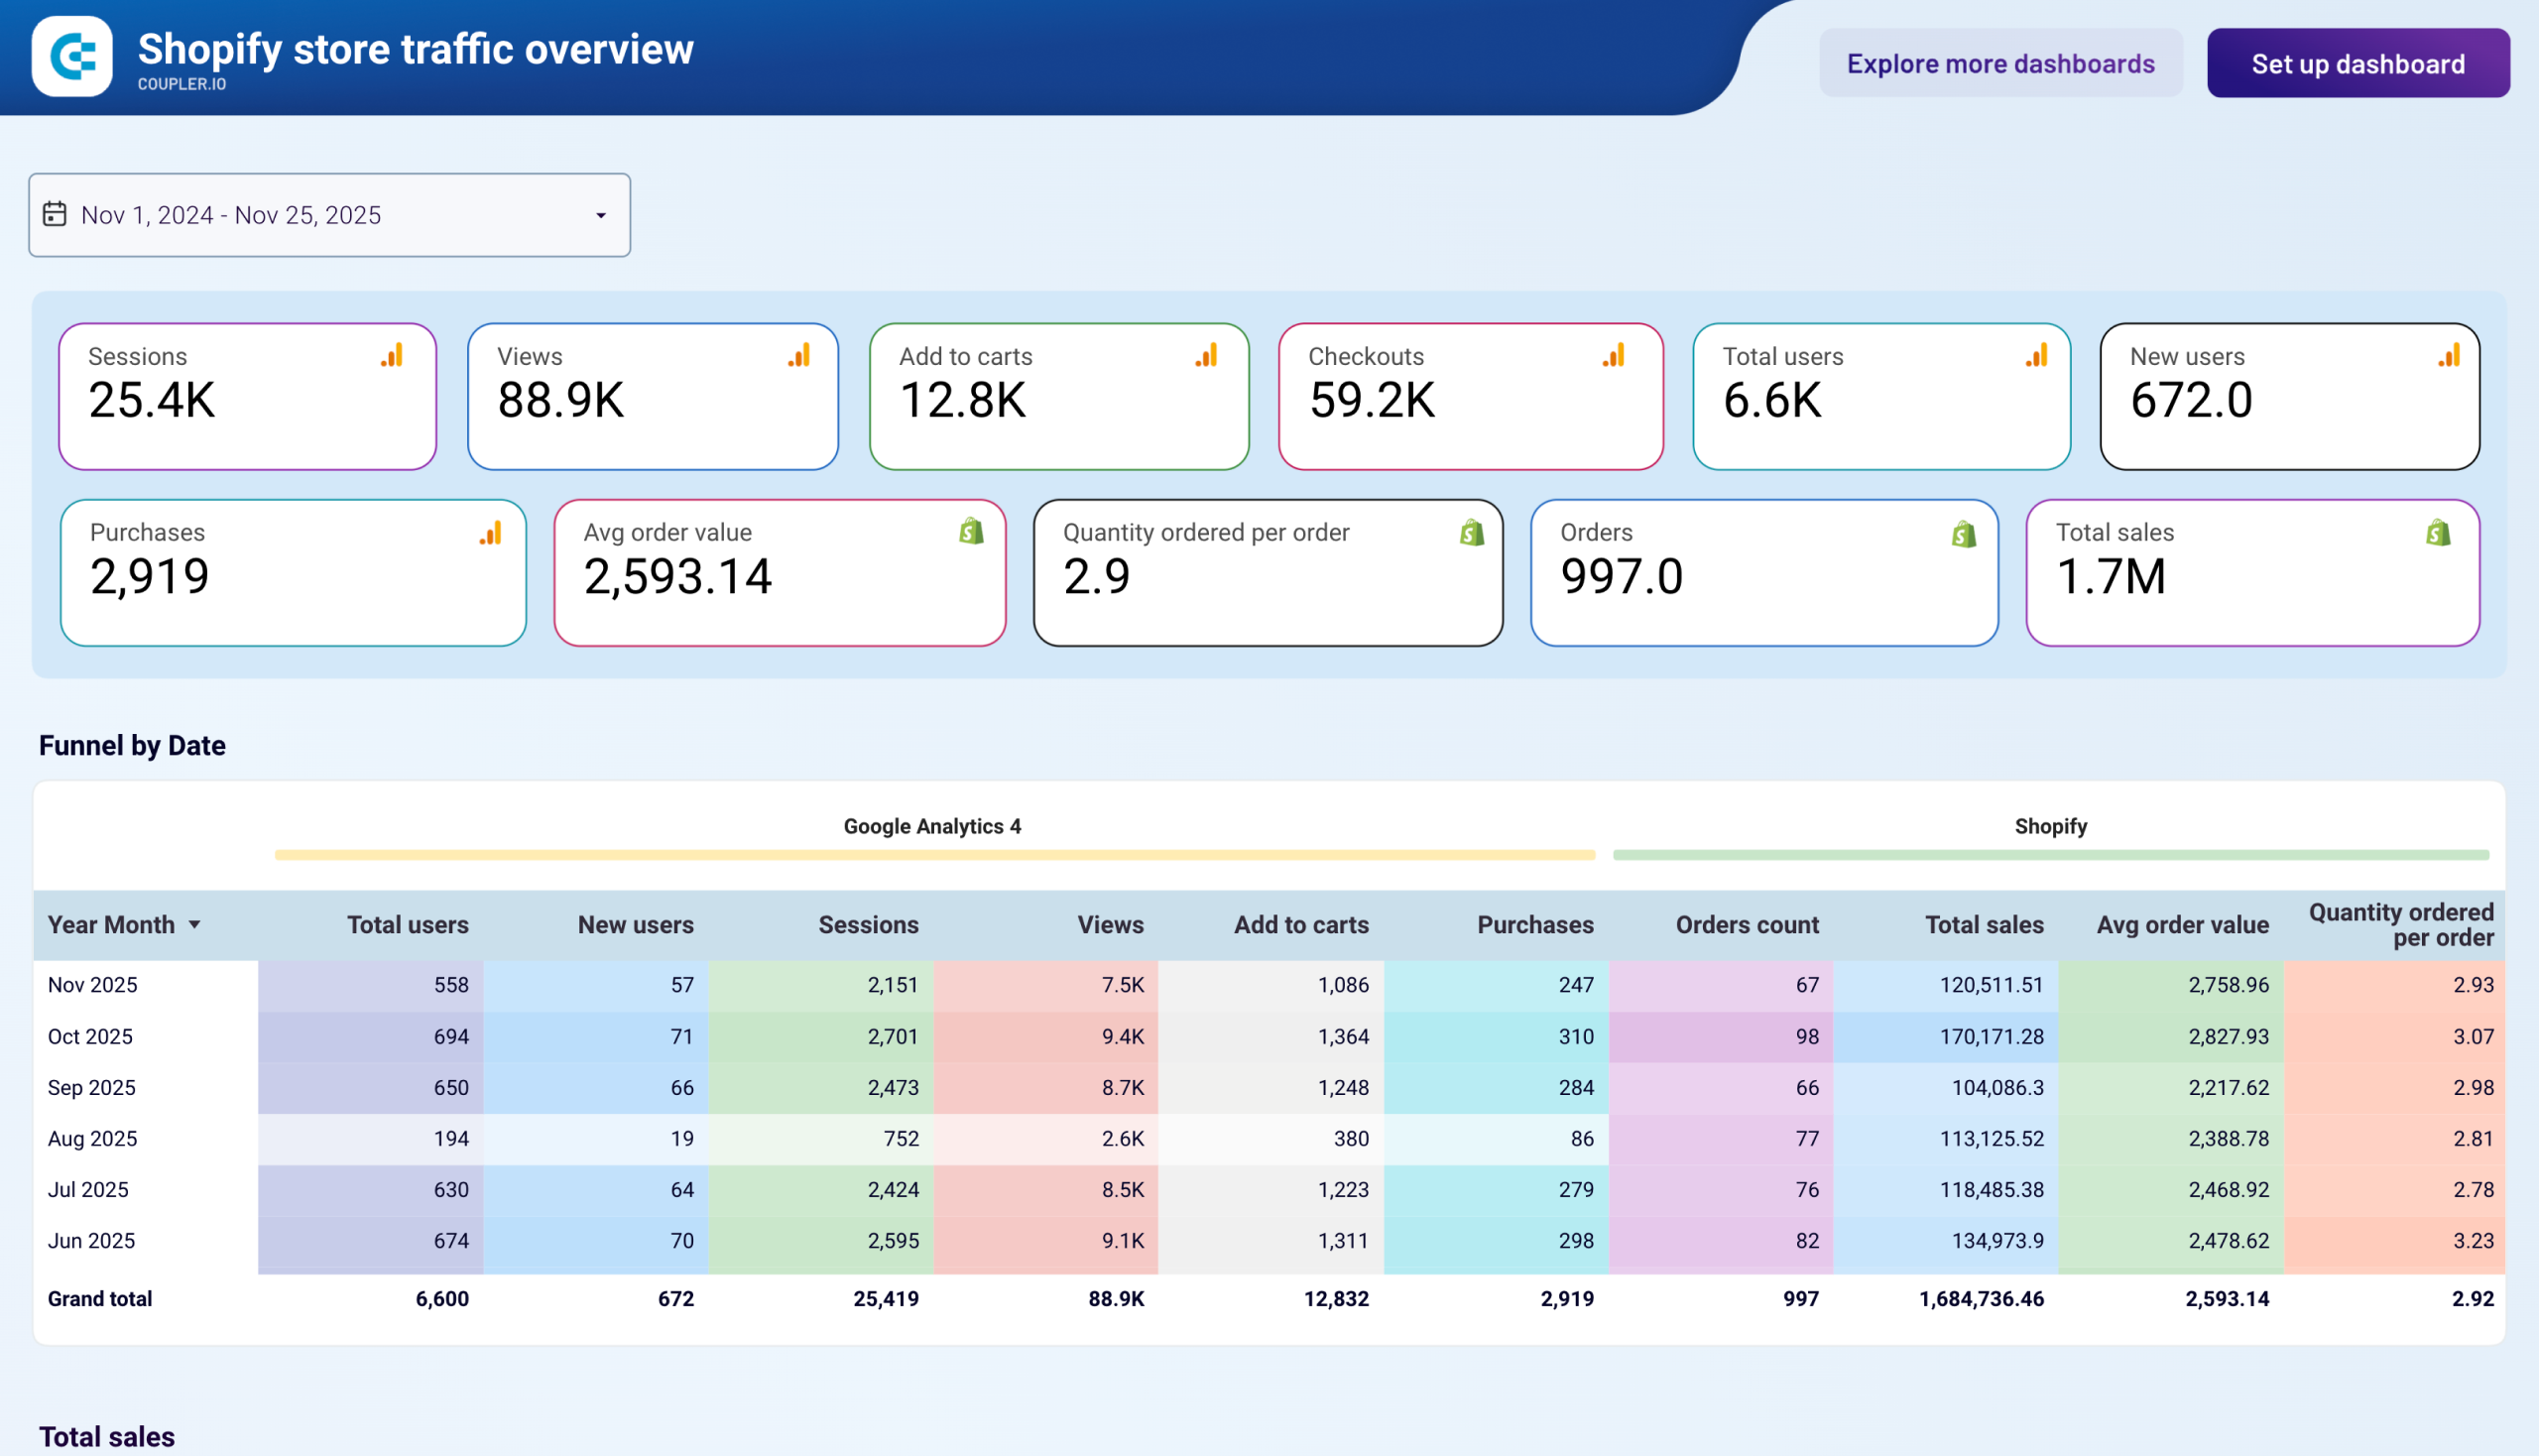
The Shopify store traffic overview dashboard merges Google Analytics 4 behavioral data with Shopify sales data on a single screen. It answers a fundamental question for store owners: how does website traffic translate into actual purchases? From session counts and user engagement to revenue trends and top-selling products, this dashboard connects the dots between visitor activity and business results.
What insights you can get:
- Unified KPI tracking. Monitor GA4 and Shopify metrics side by side — sessions, views, add-to-carts, checkouts, total users, new users, purchases, revenue, and average order value — all updated automatically.
- Sales funnel progression by date. A detailed funnel table shows how visitors move from arriving at your store to completing a purchase over time, helping you identify which days or periods see the steepest drop-offs.
- Traffic source effectiveness. A breakdown by channel (organic search, paid ads, social media, referrals) reveals where your highest-value customers come from, so you can reallocate budgets to the best-performing sources.
- Top products and vendors ranking. Visual charts rank your best sellers by order volume and highlight top-performing vendors, giving you data to optimize inventory and refine product recommendations.
- Geographic revenue heatmap. Filter countries by revenue and order count using a geo heatmap to identify your strongest markets and uncover localization or shipping optimization opportunities.
This dashboard is available in Coupler.io and as a free template in Google Sheets, Looker Studio, and Power BI with automated GA4 and Shopify connectors by Coupler.io.
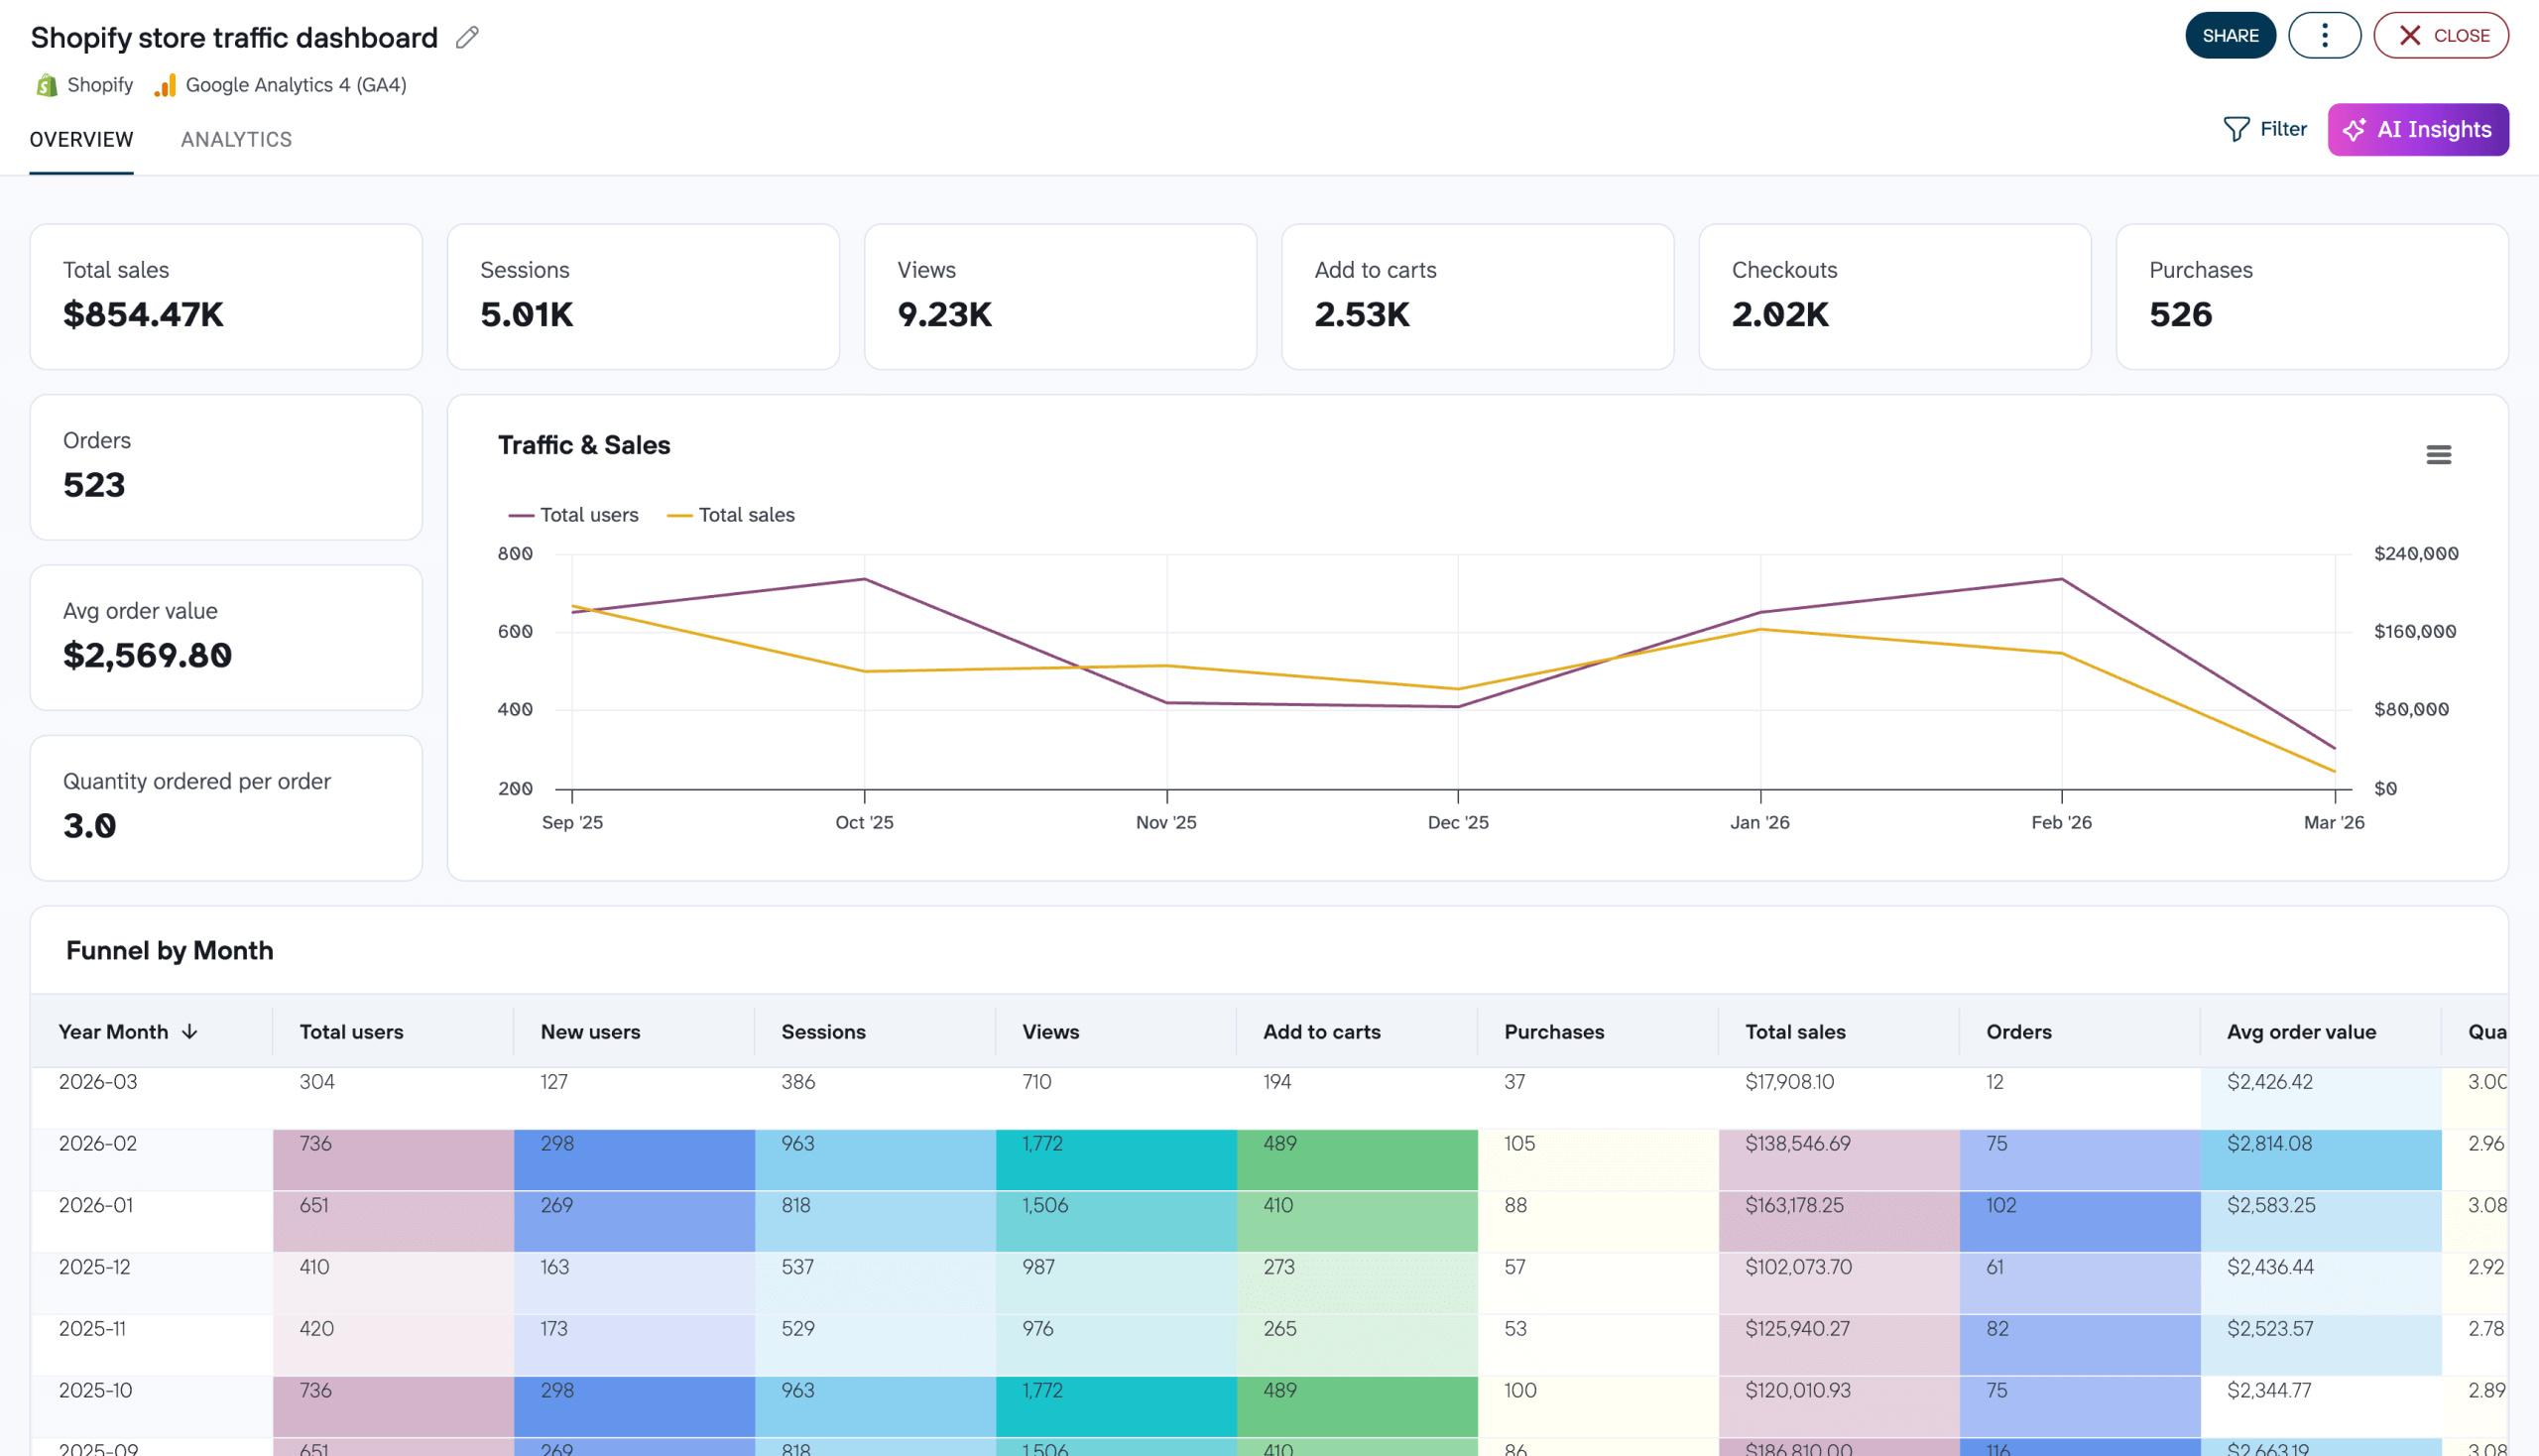
Shopify store traffic dashboard in Coupler.io
Connect Shopify and Google Analytics 4 to track your store’s full traffic-to-purchase funnel. Analyze visitor trends, conversion rates, top-selling products, geographic performance, and traffic sources to understand what drives sales and where drop-offs occur.

Shopify store traffic dashboard in Power BI
Analyze traffic and purchasing metrics for your Shopify store with this dashboard that consolidates performance data from Google Analytics 4 and Shopify.
Shopify store traffic dashboard in Looker Studio
Track your Shopify store’s customer journey from visit to purchase with this dashboard that combines data from Google Analytics 4 and Shopify.
Shopify store traffic dashboard in Google Sheets
Combine Shopify order data with Google Analytics 4 traffic insights to measure your store’s performance end-to-end. Track visitor acquisition, purchase trends, average order value, top products, supplier performance, and geographic sales distribution month over month.
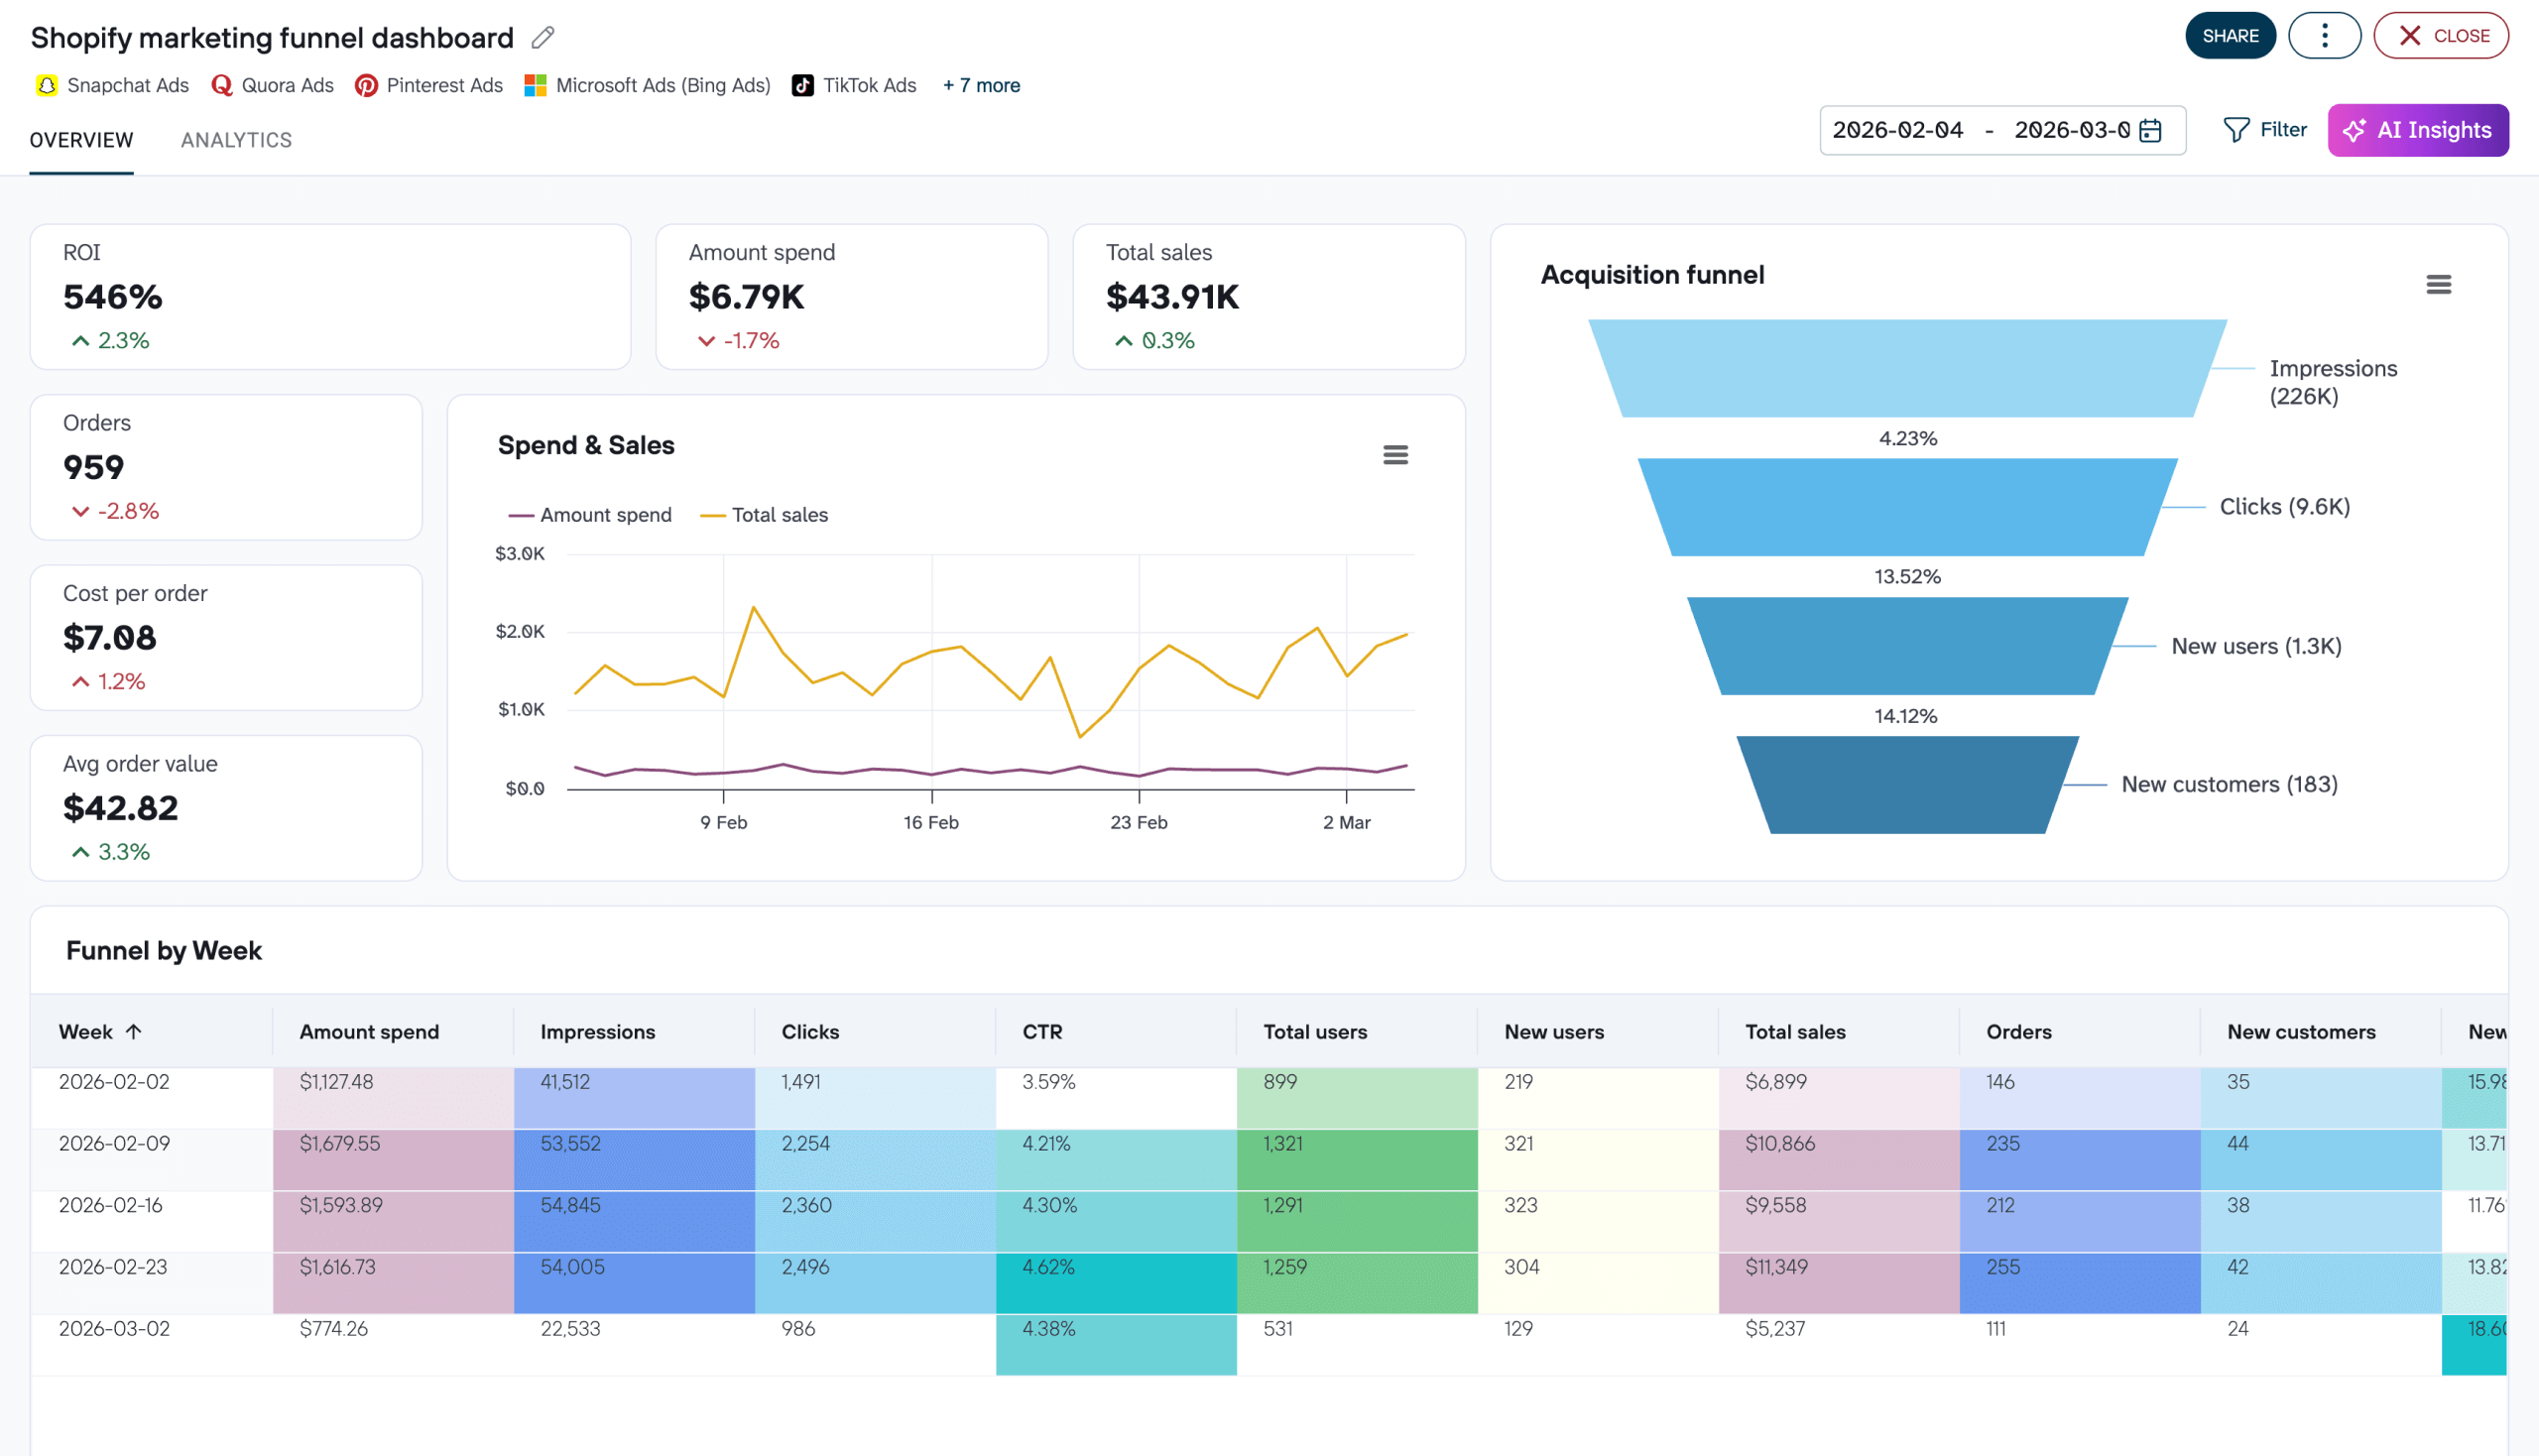
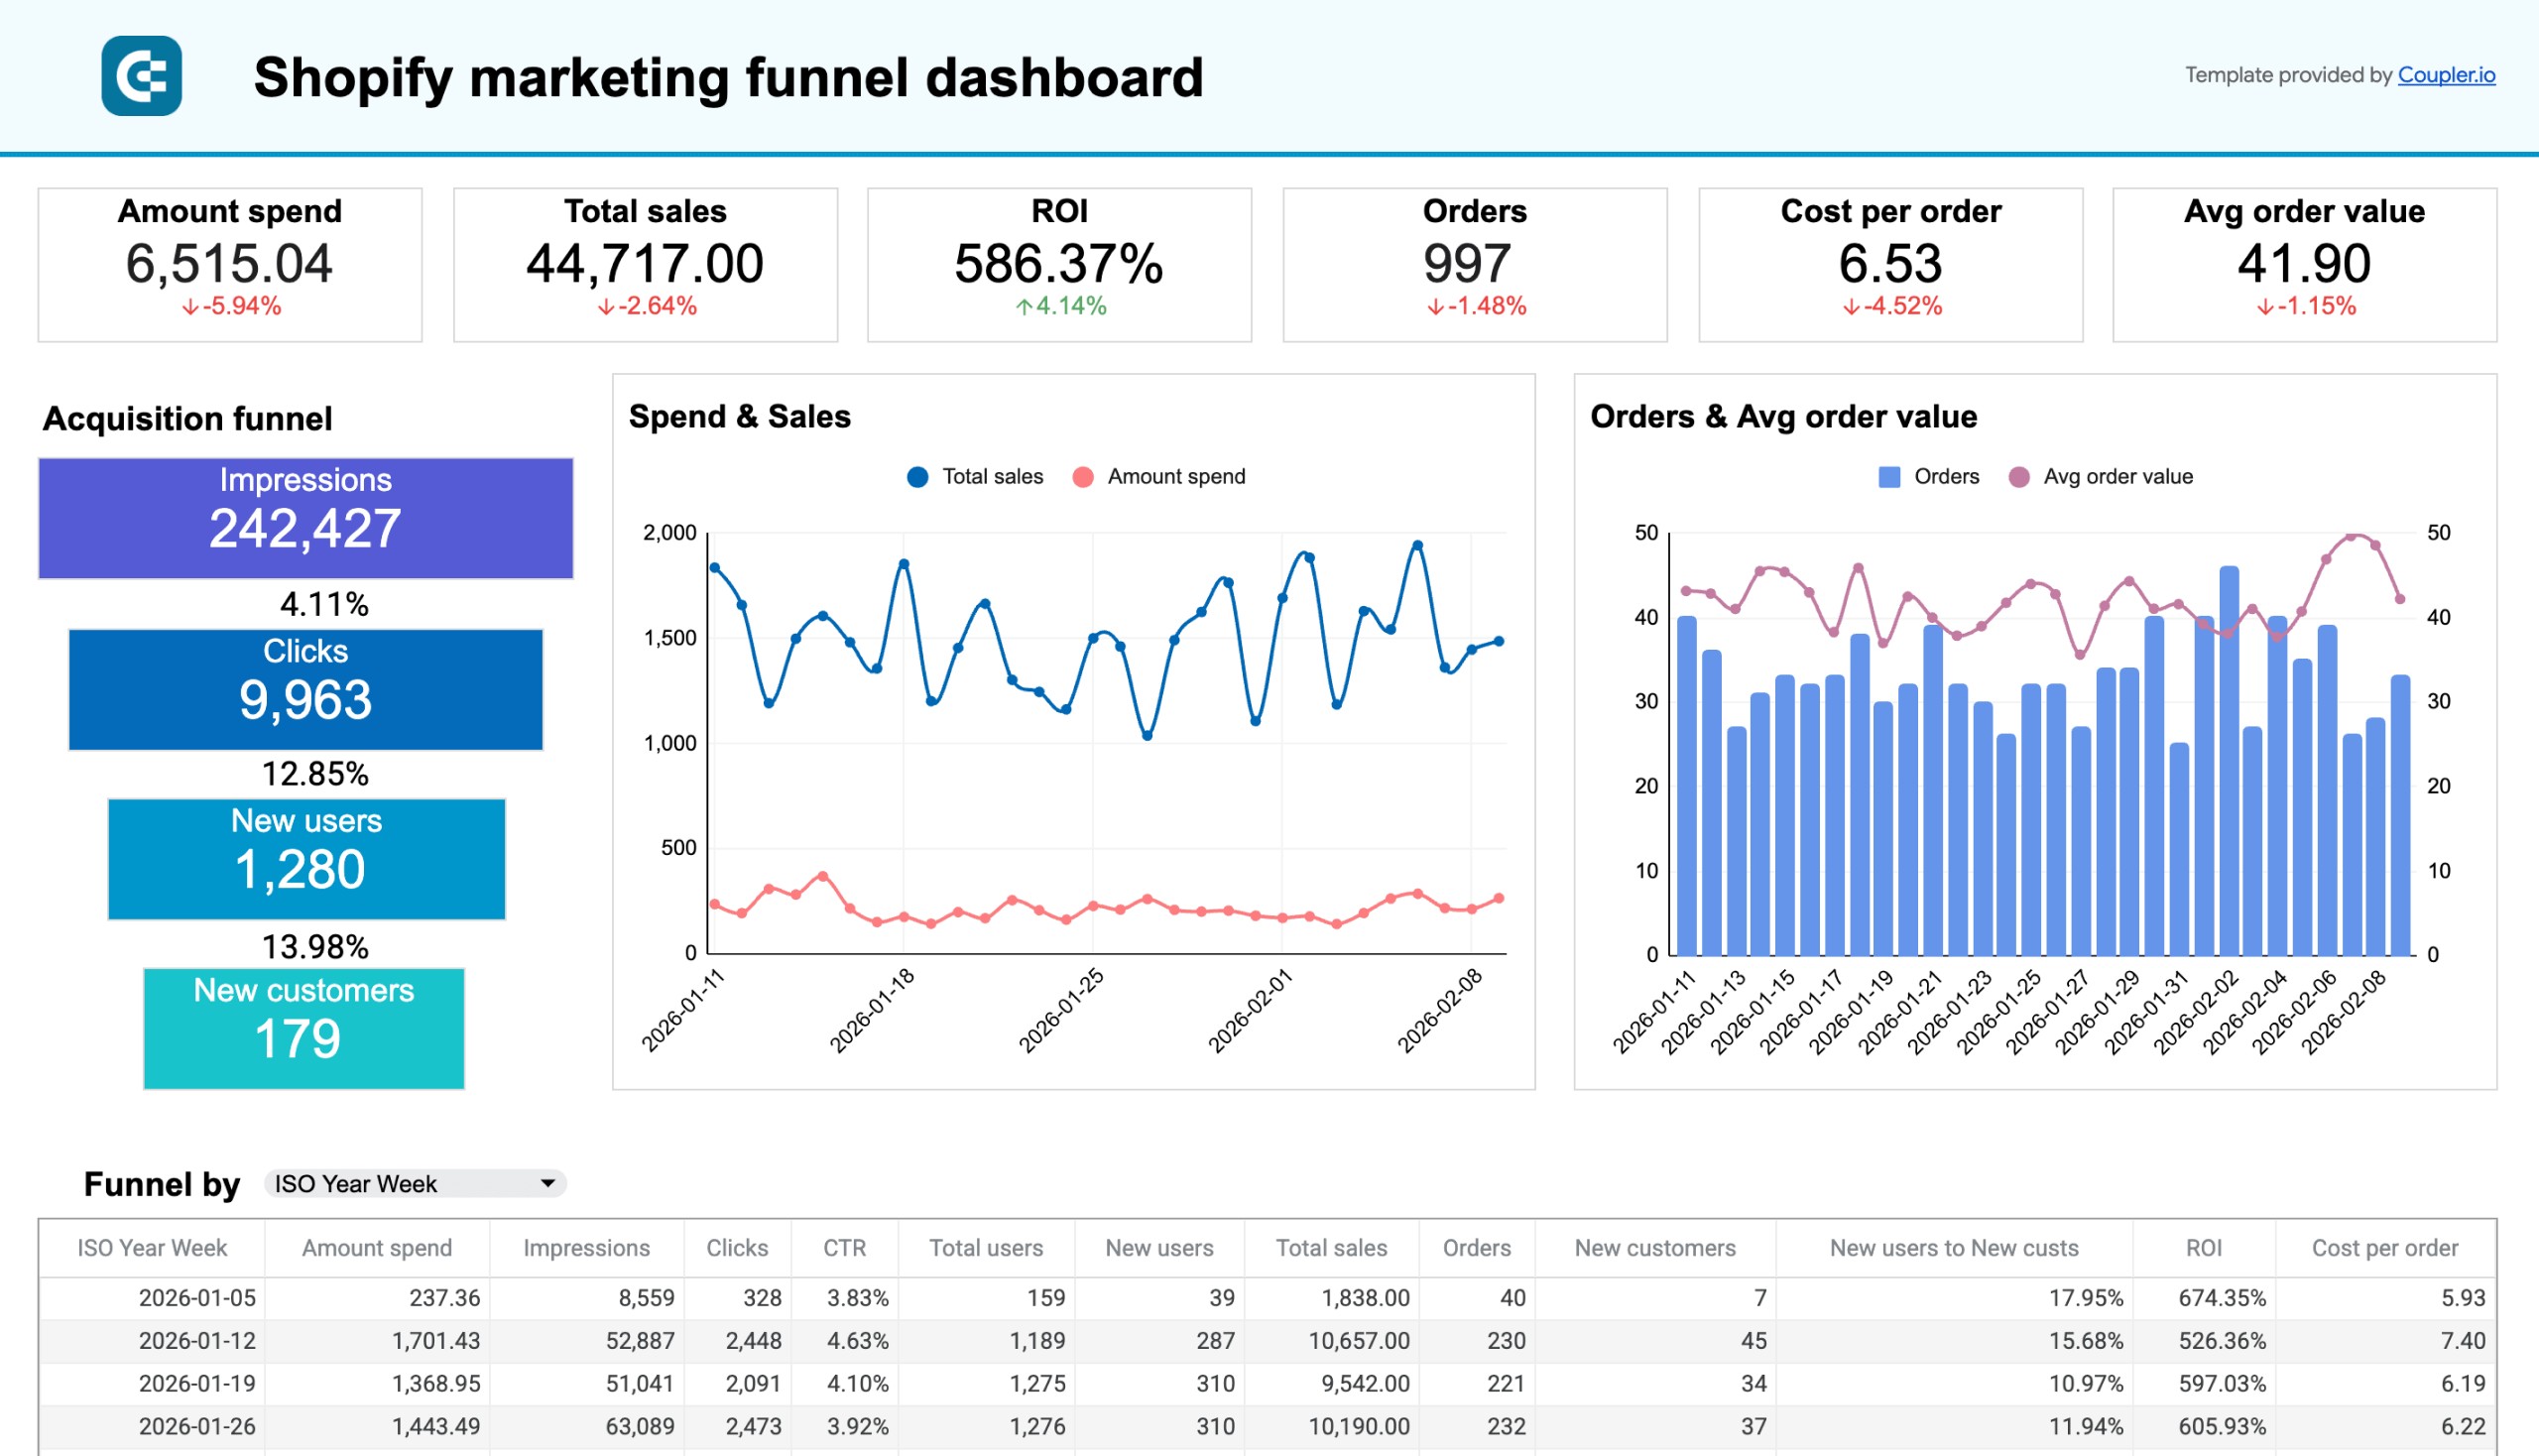
Shopify marketing funnel dashboard + acquisition overview
The Shopify marketing funnel analytics dashboard brings together data from three layers of your ecommerce stack — advertising platforms (Facebook Ads, Google Ads, and others), Google Analytics 4, and Shopify — into one unified view. Instead of checking ad spend in one tab, traffic data in another, and sales numbers in a third, you get the full acquisition picture: from ad impressions all the way to new customers and revenue.
Shopify marketing funnel dashboard
 Preview dashboard
Shopify marketing funnel dashboard
Preview dashboardWhat insights you can get:
- Cross-channel performance comparison. Line charts compare key metrics from PPC campaigns, website traffic, and Shopify store data side by side, so you can identify which part of the funnel needs attention.
- Full acquisition funnel visualization. A single funnel chart maps the journey from ad impressions through clicks, website users, and ultimately to orders and new customers, with KPIs like ROI and average order amount displayed alongside it.
- Weekly funnel dynamics. Track how impressions, clicks, total users, and new users change week over week to understand how your ad spending translates into store activity and sales over time.
- Spend vs. revenue ratio. A dedicated monthly chart compares advertising costs against revenue generated by sales, making it easy to spot negative trends or periods where ROI is shrinking.
- Per-platform spend tracking. Monitor expenses for each advertising platform separately to catch overspending early and rebalance your budget across channels.
The dashboard template is available in Coupler.io, Google Sheets, Looker Studio, and Power BI. All are equipped with the Coupler.io connector that automates data load from GA4, Shopify, and PPC platforms.
Shopify marketing funnel dashboard in Coupler.io
Combine data from Shopify, Google Analytics, and up to 10 ad platforms to measure your full marketing funnel — from impressions to orders. Track ROI, compare ad spend against sales revenue, and analyze cross-channel performance metrics daily and weekly.


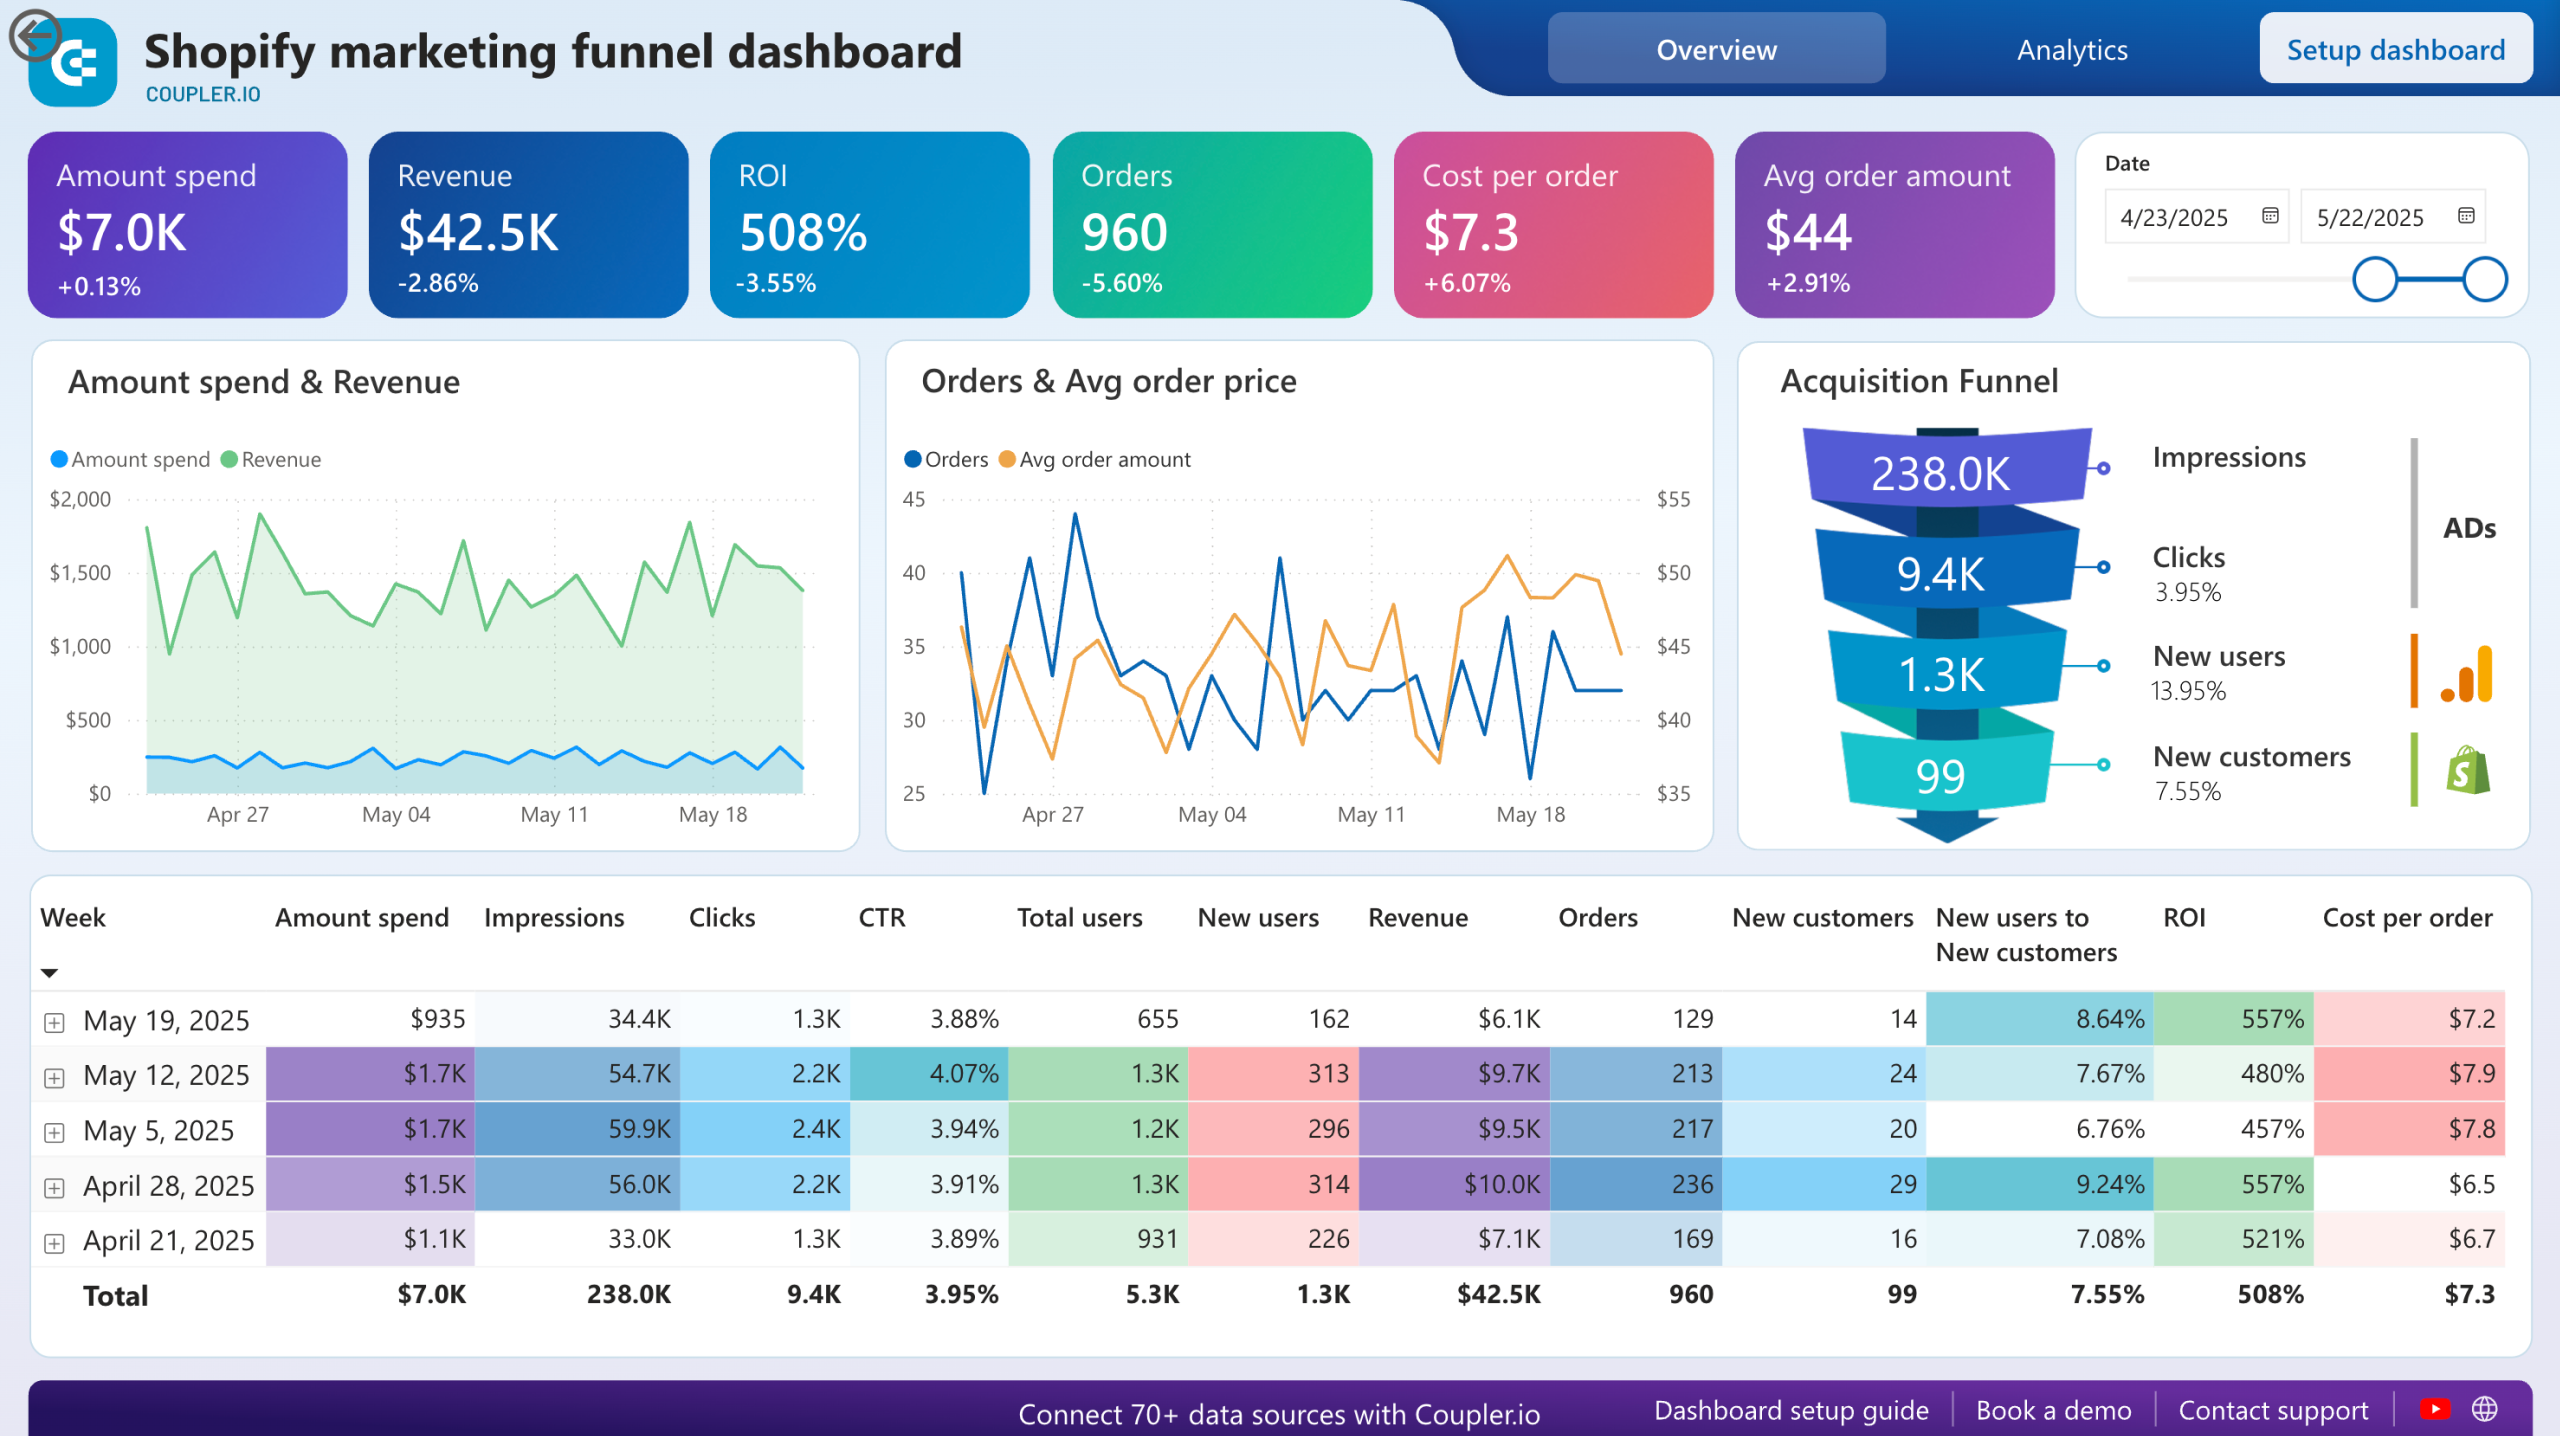
Shopify marketing funnel dashboard in Power BI
Examine the customer journey from advertising exposure to purchase completion with integrated data from your Shopify store, advertising platforms, and analytics tools.
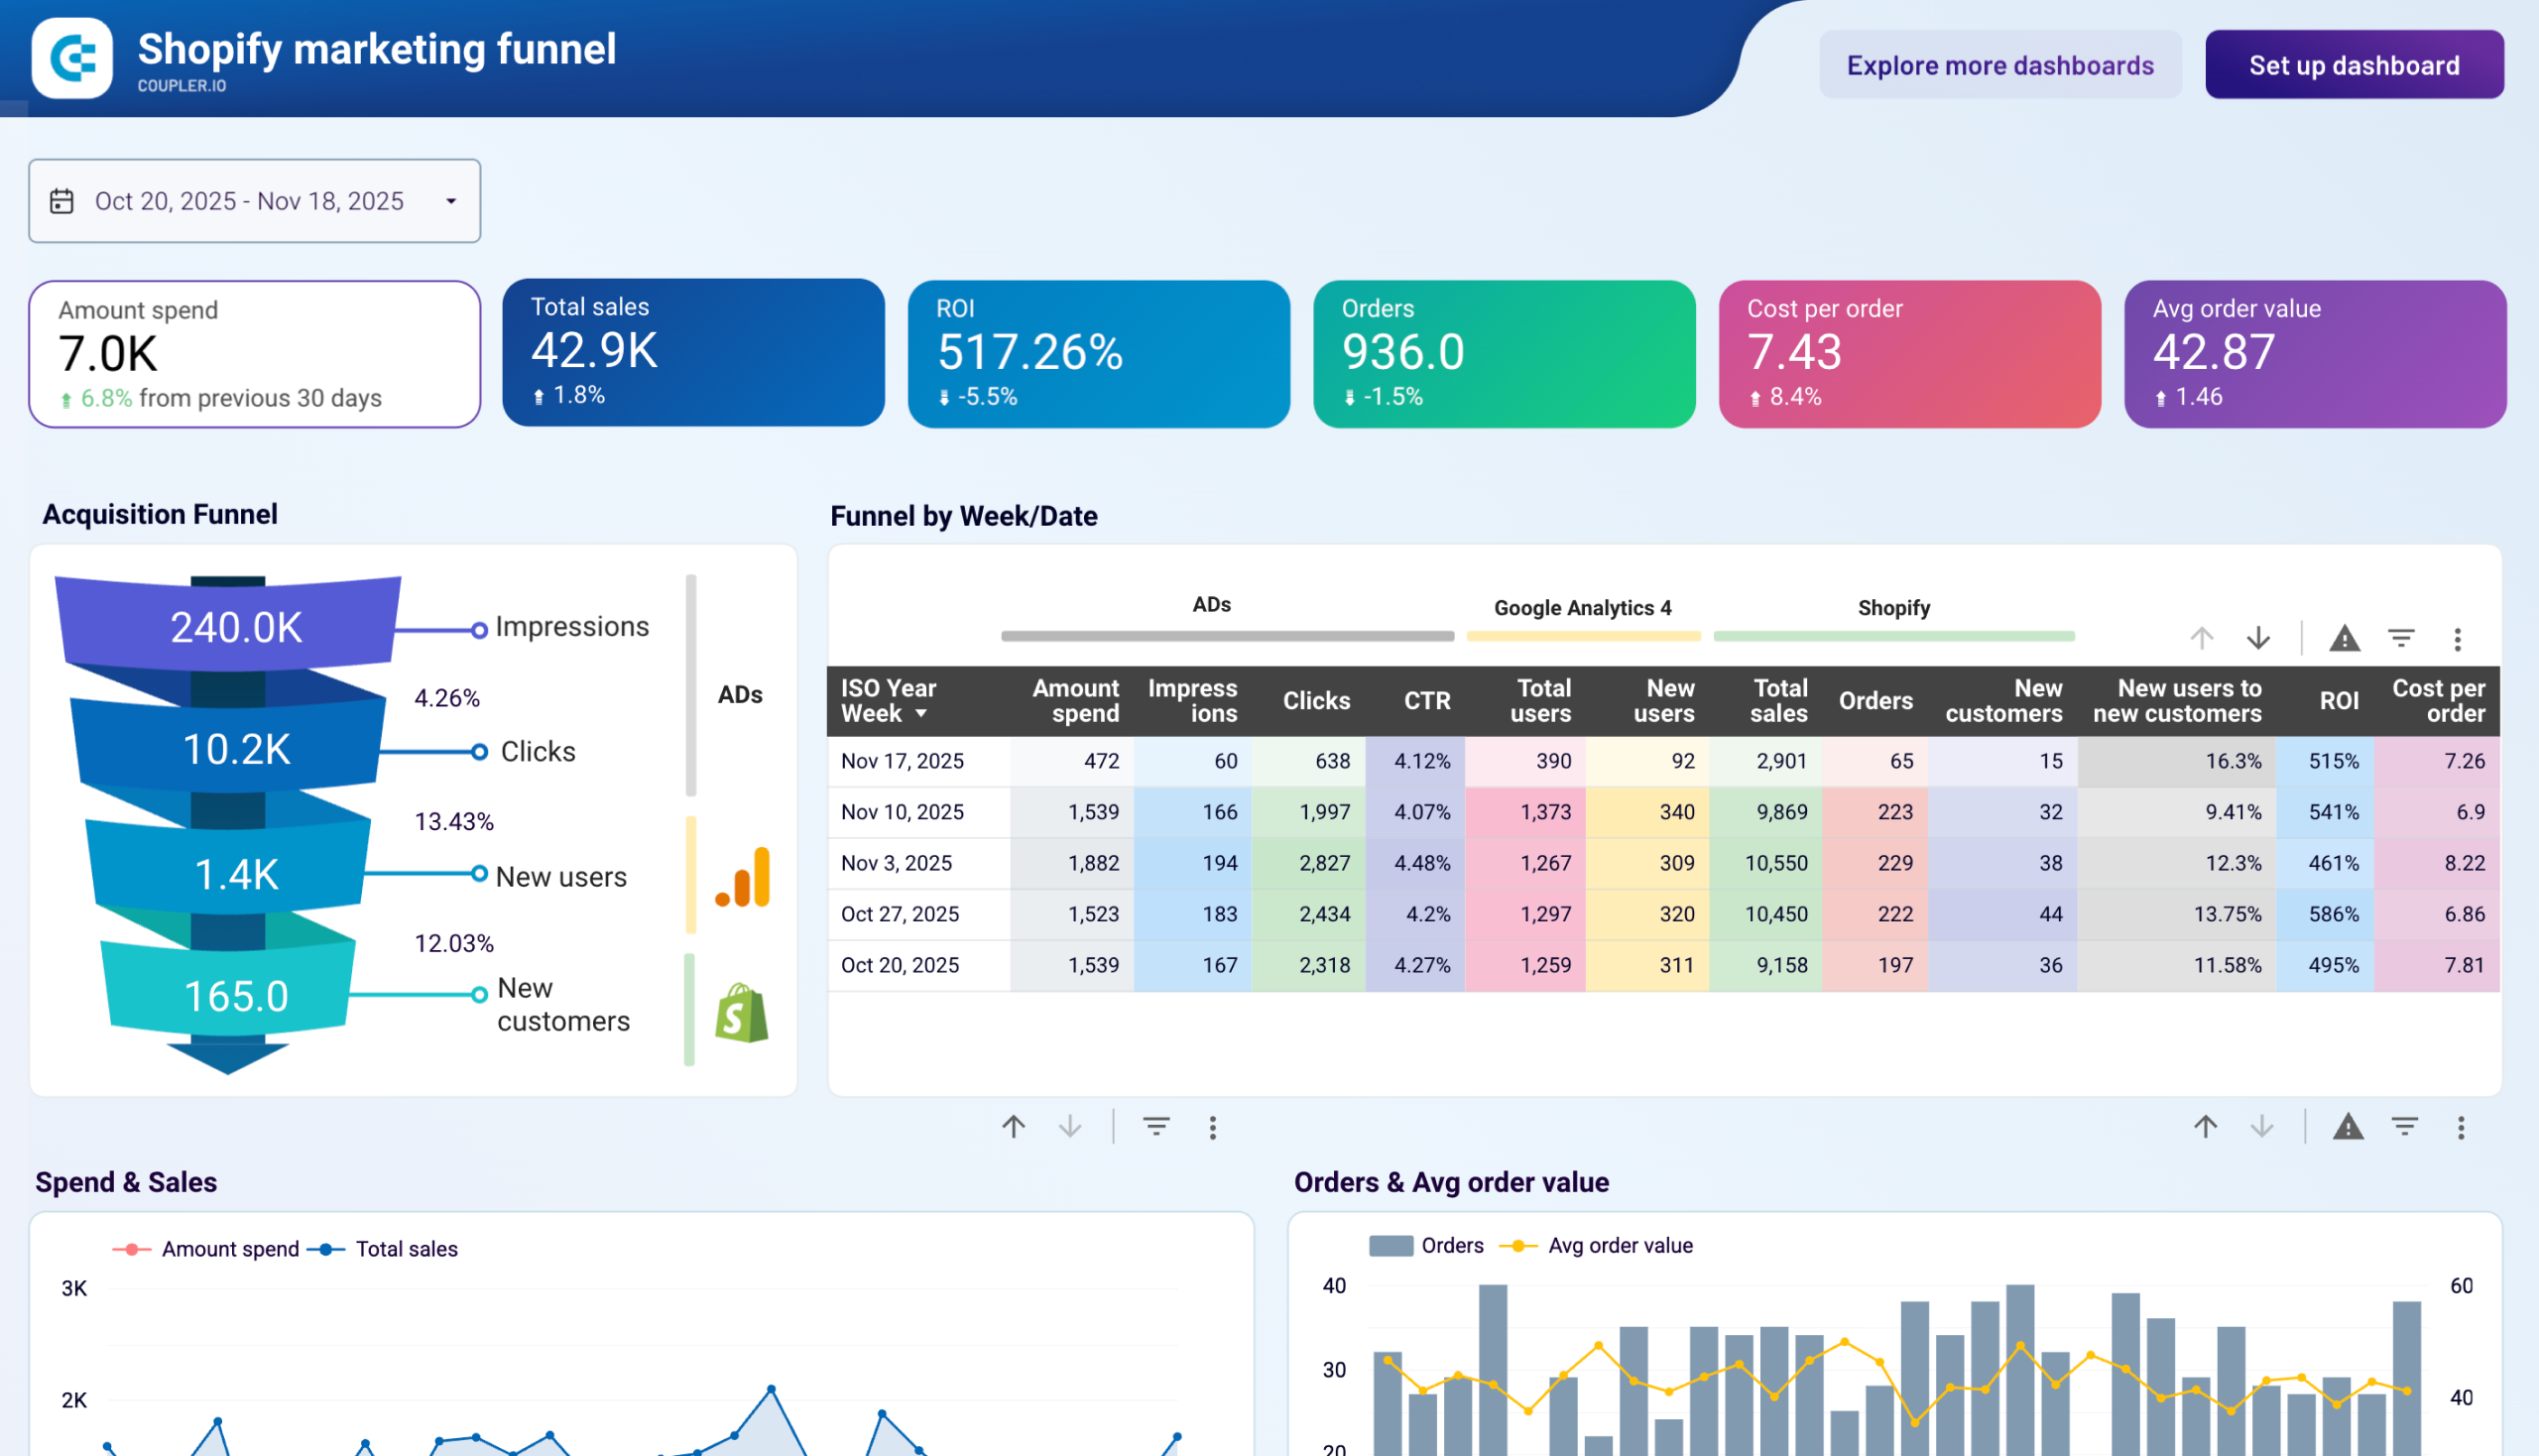
Shopify marketing funnel analytics dashboard in Looker Studio
Analyze the performance of the traffic to your Shopify store using data from advertising platforms and Google Analytics 4, all consolidated on a single dashboard.
Shopify marketing funnel analytics dashboard in Google Sheets
Visualize the complete customer journey from advertising exposure to purchase completion with integrated data from Shopify, advertising platforms, and Google Analytics 4. Monitor acquisition costs, conversion rates, and ROI across all marketing channels.
How you can export data from Shopify in other ways
1. Export Shopify data via API
To export implicit data like transactions and metafields from Shopify, you can use the Shopify API. Coupler.io offers a JSON API connector for this purpose, requiring a Shopify API token for configuration.
2. Export Shopify store data manually as a CSV file
With this option, you get your Shopify data downloaded as a CSV file to your device. This is well suited for rare or even one-time exports, for example, to migrate a store.
The flow is common: you need to go to the respective page (Products/Orders/Customers/etc.) and click the Export button. You can configure the export, and after that, the file will be either downloaded (for up to 50 records) or emailed to you (for more than 50 records).
3. Export data using apps from Shopify app store
The good thing about this option is that you can choose an app that is specific to your needs. The bad thing is that there are way too many apps to choose from.
Different apps provide different functionality such as “export your store’s data in customizable spreadsheet“, “automate your exports and ensure reliable order processing“, “grab the latest orders from your online store and format to CSV or XLSX file“, and so on.
However, you can search for a solution that suits your needs and maybe find a good fit.
What data can I export from Shopify?
The most in-demand Shopify data for export are Products, Orders, and Customers. You can pull this data manually as a CSV file or automate data export to the preferred destination using Coupler.io.
Beyond this, you can also pull reports, product reviews, gift cards, and much more. Some data is available for manual export as CSV, whereas most of the implicit data can be exported via REST API. But no worries, you don’t have to code to pull, for example, metafields. We’ll explain how you can do this with no code. Here is the table with Shopify exportable data:
| Data category | CSV export | Coupler.io | REST API (via JSON connector) |
| Orders & transactions | ✅ Basic order data | ✅ Orders with line items, shipping lines, fulfillments, activities, and refund transactions | ✅ Full access |
| Products & inventory | ✅ Products and inventory items | ✅ Products with variants, inventory levels | ✅ Full access including collections, smart collections |
| Customers | ✅ | ✅ | ✅ |
| Financial data (payouts, balance, disputes) | ❌ | ✅ Via JSON connector | ✅ |
| Store content (blogs, pages, themes, assets) | ❌ | ✅ Via JSON connector | ✅ |
| Metafields | ❌ | ✅ Via JSON connector | ✅ |
| Discounts & gift cards | ✅ | ✅ Via JSON connector | ✅ |
| Reports | ✅ | ❌ | ✅ (Advanced/Plus plans only) |
What other data you can export from Shopify via the Shopify API
For more information on other data entities available for export from Shopify, read the Shopify API documentation. Below, we introduced just a few examples.
https://{store_name}.myshopify.com/admin/api/2022-01/{resource}
| Data entity | {resource} for JSON URL | Path |
|---|---|---|
| List of products | …/products.json | products |
| List of customers | …/customers.json | customers |
| List of orders | …/orders.json?status=any | orders |
| Orders by customer | …/orders.json | orders |
| Reports (available to Shopify Advanced and Shopify Plus merchants only) | …/reports.json | reports |
| Application charges | …/application_charges.json | |
| Application credits | …/application_credits.json | |
| List of locations | …/locations.json | locations |
| List of blogs | …/blogs.json | blogs |
| Current balance* | …/shopify_payments/balance.json | |
| List of disputes* (initiated at the specified date) | …/shopify_payments/disputes.json?initiated_at={yyyy-mm-dd} | |
| List of all payouts* | …/shopify_payments/payouts.json | |
| List of all balance transactions paid out in the specified payout* | …/shopify_payments/balance/transactions.json?payout_id={payout-id} |
*If you get an error with the Shopify Payments endpoints, it’s most likely that the Shopify Payments module is not available in your region.
Important: Make sure that your Shopify has the required app permissions set to Read access.
How to export Shopify metafields and other data via API
Let’s say you need to export metafields or other implicit data from Shopify. You can get these via the Shopify API.
Coupler.io provides a JSON API connector that you can use to pull data using REST APIs from different apps. You’ll need to select the JSON as a source and configure it to connect to the Shopify API. The latter requires you to get a Shopify API token first.
How to get Shopify API token
To access the Shopify API and export data from your store, you’ll need to create a Shopify custom app.
- Go to the Apps menu of your Shopify store.

- Click Develop apps for your store (former Private apps).
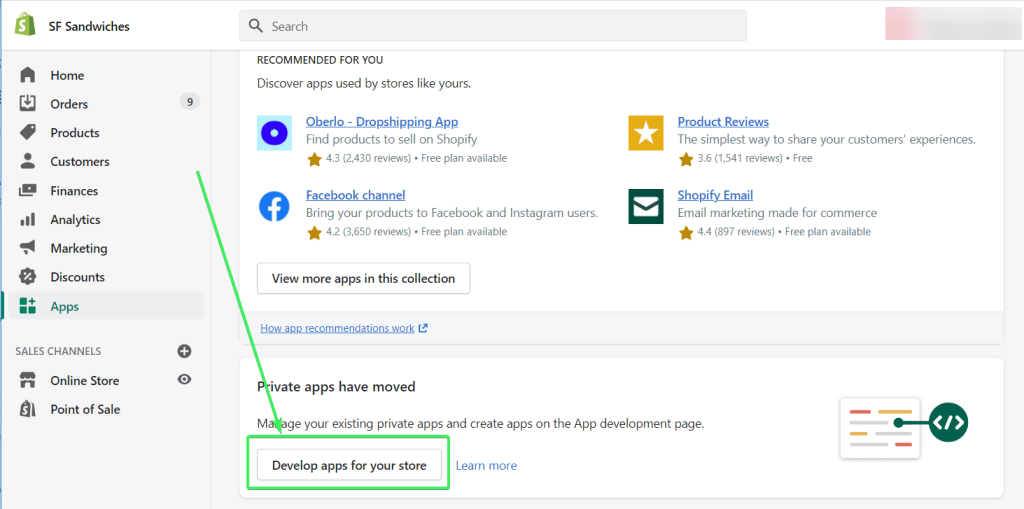
- Click Create an app.

Note: If you haven’t created any private or custom apps before, you may be asked to enable app development.
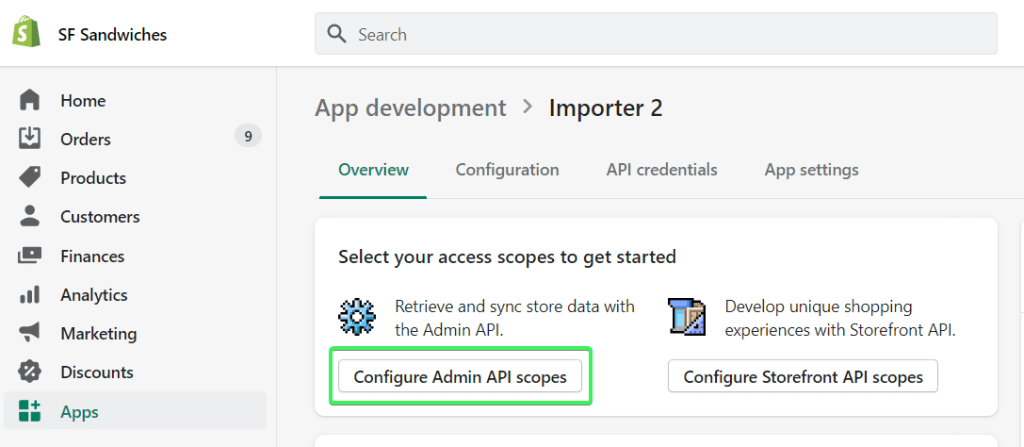
- Name your app. Then click Create app.

- Once the app is created, click Configure Admin API scopes.
- Check the read scopes for:
- Customers –
read_customers - Inventory –
read_inventory - Orders –
read_orders - Products –
read_products
- Customers –
Then click Save.

- Click Install app.

You’ll find your Shopify API token in the Admin API section.

Now you are ready to set up your Shopify integration to export metafields data. Let’s explore one use case to have some practice.
Use case: Shopify export metafields data
Here are the types that implement metafields in Shopify:
- Collection
- Customer
- DraftOrder
- Image
- Order
- Product
- ProductVariant
- Shop
In Shopify, you can’t export all the metafields for a chosen type. For example, you can’t get all the metafields of all the products. All you can do is export metafields of a single product. This is very frustrating, and Shopify users raised this issue some time ago. Nevertheless, let’s review an option we have.
Click Proceed in the form below to create an automated JSON importer. We’ve preselected Google Sheets as a destination app, but you’re free to select your option.
Move on to the setup as follows:
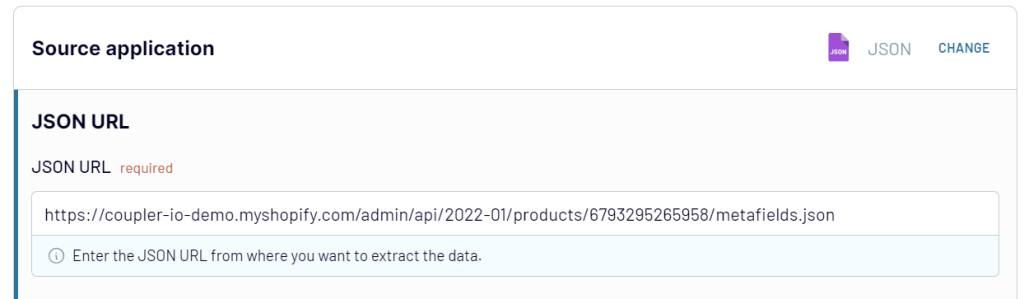
- JSON URL – use the following URL:
https://{store_name}.myshopify.com/admin/api/2022-01/products/{product-id}/metafields.json
{store_name}– enter your shop name.{product-id}– enter the ID of a product for which you want to export metafields.
You can find the product ID in the URL bar of your browser when you select the product.

So, your JSON URL should look like this:
https://sf-sandwiches.myshopify.com/admin/api/2022-01/products/5607136559258/metafields.json
Note: If you’re exporting metafields for other types, make sure you modify your string accordingly – for example,
orders/{order-id}/metafields.json
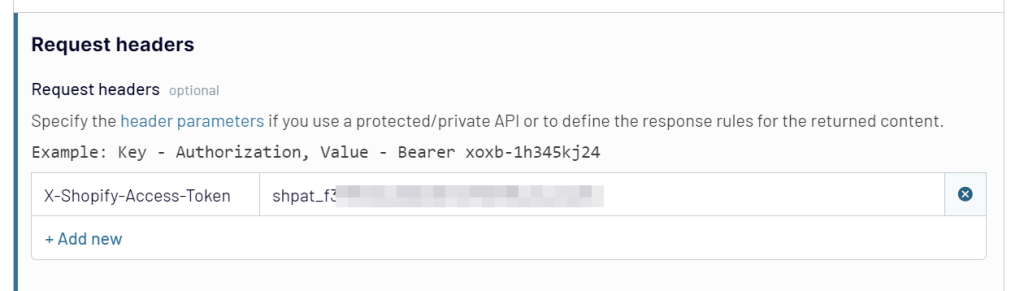
- Request headers – specify your API access token using the following HTTP header:
X-Shopify-Access-Token:{your-api-access-token}
X-Shopify-Access-Token:{your-api-access-token}
- Path – Enter the
metafields
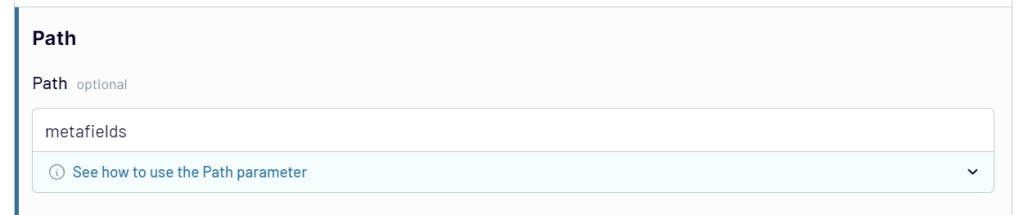
In the next step, you can preview, filter, and sort your data as well as rename, rearrange, hide, or add columns. Then, authorize your Google account and select the spreadsheet where you’d like to import your data.
Lastly, select the data refresh schedule and click Run importer to pull your Shopify metafields data to Google Sheets. Here is what it looks like for our example:

How to export Shopify sales data to CSV manually
CSV export is a go for those users who want either to migrate their data to another store or to make a backup manually. There is no “Export all” button in Shopify, so you’ll have to export each data entity separately.
If you’re exporting more than 50 records, the CSV file will be emailed to you and the store owner. For requests of up to 50 records, the CSV file will be downloaded right away. The time it takes to generate a CSV file depends on the number of orders for export. The estimate is around one hour per 100,000 orders. The exported CSV files are limited to 1 MB.
Export Shopify purchased data (orders) as CSV
In your Shopify admin, go to the Orders page and click Export. If you want to export data about specific orders, select those.

Then you need to select which orders you want to export, the CSV file format and whether you want to include transaction histories.

Read our guide for more about Shopify export orders.
Export customer data from Shopify as CSV
The flow for exporting Shopify customer data is the same as for exporting orders:
- Go to the Customers page and click Export. If you want to export data about specific customers, select those.
- Select which customer you want to export, as well as the CSV file format. Click Export customers.

Shopify export products as CSV
Repeat the same steps if you want to export product data from Shopify:
- Go to the Products page and click Export. If you want to export data about specific products, select those.
- Select which products you want to export, as well as the CSV file format. Click Export products.

In the Products section, you can also find other data for export, including Collections, Gift Cards, and Inventory. The exporting flow for them is the same.
Export Shopify reports as CSV
You will find Shopify reports in Analytics => Reports.

Click on the report you want to export and configure it for export:
- Choose the data range
- Apply filters if needed
- Add or remove columns to include

To download your report as a CSV file, click the Export button.
Export Shopify discount codes as CSV
To export discount codes data as CSV, do the following:
- Go to the Discounts page and click Export. If you want to export data about specific discounts, select those.
- Select which discount codes you want to export, as well as the CSV file format. Click Export discount codes.

That’s it for your CSV exporting experience. Now let’s check out the more advanced options that will let you automate data exports.
How to export Shopify data for taxes
First of all, do not forget that:
Shopify doesn’t report or remit your sales taxes for you.
This is on you, but you can configure the most common sales calculations in Settings => Taxes.
As for the reporting, you’ll have to export Shopify reports yourself for your local tax authorities. Usually, the data about Users, Products, and Orders is a common practice for tax legislation in many countries. You can export them as CSV from Shopify as described above.
If you’ve integrated Shopify with Google Sheets for reporting or backup purposes, you can download this data as CSV as well – go to File => Download => Comma-separated values (.csv, current sheet).

Frequently asked questions about the Shopify integration
Yes, this is possible when using Coupler.io. For example, you can export Products and specify the list of columns to import to the destination:
- product_id
- product_title
- product_body_html
- product_product_type
- price
- sku
- inventory_quantity
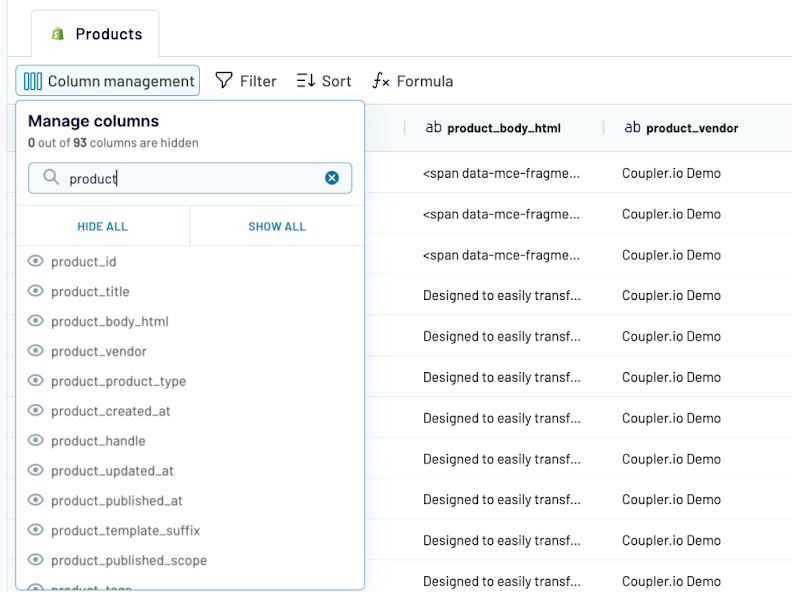
This will be enough for a meaningful report, and you won’t have to delete unnecessary columns after the import.
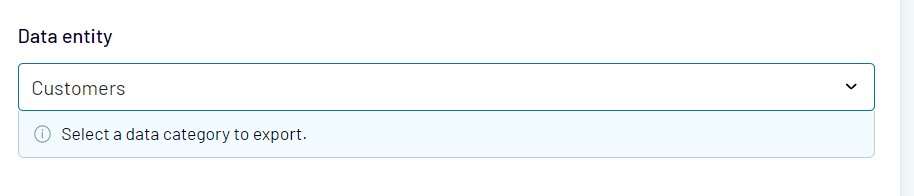
Can you automate Shopify export customer data?
Let’s check out another case with exporting customer data. As you understand, the flow is mostly the same. The only difference is that you need to select Customers as a data entity when setting up the source.
You’ll get a preview of the details of your Shopify store customers right in the app.
Complete the rest of the flow and run the importer.
Will Shopify show stock level in the exported data set?
Sure it will! The column with the stock level data is called inventory_quantity. In the example above, we exported it along with other fields:

Can Shopify export collections as Excel?
We mentioned that Coupler.io allows you to export data from Shopify to several destinations, including Excel. So, to export a collection of products to Excel, you’ll need to complete the same three steps.
- Extract your data in the same way, but specify Excel as a destination
- Organize your dataset if needed
- Schedule automated updates and manage the exported data
To get started, click Proceed in the form below:
Which is the best way to export financial data from Shopify?
The native exporting as CSV functionality in Shopify is rather shallow and inconvenient for recurring data manipulations. Besides, it won’t let you export much raw financial data, such as transactions, payouts, etc.
Coupler.io will let you do this from Shopify to Google Sheets (or another destination) and get almost any record you need. Moreover, you can set up your importer once and automate it on the schedule you want.
As for the apps on the Shopify store, they can do the job as well. However, their drawback is that most of the apps provide separate functionalities, so you’ll have to install a few apps instead of one. And this can be rather costly.
The final decision should rely on your goal. We’re sure that you’ll make the best choice for your needs. Good luck with your data!
Automate Shopify data export with Coupler.io
Get started for free


