How to Export TikTok Ads GMV Max Campaign Reports with Coupler.io

TikTok Shop exploded onto the scene in 2024 and, within a year, it hit more than $33 billion in global Gross Merchandise Value (GMV) — the total value of goods sold on the platform. If you are a seller, you need to track GMV to understand your real sales performance and ROI. Especially through optimized campaigns like GMV Max, TikTok’s AI-powered ad type that maximizes sales across paid and organic traffic.
But here’s the catch: with TikTok’s native tools, you’ll have to manually dig through Seller Center or Ads Manager, with almost no easy way to automate exports or get deeper insights into the data. That’s where Coupler.io, an all-in-one data integration platform, comes in. Let’s walk through how to set up data export from your TikTok Ads GMV report.
A step-by-step guide to exporting TikTok Ads GMV Max campaign reports with Coupler.io
Coupler.io is a powerful data integration platform that lets you pull TikTok Ads GMV data automatically at regular intervals. It links directly to TikTok, extracts the necessary insights, and transfers them to spreadsheets, CRM systems, BI tools, and more.
In the setup form below, TikTok is already set as the data source. Choose where you want the GMV report data to be exported and click Proceed.
You’ll be offered to sign up for Coupler.io for free with no credit card required.
Follow the detailed guidelines below to configure automatic exports of your TikTok Ads GMV data on the schedule you need.
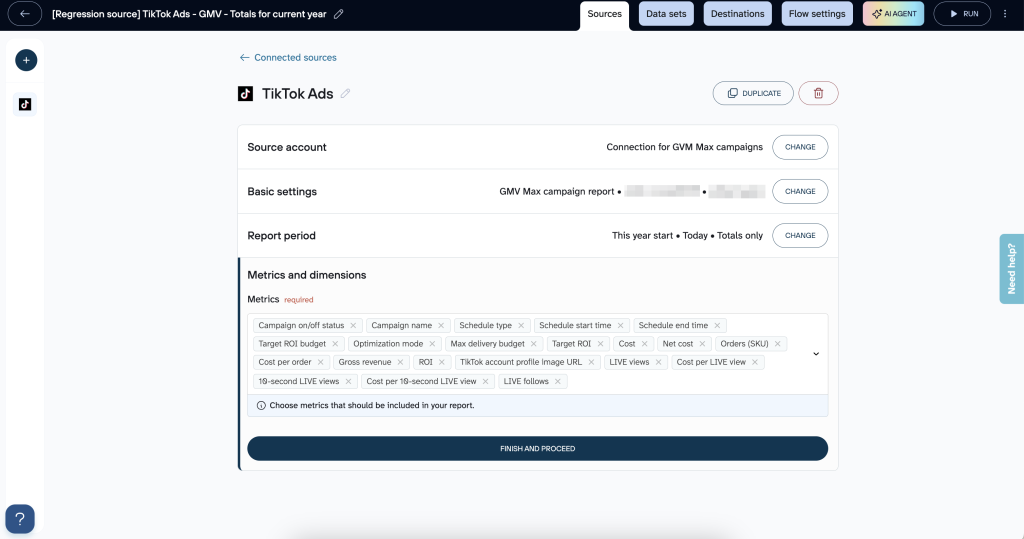
Step 1: Collect TikTok GMV Max campaign data
In this Step, you connect and configure the data source:
- Connect your TikTok Ads account and configure the required settings
- Select the GMV Max campaign report
- Specify the ad accounts
- Choose your store
- Set the report period timeframe
- Select the metrics for your report
When you export your GMV Max report, you’ll notice the sales numbers are lower than reports from other campaign types. This is expected and not an error.
GMV Max uses a 24-hour attribution window, which means it only counts sales that happen within 24 hours of someone interacting with your ad. In contrast, other campaigns track sales for up to 7 days after a click or 1 day after a view. For example, if someone clicks your ad on Monday but purchases on Wednesday, that sale won’t appear in your GMV Max report, even though it would show up in standard campaign reports.
Because of this difference in how sales are counted, you shouldn’t directly compare ROAS metrics between GMV Max and other campaign types in your exported data. They’re measuring different timeframes and will naturally show different results.
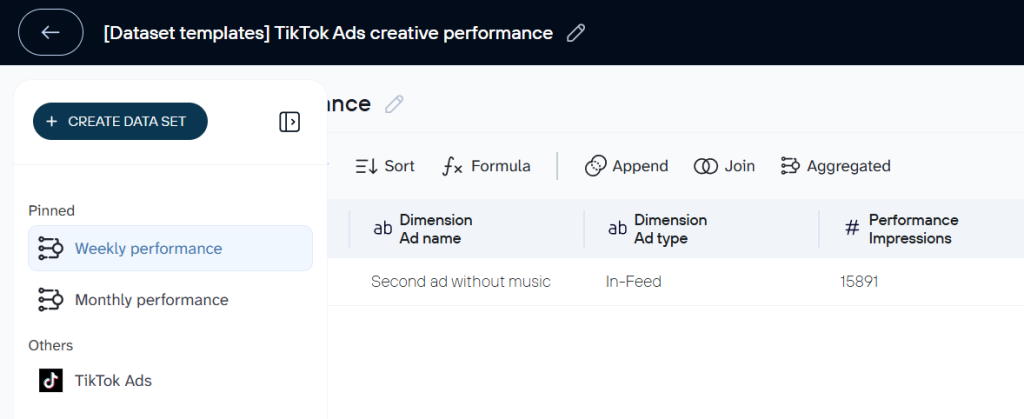
Step 2: Organize data sets
Navigate to the Data sets tab to prepare and structure your data before exporting to the destination app.
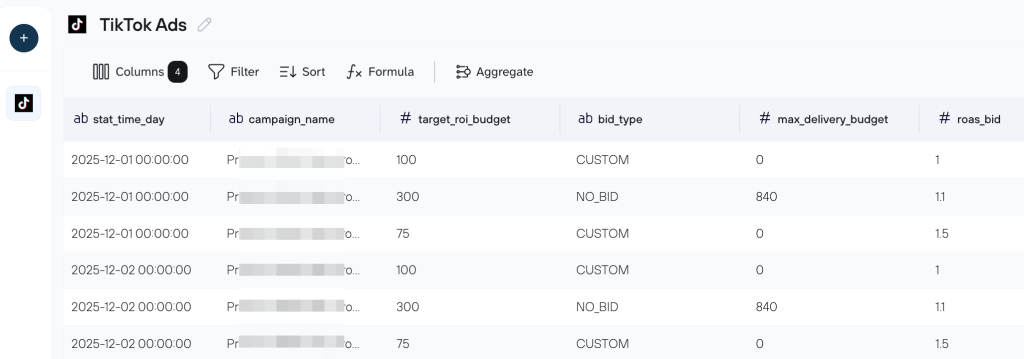
For example, you can:
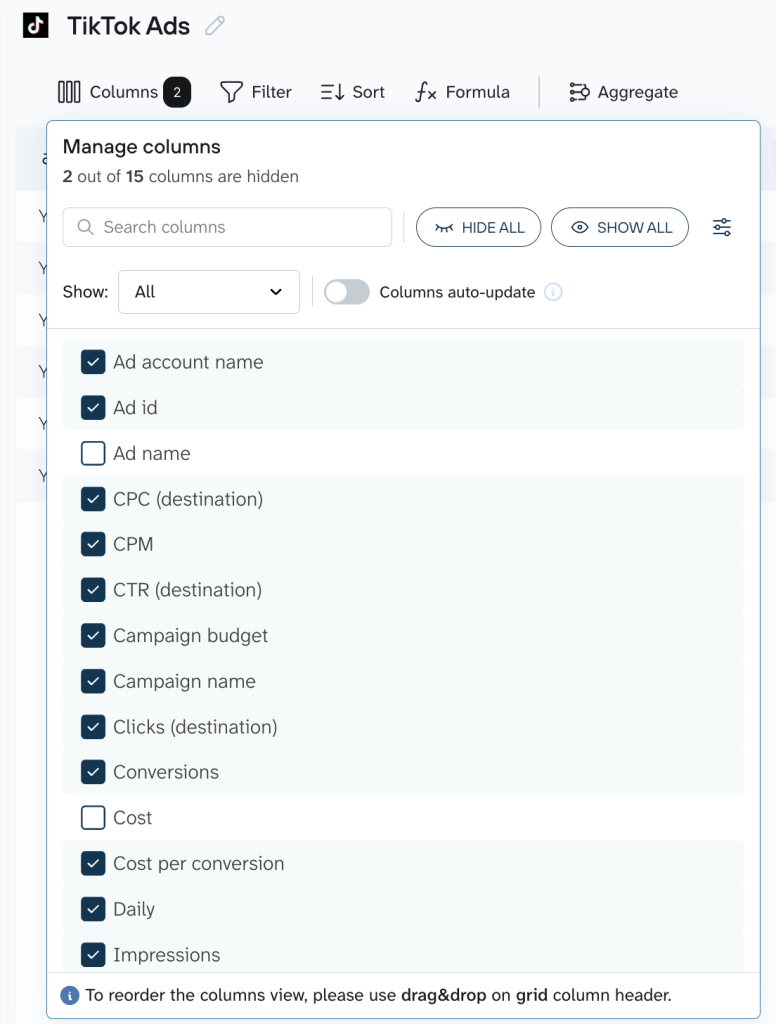
- Manage columns (rename, hide, reorder, etc.)
- Filter the report data (based on your chosen criteria)
- Sort the data
- Add formula columns to calculate values from existing data
Here you’ll also have the option to combine data from multiple entities or sources into the same data flow. We’ll cover these options in more detail in the next section.
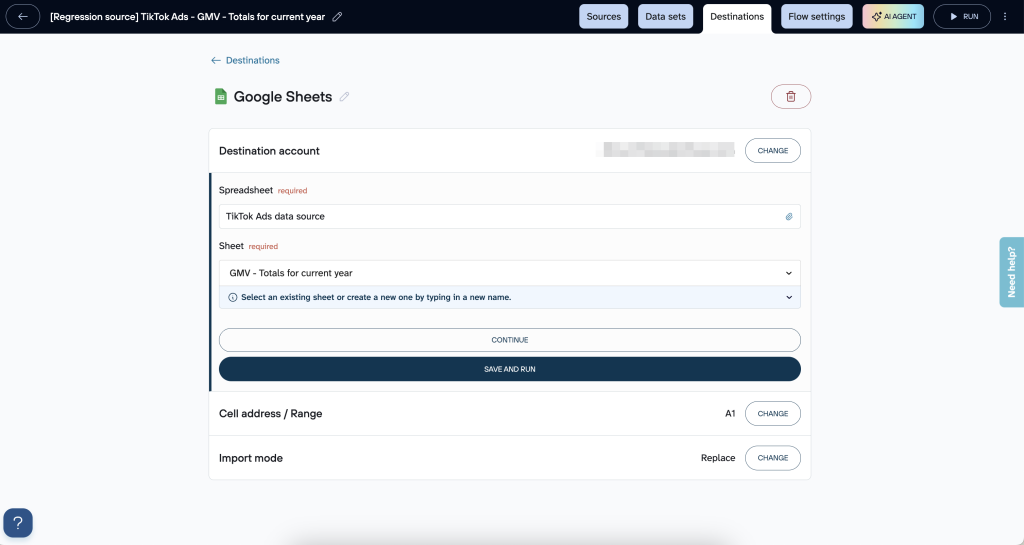
Step 3: Connect the destination
You already chose the destination for your TikTok Ads GMV data earlier in the setup process. In the Destination tab, follow the in-app instructions to connect the destination you’ve selected and configure its settings. Plus, if you ever need to switch to a different destination, you can easily do so on this tab.
Here’s an example of what a Google Sheets destination setup looks like:
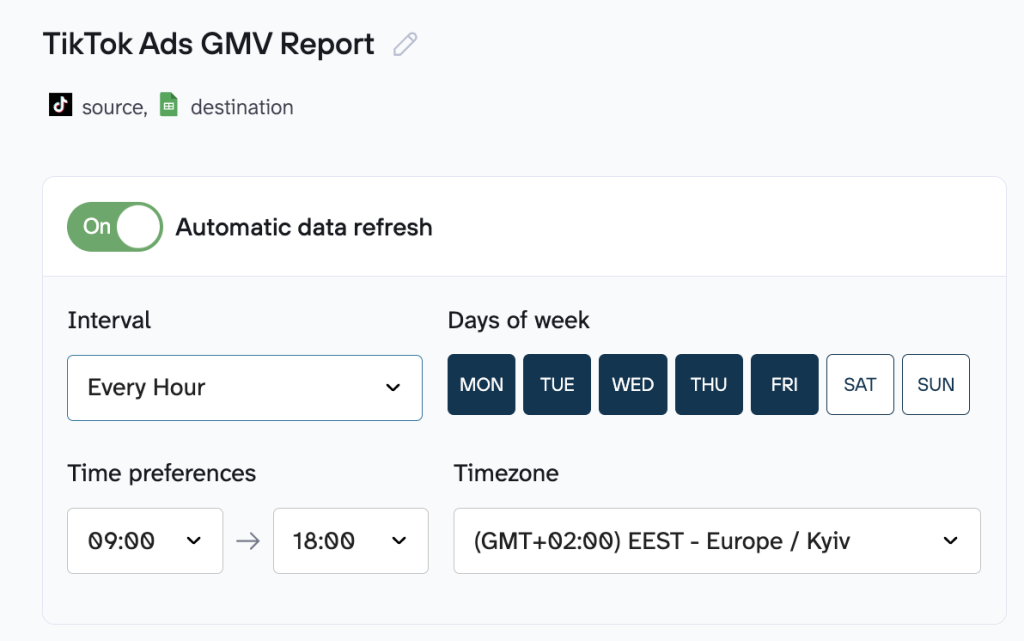
Step 4: Automate data refresh
Set how often you want the GMV report data to update in your destination app. You can choose time intervals and specific days of the week, set a preferred timeframe, and select the timezone.
Best practices to organize your TikTok Ads data with Coupler.io
Now that you understand the key steps of exporting your TikTok Ads data with Coupler.io, you’re ready to extract real value from it. The platform’s built-in transformation and visualization tools let you clean, combine, and explore your data effortlessly.
Basic data optimization options
Manage your TikTok Ads data before it lands in your chosen destination (Google Sheets, BigQuery, Looker Studio, etc.). Instead of dealing with messy manual fixes later, you can make clean, simple adjustments right here and have the data ready for proper analysis.
Here are a few common adjustments you’ll find useful:
- Column management: Rename columns to make them easier to understand (for example, turn “gross_merch_value” into plain “GMV”), hide the columns you rarely use, or rearrange the order so your most important metrics are easy to spot.
- Filtering and sorting: Narrow things down to what actually matters, such as showing only campaigns from the past month, then sort by spend, ROAS, or conversions to quickly see what’s performing best.
- Adding calculated fields: Create new columns using basic formulas. For instance, to calculate ROAS, divide GMV by ad spend.
Advanced options: data blending, aggregation, and dashboards
When you’re ready to level up, Coupler.io enables you to mix in data from other sources, summarize bulky datasets, and build visuals that show the complete picture of your TikTok Ads report.
Blending with other sources
This is where you can pull your TikTok Ads campaign report together with data from elsewhere, like Google Ads, Facebook Ads, or even your CRM. It opens up cross-channel views and allows you to compare how TikTok’s Ads report stacks up against other platforms, work out an overall ROAS, or spot where audiences overlap. Coupler.io keeps it simple with two main ways to blend: Append and Join. Let’s break them down.
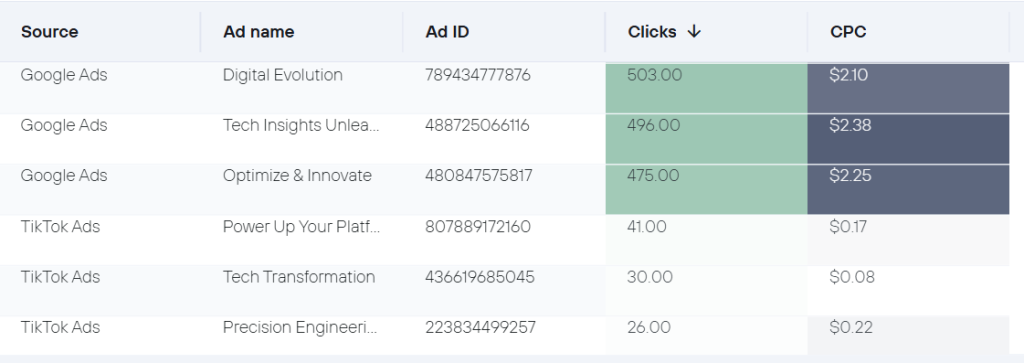
Append is great when your datasets are similar (e.g., stacking TikTok Ads reports on top of Google Ads ones). It adds rows from each source: matches up columns with the same names (like “date” or “campaign”) and includes any unique ones as additional points. For example, if you’re blending TikTok and Facebook data, you might end up with a single table showing total clicks and spend across both. It’s perfect for getting a unified multichannel report.
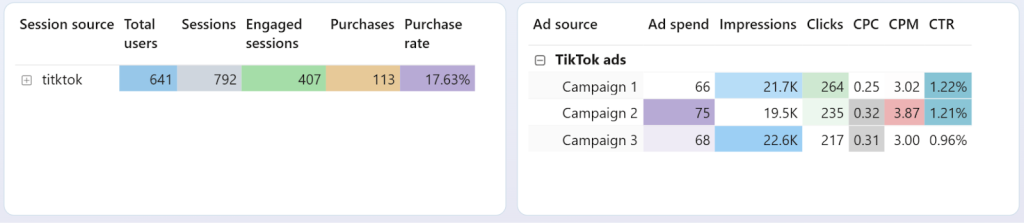
Join is more about linking different kinds of data side by side using a common thread, like dates or campaign IDs. It keeps everything from your main dataset (e.g., TikTok as the “left” side) and adds matching info from the other (the “right” side). Imagine joining your TikTok GMV numbers with Google Search Console data on branded searches. You’ll be able to see if those viral TikTok ads are spiking searches for your brand. Or have TikTok Ads analytics along with Google Analytics metrics to calculate true campaign profitability.
The key difference? Append stacks vertically for similar data, while Join aligns horizontally for related but different sources, which helps you identify those hidden connections that boost your ad campaign performance.
Aggregation for data summarizing
If your TikTok datasets are getting huge, like thousands of daily entries on impressions, clicks, and more, aggregation is a lifesaver. It groups data and applies math like sums, averages, or counts. This way, you get shorter and more insightful reports without losing the essence. For instance, instead of looking through every single transaction, you could aggregate by week or month to track the trends, or by campaign to see total spend versus returns.
This is especially useful for marketing specialists, who deal with high-volume ads, because it helps them quickly flag underperformers or reallocate budgets based on solid trends.
Automate exports of TikTok Ads GMV Max report with Coupler.io
Get started for freeAlternative ways to export TikTok Ads GMV Max report
Though Coupler.io offers an easy automated solution, several other methods for exporting TikTok GMV Max data exist. Before choosing one of these alternatives, consider the significant drawbacks they often involve.
Manual export via TikTok Ads Manager and Seller Center
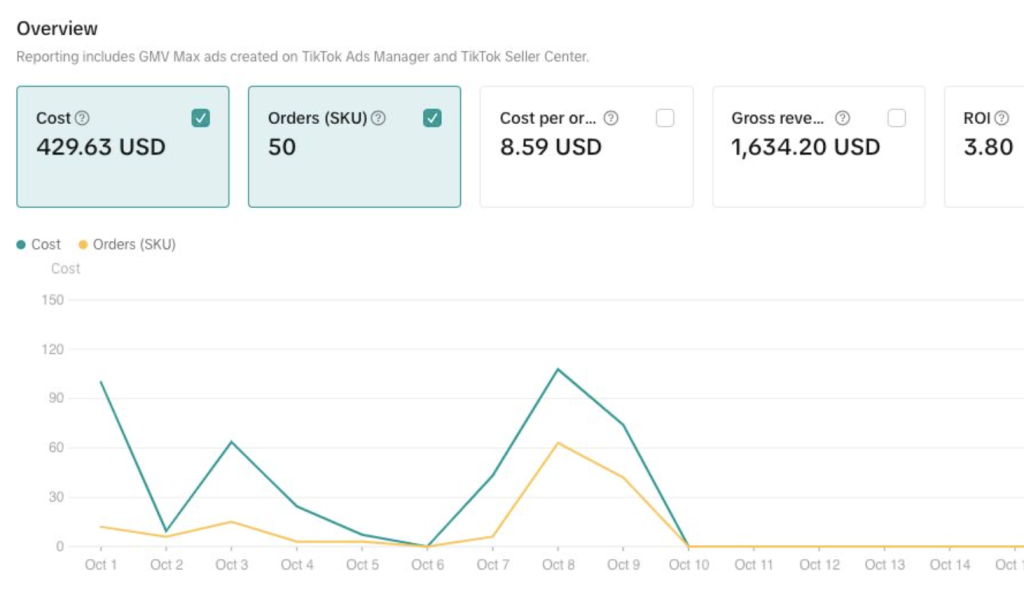
GMV Max reports are accessible directly in the TikTok dashboards. In the TikTok Seller Center (Marketing or Shop Ads tab), you can select your campaign and view details for an overview, including:
- Cost
- Orders
- Cost per order
- Gross revenue
- ROI
- Breakdowns by products or creatives
Similarly, in TikTok Ads Manager, you can check the Reporting or Campaign Management sections for real-time GMV performance metrics like sales value, ROAS, and conversions. Exports are generally manual. Data can be downloaded as CSV or Excel files, where supported.
For whom: This method suits small sellers running one or two campaigns who just need a quick weekly check to adjust ad spend without ongoing automation.
Drawback: It takes a lot of time to keep logging in and downloading reports over and over. If done irregularly, it increases the risk of errors and using outdated data.
Direct access via TikTok Marketing API
For automated, programmatic exports, there’s the TikTok for Business Marketing API, which includes dedicated endpoints for GMV Max campaign reporting. This allows for the retrieval of detailed metrics such as:
- Gross merchandise value
- ROI
- Orders
- Performance data at campaign, product, or creative levels
Developers can build custom scripts (e.g., in Python or R) to query reports, schedule pulls, and export to spreadsheets, databases, or BI tools. Access requires developer registration, app approval, and an access token. Besides, note that GMV Max-specific fields may need particular permissions or report types, and availability can vary by region or account.
For whom: Larger agencies managing multiple client accounts, where a custom script integrates GMV data into a central dashboard for real-time aggregated analysis.
Drawback: It demands technical expertise and initial setup time, plus ongoing maintenance to handle API changes, which might overwhelm non-technical users.
Note: Coupler.io’s TikTok Ads connector uses TikTok’s API under the hood. This way, Coupler.io handles the technical complexity, so you can simply select your data and destination without writing code.
The value of tracking GMV in TikTok
For anyone running TikTok Shop, especially after its explosive growth in 2024, the focus has shifted from just racking up likes and views. Now it’s all about the key number (GMV) that shows how your advertising is translating into real money. Track GMV properly, and you’ll have a clear picture to scale and make choices that strengthen your bottom line.
Why GMV matters
Unlike surface-level engagement metrics such as impressions or clicks, GMV directly measures revenue generation and makes it a cornerstone metric for understanding your campaign’s true business impact.
For TikTok Shop sellers, GMV serves as the definitive performance indicator. It enables you to evaluate campaign return on investment with precision and identify which products, videos, or creatives drive the most revenue. This direct connection between advertising efforts and sales outcomes transforms how you allocate budgets and scale your business.
While vanity metrics like views and engagement rates offer insights into audience interest, GMV reveals what actually converts browsers into buyers. This allows you to make data-driven decisions about which campaigns deserve increased investment and which need optimization or discontinuation.
Role in the TikTok ecosystem
GMV includes both ad-driven (paid) and organic sales. When you run GMV Max campaigns, the system tracks sales from multiple touchpoints: paid video ads, organic content, affiliate promotions, and even the Shop Tab. This holistic tracking reveals the true impact of your marketing efforts. If an affiliate promotes your product in their video and a viewer later converts through your paid ad, the system accounts for that contribution in incremental GMV. This attribution model ensures you understand how different traffic sources work together to drive revenue.
The distinction between total GMV and Direct GMV also matters. Direct GMV refers to sales generated by placing orders directly from creator content, while total GMV includes all orders placed within 14 days of clicking the product.
Business benefits
GMV Max campaign reports provide multiple strategic advantages that extend far beyond basic performance monitoring:
| Benefit | Description |
| Better inventory planning | When you track GMV over time, you start seeing clear patterns in how fast products are actually selling (in real dollars). That makes it much easier to figure out how much stock to keep on hand, when to reorder, and how much warehouse space you’ll need. The result? Fewer frustrating stockouts when demand spikes, and less money sitting idle in excess inventory. |
| Smarter creative decisions | GMV shows you exactly which videos, product shots, and messages are driving actual purchases. Once you spot the winners, you can put more budget behind them or create similar variations. |
| Knowing where you stand | It’s hard to tell if you’re doing well without something to compare against. For e-commerce, a good ROI usually falls between 150% and 250%, and TikTok ads often deliver a short-term ROAS of 4x to 12x. To see if your campaigns are competitive or if it’s time to change your approach, check how your GMV numbers stack up against these benchmarks. |
| Comparing apples to apples across platforms | Every marketplace has its own fees and rules, which can make sales numbers look different from one channel to the next. GMV provides a consistent dollar figure no matter where the sale happened ( e.g., TikTok Shop, Shopify, Amazon, etc.). |
| Strategic planning | GMV allows you to look back at past sales trends to forecast what’s coming, set realistic targets, and line up your inventory and marketing plans accordingly. It’s the forward-looking insight that helps you stay ahead and make financial projections you can trust. |
Gain clearer TikTok Ads and Analytics insights through pre-built dashboards
Now that you understand how to set up TikTok Ads data export with Coupler.io, why stop there? We’ve built a couple of ready-made dashboard templates that help you visualize TikTok Ads data and provide you with actionable insights. These templates pull your data automatically on whatever schedule you set.
TikTok Ads dashboard
This ready-to-use dashboard provides a comprehensive, at-a-glance view of your TikTok advertising campaigns with automated data updates, trend visualizations, and detailed breakdowns for data-driven optimization.
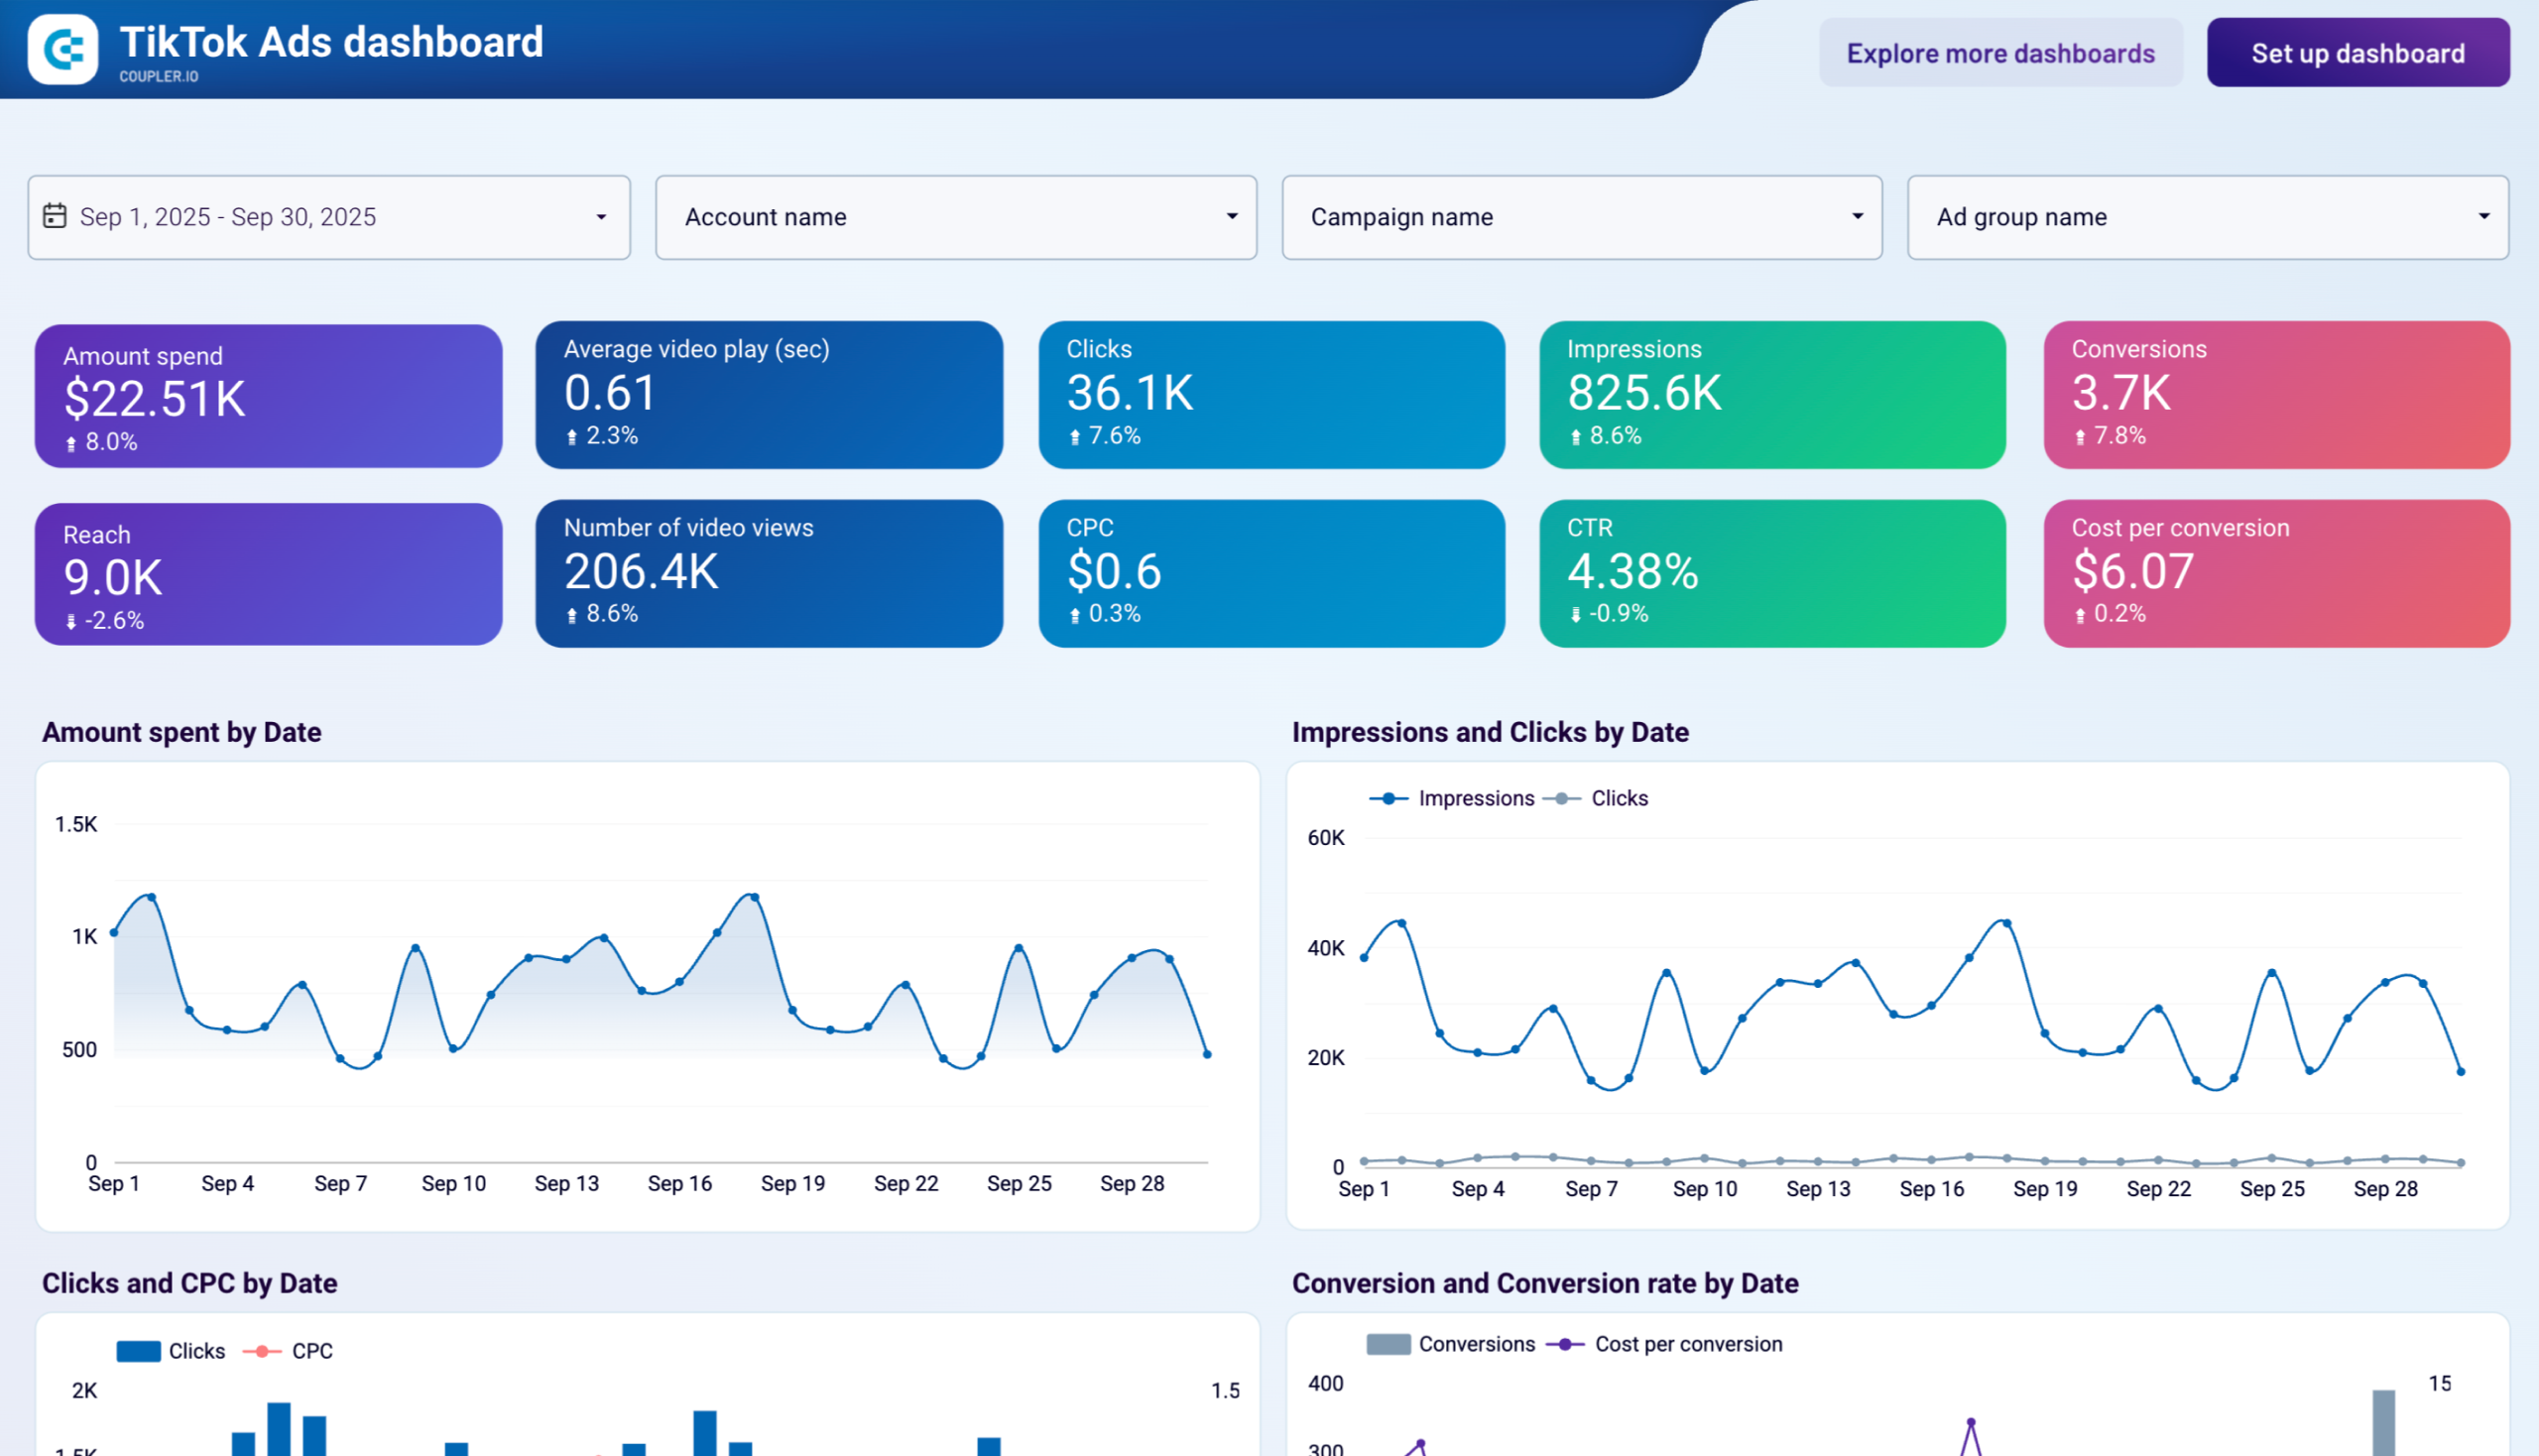
What insights the dashboard provides:
- Overall performance snapshot: Track total spend, impressions, clicks, conversions, reach, and essential ratios such as CPC, CTR, CPM, and cost per conversion.
- Trend analysis over time: Monitor daily changes in spend, impressions, clicks, conversions, and costs to quickly identify spikes, drops, or emerging patterns.
- Demographic and geographic breakdowns: View conversions and engagement segmented by age, gender, platform, country, and region to understand audience response.
- Campaign and ad group comparison: Use sortable tables to rank campaigns and ad groups by key metrics like video views, spend, clicks, CTR, and conversions.
- Creative performance check: Analyze average watch time, total video views, and top-performing videos to determine which creatives capture and hold attention best.
How to use
This pre-built TikTok Ads dashboard template in Looker Studio runs on the Coupler.io TikTok Ads connector. That means your data refreshes automatically on whatever schedule you set. To get it up and running, follow the simple instructions in the Setup guide tab of the template. It takes a couple of minutes, and you’ll end up with a fully populated dashboard showing your own TikTok Ads data.
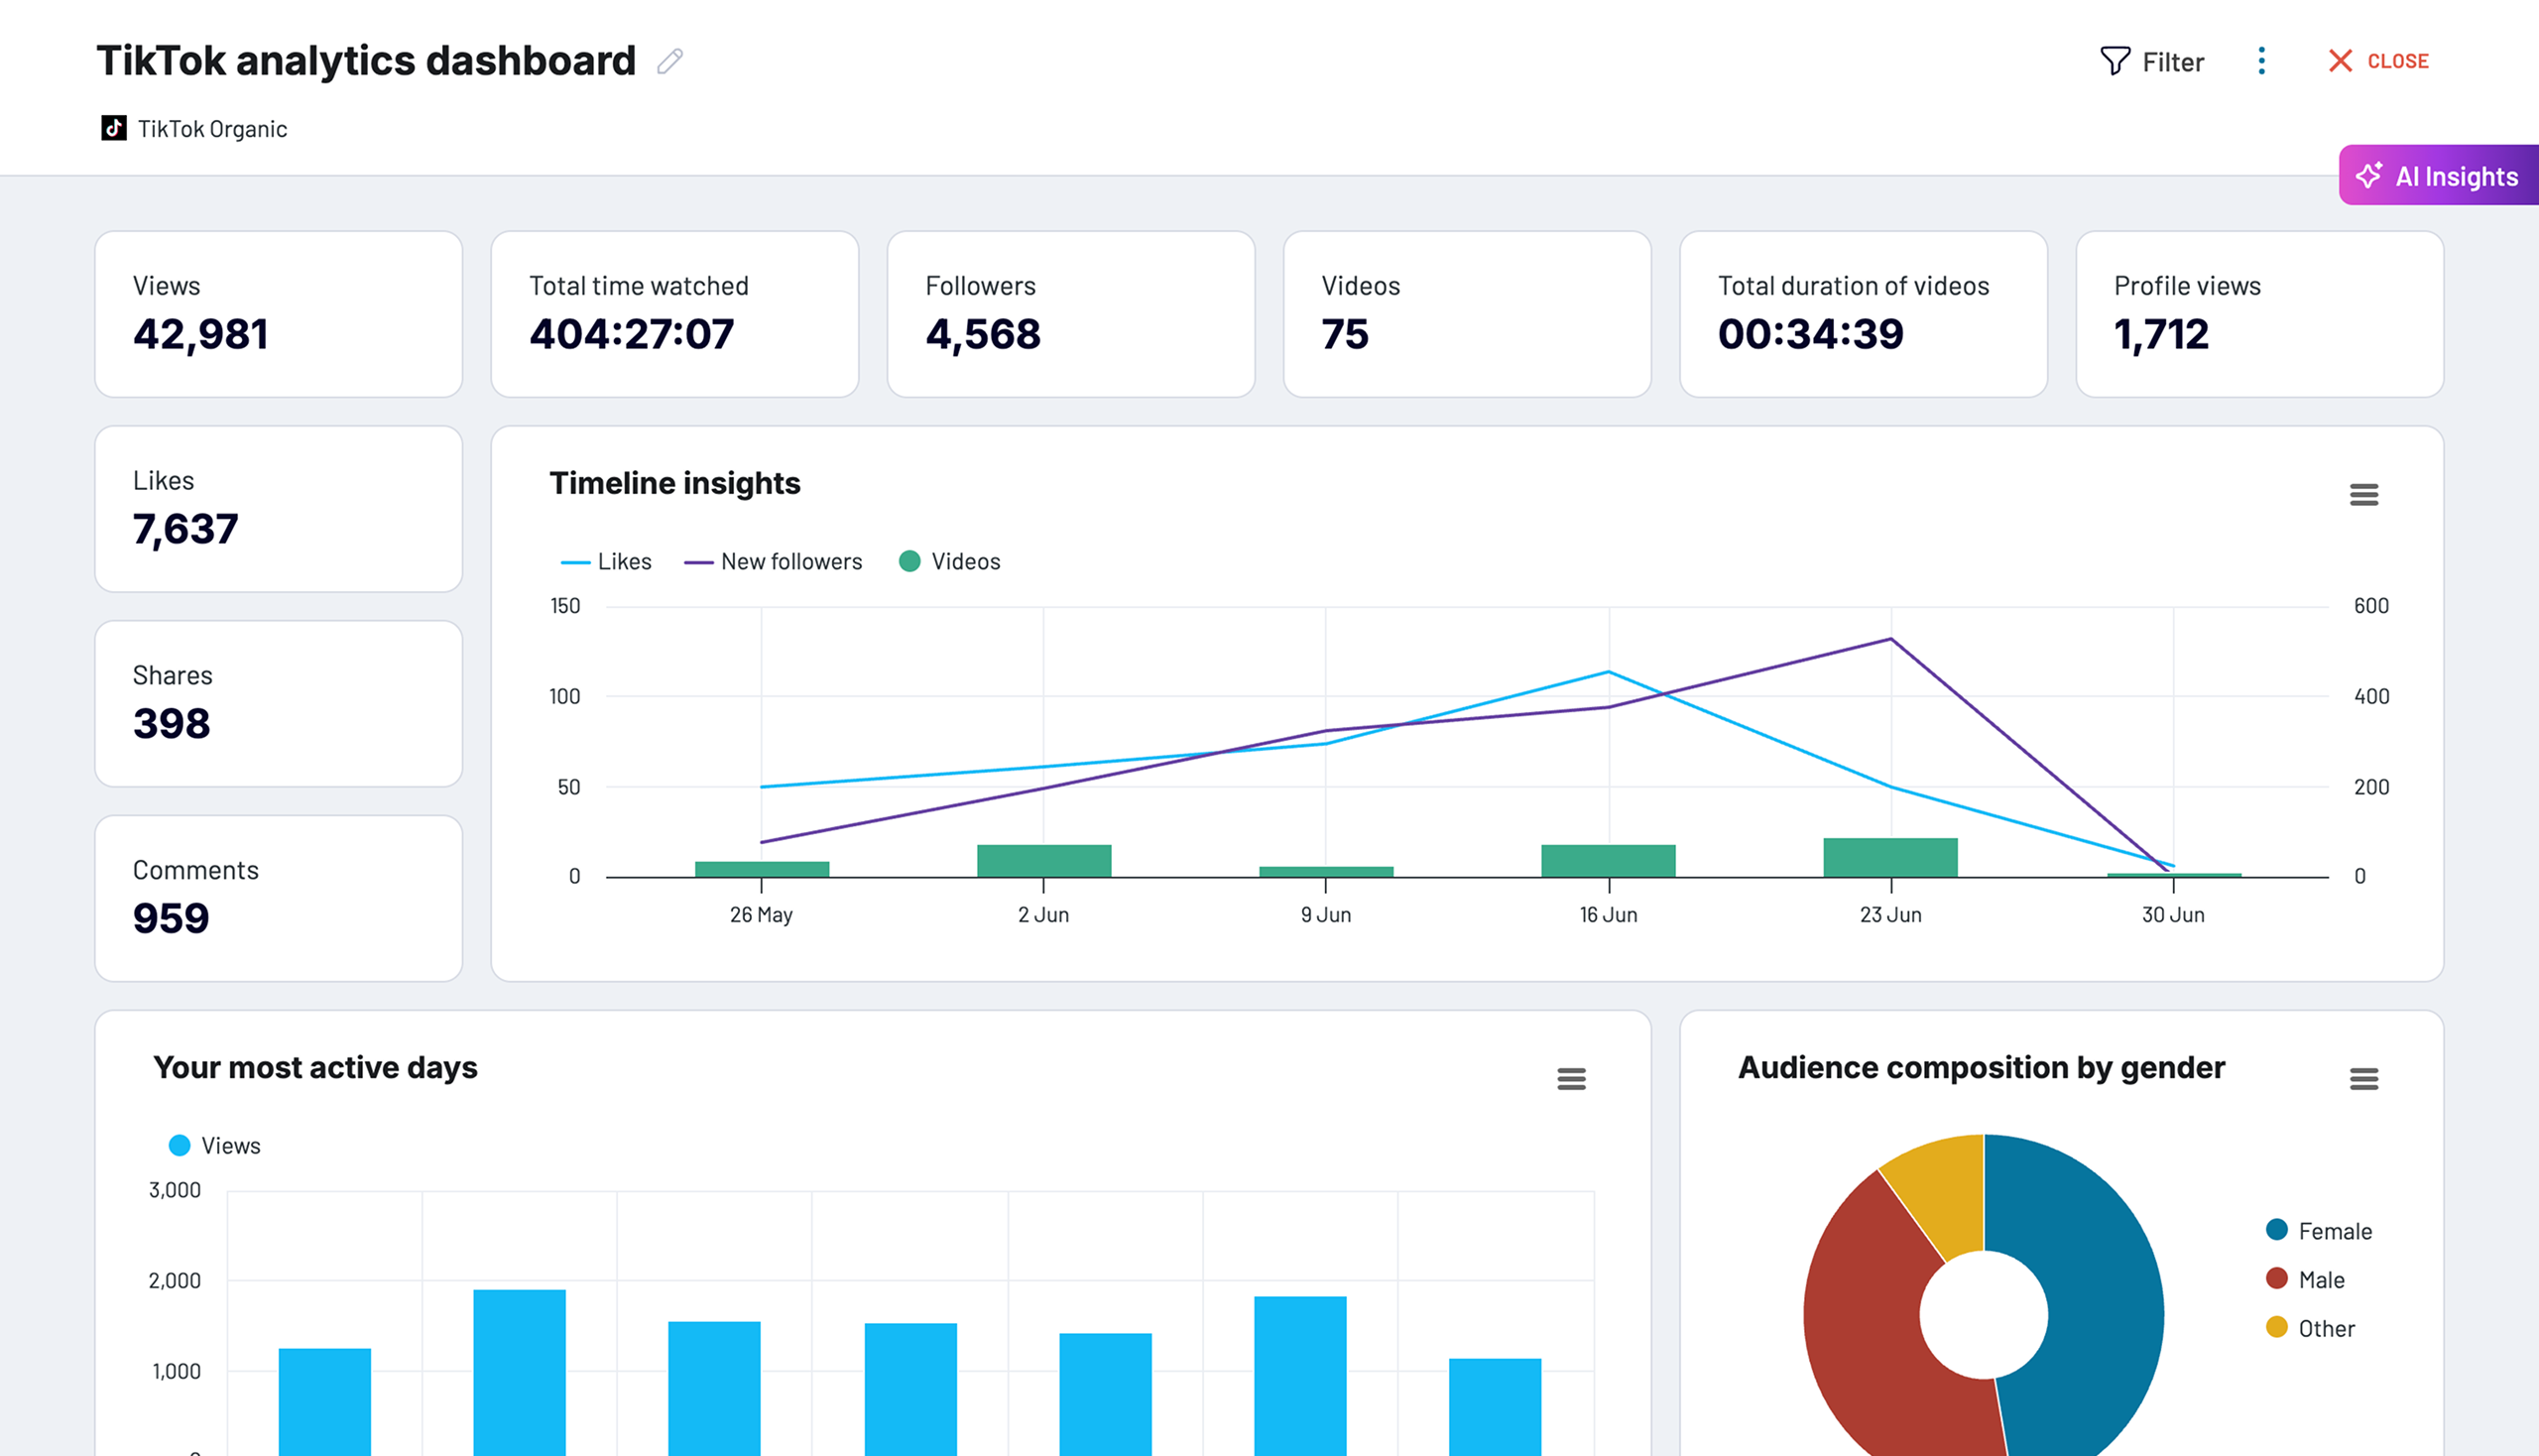
TikTok Analytics dashboard
This dashboard helps you keep tabs on your organic TikTok content and audience engagement. It comes with automatic data updates, helpful trend charts, and in-depth breakdowns, so you can understand what’s working and grow your channel smarter.

What insights the dashboard provides:
- Overall engagement snapshot: Track totals for video views, total watch time, likes, comments, shares, followers gained, profile visits, and videos posted.
- Growth and activity trends over time: Follow changes in likes, followers, profile views, and posting activity with timeline charts to spot growth periods or dips.
- Engagement funnel: See how views progress to likes, shares, and comments for a clear picture of audience interaction.
- Best performing days: Bar charts reveal which days of the week drive the most views and engagement to optimize your posting schedule.
- Audience demographics: Break down your viewers by gender (donut chart) and top countries/regions (map and bar charts) to better understand who you’re reaching.
- Top videos performance: A sortable table ranks your videos by views, watch time, likes, shares, comments, duration, and more to identify what resonates best.
How to use
Coupler.io offers this TikTok analytics dashboard as a native dashboard or a Looker Studio template. Same as with the previous dashboard, your TikTok analytics data refreshes automatically on whatever schedule you pick. To start using the dashboard, follow the guidelines in the Setup guide tab of the template. Within several minutes, you’ll get a fully populated dashboard showing your own TikTok organic data.
Coupler.io native dashboards contain a useful, advanced feature — AI insights. It gives you a smart, AI-powered overview of your dashboard. It pulls out the most important trends, spots potential wins or red flags, and helps you make solid decisions without getting lost in the details. On top of that, it shares practical tips on how to change your strategies and campaigns to get better results overall.
TikTok analytics dashboard
Track your TikTok content performance with comprehensive metrics on video views, engagement rates, audience demographics, and follower growth to maximize your social media marketing impact.


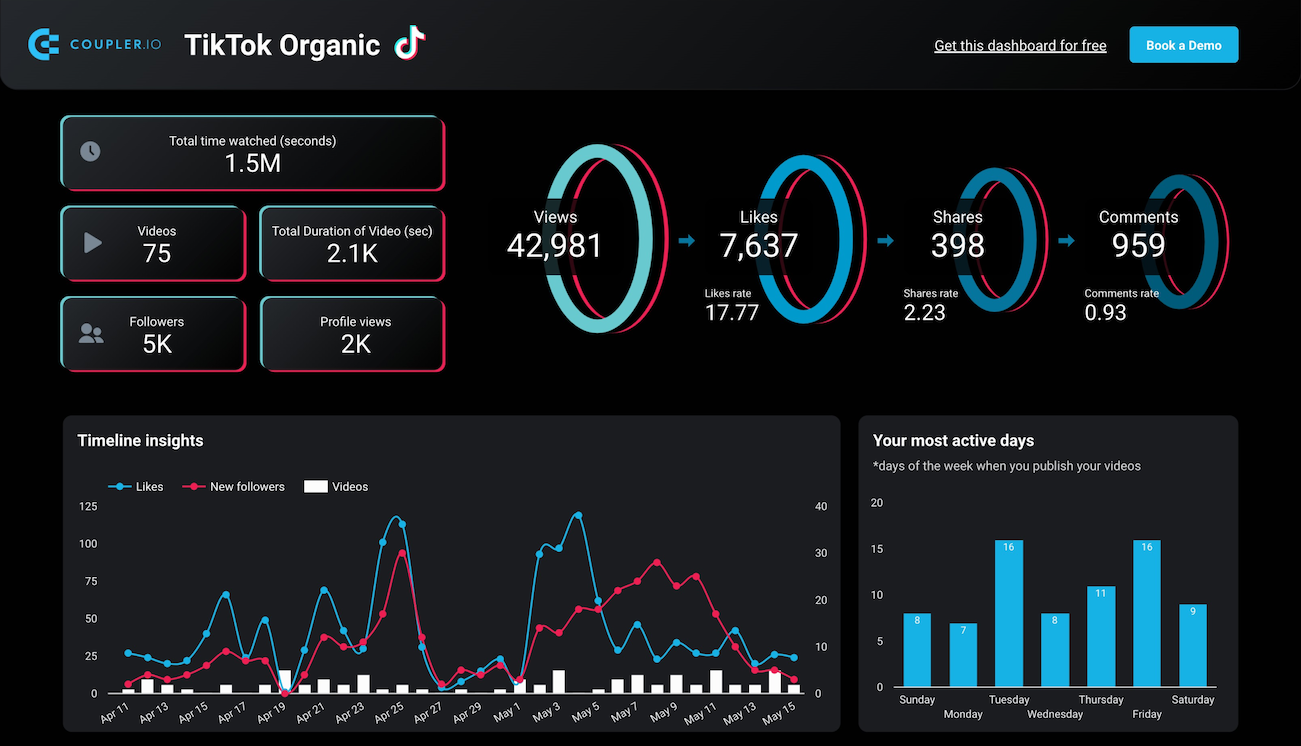
TikTok analytics dashboard in Looker Studio
Get an overview of TikTok data and metrics that provide insights into how your content performs on the platform.

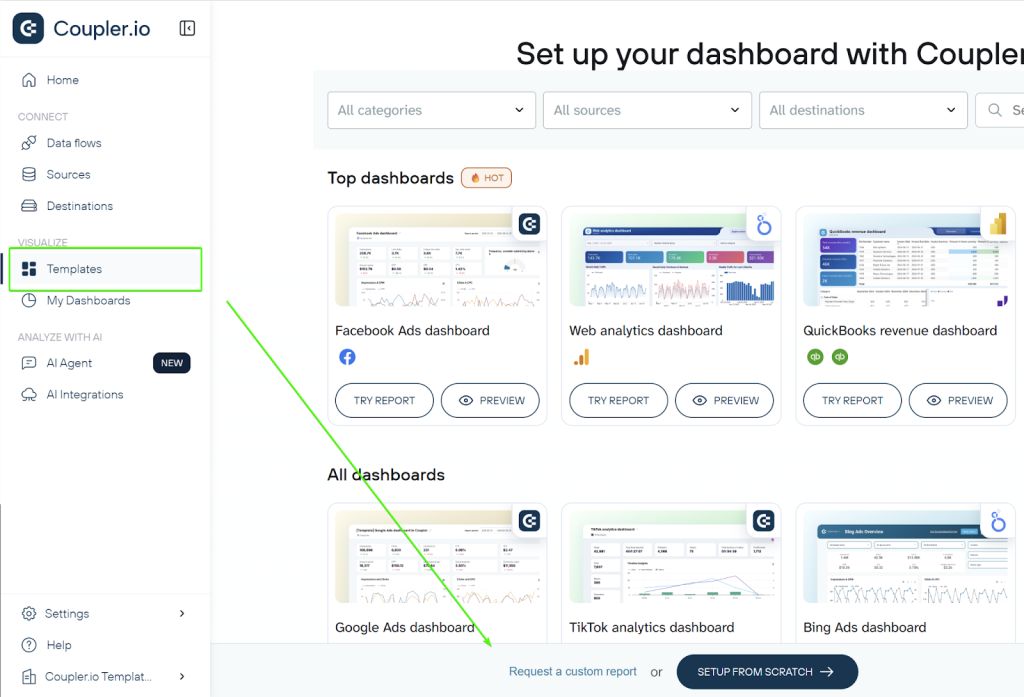
And if there’s no dashboard template for your specific use case, you can always request a custom report and create one from scratch.
To do so, go to your Coupler.io account, open the Templates tab, and select “Request custom report” at the bottom of the screen.
Why choose Coupler.io for exporting TikTok GMV Max reports?
TikTok’s native reporting tools limit automation and ease of export for GMV Max campaigns. Coupler.io offers a reliable alternative that simplifies the process end-to-end. Key advantages include:
- Effortless setup with no coding required; secure OAuth authentication to connect TikTok Ads accounts in minutes.
- Direct integration with the TikTok Ads API ensures access to complete GMV Max metrics such as total sales value, ROAS, orders, and conversions.
- Flexible scheduling for automatic data refreshes, as frequent as every 15 minutes for active campaigns or daily/weekly as needed, to keep reports current.
- Built-in transformation tools to clean, filter, merge, or calculate fields directly within the platform.
- Seamless exports to popular destinations, including Google Sheets for quick reviews, Excel for team sharing, BigQuery for advanced analysis, or Looker Studio for visualizations.
Ultimately, if you’re managing GMV Max campaigns and need consistent, automated reporting that fits into your current tools, Coupler.io makes reporting way easier and less stressful. It makes cross-campaign analysis and multi-channel blending much more manageable and helps you escape the limitations of TikTok’s native reporting setup.


