Influencer marketing dashboards centralize all of your key insights into one place in real-time. This allows you to see what content and strategy drive the best results for your business.
Luckily, creating a dashboard from scratch is no longer needed. This is because solutions like Coupler.io offer ready-to-use influencer dashboard templates that you can set up in minutes!
In this article, we explore 5 must-have influencer dashboards for content creators, brands, and marketing teams. You will also find tips on automating data updates to your dashboard to ensure accurate and up-to-date data. Let’s dive in!
Top 5 influencer marketing dashboards to have in 2026
These are the 5 best influencer dashboards to monitor real-time performance across popular social media platforms, including Instagram, TikTok, YouTube, and LinkedIn in 2026.
1. Instagram business dashboard
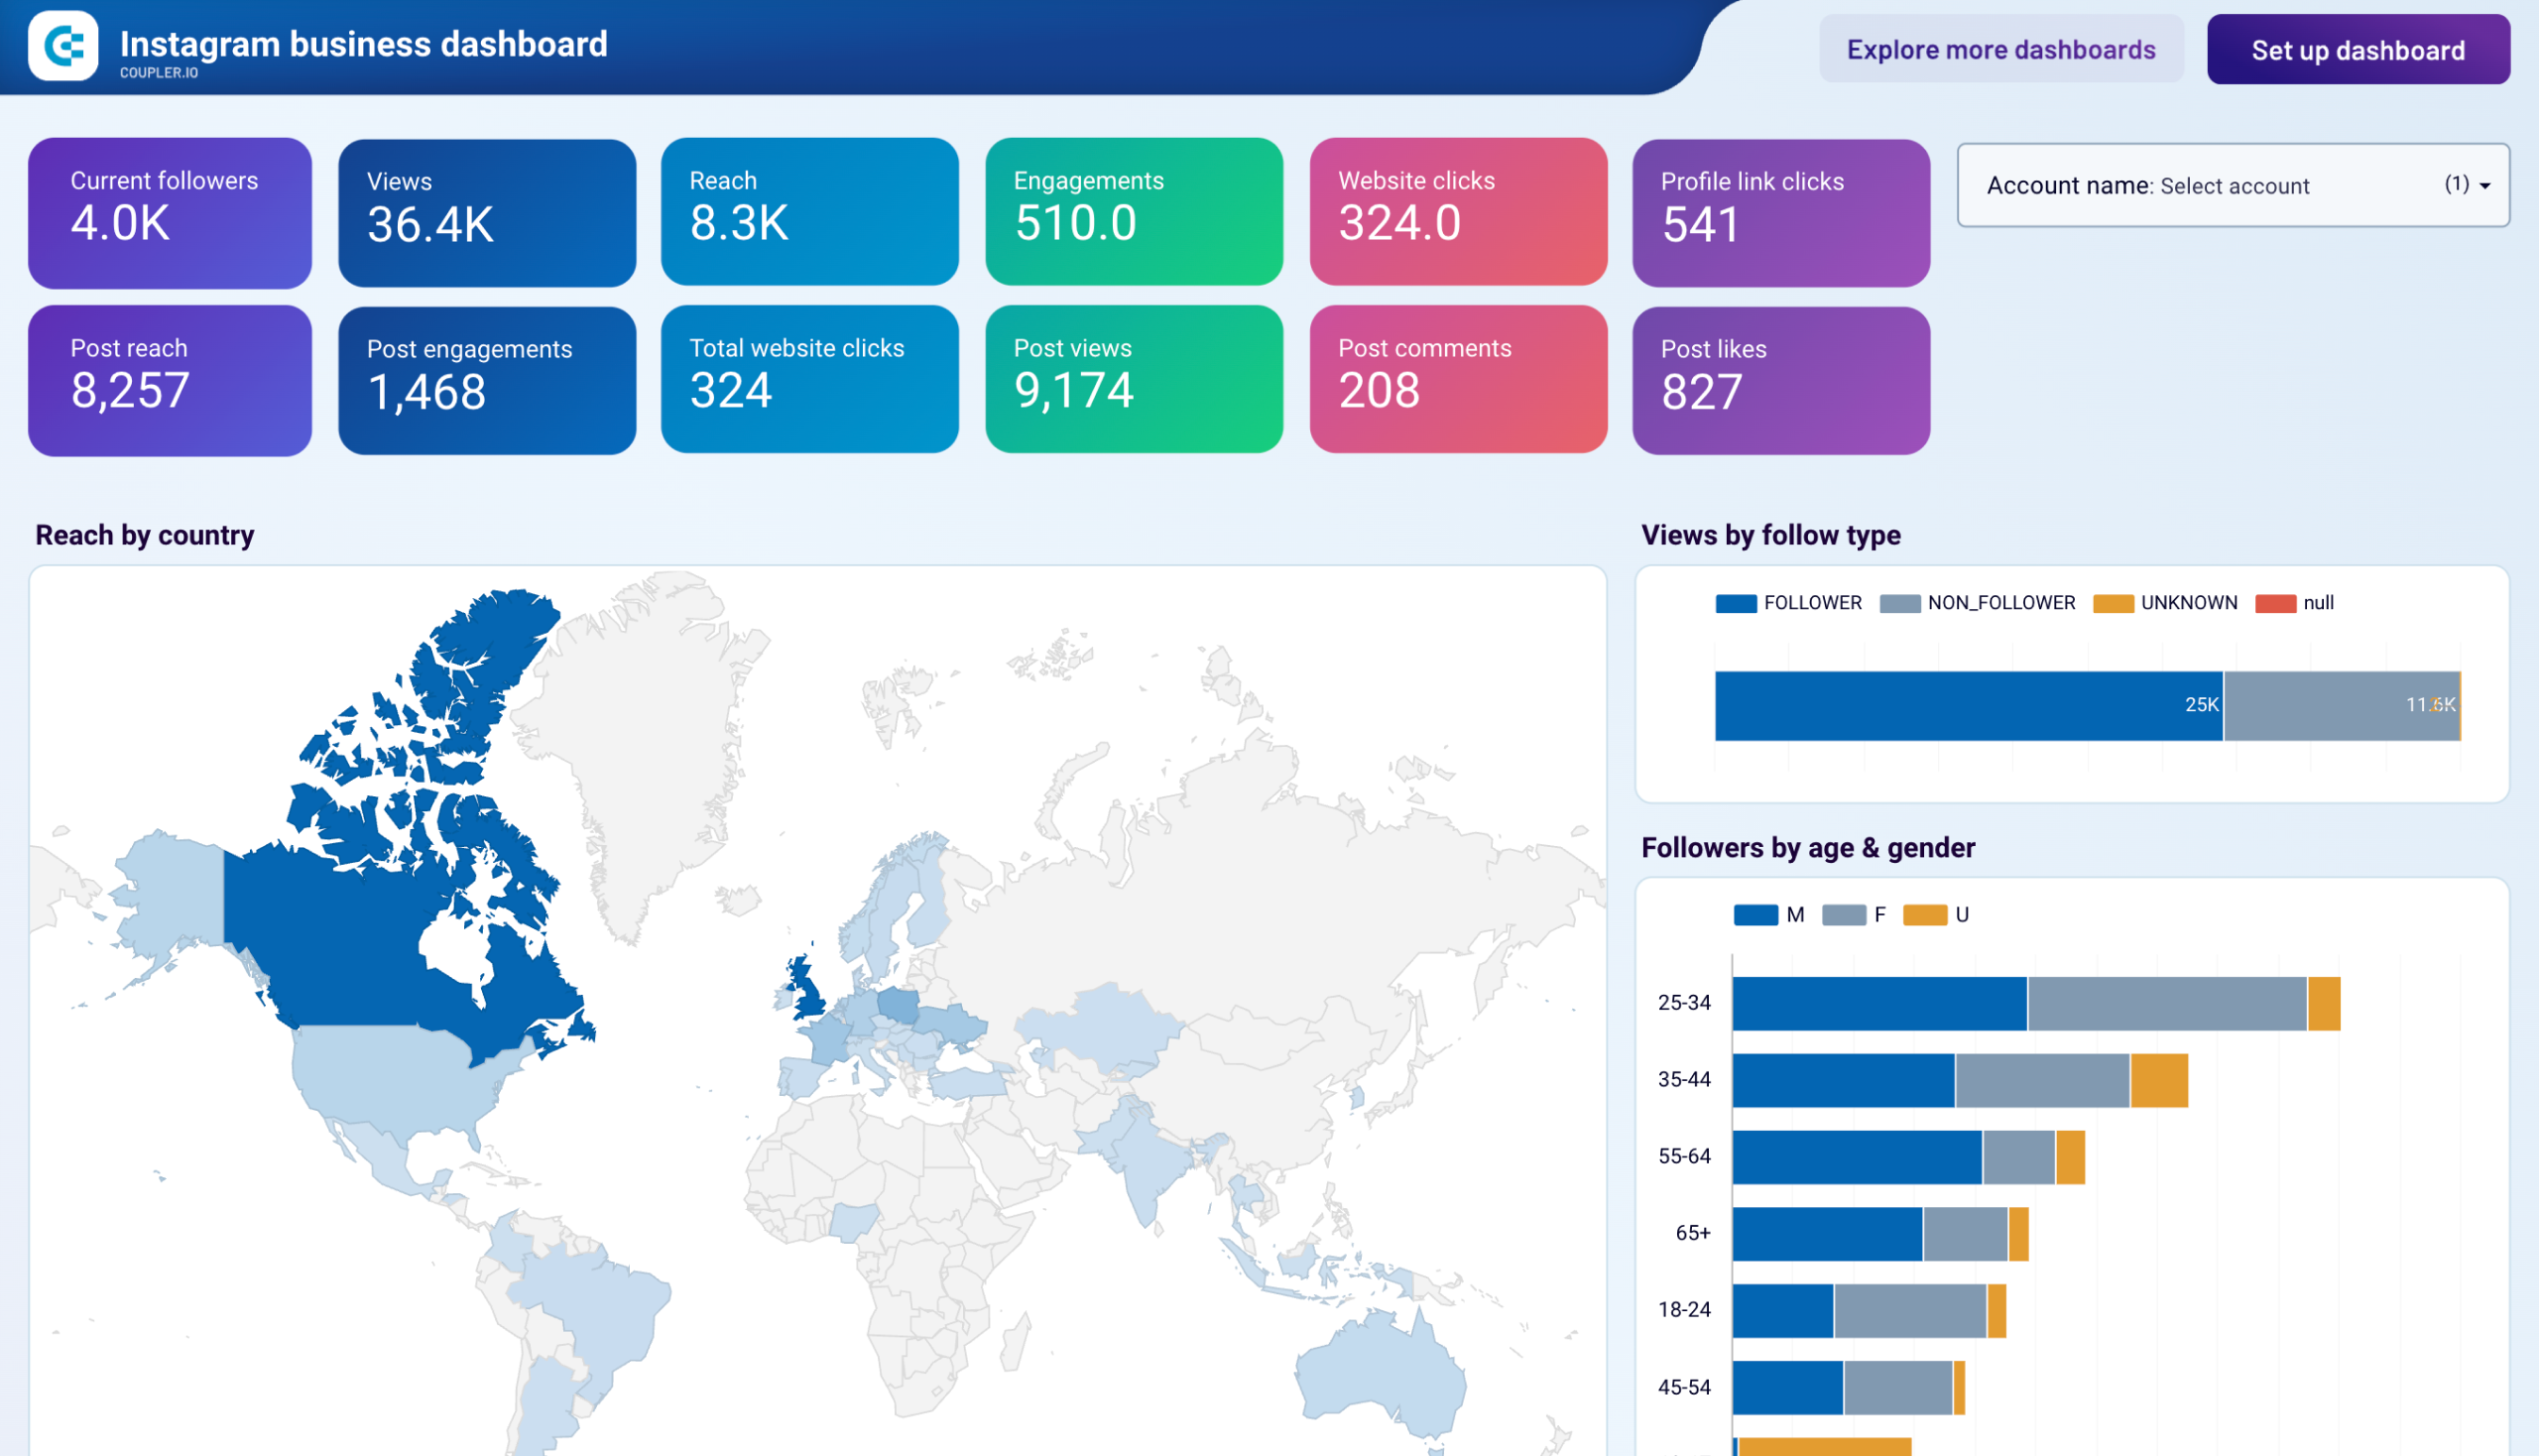
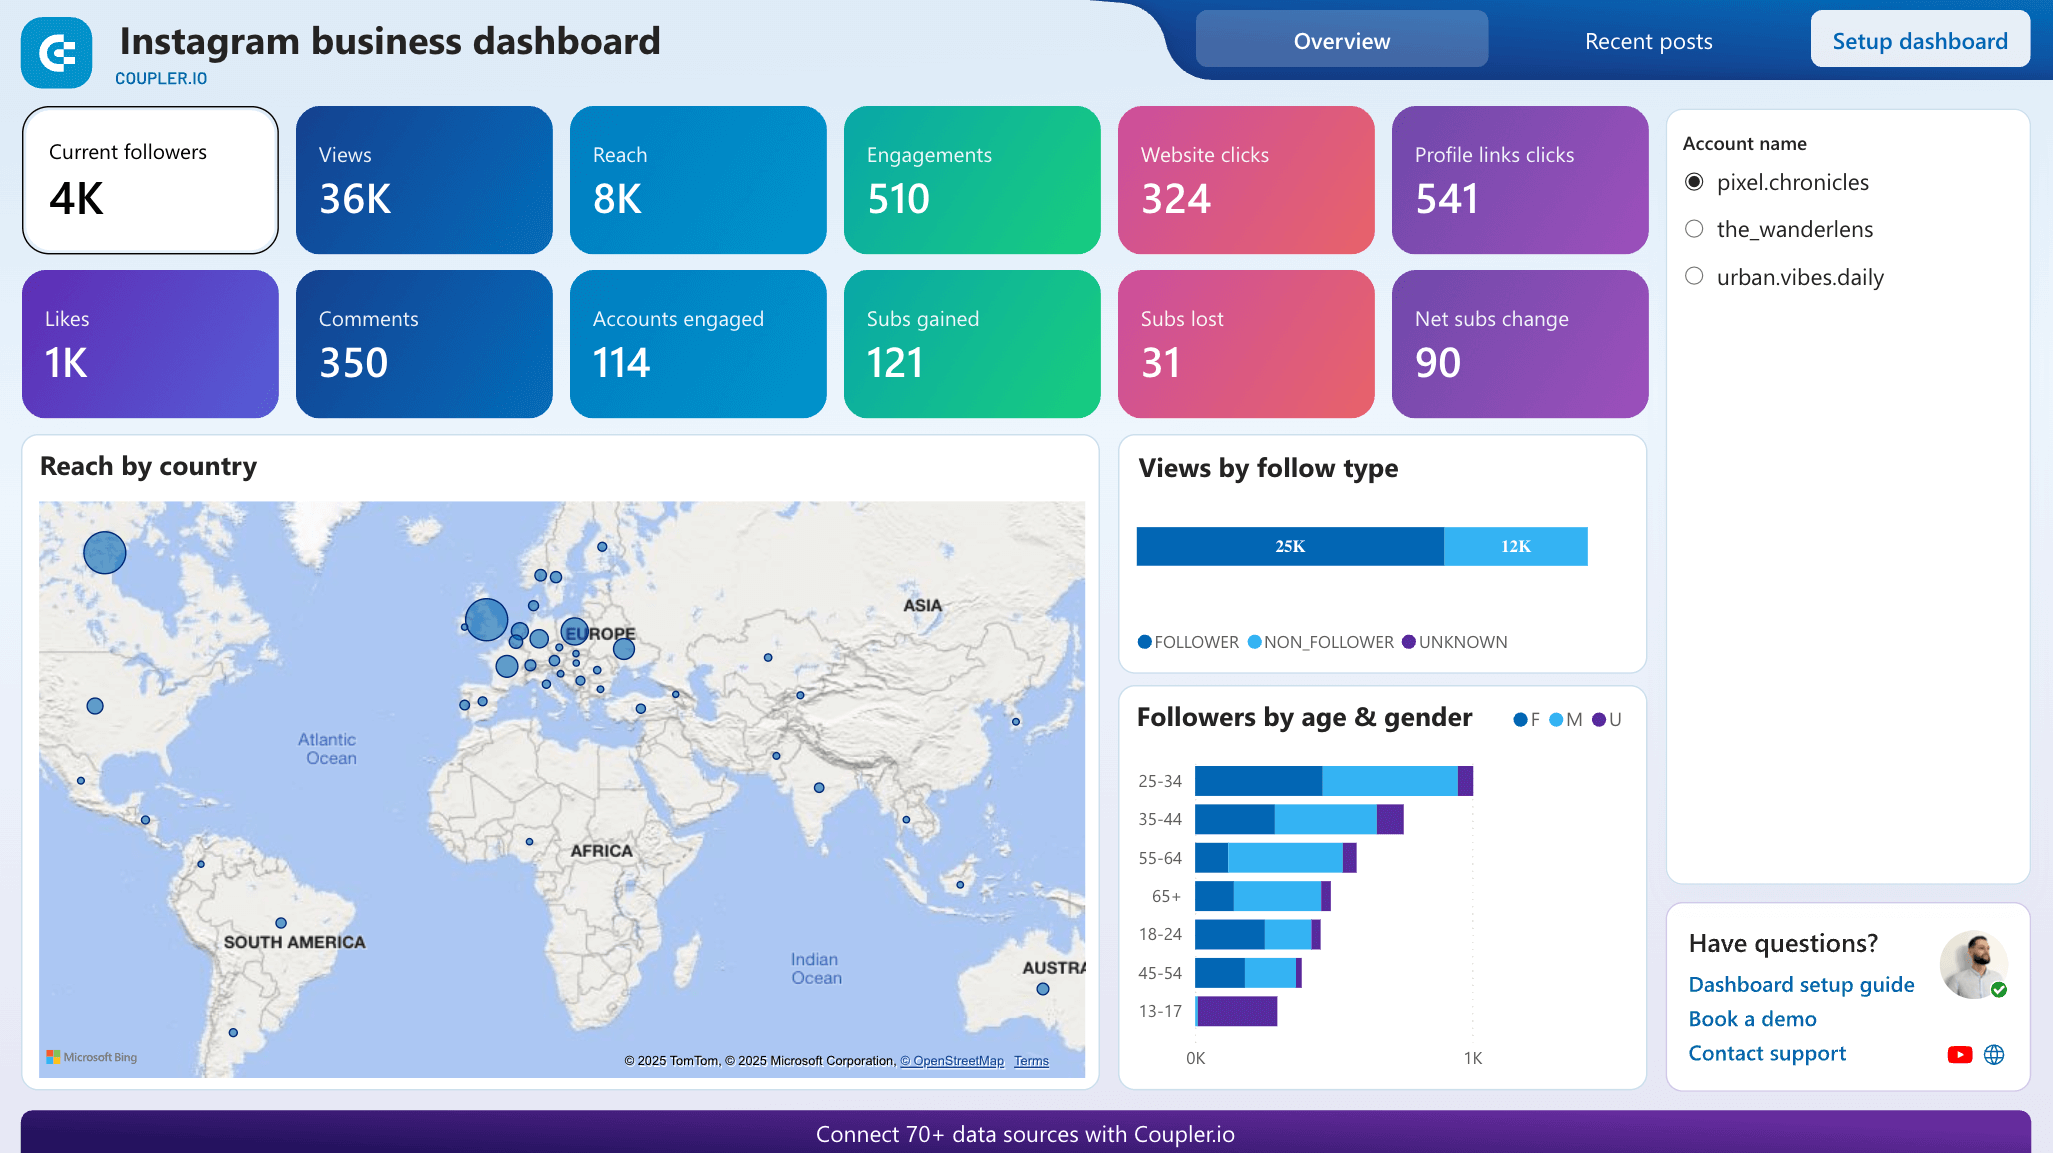
This Instagram business dashboard helps you understand what content actually drives results for your account. Unlike Instagram’s basic analytics, it organizes performance data to show how your content generates website clicks, shares, comments, profile actions, and more. You can also add multiple accounts to the dashboard and track their results separately.
To use the dashboard template in Looker Studio or Power BI, you only need to sign up to Coupler.io for free and connect your Instagram business account.
What insights the dashboard provides
Let’s take a closer look at the sections included in this Instagram business dashboard.
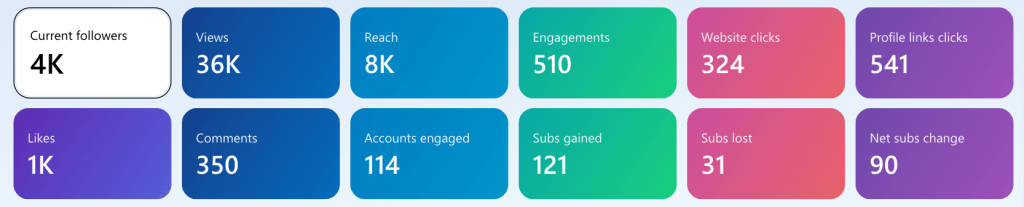
At the top of the dashboard, key metrics scorecards display Instagram business metrics, including views, reach, current followers, website clicks, comments, shares, subscribers gained/lost, and profile link clicks. It allows you to assess performance and prove account value quickly.
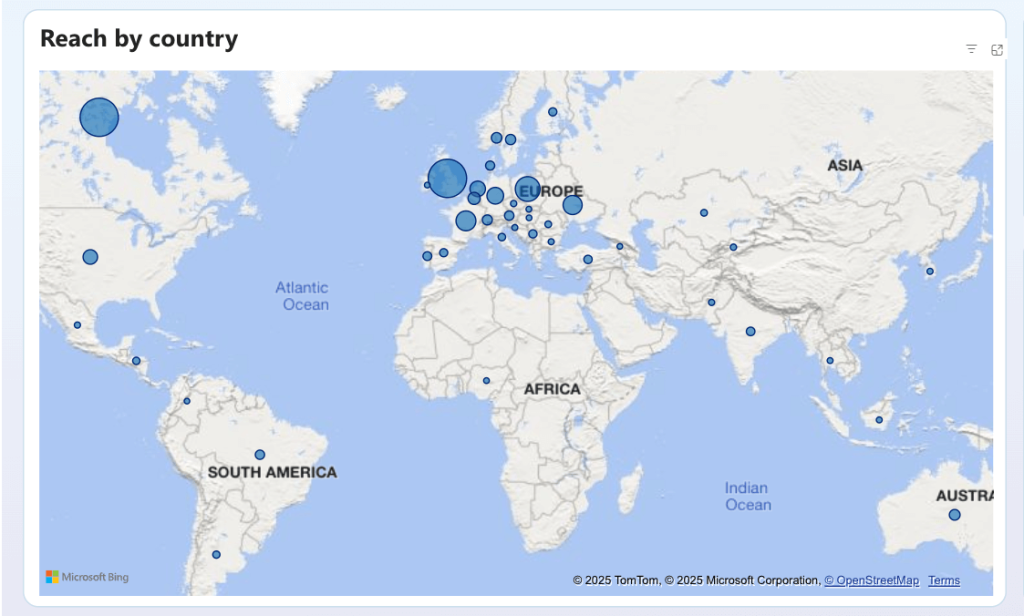
The reach by country map shows where your Instagram content is being seen globally through an interactive map. You can identify your most engaged markets and optimize your content strategy for different regions and time zones.
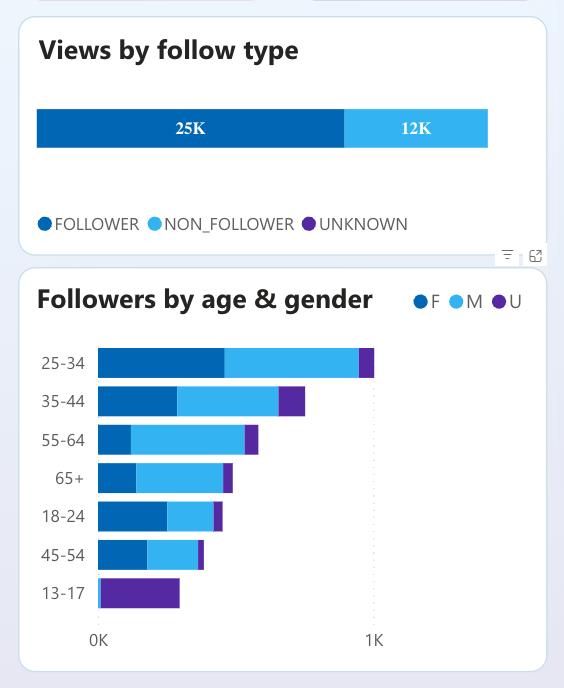
Meanwhile, demographic insights charts reveal your audience composition through breakdowns of views by follow type (follower vs. non-follower vs. unknown) and followers by age and gender. This helps you understand whether you’re reaching your target demographic and if your content appeals to existing followers versus new audiences.
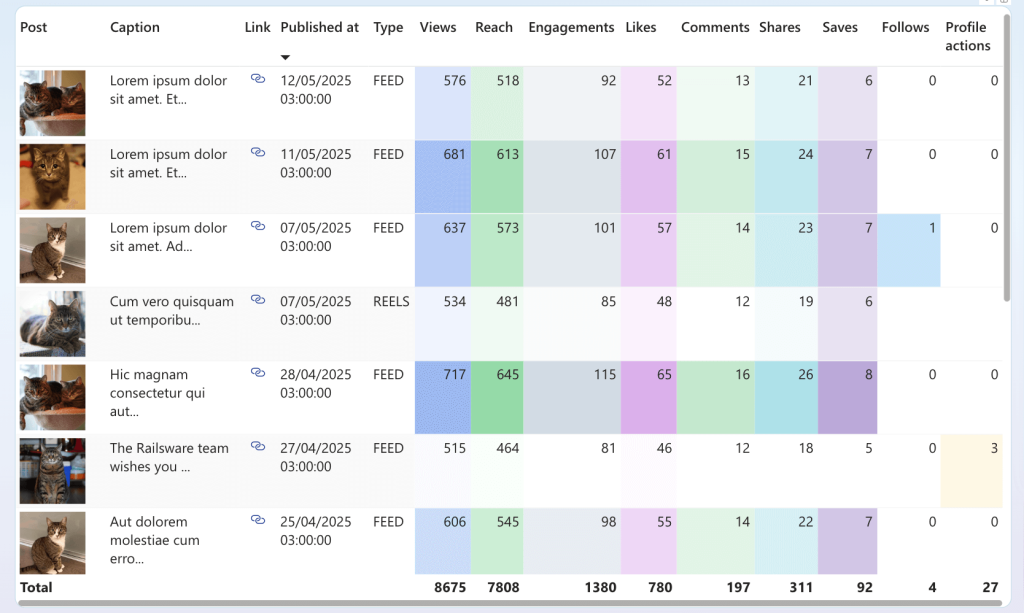
Lastly, the content performance table shows how different types of posts perform on your account. You can compare how feed posts vs. reels generate reach, engagement, and profile actions to focus your content creation efforts on the formats that deliver the best results.
What metrics you can track
Now, let’s take a look at all the Instagram metrics you can track using this influencer marketing dashboard template.
| Metrics | Description |
|---|---|
| Views | Tracks how many times your Instagram content was viewed. An essential metric for understanding content visibility and measuring audience interest across post types. |
| Reach | Reveals how many times your post has been shared. A high number of shares reflects compelling and share-worthy content, increasing the chance of higher impressions, reach, and profile visits. |
| Current followers | Indicates your total follower count, allowing you to track overall account growth at a glance. |
| Likes | Highlights how many people like your post. Best for identifying which posts resonate most with your audience. Useful for creating an engagement strategy by understanding audience preferences. |
| Subscribers gained/lost | Tracks newly acquired followers and users who unfollowed your account. Provides insight into follower dynamics and their impact on content performance. |
| Shares | Shows how many times the content was shared. Critical for measuring content virality and organic reach expansion. |
| Engagements | Tracks total interactions, including likes, comments, shares, and saves. Helps you quickly assess audience engagement and content performance. |
| Comments | Counts the comments your posts generate. Great for measuring engagement depth and content that sparks conversations. |
| Website clicks | Highlights how many people like your post. Best for identifying which posts resonate most with your audience. Useful for creating an engagement strategy by understanding audience preferences. |
| Profile link clicks | Shows clicks on bio links. Essential for measuring how effectively your profile converts users into website traffic. |
| Net subscriber change | Calculates the difference between followers gained and lost. It helps you gauge true account growth and the effectiveness of your content strategy. |
Instagram business dashboard in Looker Studio
Evaluate Instagram marketing performance with detailed metrics on post engagement, reach, follower demographics, and content effectiveness. Understand audience behavior and optimize your social media strategy.


Instagram business dashboard in Power BI
Evaluate your Instagram marketing performance with detailed metrics on post engagement, follower growth, and content effectiveness to understand audience behavior and optimize your social media strategy.

2. TikTok analytics dashboard
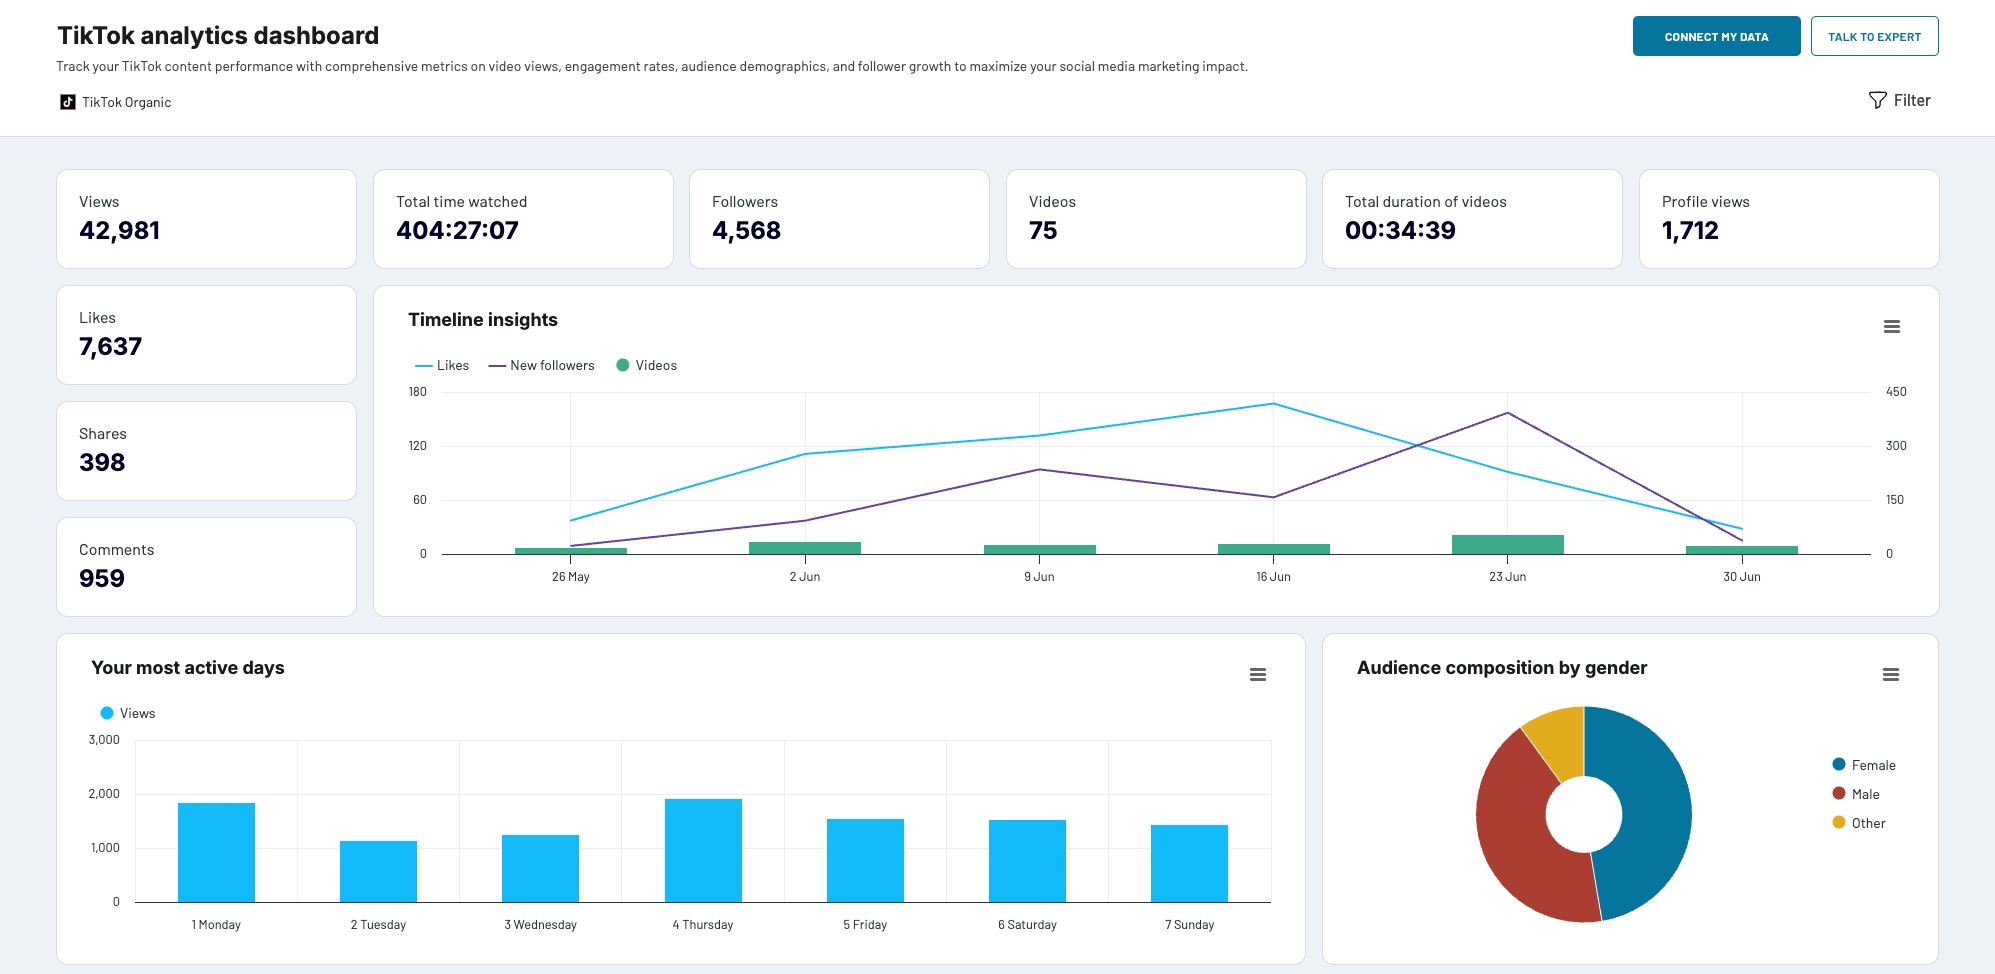
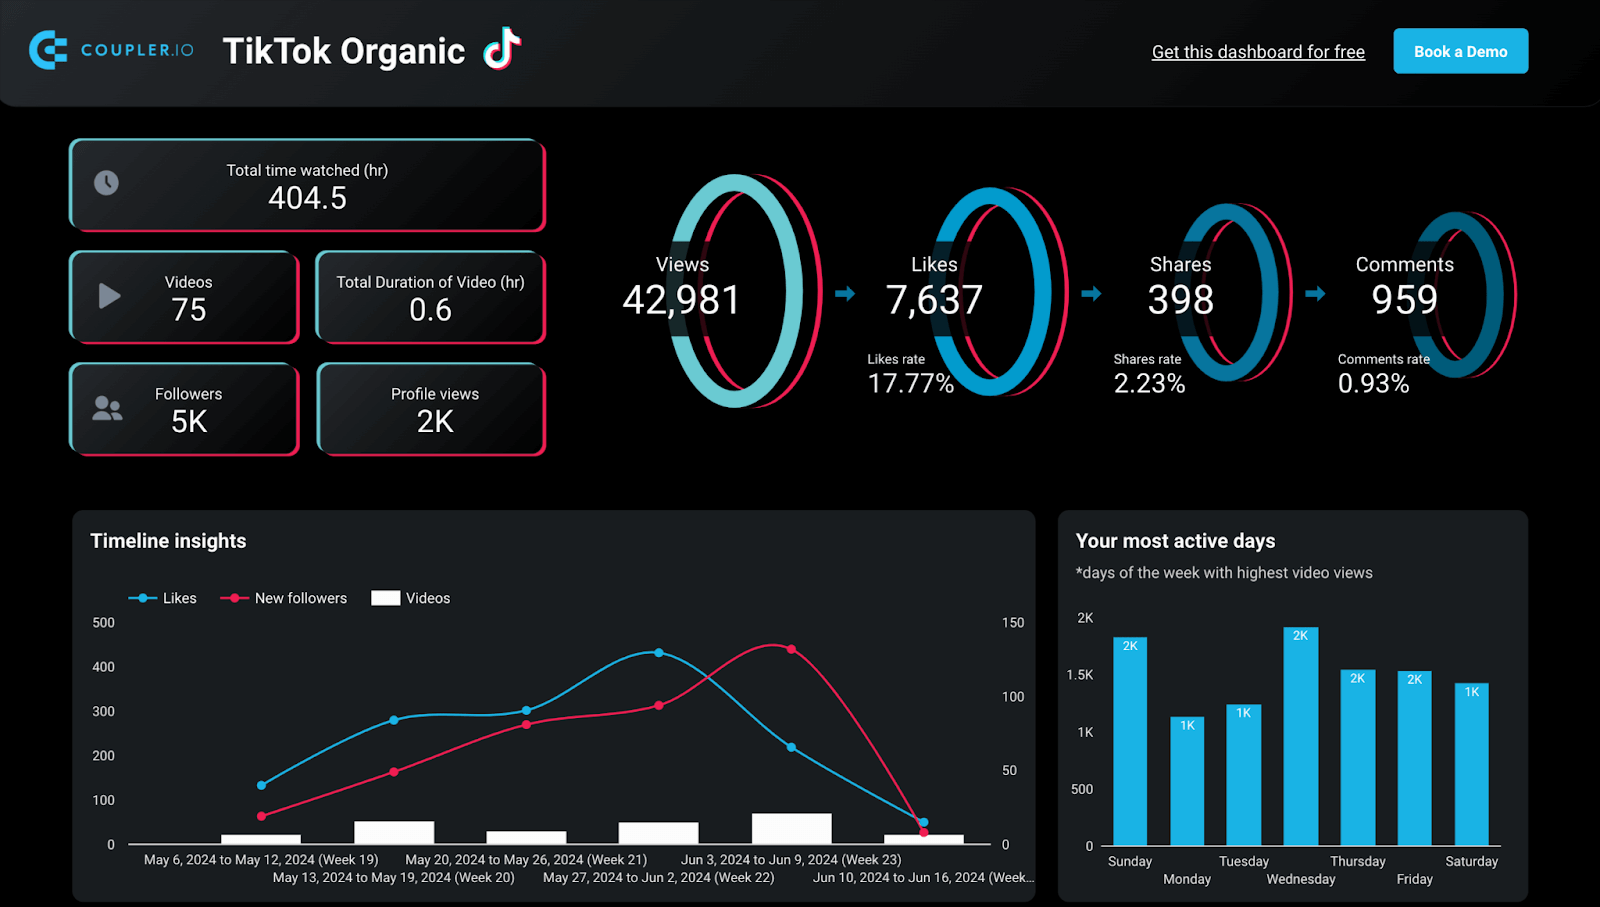
This influencer dashboard template is essential to track and gain insights into TikTok. It provides key metrics such as views, likes, shares, comments, total time watched, and more. This TikTok analytics dashboard also comes with a complete overview of your best videos, audience gender, top countries by views, most active days, and timeline insights. The template is designed in Coupler.io and Looker Studio. It is equipped with a no-code connector to load data from your TikTok account hassle-free.
What insights the dashboard provides
Here’s a breakdown of what you can track using this influencer marketing dashboard.
The timeline insights show how your videos perform over time by tracking likes and new followers. This helps identify trends and understand the type of content your audience likes the most. Influencers can refine their content strategy based on this insight and create more similar content to attract more followers and increase engagement.
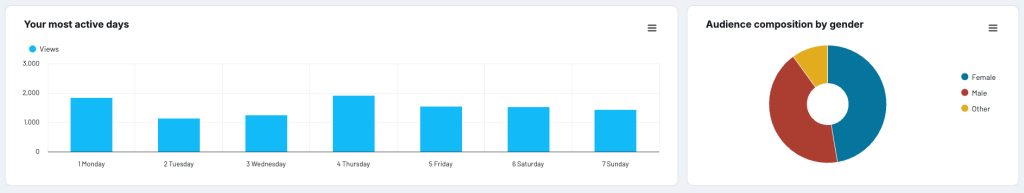
In your most active days section, you can see what days of the week bring in the most views. This insight is great for scheduling posts and content for maximum reach and interaction. There is also a donut chart for analyzing your audience composition by gender.
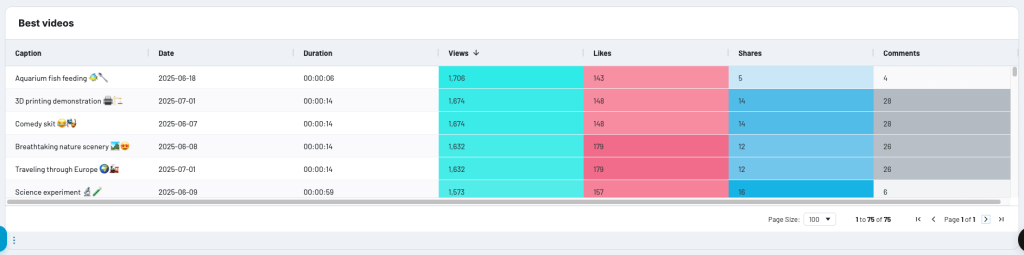
Scrolling to the bottom of the template, you’ll find a table for the best videos. You can filter information by date, duration, views, likes, shares, and comments.
This table comes in handy for performing content analysis. Influencers can identify patterns by comparing different metrics and understand which types of content perform best. For instance, you can assess the duration of top-performing videos to determine the best length for maximum engagement.
Another great thing you can do from the information in this table is content repurposing and content update. Create similar content to your top-performing videos and create follow-up posts on topics that the audience engages with the most. This keeps your audience entertained and active, while also boosting engagement and reach to your influencer profile.
What metrics you can track
Now, let’s take a look at a brief overview of all metrics included in the dashboard template.
| Metrics | Description |
|---|---|
| Views | Shows how many times your videos have been watched. This metric reflects content popularity and reach. Best for tracking trends and patterns in audience behavior and content performance. |
| Likes | Displays how many viewers liked your video. Best for tracking engagement and content preference. Use this metric to determine what content is most interesting to your audience. |
| Shares | Highlights how many times your video has been shared by viewers. This shows which type of content is noted as share-worthy by your audience, increasing views and total time watched. |
| Comments | Explores how actively your audience is engaging with your content. Be sure to use comments to gather viewers’ feedback and compile a list of ideas for future videos. |
| Total time watched | Shows the total amount of time viewers have spent watching your video. This indicates content quality. Higher total watch time shows that viewers enjoy watching your content for longer periods. This metric is best for tracking which videos have high total watch time to optimize future content. |
| Videos | Shows the number of videos you’ve posted on TikTok. Best for ensuring a consistent posting schedule and variety in content type to keep your audience engaged and attract new followers. |
| Total duration of videos | Reveals the total duration of your videos. Best for optimizing video length by finding your audience’s most preferred content duration. |
| Followers | Indicates the growth of your audience. Monitor this metric to assess how effective your content and strategy is at attracting new followers. Great for tracking follower milestones and engaging with your audience through special content. |
| Profile views | Shows the number of times your profile has been viewed. Great for analyzing spikes in profile views to assess what content drives viewers to check out your profile. |
TikTok analytics dashboard in Coupler.io
Get a complete view of your TikTok performance: discover who your audience really is, identify top-performing content, and track your strategy’s impact with this dashboard template.


TikTok analytics dashboard in Looker Studio
Unlock detailed insights about your TikTok audience, video engagement, posting habits, and content strategy success with this Looker Studio dashboard template.
3. YouTube dashboard
This YouTube dashboard template by Coupler.io includes all essential metrics to track for your channel. It provides data on key metrics like views, average view duration, new subscribers, likes, dislikes, comments, and shares. The dashboard also offers a complete overview of subscriber dynamics, top days for views, and audience demographics. Follow the instructions described in the Readme tab to connect your YouTube account and load influencer data to the Looker Studio template.

What insights the dashboard provides
Let’s dive right into the sections included in this YouTube dashboard.
On the Subscribers page, you can see graphics on gained and lost subscribers over time. It helps influencers to understand how their content impacts their subscriber count. From here, you can adjust content by analyzing what content attracts new subscribers and what might be causing them to unsubscribe from your channel.
This info is also useful to develop a content strategy to retain existing subscribers. For example, engaging with them through comments and repurposing content that receives a lot of positive feedback.

On the Reach page, you can see the dynamics of impressions and clicks by annotations, cards, and teaser. You also get a video performance breakdown by these key metrics. This allows you to create an effective content strategy to improve engagement and attract brand and influencer partnerships.

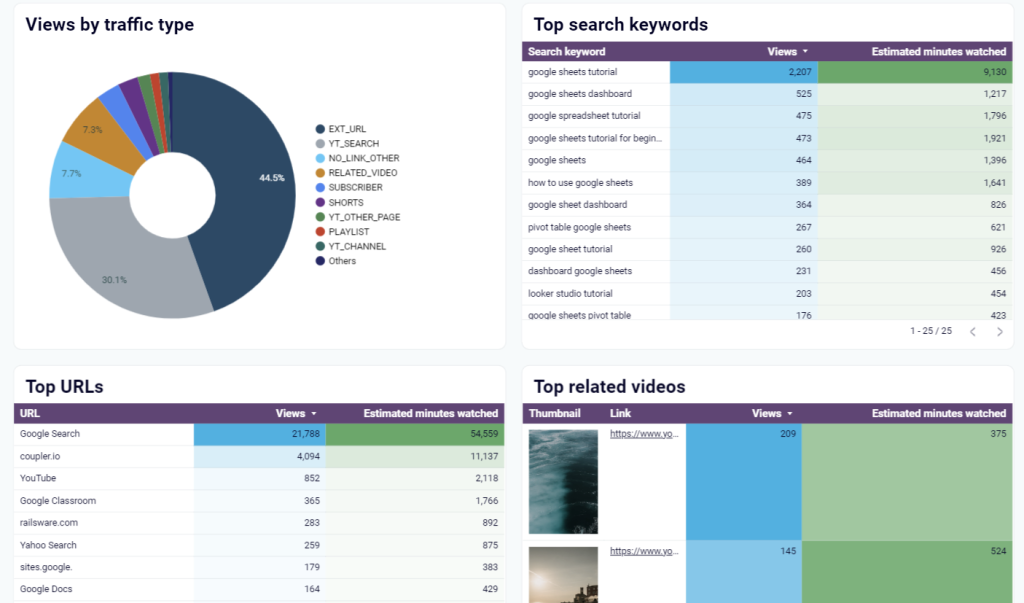
The last page of the report is dedicated to Traffic sources. Here you get insights into top search keywords, URLs, related videos, and views by traffic source.
What metrics you can track
Here are different metrics you can track using this influencer dashboard template for YouTube.
| Metrics | Description |
|---|---|
| Views | Shows how long viewers are watching your videos on average. Best for assessing content quality. If the average view duration is low, consider adjusting your content to be more engaging or concise. |
| Avg. view duration | Shows how long viewers are watching your videos on average. Best for assessing content quality. If average view duration is low, consider adjusting your content to be more engaging or concise. |
| New subscribers | Highlights the number of new subscribers in the last 30 days. This metric is best to track growth and the overall health of your channel. A spike in new subscribers can indicate successful content. |
| Engagement | This includes metrics such as likes, dislikes, comments, and shares. Best for gaining audience feedback and creating a content strategy that drives the most positive result. |
| Card interactions | This includes the number of impressions, clicks, and CTR to info cards on your videos, usually marked with an “i” on the top right corner of a YouTube video. This metric shows how effective cards are in driving viewer actions. |
4. LinkedIn company page performance dashboard
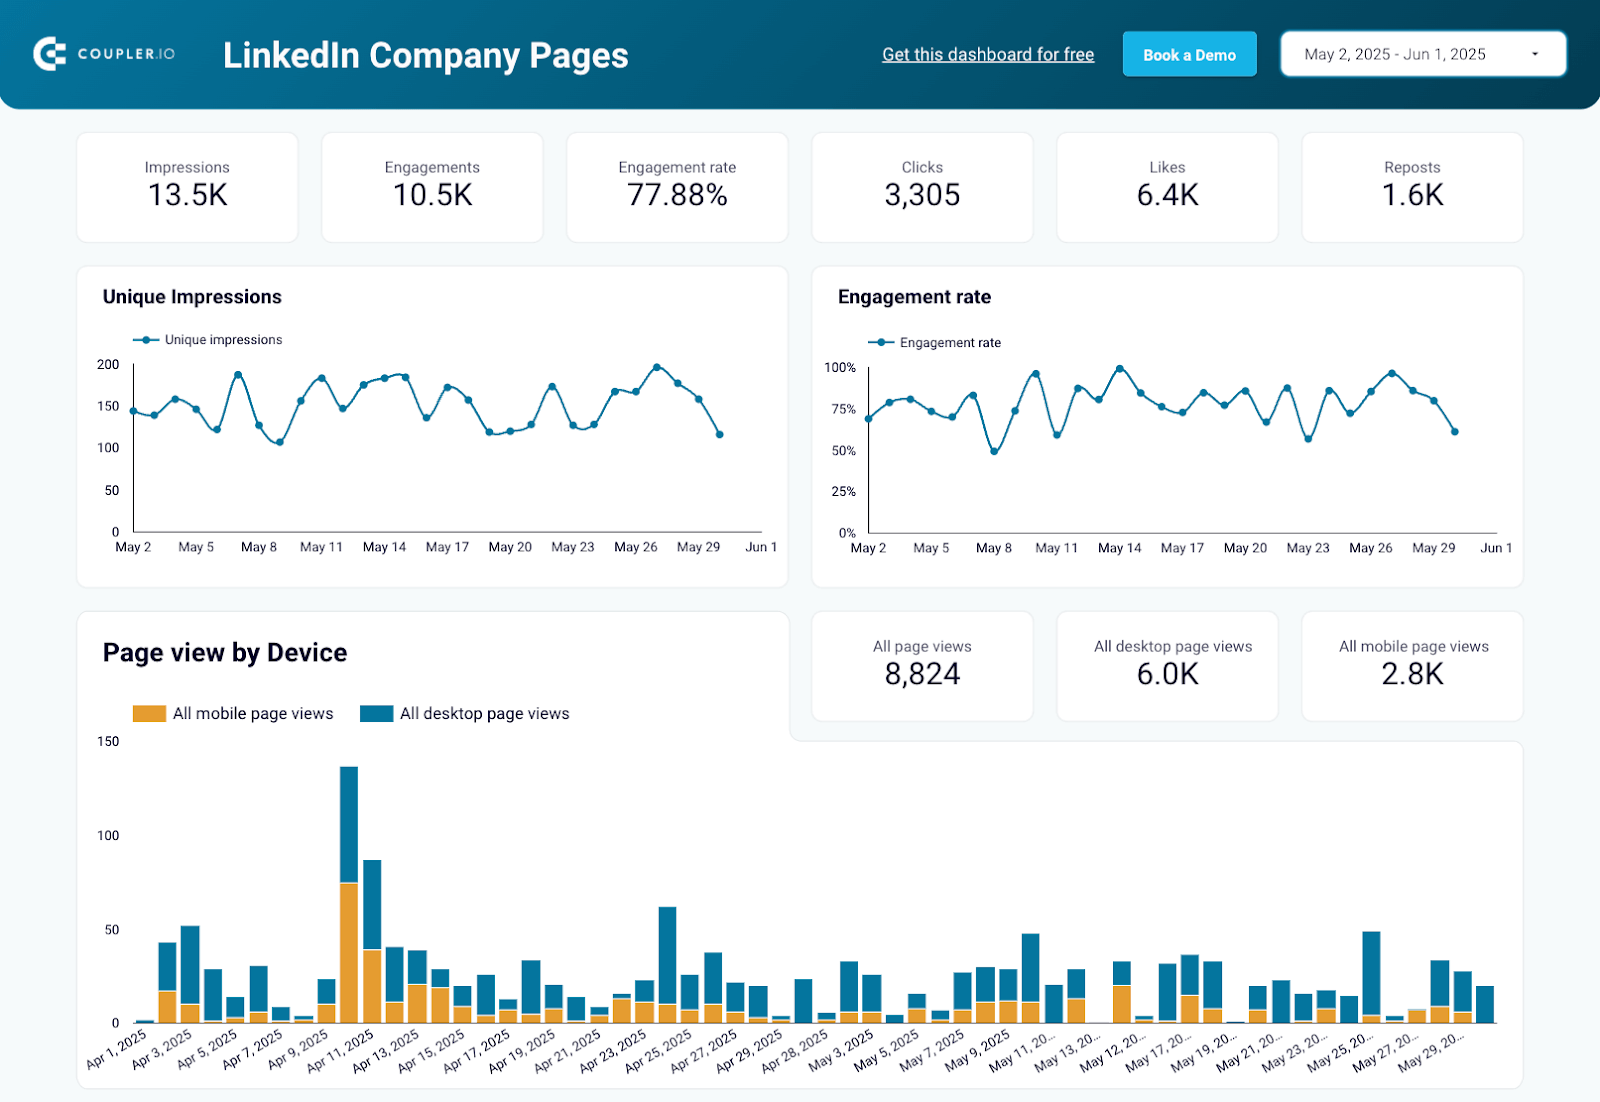
This LinkedIn company page dashboard focuses on your professional presence and B2B audience engagement on LinkedIn. It tracks key metrics such as impressions, engagement rates, follower demographics, and page views to help you understand how your LinkedIn content performs. You can get insights into your audience’s company size, seniority levels, industry distribution, and geographic location.
LinkedIn company page performance dashboard
 Preview dashboard
LinkedIn company page performance dashboard
Preview dashboardA free template is available in Looker Studio. Simply sign up for a Coupler.io account, connect your LinkedIn Company Pages data, and get a report that updates automatically on a schedule.
What insights the dashboard provides
Here are just a few key insights you can gain by using this LinkedIn company page performance dashboard:
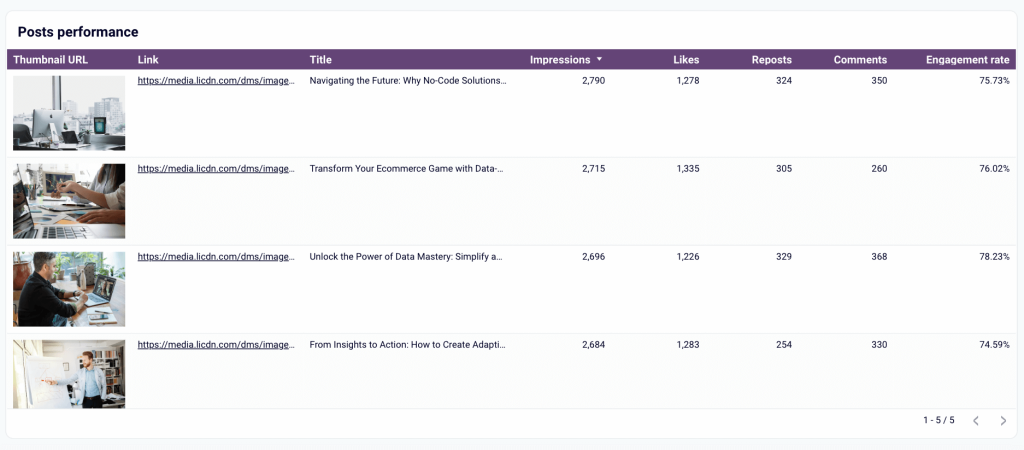
The post performance analysis gives you a detailed breakdown of how each individual post performs on your company page. You can see which posts generate the most impressions, likes, reposts, comments, and the highest engagement rates. This helps you identify your best-performing content so you can create more of what works.
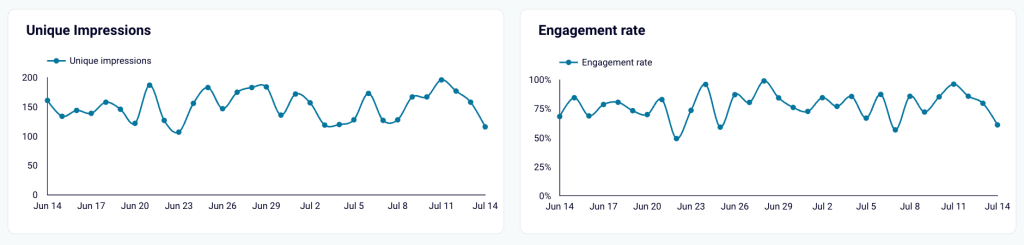
Meanwhile, the dynamics of impressions and engagement rate section tracks how your LinkedIn presence performs over time. It helps you assess if your marketing campaigns and communication activities actually impact your LinkedIn results and spot emerging trends in audience engagement.
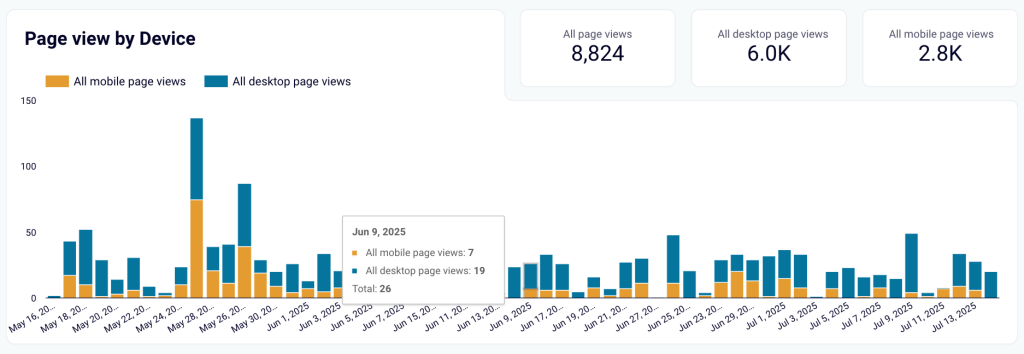
The page views by device breakdown shows you whether your LinkedIn audience primarily views your content on mobile or desktop devices. This insight helps you optimize your content format and design for the devices your professional audience uses most.
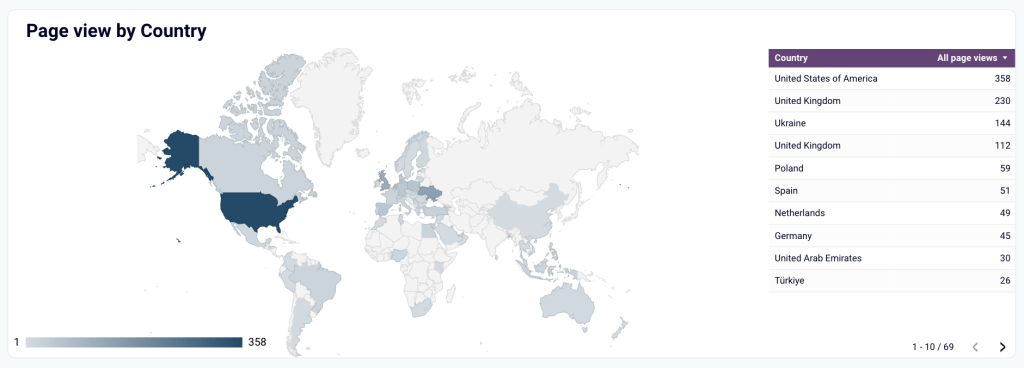
The page views by country section reveals where your LinkedIn page visitors are located geographically. It points to key markets and regions that drive traffic to your company page, helping you adjust content localization strategies to focus on your most engaged audiences.
In a separate tab, the followers overview provides insights into who follows your LinkedIn company page. You can:
- Compare organic versus paid follower growth trends to evaluate your acquisition strategies.
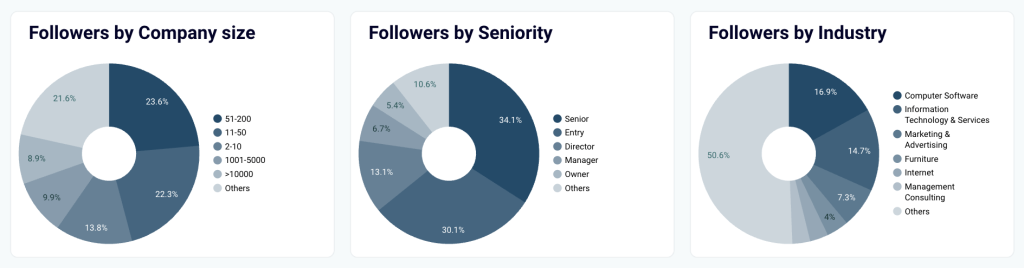
- Discover your followers’ company sizes and seniority levels to understand if you’re attracting decision-makers.
- See which industries your followers represent, and identify their primary job functions to create content that aligns with their interests.
What metrics you can track
Here’s a brief list of the metrics you can analyze in this dashboard:
| Metric | Description |
|---|---|
| Impressions | Measures the number of unique accounts that have seen your content. Best for understanding audience size and seeing how many different people are viewing your posts. |
| Engagements | This includes metrics such as likes, dislikes, comments, and shares. Best for gaining audience feedback and creating a content strategy that drives the most positive result. |
| Engagement rate | Measures the percentage of people who interacted with your content relative to the number who saw it. Helps evaluate content quality and audience interest across different platforms and content types. |
| Clicks | Shows how many users clicked on your LinkedIn content or company page elements. Useful for assessing content effectiveness in driving traffic. |
| Likes | Refers to the number of likes your LinkedIn posts receive. It highlights which content resonates positively with your professional audience. |
| Reposts | Tracks how many times your content was shared by LinkedIn users. This helps you measure content virality and audience reach. |
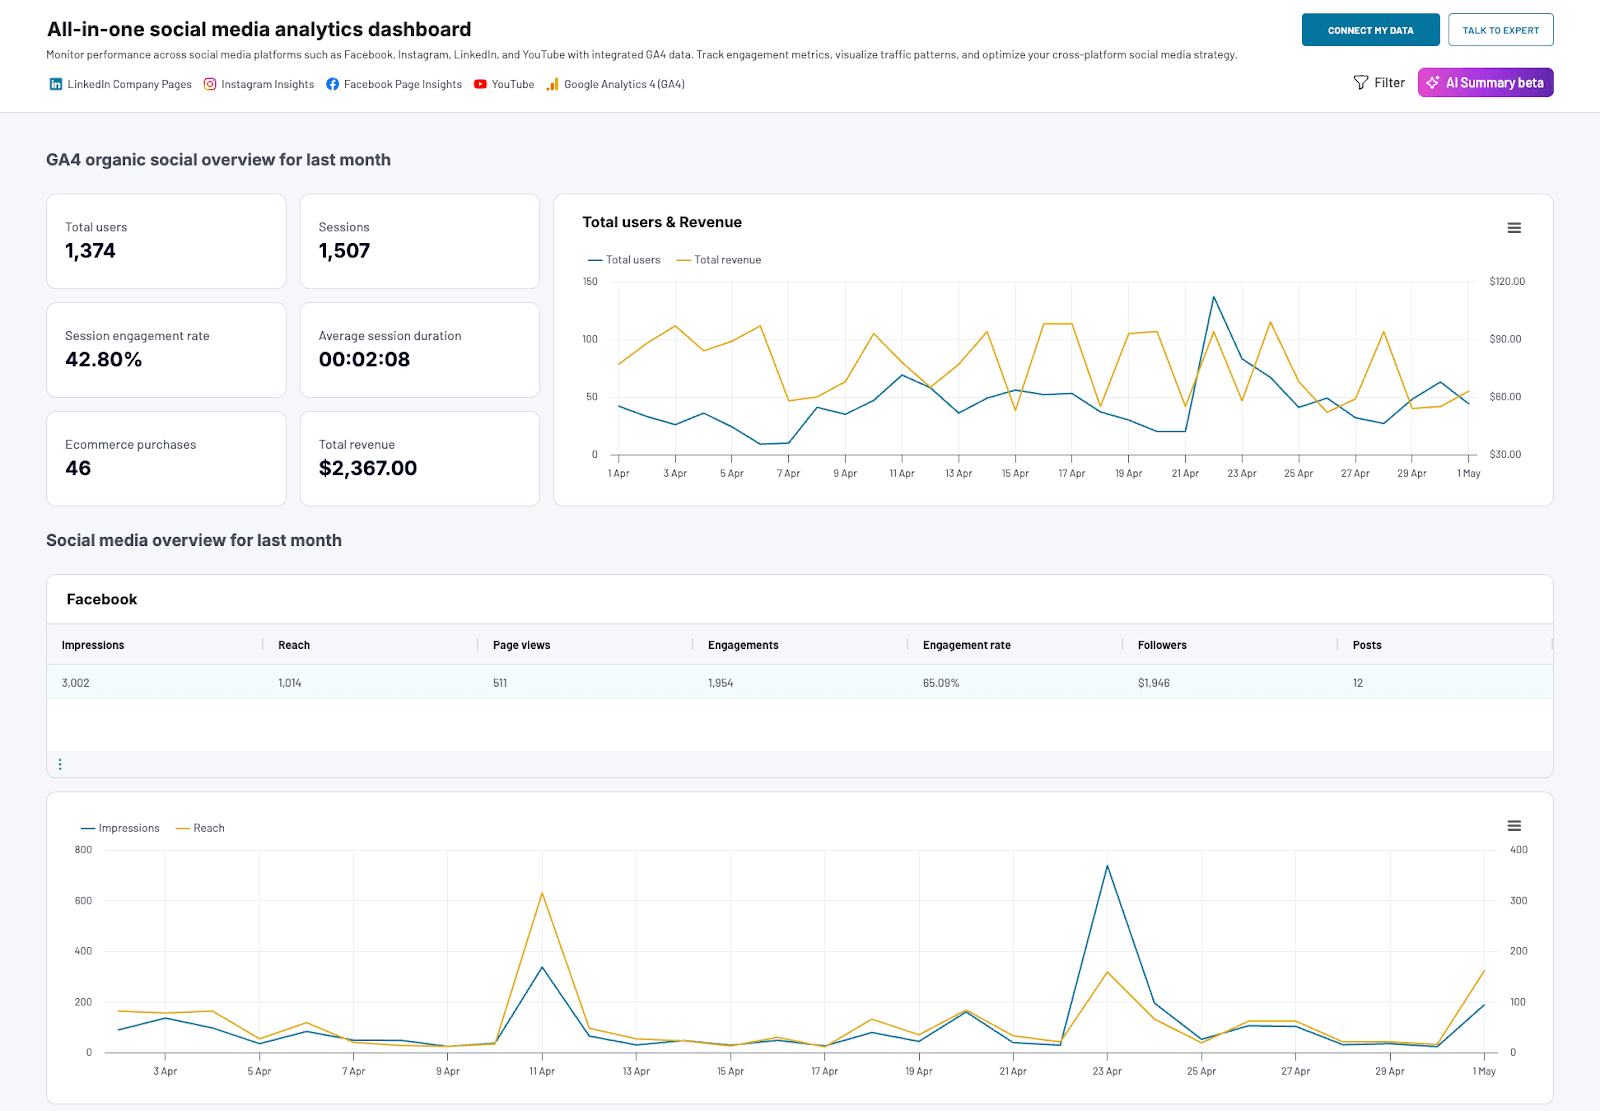
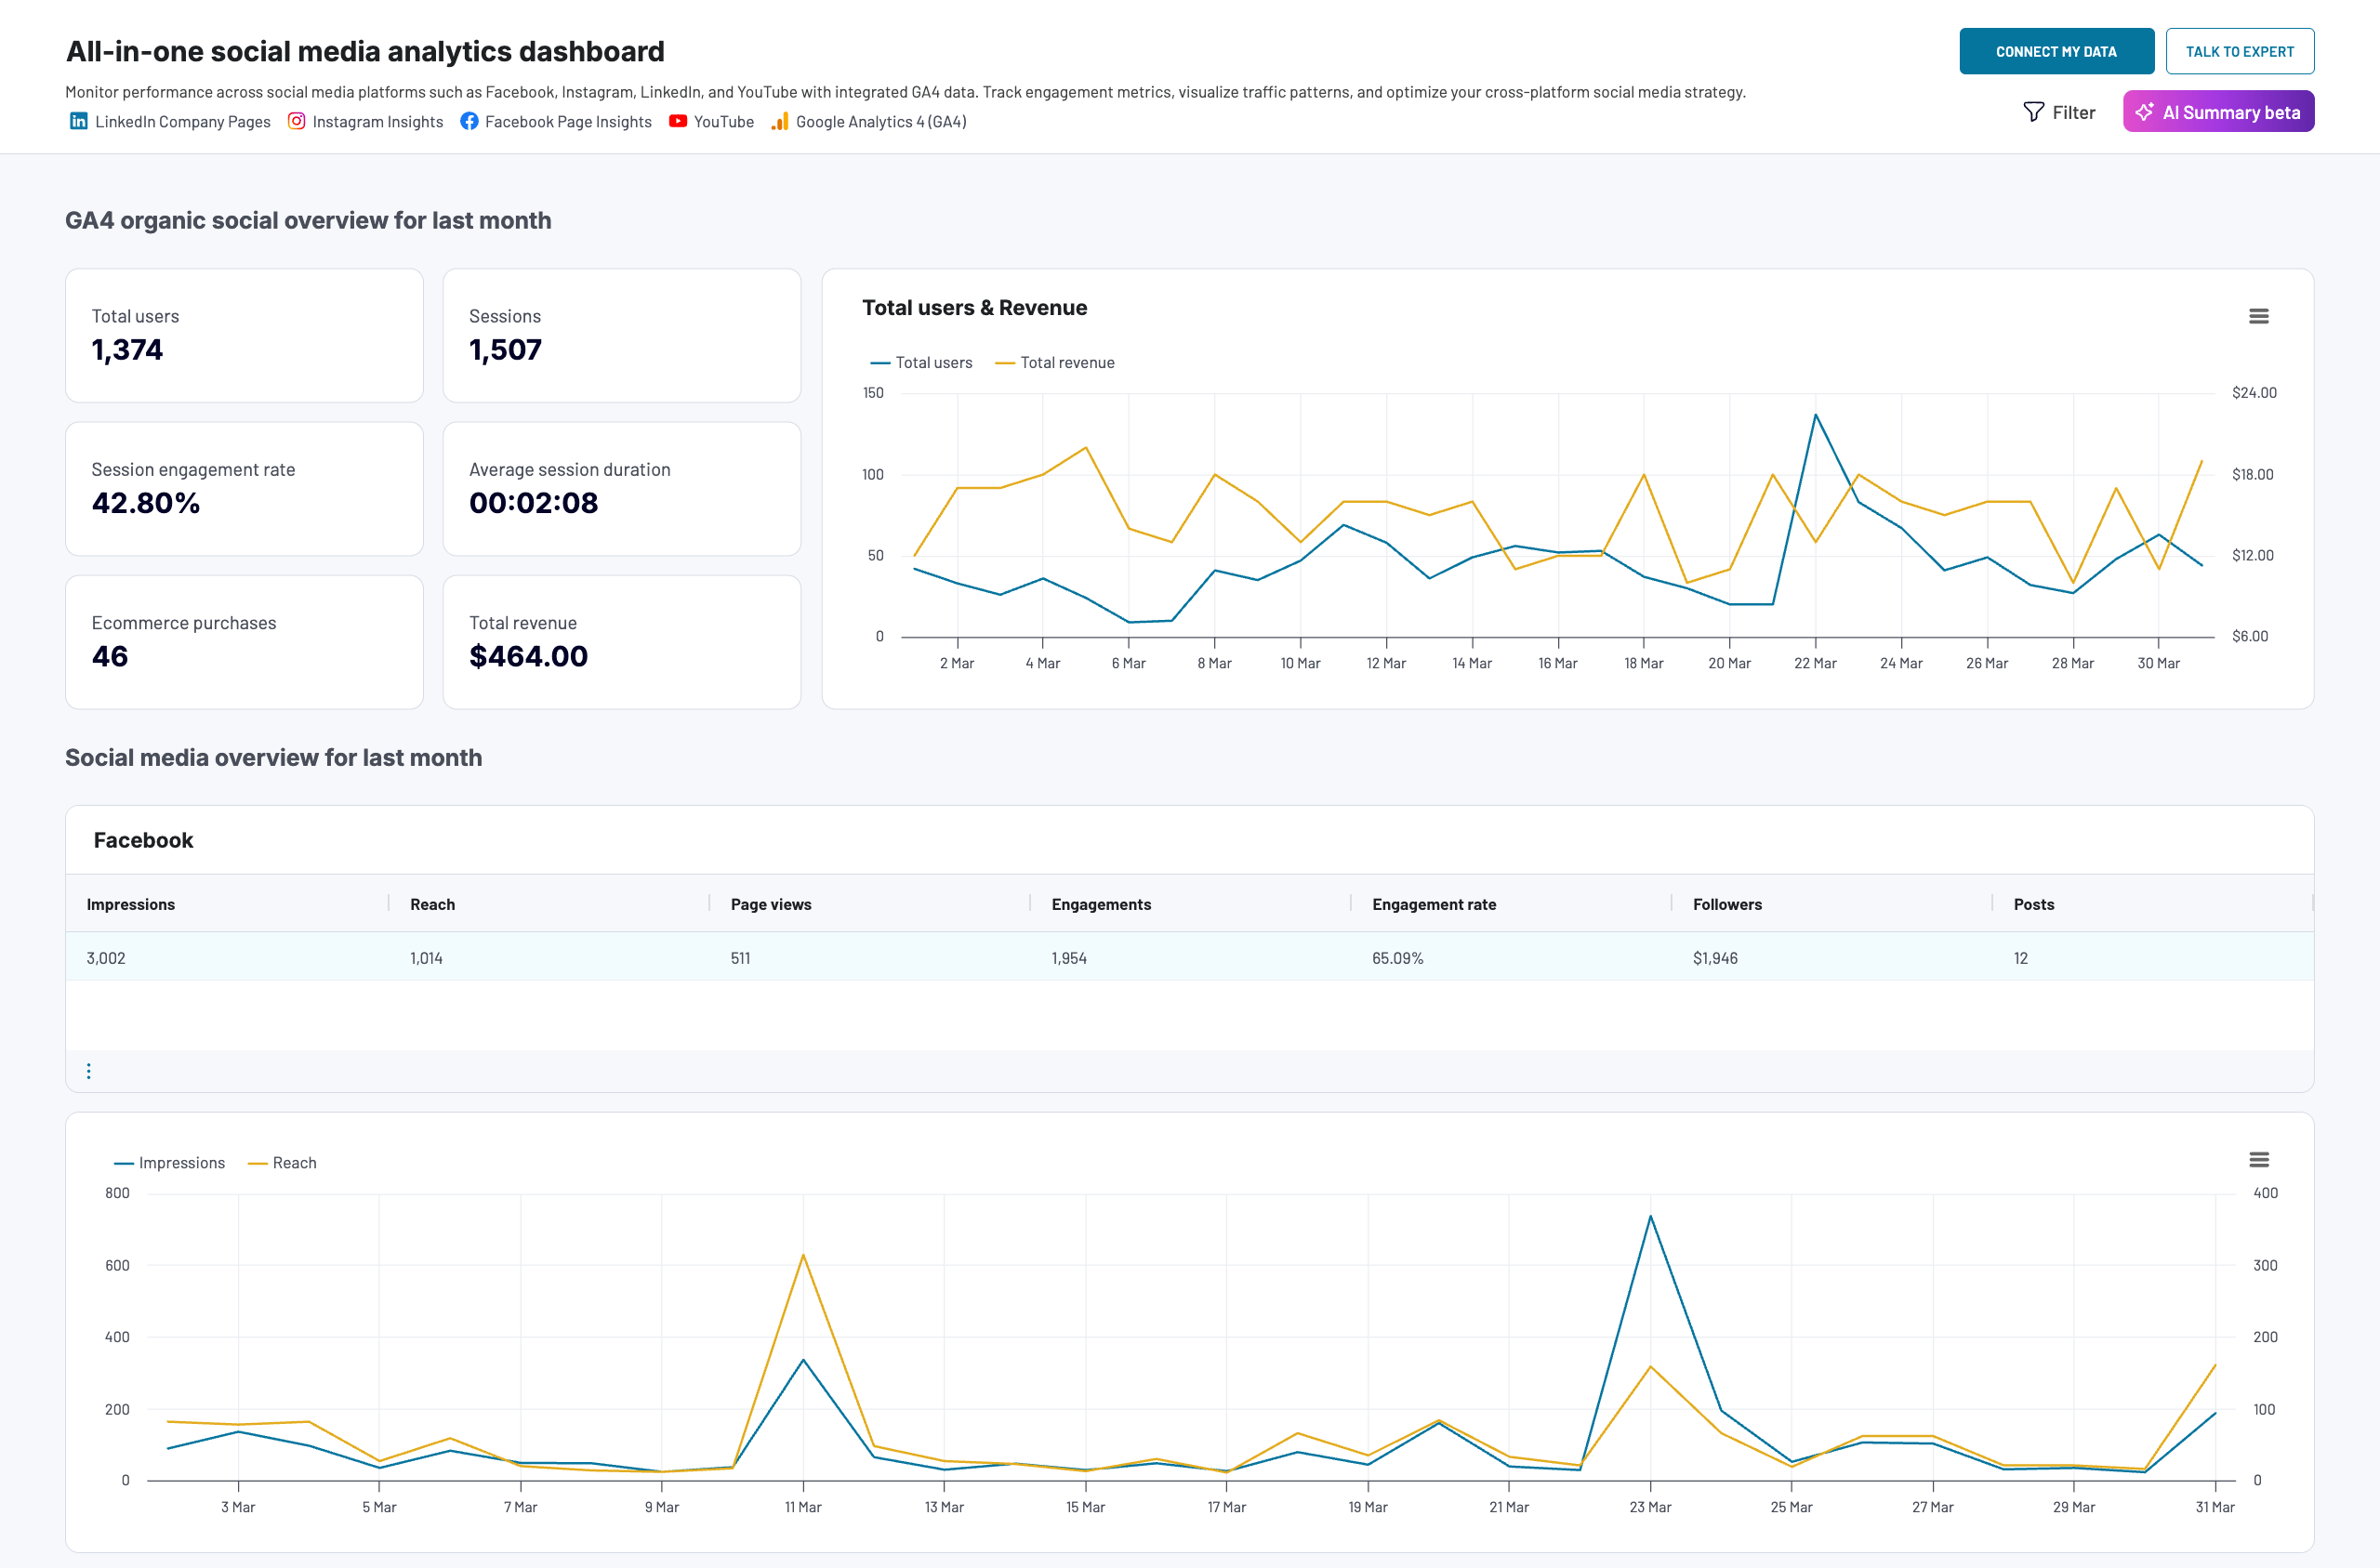
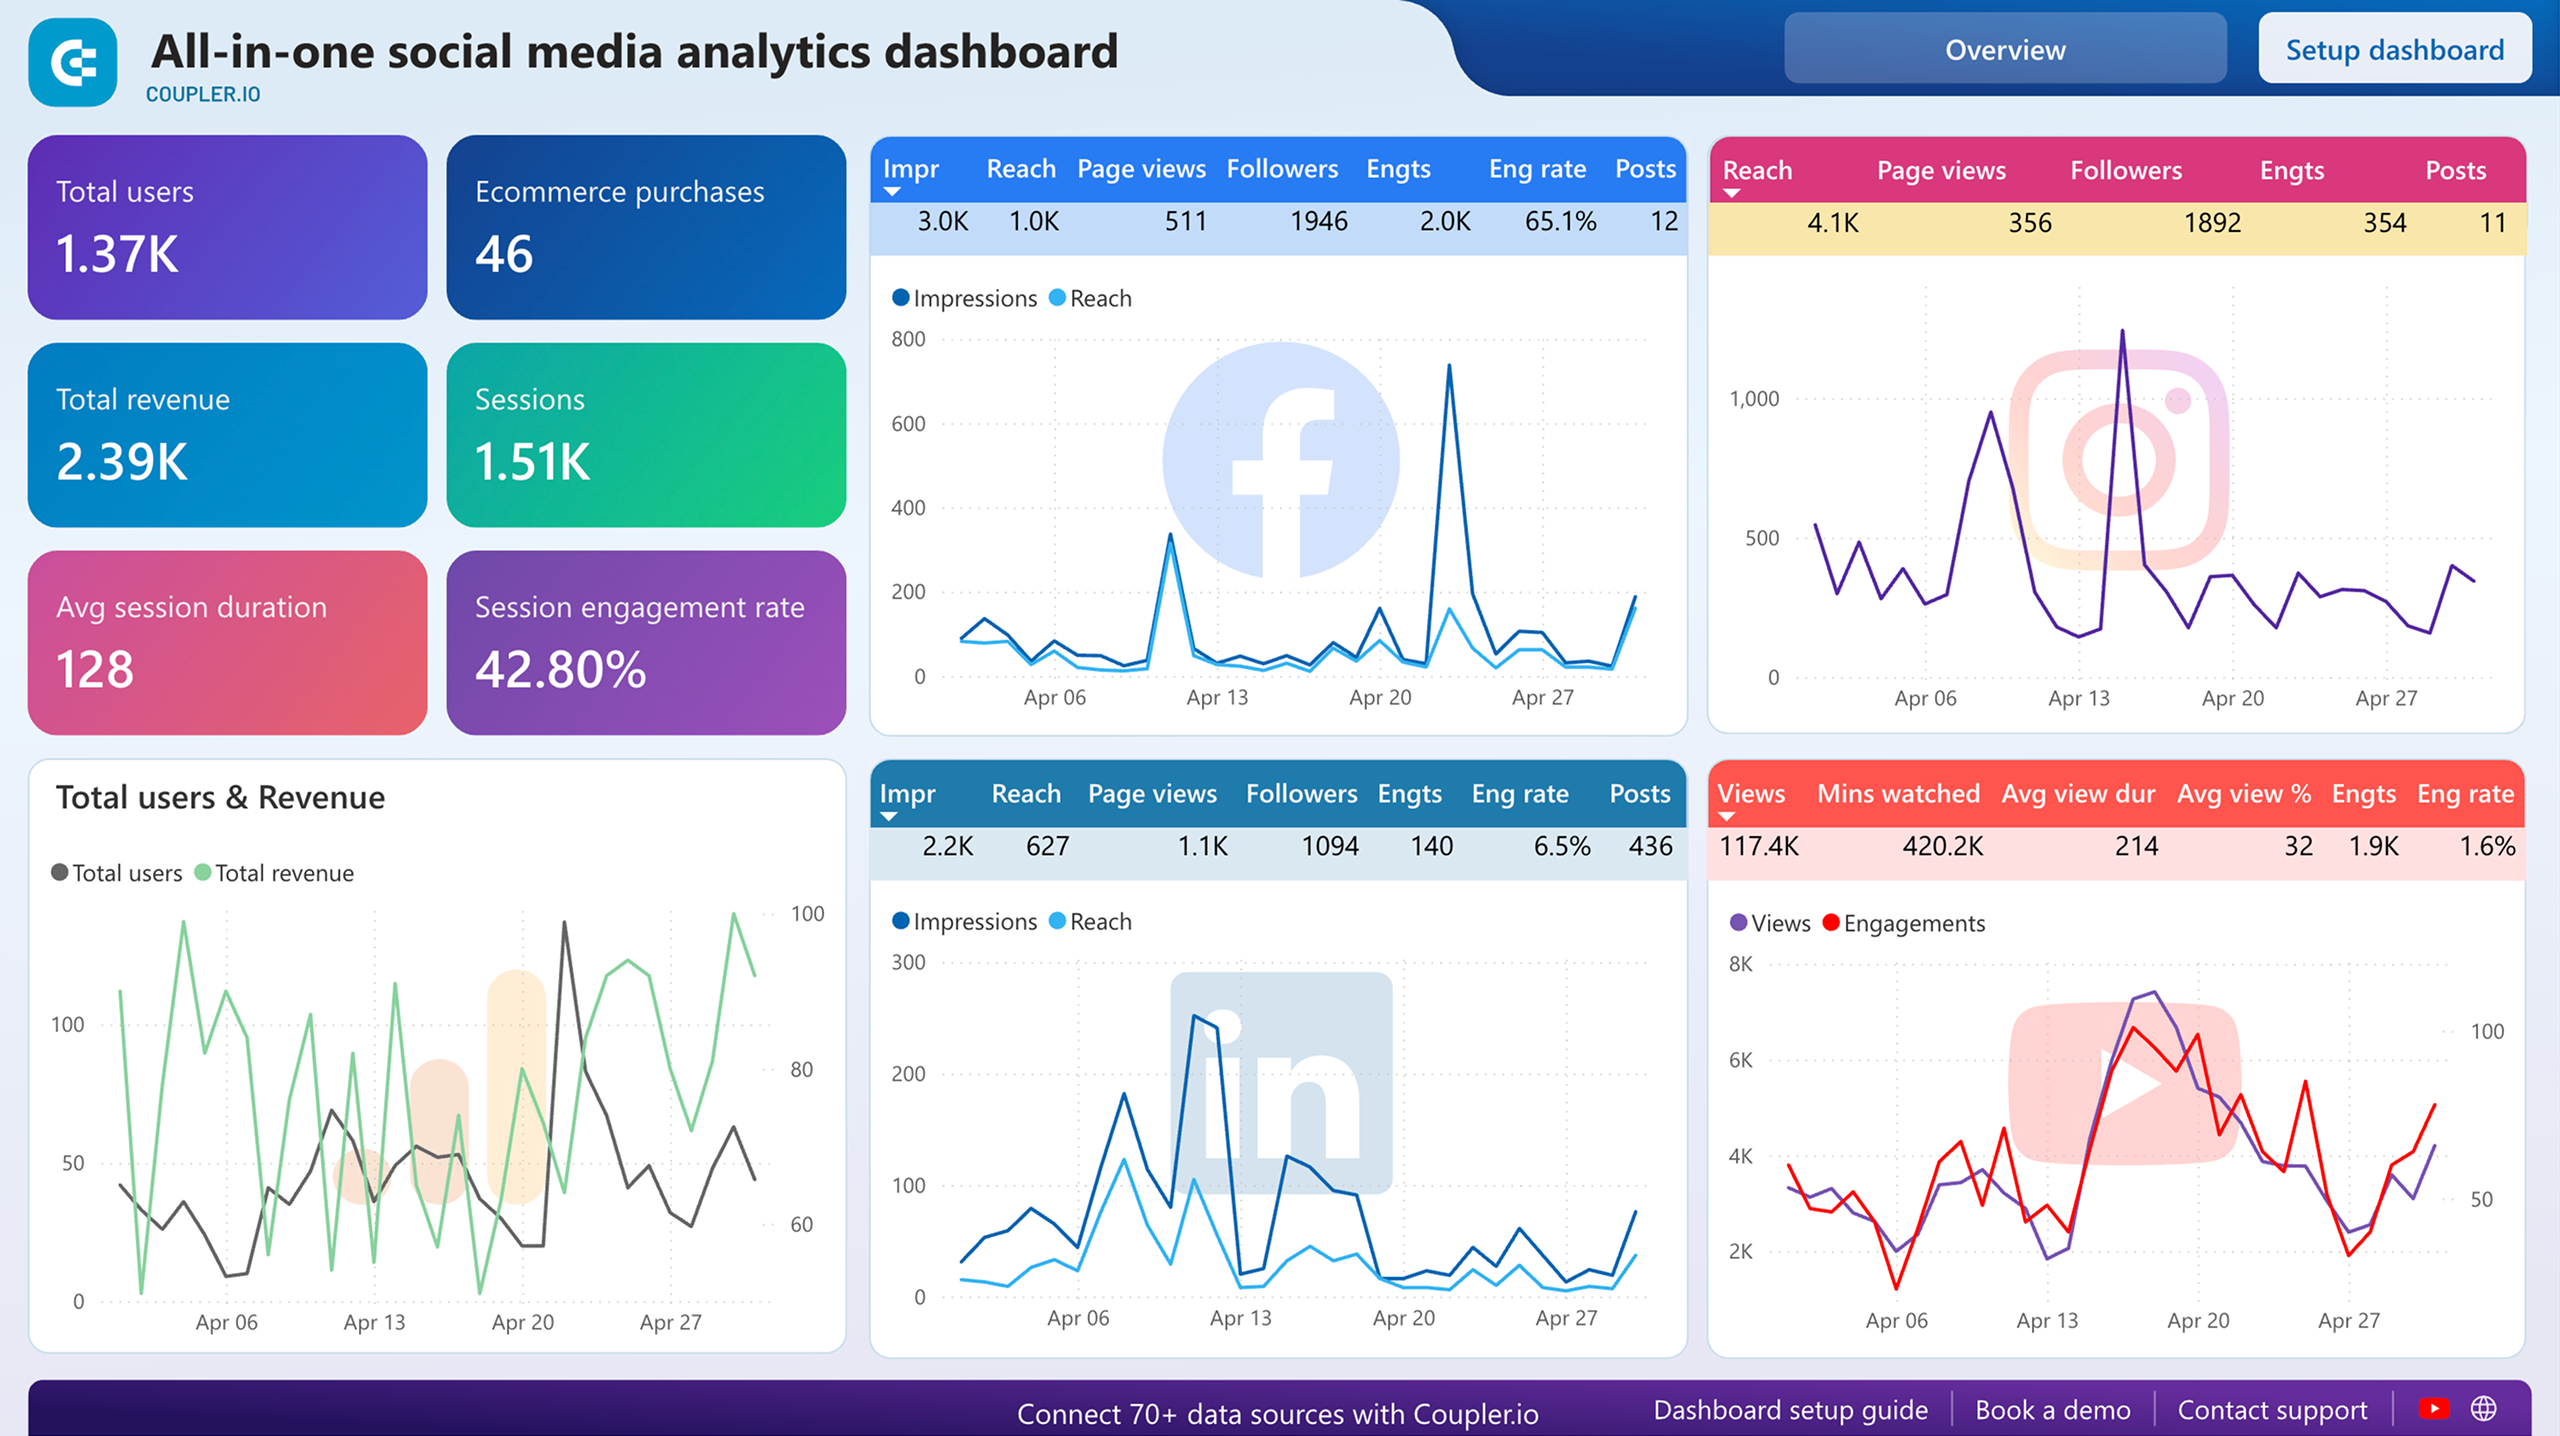
This dashboard consolidates performance data from Instagram, Facebook, LinkedIn, and YouTube into a single unified view. It enables you to track key metrics such as impressions, engagement rates, follower growth, and website traffic across all platforms simultaneously. The dashboard also connects to GA4 to show how your social media efforts translate into actual website visits and sales.
All-in-one social media dashboard
 Preview dashboard
All-in-one social media dashboard
Preview dashboardA template is available in the Coupler.io UI, Looker Studio, and Power BI. It’s equipped with Coupler.io’s no-code connectors that automatically load data from all your social media accounts.
What insights the dashboard provides
Here’s a breakdown of what you can track using this all-in-one social media dashboard.
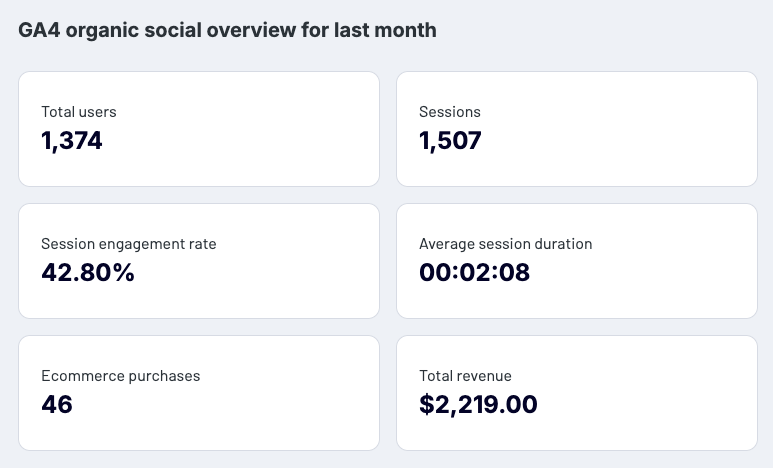
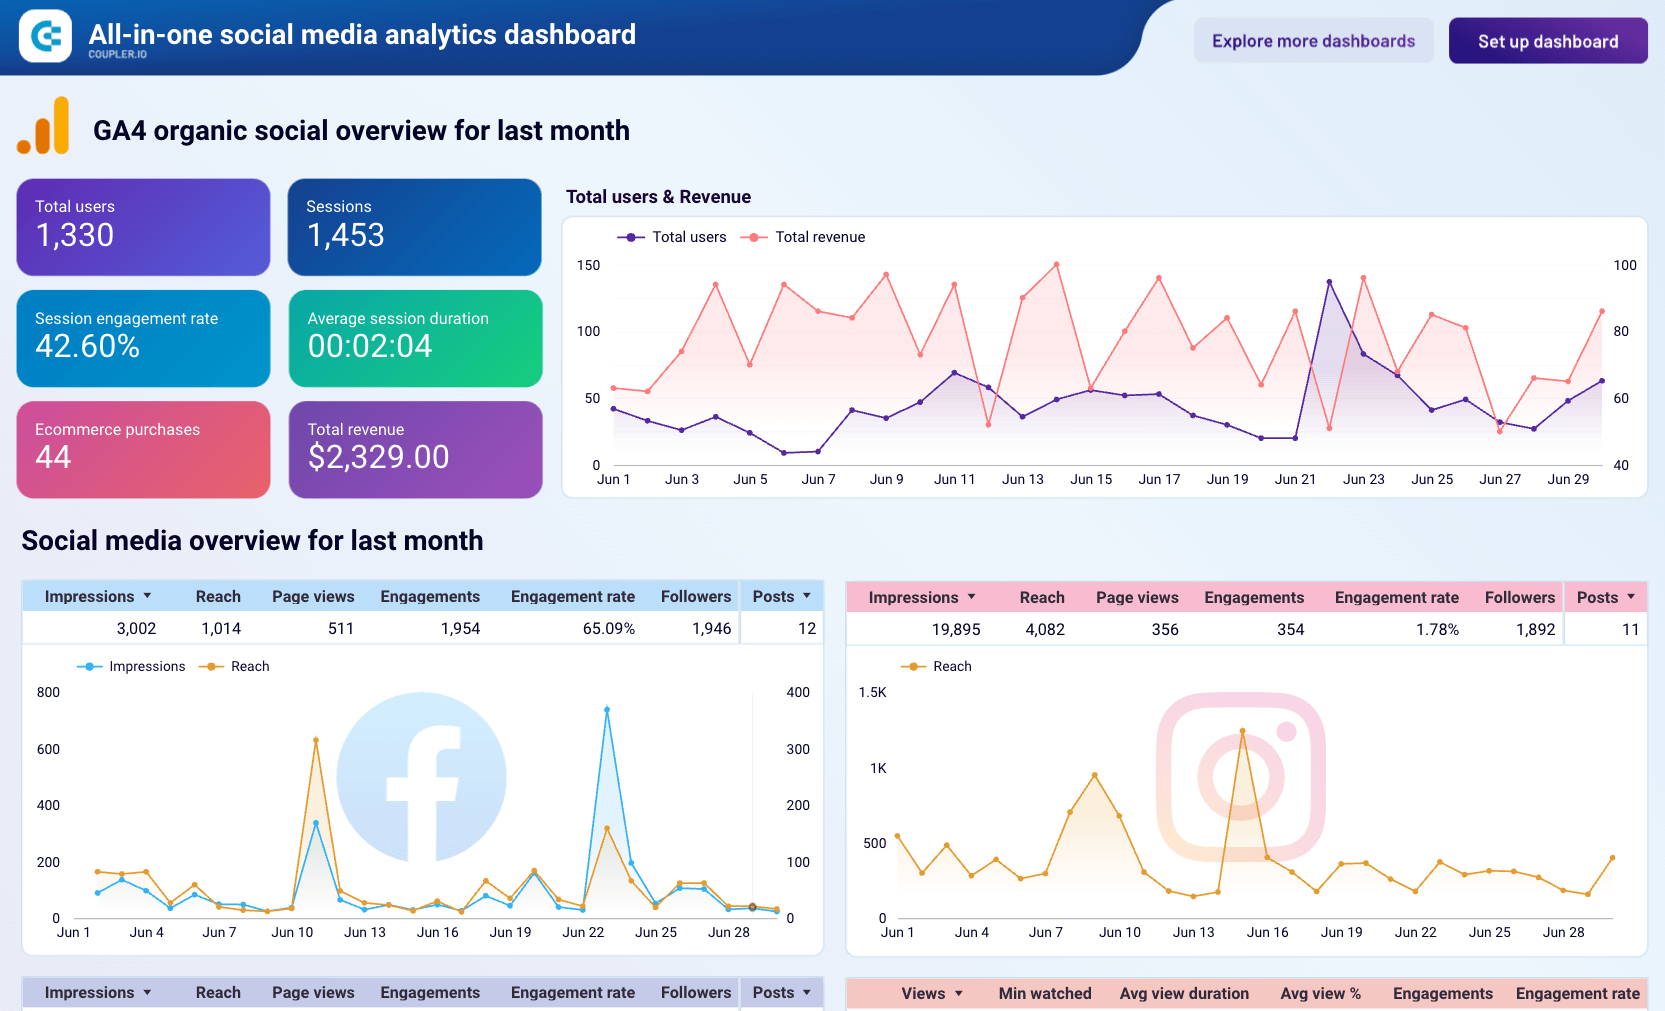
The key business metric scorecards give you an instant overview of your social media performance at a glance. They display your most important numbers: website traffic from social media (total users), sessions, session duration, session engagement rate, e-commerce purchases, and total revenue.
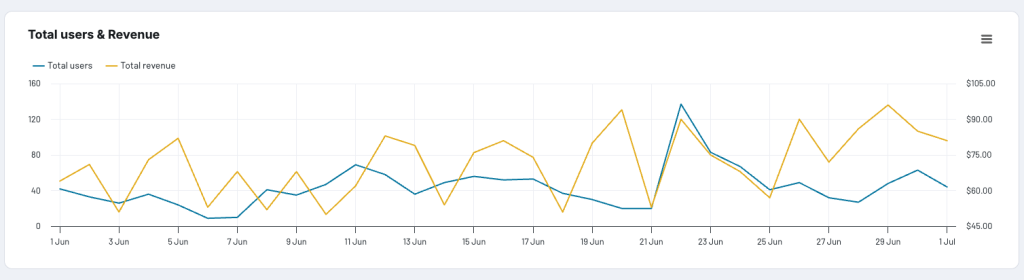
Use the total users & revenue chart to understand how your social media strategy impacts your bottom line over time. You can spot monthly spikes in social traffic and see how major campaigns affect both user acquisition and revenue.
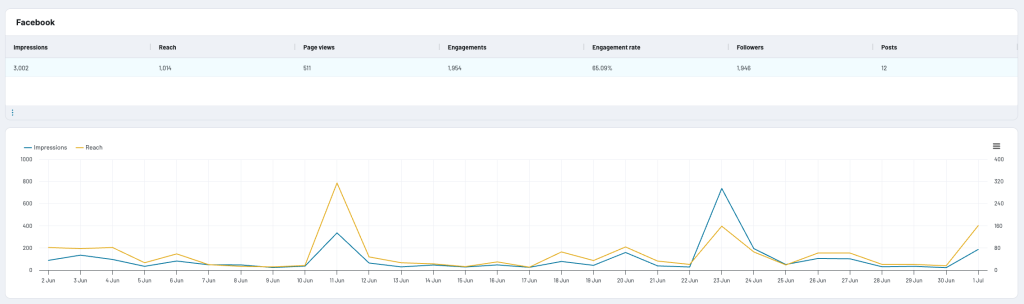
The performance overview sections for Facebook, Instagram, and LinkedIn track how your organic content generates engagement. You can analyze individual KPIs like impressions, reach, page views, and followers, and compare impressions vs. reach for each platform.
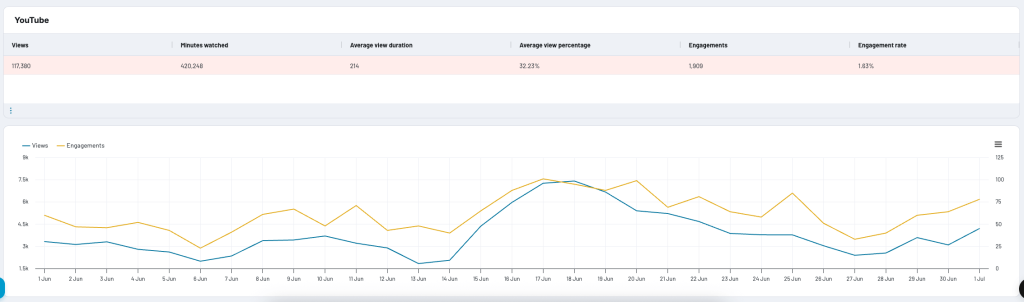
The YouTube performance section allows you to assess the effectiveness of your video content. You can see how YouTube performs compared to other social platforms in terms of engagements and engagement rate.
What metrics you can track
Now, let’s take a look at all the metrics included in the dashboard template:
| Metric | Description |
|---|---|
| Total users | Shows the number of visitors driven to your website from social media platforms. This metric reflects how your content efforts drive traffic and helps you assess the ROI of social media marketing. |
| Total revenue | Displays the revenue generated from each social media platform through GA4 integration. Best for measuring the direct business impact of your social media efforts. |
| Impressions | Measures the number of unique accounts that have seen your content. Helps to assess content performance by comparing reach across different posts and identifying which content attracts more unique viewers. |
| Reach | Reveals how many times your post has been shared. A high number of shares reflects compelling and share-worthy content, increasing the chance of higher impressions, reach, and profile visits. |
| Page views | Shows how many times your social media pages or profiles were viewed. Great for tracking brand awareness and profile optimization effectiveness. |
| Engagements | This includes metrics such as likes, dislikes, comments, and shares. Best for gaining audience feedback and creating a content strategy that drives the most positive result. |
| Engagement rate | Measures the percentage of people who interacted with your content relative to the number who saw it. Helps evaluate content quality and audience interest across different platforms and content types. |
| Followers | Indicates the growth of your audience. Monitor this metric to assess how effective your content and strategy are at attracting new followers. Great for tracking follower milestones and engaging with your audience through special content. |
| E-commerce purchases | Tracks the number of purchases made by visitors from social media platforms. Critical for measuring direct sales impact and ROI of your social marketing efforts. |
| Sessions | This includes metrics such as likes, dislikes, comments, and shares. Best for gaining audience feedback and creating a content strategy that drives the most positive results. |
| Session duration | Shows how long visitors from each social media platform spend on your website. Higher session duration indicates more engaged traffic and better content-audience fit for specific platforms. |
All-in-one social media analytics dashboard in Coupler.io
Monitor performance across social media platforms such as Facebook, Instagram, LinkedIn, and YouTube with integrated GA4 data. Track engagement metrics, visualize traffic patterns, and optimize your cross-platform social media strategy.


All-in-one social media analytics dashboard in Looker Studio
Track performance across Facebook, Instagram, LinkedIn, YouTube, GA4, and more in one comprehensive dashboard to measure engagement, analyze traffic patterns, and optimize your social media strategy.
All-in-one social media analytics dashboard in Power BI
Consolidate your social media analytics from several platforms, such as Facebook, YouTube, and GA4 to evaluate performance metrics and enhance your multi-platform strategy.
What is an influencer marketing dashboard?
An influencer marketing dashboard is a visual display of key metrics pulled from various social channels. These include reach, impressions, views, audience and engagement metrics, etc. Well-designed solutions help influencers assess their content performance and improve campaign management with easy-to-understand charts, graphs, and tables. As a result, they can create accurate, data-driven growth strategies.
Aside from influencers, the dashboards mentioned above are also great for brands, businesses, marketing teams, and other experts for social media analytics.
What are the benefits of using influencer dashboards?
Here are some benefits of using influencer dashboards:
- Real-time insights. The influencer dashboards mentioned above offer near real-time updates on key metrics. This allows you to create strategies using relevant and fresh data.
- Increased revenue. Understand the most profitable content and campaigns by tracking and assessing your target audience’s content preference. This can drive higher engagement and lead to increased monetization strategies.
- Improved decision-making. A centralized data with easy-to-understand visualizations and up-to-date information allows you to make data-driven decisions. This reduces guesswork and increases efficiency.
- Enhanced collaboration. Dashboards facilitate better teamwork and collaboration. It is easy to share and offers a holistic view of essential metrics to keep team members on the same page.
- Customization options. The influencer marketing dashboards on this list are customizable. You can add more data, add and delete sections, customize colors, and focus on what matters most to your business.
- Time and effort optimization. Say goodbye to manually gathering data from your data source. The automated workflow saves time and effort, as well as eliminates the risk of human error in the process. This way, you can focus on building an effective strategy and content creation.
How to build the influencer dashboard on your own?
Creating an influencer dashboard from scratch is not as simple as using a preset whitelabel template. However, you can tailor the dashboard specifically for your reporting requirements and fill it with all the necessary metrics. Consider using Coupler.io to load data for your future dashboard, it only takes a couple of minutes to set up a connection.
Step 1. Collect data
To start collecting data from your social media channel, select your data source and destination via the drop-down button using the form below. Click Proceed and sign up for a Coupler.io account for free, with no credit card required.
If you already have a Coupler.io account, simply sign in and continue with the process.
After that, connect your social media account and set up the source settings, this includes details like metrics, report period, and other advanced settings.
Step 2. Organize data
In the next step, you can preview and edit the data to your liking. It’s possible to sort, filter, hide, split, rearrange, and merge columns to ensure your final report is according to your needs.
Step 3. Load data
Once your data is organized, hit Proceed and follow the in-app instructions to load your data into your selected destination. After that, you can add visualizations, filters, slicers, and other interactive elements to make your influencer marketing dashboard meet your reporting needs.
We also recommend setting up the auto-updating feature. Turn on the schedule to refresh your integration automatically and get updated data based on your preferred time interval, which ranges from monthly to every 15 minutes.
Optimize your marketing tactics with ready-to-use influencer marketing dashboards
Marketing dashboards play an important part in creating a successful content strategy. Whether you are keeping track of your content engagement or audience growth, these dashboards empower you to make informed decisions based on data.
Luckily, building a dashboard can be easy with the help of influencer marketing templates. Let Coupler.io take care of your data, automatically collecting it across your platforms and putting it into your dashboard on a schedule.
Automate marketing reporting with Coupler.io
Get started for free


