QuickBooks provides detailed reports that can be very useful to financial professionals. However, these reports can sometimes be overwhelming for stakeholders with different backgrounds – executives, marketers, and sales teams. By creating custom dashboards in Power BI, you can present QuickBooks data in easy-to-understand visuals.
Below, we’ve introduced several ways to connect QuickBooks to Microsoft Power. Choose the best one for you to share financial insights, present results to stakeholders, collaborate across teams, and analyze data to make informed decisions.
Methods to connect QuickBooks to Power BI: What can you choose from?
Here’s a preview of the different methods we are going to discuss:
- QuickBooks connector by Coupler.io. Coupler.io is a data integration platform that allows you to easily export QuickBooks data to Power BI. Setting it up takes just a few minutes, and you can transform your data before loading it to Power BI. It will also auto-refresh your dashboard based on the schedule you choose. You don’t need any technical knowledge to set up finance automation, as it’s a no-code solution that’s easy to use. Additionally, Coupler.io provides pre-built templates that allow you to quickly create professional dashboards and reports using QuickBooks data.
- Manual data export. With this method, you’ll need to first download your financial data as an Excel (.XLSX) file, then upload it to Power BI. While this approach is simple, you’ll need to repeat the process each time you want your report to show the latest numbers, which can be time-consuming.
- Custom API integration. For a more tailored approach, you can connect QuickBooks to Power BI using the QuickBooks API. First, you need to obtain an access token from the Intuit Developer Portal. Next, write a script to pull data from the QuickBooks API and load it into a database like BigQuery or PostgreSQL. From there, you can use Power BI’s “Get Data” function to bring in the data and begin analysis. This method is more complex and requires technical expertise and experience in writing code, so we won’t dive into this option in detail here.
Is there a native QuickBooks Online connector in Power BI?
Power BI used to offer a native connector that worked via the QuickBooks ODBC Driver to import data directly from QuickBooks Online. However, the connector was fully deprecated in August 2025. Moreover, Microsoft currently has no plans to release a new QuickBooks connector.
As a result, both current and new users looking for a way to connect QuickBooks to Power BI can’t rely on the native functionality anymore. No worries, though — you still have a reliable solution. Coupler.io delivers a user-friendly option for syncing your QuickBooks data with Power BI quickly and efficiently.
How to set up a QuickBooks to Power BI integration for automated data exports with Coupler.io
Using this data integration platform, you can easily export your financial data from QuickBooks to Power BI to create live reports and dashboards. The process is simple and consists of just three steps, which typically only take a few minutes to complete.
Step 1: Retrieve your QuickBooks data
To start, click Proceed in the pre-configured form below. If you want to export a preset report such as Balance Flow, Cash Flow, Vendor Balance, and so on, change QuickBooks to QuickBooks Reports as the source.
If you’re new to Coupler.io, you’ll need to create an account to use the platform (this is free and no credit card is required). After logging in, connect your QuickBooks account by granting Coupler.io the necessary permissions to access your data.
Next, choose the data entity you want to export, such as Invoice, Customer, Payment, Vendor, Sales, etc.
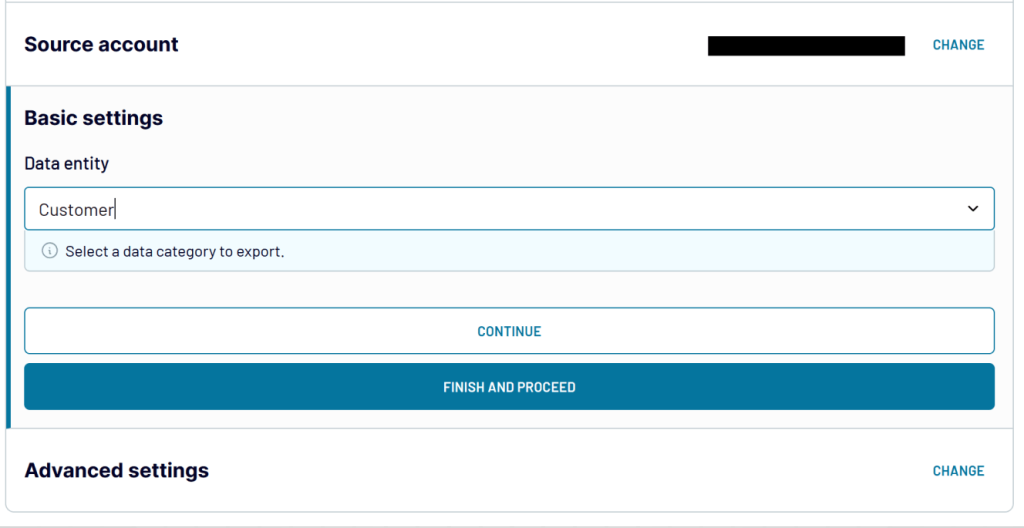
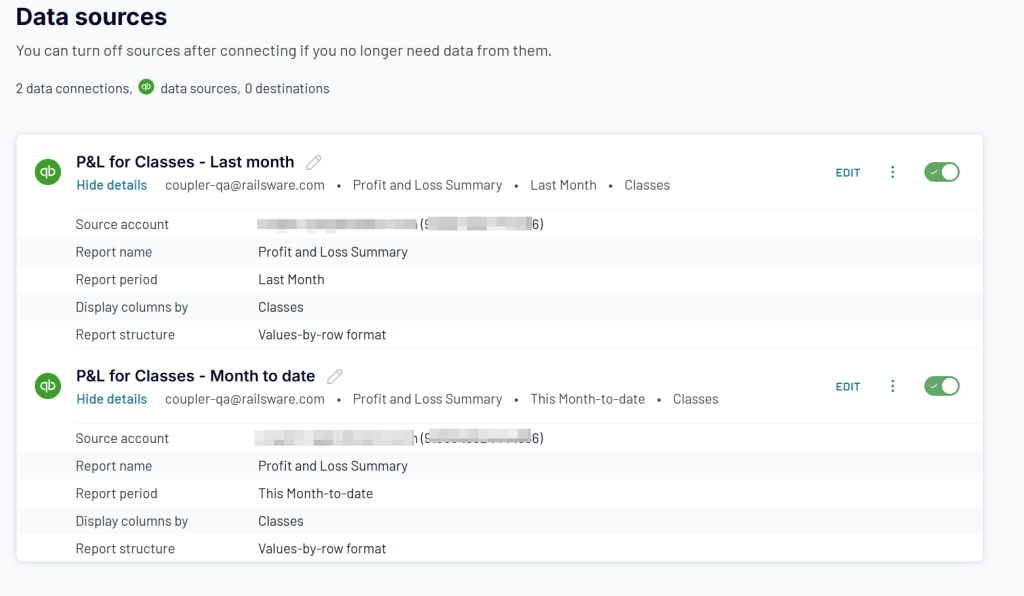
Once the QuickBooks data source is set up, Coupler.io also enables you to add other data entities or sources to combine with your QuickBooks data. For example, to create a QuickBooks Profit and Loss report for this/last month, you can add two P&L summary reports for different periods like this:
Step 2: Organize and transform data
In this step, you can review and transform your QuickBooks data to ensure it’s ready for analysis. Check out the basic transformation options in this interactive form.
And if you need to combine QuickBooks data with information from other data sources, you can use:
- Join – combine two or more data sets horizontally using a key column (the same column from each data set)
- Append – combine data sets with the same structure vertically
Once your data is organized, proceed to the next step.
Step 3: Load data to Power BI and schedule updates
Now it’s time to load your data into Power BI. Click the Generate Link button to create an integration URL and copy the link provided.
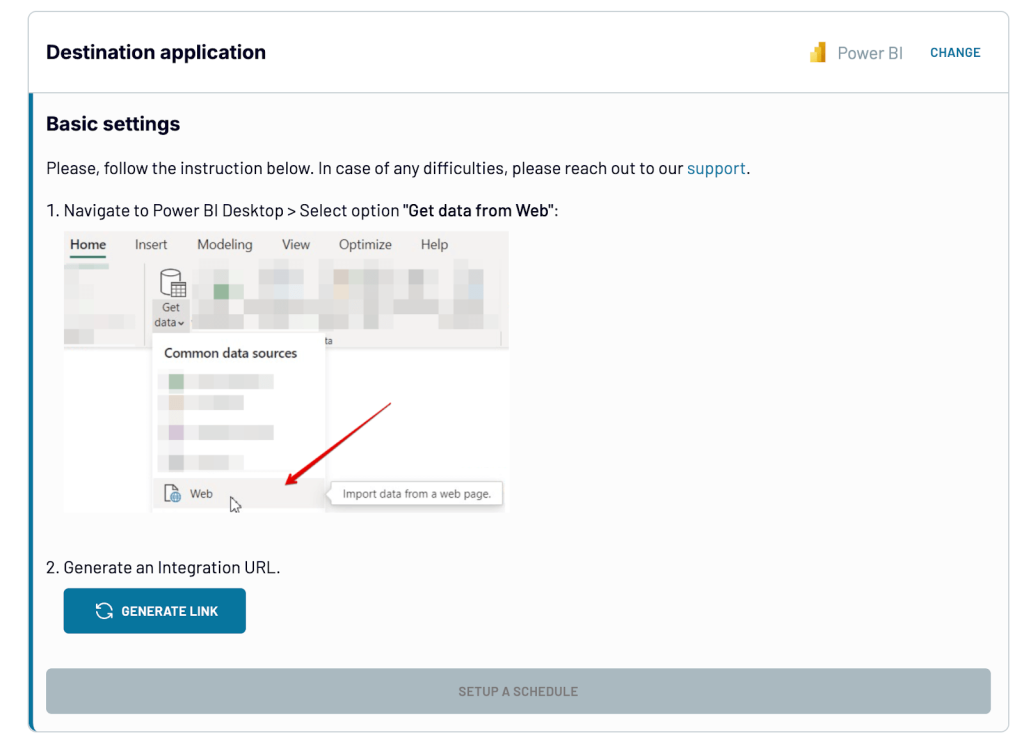
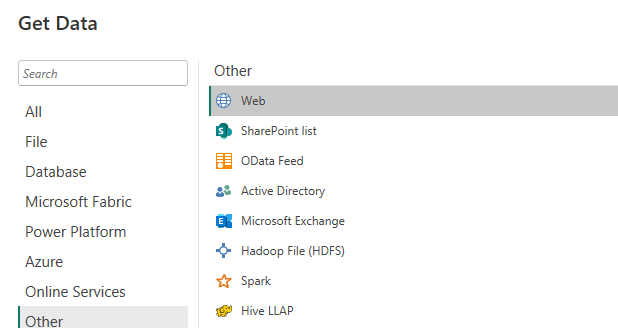
Open Power BI Desktop and go to Get Data > Web.
Paste the integration link that you copied earlier. In the Power Query Editor, you’ll see a preview of the data where you can make additional transformations if needed.
Once you’re done, load the data to Power BI to create visualizations and build custom reports. Power BI will then open the report canvas, where you can view QuickBooks data in pre-formatted charts and tables.
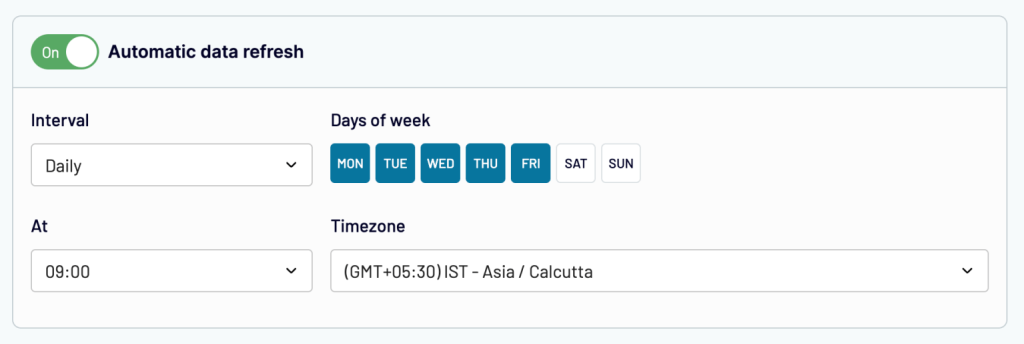
To make your QuickBooks data in Power BI self-updating, go back to Coupler.io and enable Automatic Data Refresh. Set your preferred schedule: you can choose the update frequency, specific days of the week for the refresh, and your time zone to ensure your reports are always updated as needed.
Once done, click Save and Run to send your QuickBooks data to Power BI.
Coupler.io handles automatic syncing, keeping your data refreshed in near real-time for precise data analysis.
What data can you load from QuickBooks Online to Power BI with Coupler.io?
As we mentioned earlier, Coupler.io allows you to export both raw data and reports from QuickBooks. In addition to that, you can also load QuickBooks data sets. These are preconfigured QuickBooks data entities/reports or combinations of those with already implemented transformations, such as aggregations, calculations, new columns added, and unnecessary ones removed, etc. Check out the list of data you can export.
Data entities
Reports
Data set templates
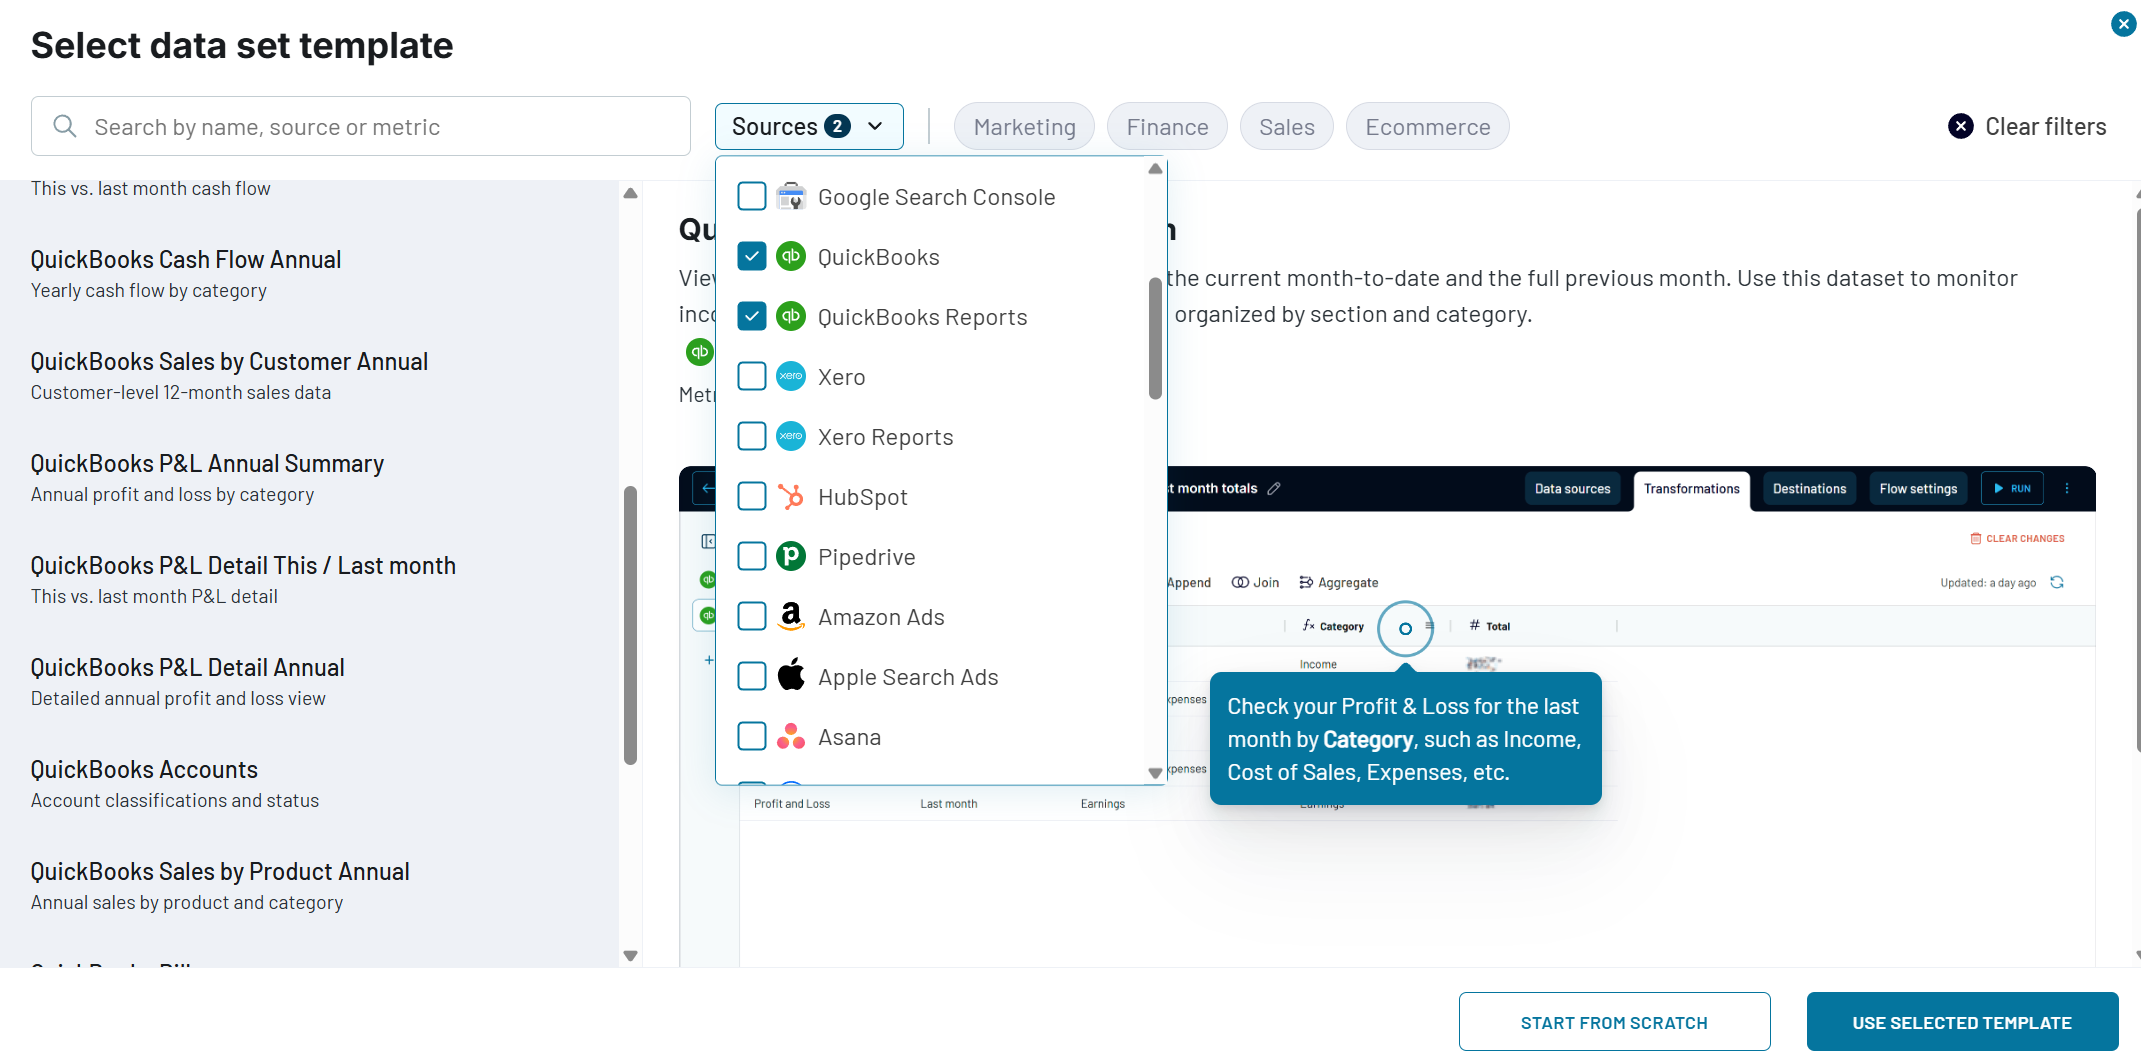
To get a data set for QuickBooks data, you’ll need to create a new data flow from a template and filter data sets by QuickBooks and QuickBooks reports as a source. Then select the needed template and follow the regular flow to load it to Power BI.
Bonus: Free QuickBooks revenue dashboard template by Coupler.io
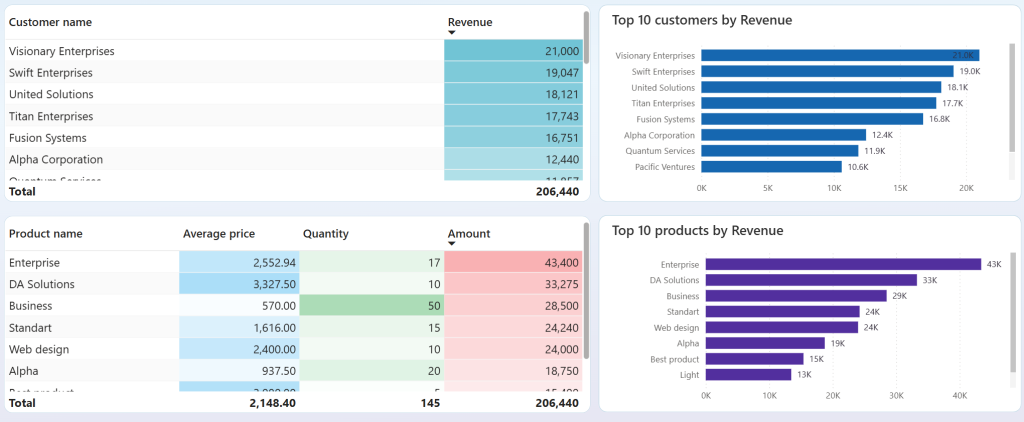
This pre-built revenue dashboard makes it easy to quickly turn your QuickBooks data into a live, interactive report in Power BI in just a few minutes. It’s perfect for business owners and accounting professionals who need a clear and simple way to stay on top of their finances.
QuickBooks revenue dashboard template in Power BI
 Preview dashboard
QuickBooks revenue dashboard template in Power BI
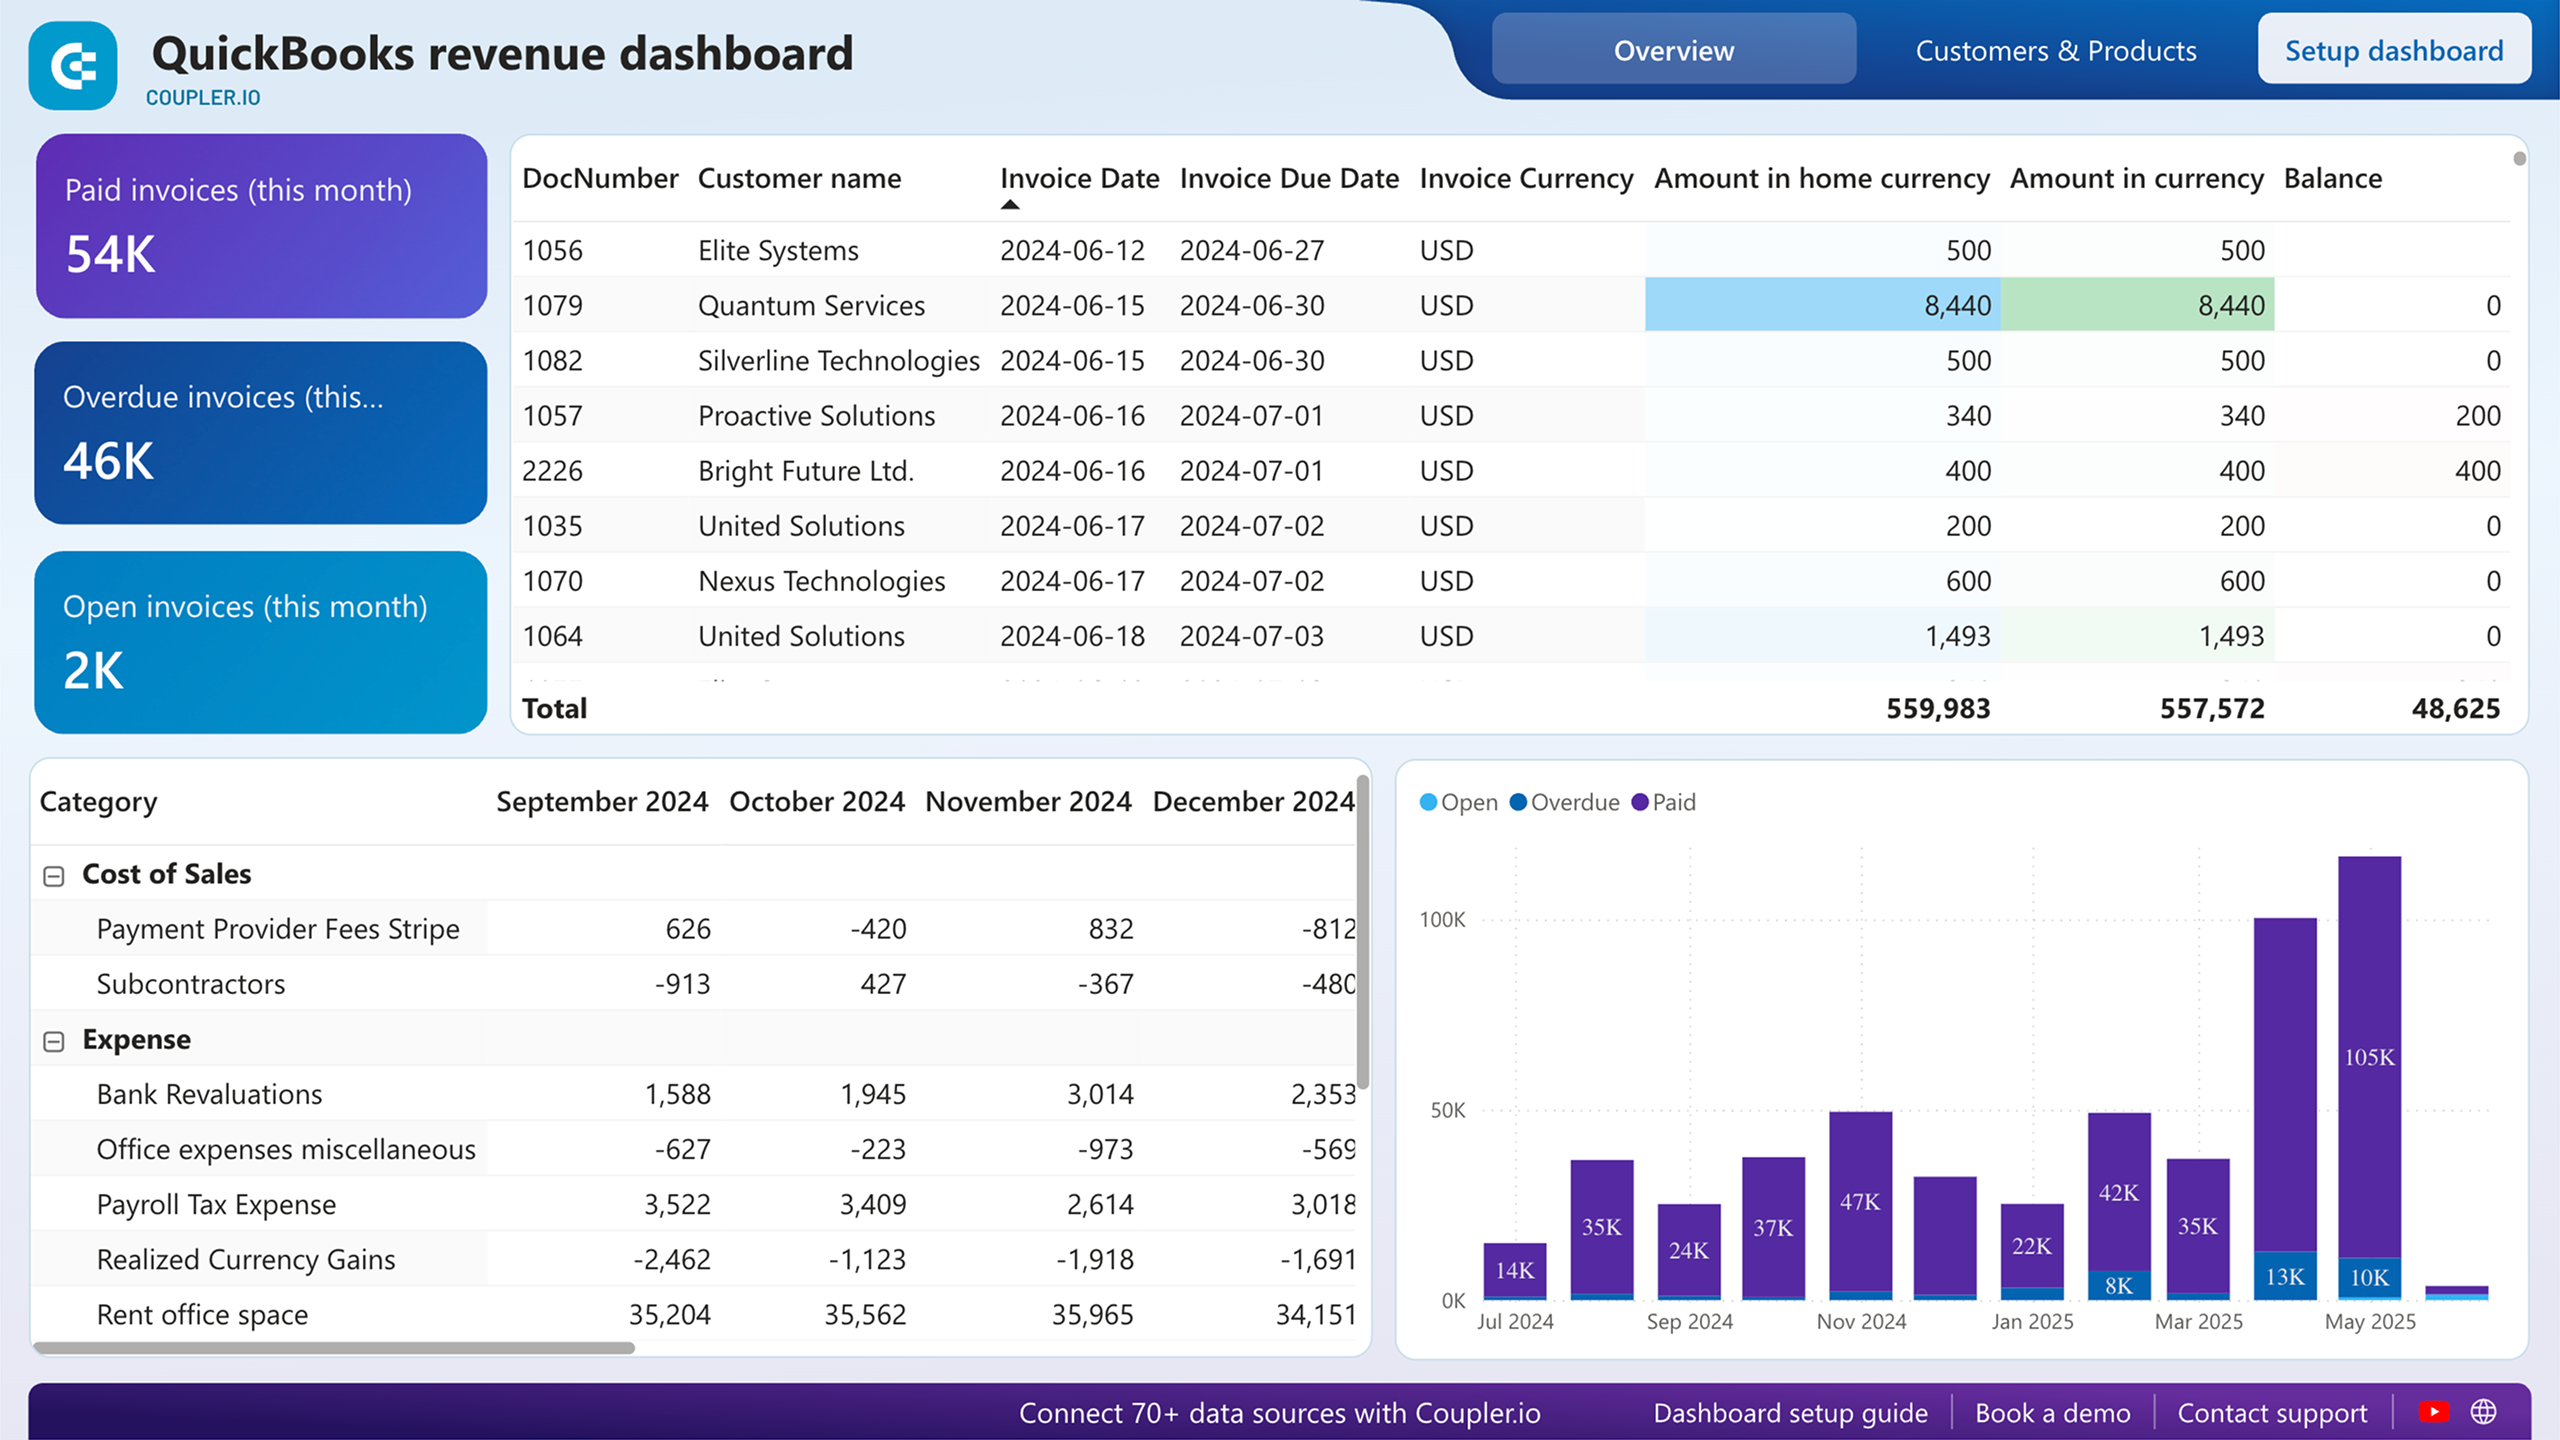
Preview dashboardThe Overview tab provides a year-long view of your revenue trends, making it easy to identify seasonal variations, peak income periods, or unexpected downturns. It also includes a table with invoice details such as due date, amount, and balance.
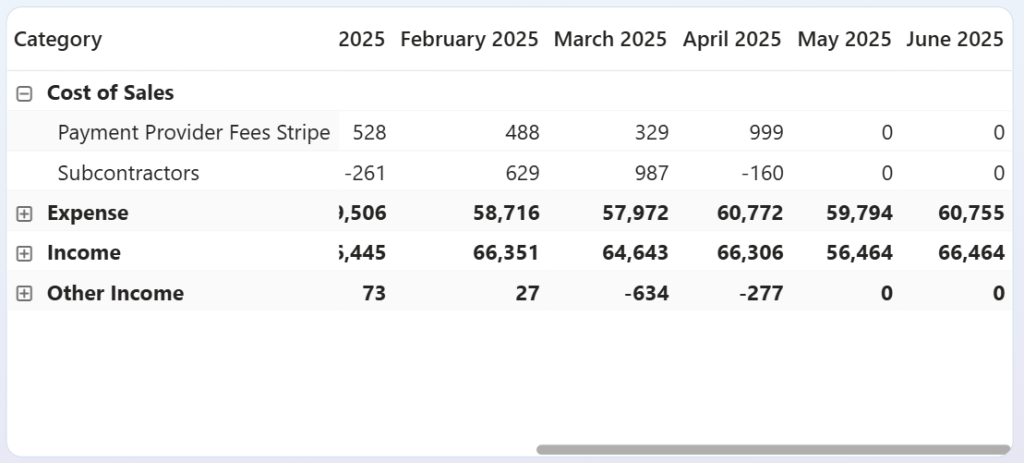
The Profit and Loss Overview complements this by comparing your income to your expenses. This gives you the insights to ensure your budget stays balanced and your financial planning is on point.
In the Customers & Products tab, the QuickBooks dashboard shows your most valuable clients. This is useful to decide where to direct targeted marketing campaigns or loyalty programs. Additionally, the dashboard provides a snapshot of your best-selling products. With this insight, you can analyze your inventory and make data-driven decisions to boost sales performance.
To start using the template, open it and follow the steps described on the Readme tab. You will only need to connect your QuickBooks account. Coupler.io will then handle the rest, making sure your reports are always refreshed automatically, with no extra effort on your part.
Additionally, Coupler.io offers other free templates for Quickbooks reports for Looker Studio and Google Sheets.
Common business use cases for QuickBooks data in Power BI
Now that you understand what QuickBooks data you can access, explore how businesses and you can use this information to solve real challenges.
Multi-entity financial consolidation
If you manage multiple subsidiaries, divisions, or locations with separate QuickBooks instances, consolidating financial data can be a major headache. With Coupler.io data merging capabilities, you can automatically aggregate P&L statements, balance sheets, and cash flow data from multiple QuickBooks accounts into a unified Power BI dashboard.
This is particularly useful for holding companies, franchises, or international businesses that need to handle different chart of accounts structures and currencies. Instead of spending days manually compiling reports, you can reduce your month-end close to just hours while eliminating consolidation errors.
Sales performance and commission tracking
Businesses often struggle to connect CRM performance metrics with the actual collected revenue from QuickBooks. Using Coupler.io, you can blend QuickBooks payment data with sales systems like HubSpot or Salesforce to create Power BI dashboards that show true sales performance beyond just bookings.
These reports enable accurate commission calculations based on collected revenue rather than booked sales, territory performance analysis, and identification of at-risk accounts based on payment patterns. This eliminates commission disputes and provides revenue operations teams with the insights they need to optimize territories and compensation plans.
Multi-location inventory optimization
Retail and distribution businesses operating across multiple locations need centralized inventory visibility. Coupler.io can aggregate inventory data from multiple QuickBooks instances and automatically refresh it in Power BI to provide up-to-date stock level monitoring. Your dashboards will include location-based stock reports, demand pattern analysis, and identification of slow-moving inventory. The result is reduced stockouts, optimized working capital, and data-driven decisions about inventory allocation across locations.
Automate QuickBooks reporting with Coupler.io
Get started for freeManually import your QuickBooks data as an XLSX to Power BI
If you prefer a straightforward method without any connectors or automation tools, you can manually import your QuickBooks data from either QuickBooks Online or Desktop as an Excel file and upload it to Power BI. Here’s how:
Step1: Download Quickbooks data
From QuickBooks Online:
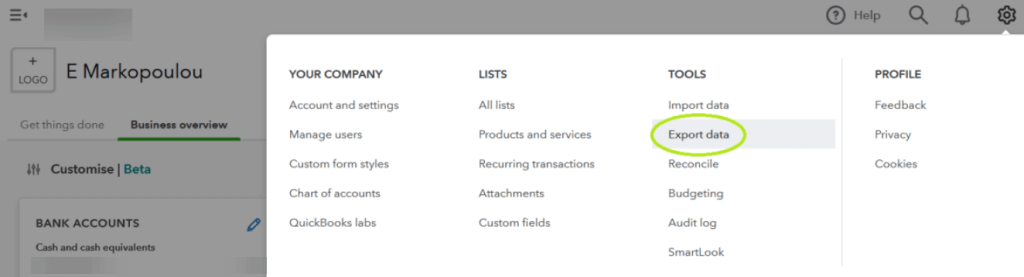
- Login into QuickBooks Online and locate the Gear icon in the top right corner of the screen.
- Select Export Data, the reason for exporting, and click Continue.
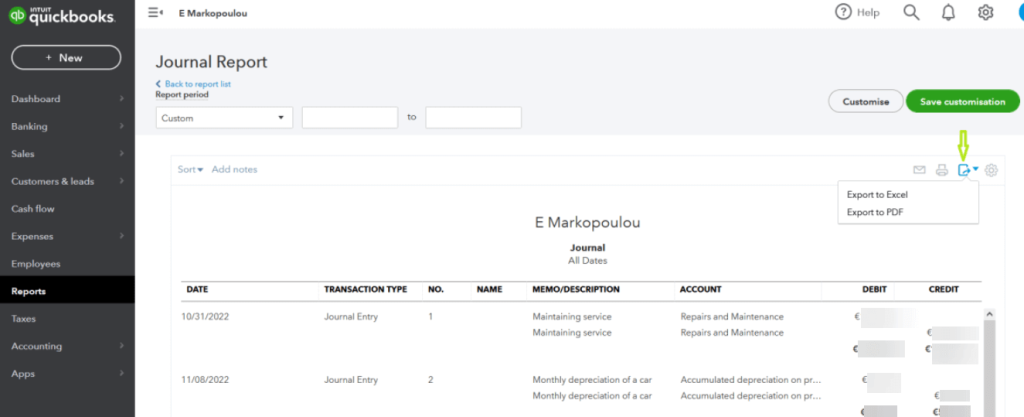
- Go to the Reports tab to choose the date range that fits your needs. You can also customize the data by toggling items in the Reports and Lists tabs.
- Finally, click Export to Excel to download the Excel file to your computer.
From QuickBooks Desktop:
- Open QuickBooks Desktop and navigate to the report you want to export.
- Click the Excel button at the top of the report and choose either Create New Worksheet or Update Existing Worksheet.
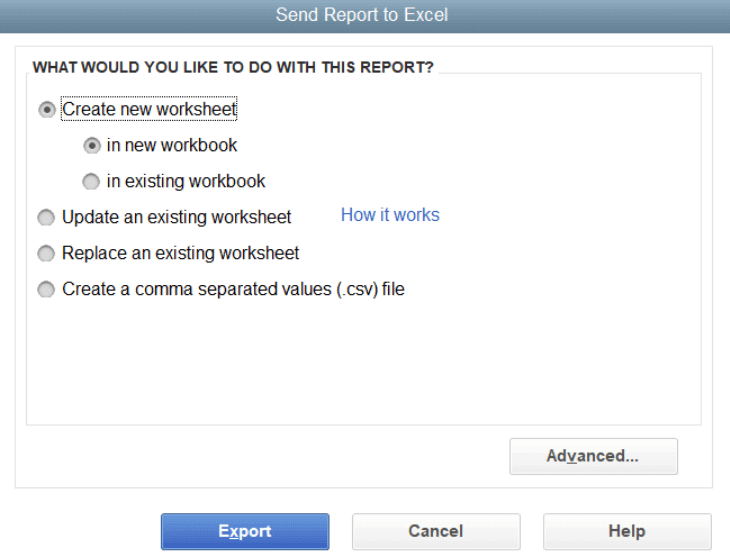
- Select your preferred format, either .xls or .xlsx, and click Export. Then, choose where you want to save the file on your computer.
Once you’ve exported your data from QuickBooks, you can proceed to upload it to Power BI.
Step 2: Import downloaded data to Power BI
- Open Power BI and click Get Data > Excel.
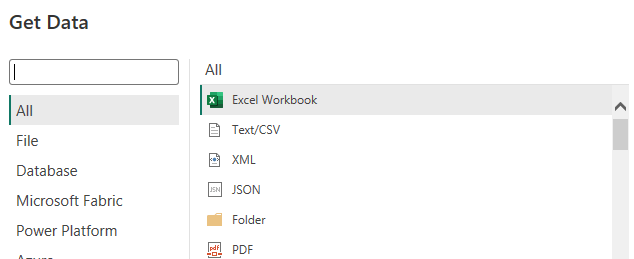
- Select the .XLSX file that you exported from QuickBooks and click Connect. A preview of the data model will be displayed in the Power Query Editor.
- Click Close & Apply to load your dataset into Power BI. Once the data is loaded, you can start building your report using Power BI’s visualization tools.
This manual method is simple and works well for occasional updates or smaller datasets. However, keep in mind that each time you need updated numbers, you’ll need to repeat this process, which becomes time-consuming for frequent financial reporting needs.
What’s the best method to visualize your financial data in Power BI: Recap
We’ve examined several methods for creating QuickBooks Power BI reports. Manual exports work for one-off reports but are not a feasible solution for regular reporting.
The native QuickBooks – Power BI connector was a straightforward option for exporting data. However, it’s no longer available.
If you’re comfortable with coding or have IT support, you can create custom integrations using the API, but this requires ongoing maintenance, which may not be feasible for all teams.
The QuickBooks connector for Power BI by Coupler.io offers a simple, user-friendly experience for data integration. It lets you create data flows from scratch, as well as benefit from ready-made templates both for data sets and dashboards. Furthermore, Coupler.io supports importing data from multiple sources, allowing you to load data from several QuickBooks accounts or even combine data from different sources for your reports.
For more on this topic, see other articles on our blog:
- How to export data from QuickBooks
- Building a QuickBooks dashboard
- QuickBooks report templates


