Rows became popular because it combined three things in one place: a spreadsheet interface, live data connections, and built-in AI. You could pull data from different tools, analyze it inside a familiar grid, and automate updates without setting up complex pipelines.
However, Rows.com has announced it will wind down by May 31, 2026, and join Superhuman. As part of this transition, existing workflows, including integrations, scheduled refreshes, and dashboards, will eventually stop working. If you rely on Rows today, you need to move to a new setup before that deadline.
I’ve analyzed the 6 best Row alternatives in 2026 and shared my insights to help you choose the right tool for your AI-powered analysis.
Quick comparison of Rows.com alternatives
The Rows alternatives below cover different parts of that workflow:
- Data integration and automated pipelines
- AI-powered analysis and reporting
- Spreadsheet-based workflows with AI.
No single tool replaces Rows in exactly the same way. Some focus on data pipelines and automation. Others focus on AI analysis. A few replicate the spreadsheet experience itself. Check out my at-a-glance comparison of the best Rows.com alternatives.
At-a-glance comparison of the best Rows alternatives
| Tool | Best for | Starting price | Data connectors | Spreadsheet interface | AI capabilities | Scheduled refresh |
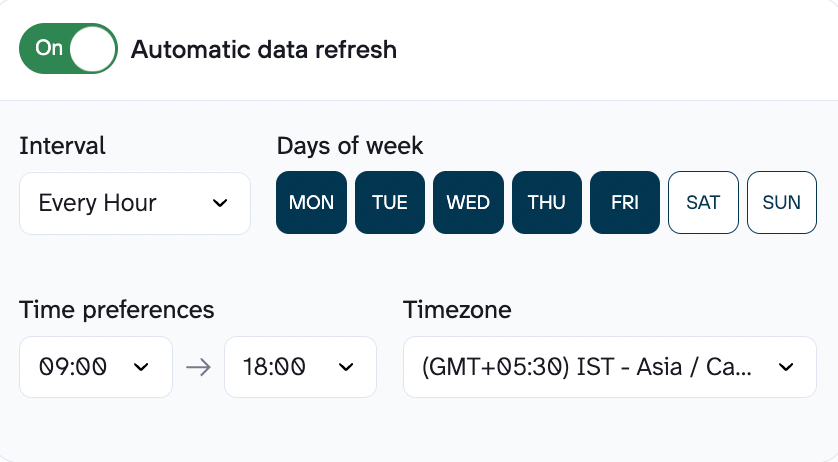
| Rows | AI-powered spreadsheet with live data | Not applicable | ~50+ SaaS integrations | ✅ | AI Analyst, AI-generated subtitles, native AI functions | ⚠️ Limited |
| Coupler.io | Automated reporting and data pipelines across multiple destinations | $24/month | 400+ (SaaS, databases, APIs) | ⛔ | AI Agent, AI Insights, AI Integrations (MCP data layer for Claude, ChatGPT, Perplexity) | ✅ |
| Julius AI | Conversational analysis with scheduled reports | $16/month | Databases (Postgres, Snowflake, BigQuery) + business tools (Google Ads, Stripe) | ⛔ | Conversational analysis, auto-generated charts, scheduled notebooks | ✅ |
| Quadratic | AI spreadsheet with Python/SQL visibility | Free (paid from $18/user/month) | Databases + file uploads | ✅ | AI code generation (Python, SQL), AI-assisted transformations | ⚠️ Limited |
| ChatGPT | One-off analysis from uploaded files or connected data sets | $20/month | ⚠️ Via Apps (incl. Coupler.io); file uploads | ⛔ | GPT-4o, Python execution, chart generation, statistical testing | ⛔ |
| Microsoft Copilot in Excel | AI assistance inside Excel workflows | $30/user/month | ⚠️ Excel-based (Power Query for external) | ✅ | Formula generation, data summarization, chart creation from prompts | ⚠️ Limited |
| Numerous.ai | AI functions inside Sheets/Excel cells | $8/month | ⛔ Spreadsheet-only | ✅ | ChatGPT-powered: =AI() function for classification, tagging, enrichment, text generation | ⚠️ Limited |
1. Top Rows.com alternative: Coupler.io
Coupler.io is a no-code data integration platform & AI analytics that keeps your data moving between the tools you already use, without locking you into a single interface.
It connects to 400+ sources (marketing platforms, financial systems, databases, APIs) and sends that data to where you actually analyze it: Google Sheets, Excel, BI tools, data warehouses, JSON endpoints, or AI systems. The data layer sits between your sources and your destinations.
That separation makes it a strong replacement for Rows. Where Rows bundles data, analysis, and reporting into one environment, Coupler.io keeps data fresh, structured, and usable across multiple tools. Pipelines run independently, so your setup doesn’t break every time your workflow evolves.
Coupler.io also adds an AI layer on top of that data. The built-in AI Agent generates insights directly inside the platform for your data flows. At the same time, you can use external AI tools like ChatGPT or Claude for conversational analysis. In this case, Coupler.io acts as an MCP data layer providing structured, continuously updated data flows into those systems without manual file exports.
As Rows.com winds down, this matters. You’re not just replacing a spreadsheet. You’re rebuilding your workflow in a way that holds up as your data grows.
What users get with Coupler.io
A single connector layer pulls data from 400+ sources, with no separate integrations to manage and no plan restrictions on which connectors you access.
Data isn’t locked inside a single interface. Send it to Google Sheets, Excel, BI tools, data warehouses, JSON endpoints, or AI tools. The same dataset powers multiple systems without rebuilding pipelines.
Transformations happen as the data flows in. Filtering, sorting, aggregation, and dataset combination are handled before the data reaches its destination, which reduces cleanup work and keeps outputs consistent.
Getting started is also faster with prebuilt assets. Around ~150 dataset templates and 200+ dashboard templates provide a working foundation for common reporting use cases, adjustable to match your workflow.
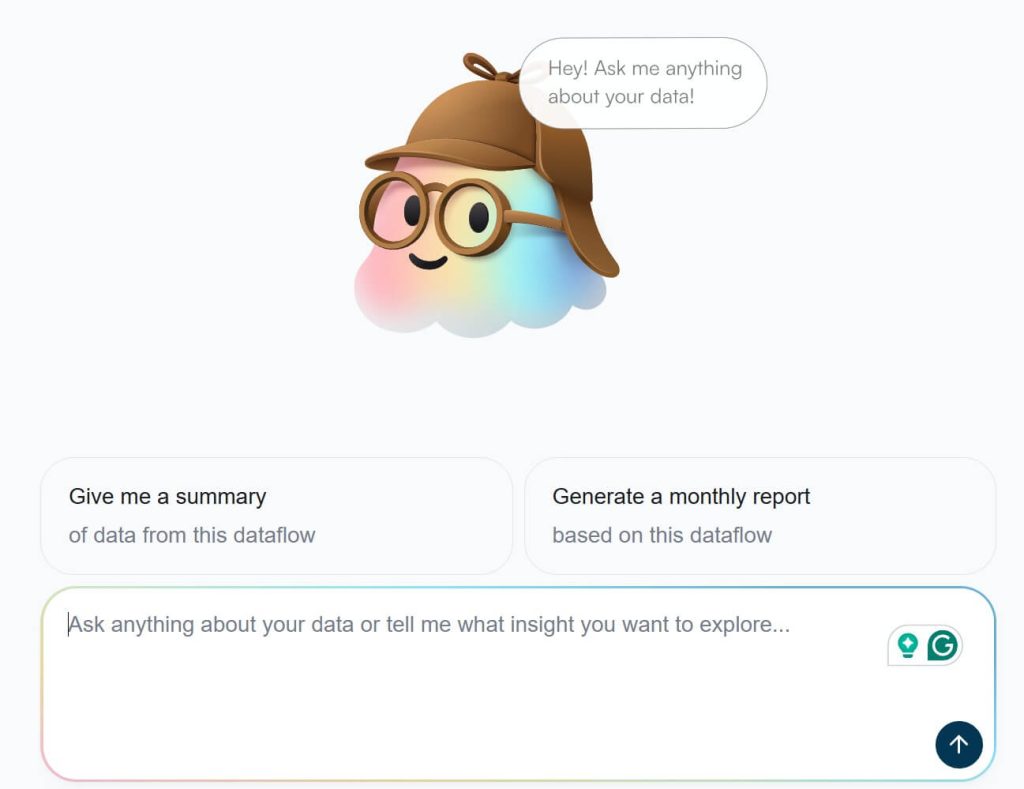
The AI layer runs on fresh, structured data rather than static files. The built-in AI Agent generates insights inside the platform.
At the same time, you can integrate your data sets with external AI tools. Including Claude, Gemini, ChatGPT, Perplexity, and Cursor. For tech enthusiasts, Coupler.io also added OpenClaw as a destination. AI workflows run on the same pipelines that power your reporting without manual exports or stale snapshots.
Data stays up to date through flexible scheduling: every 15 minutes, hourly, daily, or monthly. Webhook-based triggers handle event-driven updates for more dynamic use cases.
Pricing overview
Pricing is structured to avoid feature gating. All sources and destinations are available from the start, so workflows scale without needing to upgrade just to unlock connectors. Plans start at $24/month (billed annually), with a free plan and a 7-day trial that includes full Pro access.
Pros
- Runs in the background once set up, so you’re not constantly checking or fixing reports
- Fits into your existing stack instead of forcing you to switch tools
- Handles messy, multi-source workflows better than spreadsheet-only setups
- Starts to feel like infrastructure rather than “another tool” over time
Cons
- No built-in spreadsheet interface; requires using external tools like Google Sheets or BI platforms for analysis
- May feel like overkill for very small workflows or one-off reporting tasks
- Initial setup can take longer than spreadsheet-only tools if you’re new to data pipelines
Coupler.io vs Rows.com (head-to-head comparison)
| Feature | Coupler.io | Rows |
| Data sources | 400+ (all plans) across SaaS tools, databases, APIs | ~50+ |
| Unified UI for destinations | ✅ One tool, flexible outputs across multiple destinations | ⛔ Spreadsheet-only environment |
| Min. refresh frequency | Every 15 min + webhooks for event-based updates | Limited |
| Data transformation | Filter, sort, aggregation, join, custom calculations | Basic spreadsheet transformations |
| Prebuilt templates | ✅ Dataset + dashboard templates | Limited |
| Data destinations | Spreadsheets, BI tools, data warehouses, JSON, AI tools | Spreadsheet only |
| AI integration | ✅ Built-in AI Agent + external AI tools | Limited to in-app AI |
| AI-generated insights | ✅ | ✅ |
| Webhooks and automation | ✅ | ⛔ |
| Pricing starts at | $24/month | Not applicable |
When to use Coupler.io instead of Rows.com
Choose Coupler.io if you:
- Need self-updating data pipelines, not manual uploads
- Want structured data ready for AI, not raw exports
- Send data to multiple destinations beyond spreadsheets
- Require automation and scheduled workflows that scale
- Look for a long-term solution that won’t break when a single product changes direction
If your Rows workflows are breaking soon, this is the fastest way to rebuild them without duct-taping multiple tools.
Integrate data from 400 sources and analyze it with AI using Coupler.io
Get started for free2. Julius AI
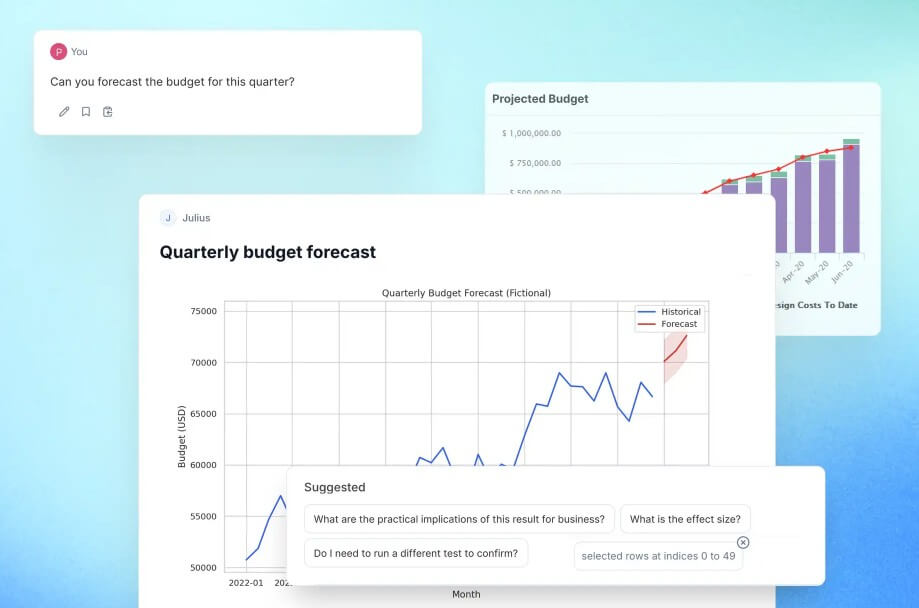
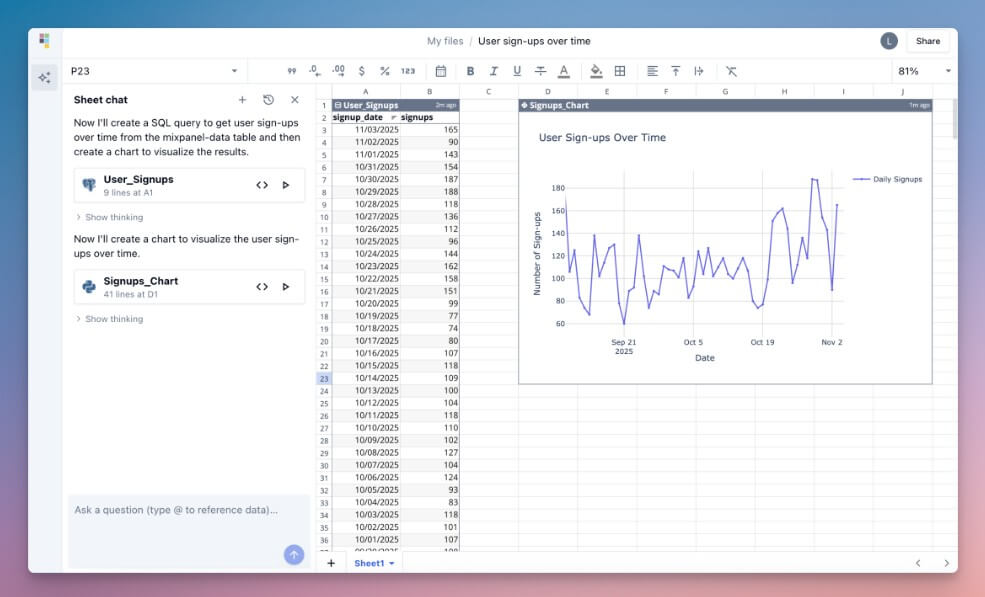
Where Rows kept you inside a spreadsheet, Julius AI removes the spreadsheet entirely. It’s a conversational data analysis tool: connect your data, ask questions in plain English, get charts, tables, or summaries back.
Julius connects to databases like Postgres, Snowflake, and BigQuery, as well as business tools such as Google Ads and Stripe.
It’s best suited for AI-driven analysis workflows and recurring insight generation — not spreadsheet-based work. Use it when you want to:
- Explore datasets quickly
- Generate insights without building dashboards
- Deliver recurring reports through scheduled workflows
If Rows.com was about combining data and spreadsheets in one place, Julius focuses on the analysis layer itself.
Julius AI vs Coupler.io vs Rows.com
| Feature | Julius AI | Coupler.io | Rows |
| Data sources | Databases + business tools | 400+ (all plans) across SaaS, DBs, APIs | ~50+ |
| Unified UI for destinations | ⛔ Analysis-focused only (no multi-destination workflows) | ✅ One tool, flexible outputs | ⛔ Spreadsheet-only |
| Min. refresh frequency | Scheduled notebooks with automated delivery | Every 15 min + webhooks | Limited |
| Data transformation | Query-based analysis (SQL-style logic) | Filter, sort, aggregation, join | Basic |
| Prebuilt templates | Notebooks for reusable analysis | ✅ Dataset + dashboard templates | Limited |
| Data destinations | Charts, reports, Slack/email delivery | BI tools, spreadsheets, warehouses, AI tools | Spreadsheet only |
| AI integration | ✅ Core functionality (AI-first tool) | ✅ Built-in + external AI tools | Limited |
| AI-generated insights | ✅ | ✅ | ✅ |
| Webhooks and automation | ⛔ | ✅ | ⛔ |
| Pricing starts at | $16/month | $24/month | Not applicable |
Integrations overview
Julius connects to sources that are already structured and ready for analysis. Databases like Postgres, Snowflake, and BigQuery, along with business tools such as Google Ads and Stripe are all a part of the list. You can also work with uploaded files like CSVs or Excel sheets, and depending on the plan, pull data from cloud storage like Google Drive or OneDrive.
The key distinction is intent. Julius is not trying to move data between systems or keep it synced across tools. It assumes your data already exists somewhere stable and focuses on bringing it into a workspace where you can interrogate it quickly.
Features overview
Julius compresses the time between a question and a usable answer.
- Ask questions in plain English instead of writing SQL or building formulas
- Save analysis steps as notebooks so they can be rerun or refined later
- Schedule recurring reports that deliver results to Slack or email
- Automatically retry failed queries, which matters for larger datasets
- Generate charts and tables alongside explanations, not as separate steps
So, you’re not building dashboards or reports first. You’re exploring patterns, validating hypotheses, and iterating on questions until the insight becomes clear.
Pricing overview
Julius AI offers a free plan with limited usage, along with paid tiers starting at $16/month.
Higher tiers like Pro and Business expand usage limits, add team features, and support more advanced workflows. Pricing scales based on both usage and seats, which works well for small teams but can grow quickly as adoption increases.
Pros
- Feels closer to working with an analyst than operating a tool
- Turns raw datasets into usable answers without building dashboards first
- Scheduled reporting replaces a lot of manual update workflows
- Works across both database connections and uploaded data
Cons
- Not designed to manage or sync data across systems
- No spreadsheet interface for structured modeling or manual control
- Less transparency into how results are generated compared to code-first tools
- Outputs still need validation for critical decisions
When to use Julius AI over Rows.com
Use Julius AI when your priority is exploring and understanding data quickly, not managing it.
It’s a good choice when your data is already structured, and you want a faster way to generate insights, run analysis, and deliver reports without building spreadsheets or dashboards.
3. Quadratic
Every AI tool on this list gives you answers. Quadratic gives you the code behind those answers.
It looks like a standard spreadsheet, but every AI-generated output is backed by Python or SQL you can inspect, edit, and extend. This makes it a hybrid between a traditional spreadsheet and a coding environment. Every transformation or calculation is visible. Moving from quick exploration to controlled, reproducible analysis is straightforward.
Quadratic is the strongest fit for technical teams that want spreadsheet workflows with code visibility and control. It’s particularly useful when:
- You need to validate how results are generated
- You want to extend AI outputs with custom logic
- You prefer a hybrid workflow between spreadsheets and programming
Where Rows focused on ease of use, Quadratic leans toward control and transparency.
Quadratic vs Coupler.io vs Rows.com
| Feature | Quadratic | Coupler.io | Rows |
| Data sources | Files, databases | 400+ (all plans) across SaaS, DBs, APIs | ~50+ |
| Unified UI for destinations | Spreadsheet-focused (single environment) | ✅ One tool, flexible outputs | ⛔ Spreadsheet-only |
| Min. refresh frequency | Limited | Every 15 min + webhooks | Limited |
| Data transformation | Code-driven (Python, SQL) | Filter, sort, aggregation, join | Basic |
| Prebuilt templates | ⛔ | ✅ Dataset + dashboard templates | Limited |
| Data destinations | Spreadsheet-focused | BI tools, spreadsheets, warehouses, AI tools | Spreadsheet only |
| AI integration | ✅ AI + code generation | ✅ Built-in + external AI tools | Limited |
| AI-generated insights | ✅ | ✅ | ✅ |
| Webhooks and automation | ⛔ | ✅ | ⛔ |
| Pricing starts at | $18/user/month | $24/month | Not applicable |
Integrations overview
Quadratic assumes your data is already in place and focuses on what happens after you load it. You can connect to databases for structured datasets or work directly with files like CSVs and Excel sheets. It doesn’t try to act as a connector layer or keep data synced across systems.
That boundary is intentional. Quadratic is built for analysis you can control, not data you need to move.
Features overview
The difference between Quadratic and tools like Julius or ChatGPT is accountability. You don’t just get an answer, you get the logic with the help of:
- Spreadsheet interface that behaves like Excel
- Python and SQL cells generated alongside results
- AI that writes code instead of hiding it
- Full control to edit, extend, or debug every step
For teams that need reproducibility or want to build on top of AI outputs, that distinction matters.
Pricing overview
Quadratic offers a free plan for individual use, with paid tiers starting at $18/user/month for collaboration and team workflows.
However, keep in mind that the starting price with AI included is $20.
It sits closer to developer tooling than traditional spreadsheets, and the pricing reflects that positioning.
Pros
- Makes AI outputs transparent instead of hiding the logic
- Strong fit for teams that need reproducible or auditable analysis
- Combines spreadsheet familiarity with programmable flexibility
- Lets you extend AI-generated work instead of starting over
Cons
- Not built for syncing or managing data across tools
- No automation layer for recurring workflows
- Requires some technical comfort to use effectively
- Slower for quick answers compared to chat-based tools
When to use Quadratic over Rows.com
Choose Quadratic if you want a spreadsheet replacement with deeper analytical control.
This is best for combining spreadsheet workflows with programmable logic, especially for teams that validate or extend AI-generated results.
4. ChatGPT
Connect data. Ask a question. Get a chart, a statistical test, or a cleaned dataset back. That’s ChatGPT’s data analysis workflow.
ChatGPT runs Python behind the scenes to clean, transform, and visualize whatever you upload. It handles CSVs, Excel sheets, and PDFs.
Moreover, with ChatGPT apps (former connectors) like the one by Coupler.io, you can integrate your source data for analysis.
The tradeoff: everything happens within a session. There’s no persistent dataset or structured workflow unless you rebuild it each time. It’s designed for one-off exploratory analysis and quick data investigations.
It works well when you:
- Need to analyze a dataset quickly
- Test hypotheses or explore patterns
- Don’t need long-term automation or pipelines
Compared to Rows.com, ChatGPT focuses entirely on flexibility and depth of analysis, not workflow management.
ChatGPT vs Coupler.io vs Rows.com
| Feature | ChatGPT | Coupler.io | Rows |
| Data sources | File uploads + Apps (incl. Coupler.io, Google Drive) | 400+ (all plans) across SaaS, DBs, APIs | ~50+ |
| Unified UI for destinations | ⛔ Analysis-only (no persistent outputs) | ✅ One tool, flexible outputs | ⛔ Spreadsheet-only |
| Min. refresh frequency | ⛔ No scheduled refresh | Every 15 min + webhooks | Limited |
| Data transformation | Python-based analysis and processing | Filter, sort, aggregation, join | Basic |
| Prebuilt templates | ⛔ | ✅ Dataset + dashboard templates | Limited |
| Data destinations | Charts, outputs within session | BI tools, spreadsheets, warehouses, AI tools | Spreadsheet only |
| AI integration | ✅ Core product | ✅ Built-in + external AI tools | Limited |
| AI-generated insights | ✅ | ✅ | ✅ |
| Webhooks and automation | ⛔ | ✅ | ⛔ |
| Pricing starts at | $20/month | $24/month | Not applicable |
Integrations overview
ChatGPT originally worked only with uploaded files such as CSVs, Excel sheets, PDFs analyzed within a session. That’s changed. ChatGPT now supports Apps (formerly called connectors) that pull data from external tools directly into the chat.
Coupler.io is one of these Apps, meaning you can load structured, scheduled data from 400+ sources into ChatGPT without manual file uploads. Other Apps connect to tools like Google Drive, OneDrive, and various SaaS platforms, though the available Apps and their depth vary by plan.
The key distinction remains: ChatGPT is an analysis environment, not a data pipeline. Even with Apps, there’s no persistent dataset, no scheduled refresh inside ChatGPT itself, and no structured workflow that carries over between sessions. The data connection gets you better inputs, but the session-based nature stays the same.
Features overview
ChatGPT behaves less like a tool and more like a sandbox for working through data problems.
- Runs Python in the background to clean, transform, and analyze datasets
- Generates charts and summaries on demand
- Handles open-ended questions without a predefined structure
The strength here is flexibility. You work through a problem in real time: test ideas, refine questions, and iterate until you get what you need. That makes it powerful for exploration, but unreliable as a system.
Pricing overview
ChatGPT offers a free tier with limited capabilities, and the Go plan for $7/month. However, advanced reasoning models start at $20/month for the Plus subscription.
Team and Business tiers are available for collaborative use, but the core limitation remains the same: usage is session-based rather than workflow-based.
Pros
- Extremely flexible across different types of datasets and questions
- Strong for exploratory analysis and hypothesis testing
- No setup required beyond uploading data
- Can handle complex transformations without writing code directly
Cons
- Apps bring in external data, but there’s no persistent pipeline or scheduled refresh inside ChatGPT
- No persistent workflows, dashboards, or automation
- Requires re-uploading and re-contextualizing data each time
- Outputs can vary and require validation for accuracy
When to use ChatGPT over Rows.com
Use ChatGPT when the problem is unclear and you need to figure it out quickly. It’s best suited for one-off analysis, quick investigations, and situations where you don’t yet know what questions to ask. Once the workflow becomes repeatable or needs to run on fresh data, you need a more structured system.
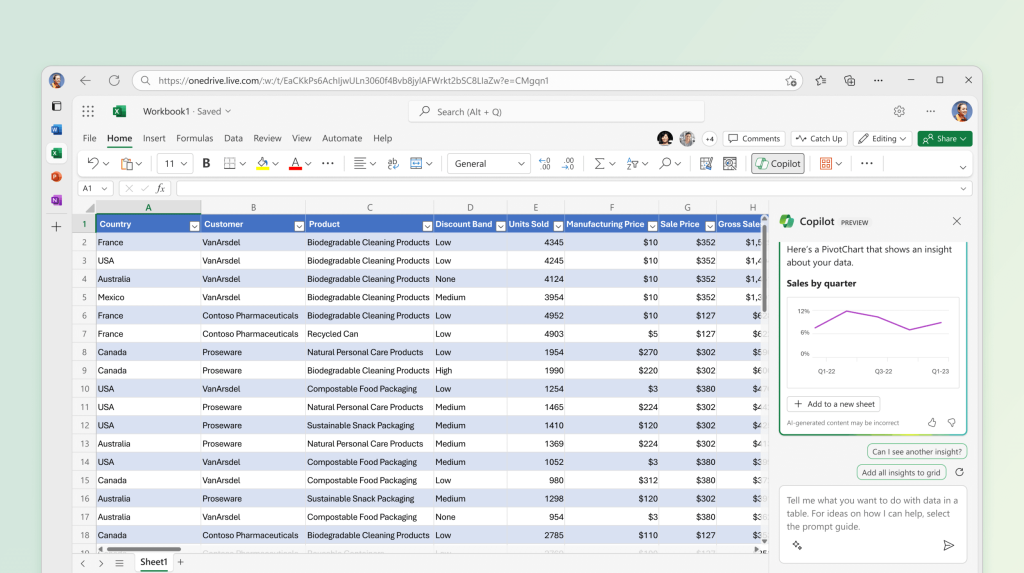
5. Microsoft Copilot in Excel
If your team already lives in Excel, Copilot is the path of least resistance. It adds AI-powered analysis directly into the spreadsheet. You won’t have to adopt a new tool or rebuild workflows.
Copilot generates formulas, summarizes datasets, highlights trends, and creates charts from natural language prompts. It’s an AI assistant inside the spreadsheet, not a separate analytics or pipeline tool.
Best suited for Excel-first organizations that want AI capabilities without changing their existing workflows. It works when your data is already in Excel, and your goal is to analyze and present it faster, not to build automated pipelines.
Copilot vs Coupler.io vs Rows.com
| Feature | Copilot in Excel | Coupler.io | Rows |
| Data sources | Excel-based (external data requires setup) | 400+ (all plans) across SaaS, DBs, APIs | ~50+ |
| Unified UI for destinations | Excel-only environment | ✅ One tool, flexible outputs | ⛔ Spreadsheet-only |
| Min. refresh frequency | Limited | Every 15 min + webhooks | Limited |
| Data transformation | Spreadsheet formulas + AI assistance | Filter, sort, aggregation, join | Basic |
| Prebuilt templates | Excel templates | ✅ Dataset + dashboard templates | Limited |
| Data destinations | Excel | BI tools, spreadsheets, warehouses, AI tools | Spreadsheet only |
| AI integration | ✅ Built-in assistant | ✅ Built-in + external AI tools | Limited |
| AI-generated insights | ✅ | ✅ | ✅ |
| Webhooks and automation | ⛔ | ✅ | ⛔ |
| Pricing starts at | $30/user/month | $24/month | Not applicable |
Integrations overview
Copilot lives inside Excel and works with the data already there. External data still needs to be brought in through tools like Power Query or Power BI. Copilot doesn’t replace that layer. It builds on top of it.
This matters because Copilot assumes your workflow is already defined. Data comes in, lives in Excel, and gets analyzed there. Copilot steps in at that final stage, where most of the manual effort usually happens. Connectivity isn’t the goal. Execution speed is.
Features overview
Copilot removes the friction from everyday Excel work.
- Translate plain language into formulas without writing them manually
- Summarize large datasets without building complex pivot tables
- Generate charts instantly instead of configuring them step by step
The workflow stays the same, but the effort drops. Describe what you want, get a usable result. For example:
- “
Show monthly revenue growth by region” → chart + breakdown - “
Highlight outliers in this dataset” → filtered view - “
Create a formula to calculate weighted averages” → working formula
It doesn’t change how your data flows. It changes how quickly you can work with it.
Pricing overview
Copilot in Excel is part of Microsoft 365 Copilot, priced at $30/user/month as an add-on to eligible Microsoft 365 plans.
For teams already operating inside Microsoft 365, this is an upgrade layered onto existing workflows rather than a new system to adopt.
Pros
- Keeps Excel workflows intact while removing a lot of manual effort
- Speeds up common tasks like formulas, summaries, and chart creation
- Easy adoption for teams already comfortable with Excel
- Integrates cleanly into Microsoft 365 environments
Cons
- Still depends on data being manually prepared or imported into Excel
- Limited flexibility outside the Microsoft ecosystem
- No built-in pipeline, syncing, or automation layer
- Not designed for exploratory or open-ended analysis
When to use Copilot in Excel over Rows.com
Use Copilot when Excel is already your system of record. It’s a strong fit when the workflow is defined, and the goal is execution speed, not rebuilding how your data moves or how your systems connect.
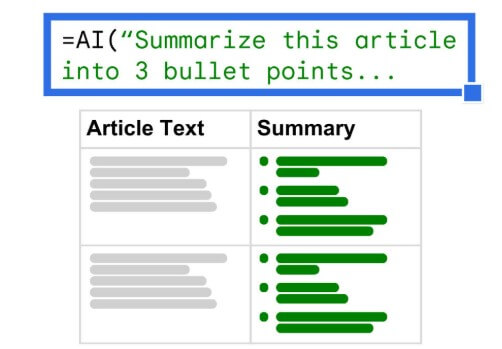
6. Numerous.ai
Most AI tools on this list replace the spreadsheet or sit alongside it. Numerous.ai works inside it and runs on ChatGPT.
It’s a plugin for Google Sheets and Excel that brings ChatGPT directly into cells. You type a prompt using the =AI() function, and ChatGPT processes it in the background. Define a prompt once, and Numerous executes it across hundreds or thousands of rows, be it classification, tagging, enrichment, content generation, etc. Repetitive manual tasks become scalable operations.
Think of it as ChatGPT applied at the row level: same model, but structured for bulk execution inside spreadsheets rather than one-off conversations.
Numerous.ai is best for bulk AI operations inside spreadsheets, especially structured data that needs enrichment or labeling. It works well when you:
- Need to process large datasets row by row
- Apply the same logic across many entries
- Automate repetitive spreadsheet tasks without leaving the tool
Rows combines multiple layers of workflow, while Numerous.ai is more focused on one layer done efficiently: cell-level automation at scale.
Numerous.ai vs Coupler.io vs Rows.com
| Feature | Numerous.ai | Coupler.io | Rows |
| Data sources | Spreadsheet-based (Google Sheets, Excel) | 400+ (all plans) across SaaS, DBs, APIs | ~50+ |
| Unified UI for destinations | Plugin inside spreadsheet | ✅ One tool, flexible outputs | ⛔ Spreadsheet-only |
| Min. refresh frequency | Limited | Every 15 min + webhooks | Limited |
| Data transformation | Cell-level operations | Filter, sort, aggregation, join | Basic |
| Prebuilt templates | ⛔ | ✅ Dataset + dashboard templates | Limited |
| Data destinations | Spreadsheet | BI tools, spreadsheets, warehouses, AI tools | Spreadsheet only |
| AI integration | ✅ Cell-level AI functions | ✅ Built-in + external AI tools | Limited |
| AI-generated insights | Limited to cell outputs | ✅ | ✅ |
| Webhooks and automation | ⛔ | ✅ | ⛔ |
| Pricing starts at | $8/month | $24/month | Not applicable |
Integrations overview
ChatGPT to Sheets Numerous.ai applies AI directly to your spreadsheet data. It runs as a Google Sheets plugin or an Excel add-in, working on the data already in your grid. There’s no external connection layer, no syncing between tools, and no concept of a centralized data pipeline.
That boundary is intentional. Numerous sits at the very end of the workflow, where data is already collected and organized, and the work shifts from moving data to processing it.
If your process involves pulling data from multiple systems or keeping it continuously updated, that still happens outside of Numerous. Its role begins once the dataset is ready.
Features overview
Numerous.ai is built for repetition. Define an operation once, and apply it across the entire dataset:
- =AI() function feeds prompts directly to ChatGPT from any cell
- Bulk processing across rows using a single prompt
- Text generation, classification, tagging, and enrichment
- Infer function learns from a few examples and completes the rest
The value shows when the task stays the same, but the dataset grows. For example:
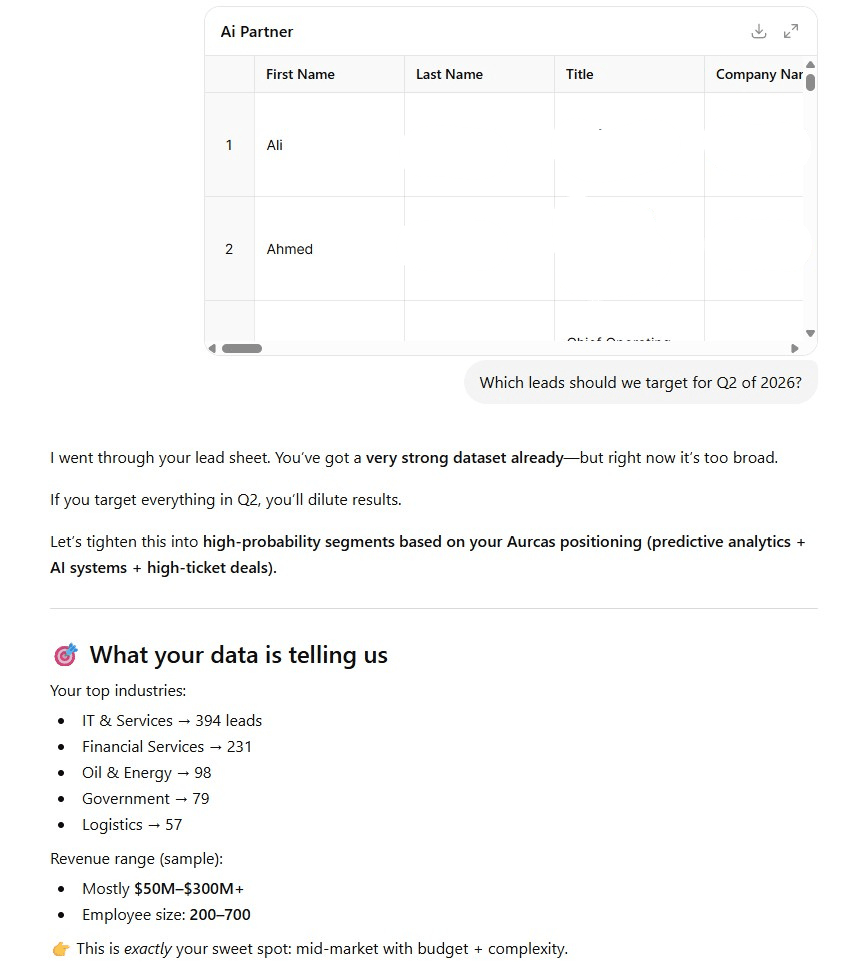
- Enrich a lead list by generating descriptions for every row
- Classify support tickets into categories in one pass
- Clean and standardize messy text fields across thousands of entries
It’s not designed for exploration or deep analysis. It’s designed to take repetitive work and compress it into a single step.
Pricing overview
You won’t find the Numerous.ai pricing until you complete the onboarding. Smart move. I have done this and discovered that their paid plans start at $8/month, with higher tiers based on usage and volume.
The pricing reflects how often and how heavily you run ChatGPT operations across your data, rather than how many features you unlock.
Pros
- Fits directly into Sheets or Excel with no workflow disruption
- Handles large-scale, repetitive tasks across rows efficiently
- Fast to set up and start using
- Strong for enrichment, tagging, and content generation at scale
Cons
- Doesn’t handle data pipelines or syncing between tools
- Limited beyond cell-level operations
- No conversational interface for deeper analysis
- Relies heavily on how well your spreadsheet is structured
When to use Numerous.ai over Rows.com
Use Numerous.ai when the work happens inside the spreadsheet and needs to scale.
It’s a strong fit for tasks like enriching leads, tagging content, or transforming datasets where the logic is simple but the volume is high. It doesn’t replace Rows as a system. It replaces the manual work inside it.
Which of the Rows.com alternatives should you choose?
Choosing the right alternative depends on how you used Rows in the first place. Some tools focus on keeping data fresh, while others focus on analyzing it.
Your priority is stability. Go with Coupler.io. It replaces the most critical part of Rows, live data pipelines, while giving you flexibility across tools instead of locking you into a single interface. Built to last longer than the next product pivot.
You just want answers. Julius AI skips the spreadsheet entirely. Ask questions, get insights, and schedule recurring reports. No dashboards or formulas to maintain.
You need to see the math. Quadratic combines a spreadsheet with Python and SQL, so every AI-generated result comes with inspectable, editable code. Trust, then verify.
You’re exploring, not building. ChatGPT is the fastest way to make sense of a dataset you just got your hands on. Powerful for one-off analysis, but everything resets each session.
Your team lives in Excel. Copilot adds AI directly into the tool you already use. No migration, no new interface, but you still need a way to get live data into Excel first.
The work is repetitive and high-volume. Numerous.ai runs ChatGPT at the row level inside Google Sheets or Excel. Define a prompt once, apply it across thousands of rows.
Rows.com is going away. Your workflows don’t have to.
