Shopify tracks your orders, customers, inventory, and products, but its built-in reporting only goes so far. When you connect Shopify to BigQuery, you get a central place to combine store data with information from ad platforms, GA4, finance tools, and other sources, and run the kind of cross-channel analysis that Shopify’s native reports can’t handle.
The fastest way to set this up is with Coupler.io, which handles the connection, scheduling, data transformations, and AI analytics for you. I’ll also cover a manual CSV method and an API route for anyone who needs data entities beyond Coupler.io’s standard set.
Connect Shopify to BigQuery with Coupler.io
Coupler.io is a data integration platform and AI analytics solution that connects Shopify to BigQuery without code. It also supports other destinations for the same data, including spreadsheets, BI tools, data warehouses, and AI tools like Claude and ChatGPT. You can blend data from multiple Shopify stores or combine it with other sources before it reaches BigQuery. Here’s how to set it up.
Step 1. Collect Shopify data
Click Proceed below to create a data flow from Shopify to BigQuery. You’ll be offered to sign up for Coupler.io for free with no credit card required,
The first step of the Shopify to BigQuery integration is to connect to your e-store account and grant Coupler.io access. For that, enter your online shop address into the Source account field and proceed with the on-screen instructions to connect it to Coupler.io.
Select the data entities you want to extract from your Shopify e-commerce store. Coupler.io allows you to get Inventory, Customers, Products, and Order items.
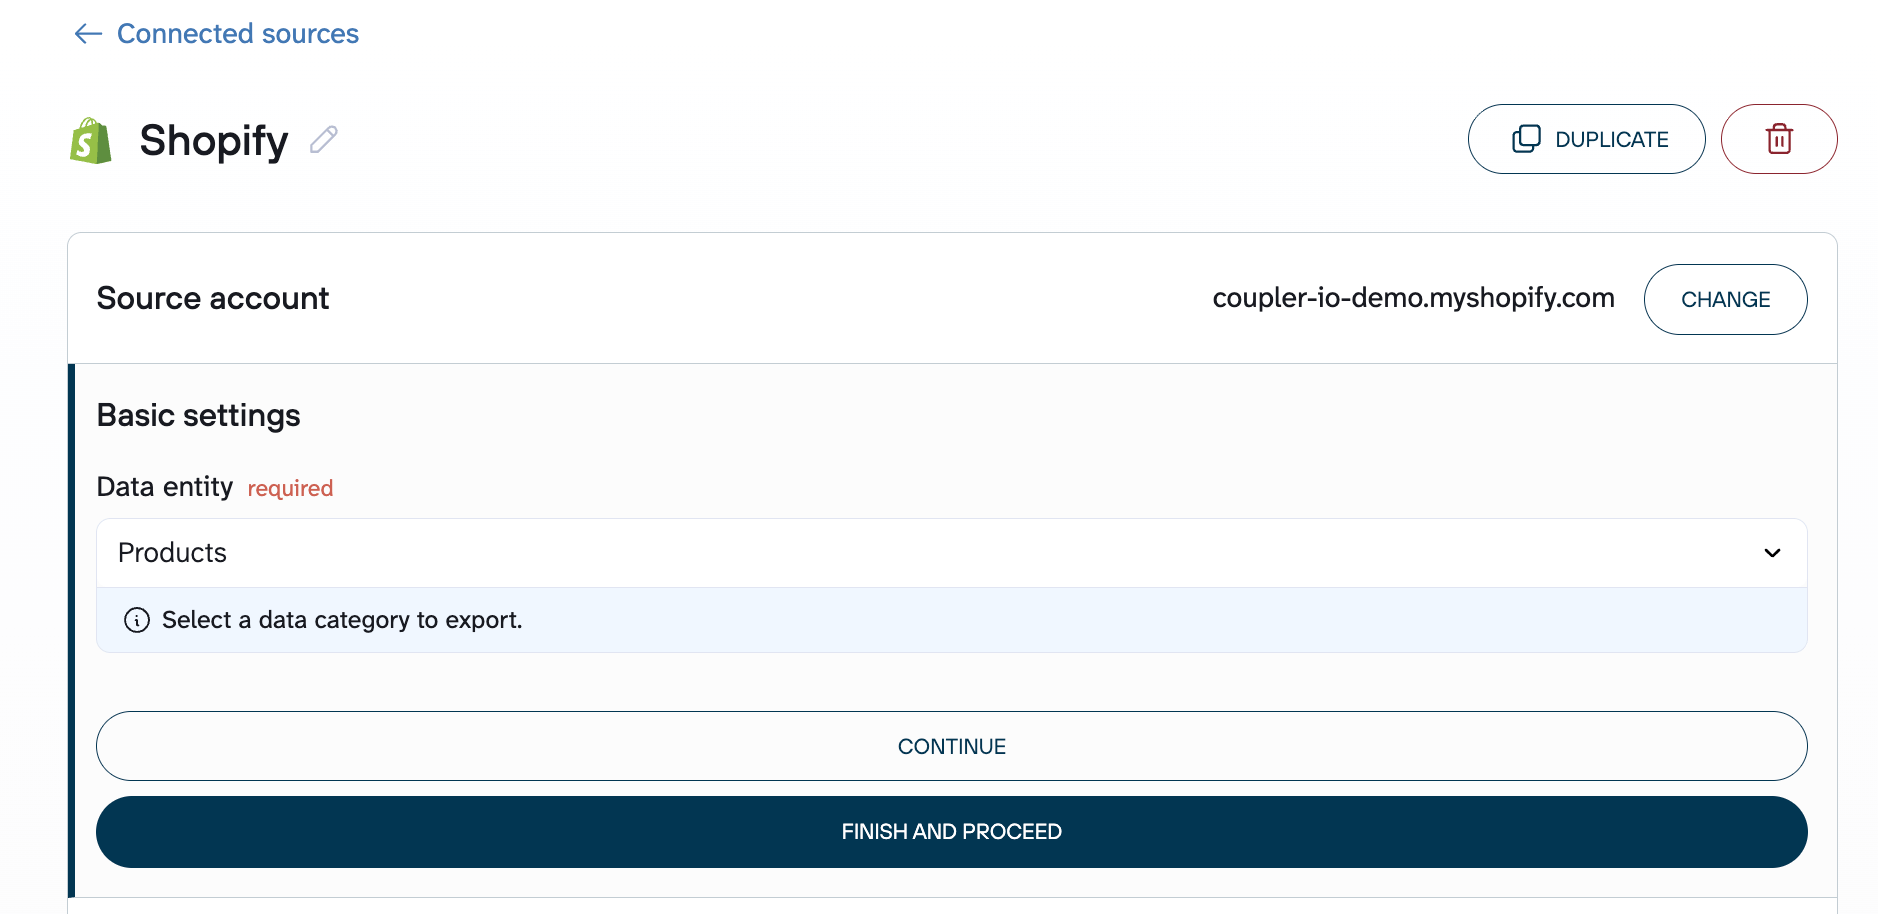
Specify additional parameters if you need to retrieve items with a particular status, creation date, etc.
Coupler.io connects to over 400 sources, so if you’re running multiple Shopify stores or pulling data from other platforms like Google Analytics or WooCommerce, you can add them in the same data flow and blend everything before it reaches BigQuery.
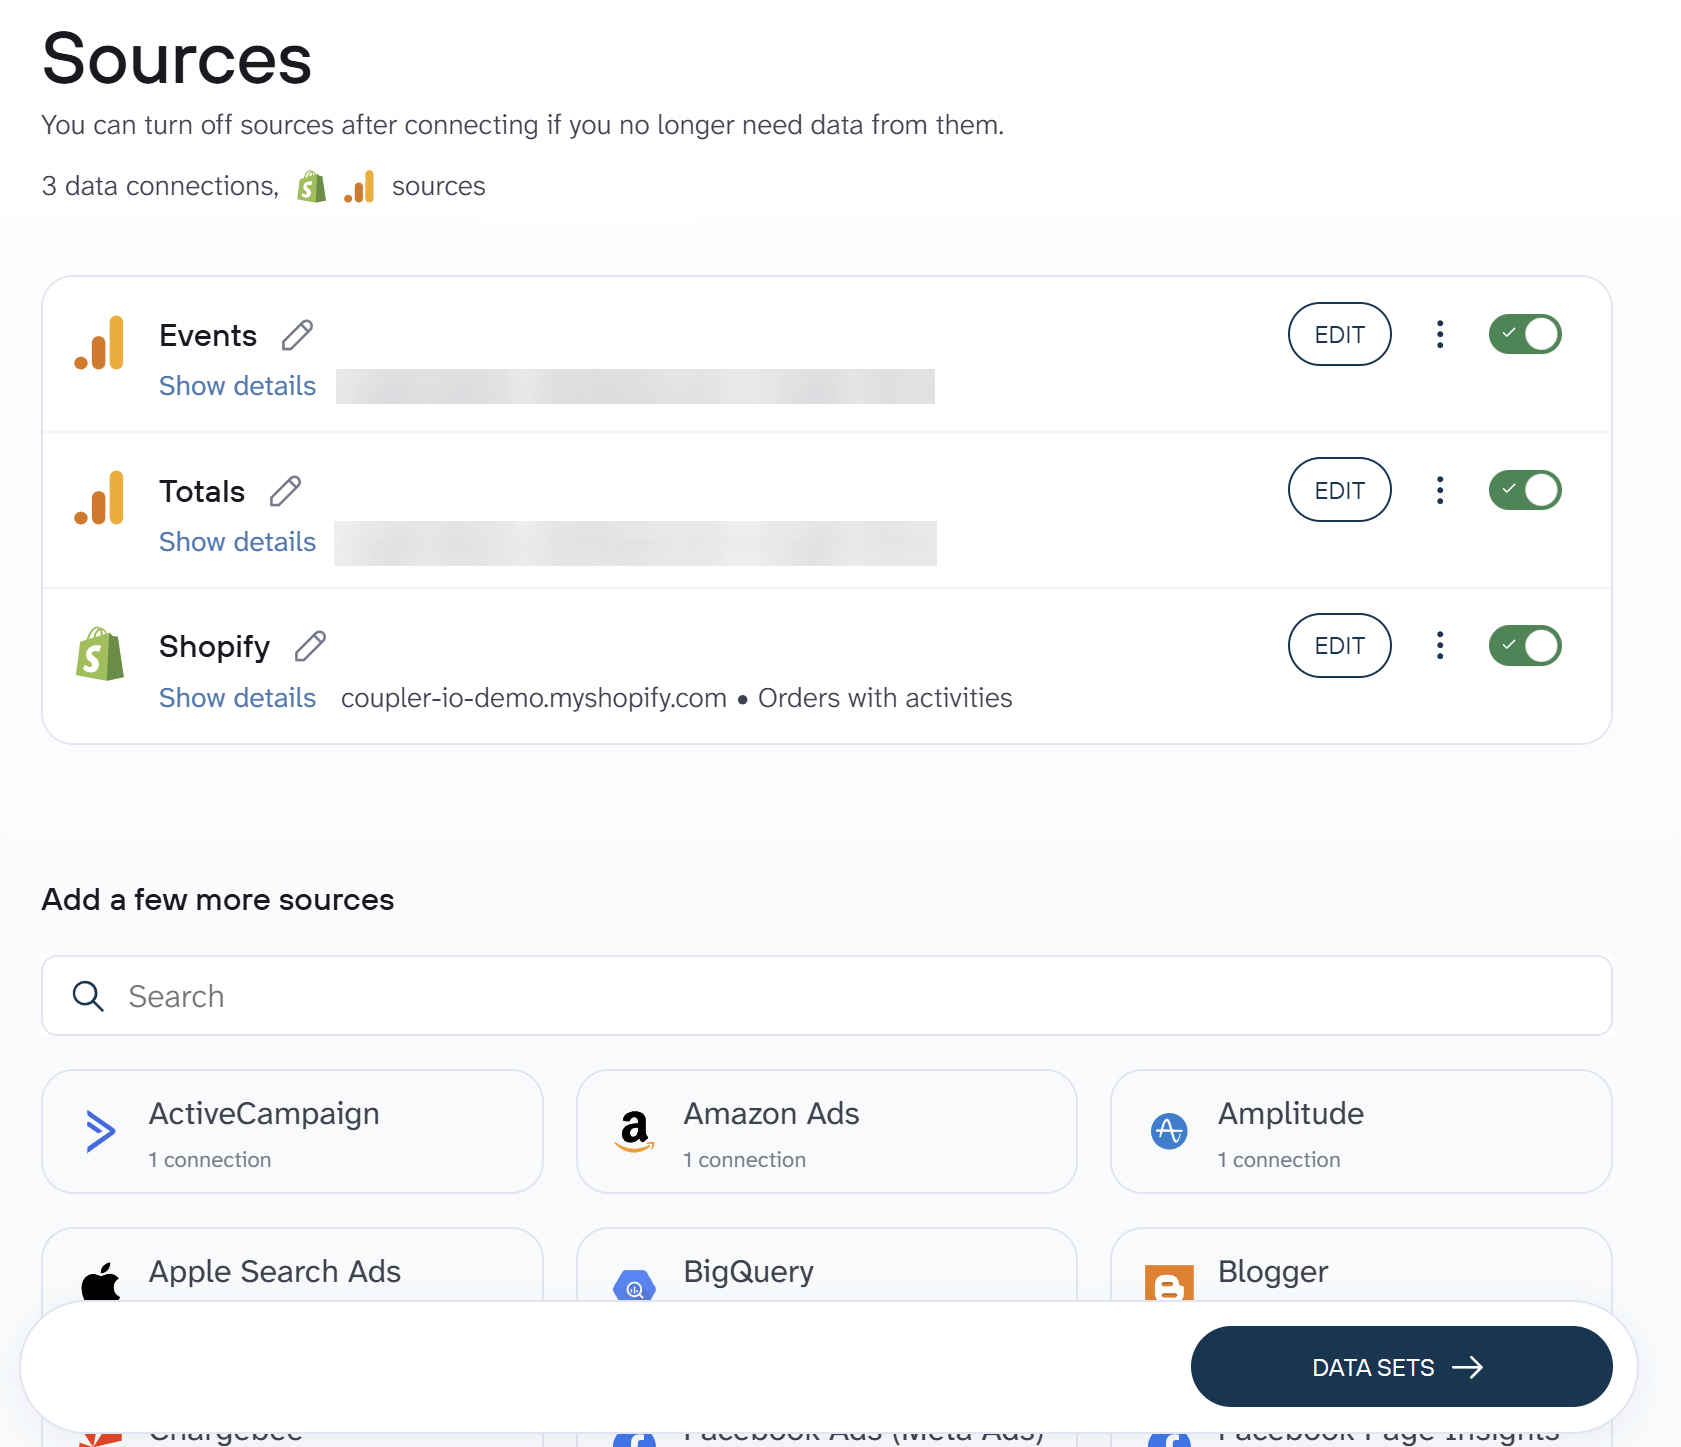
Select Shopify from the list and repeat the same procedure described above (connection, data entity selection, etc.).
Step 2. Organize your Shopify dataset
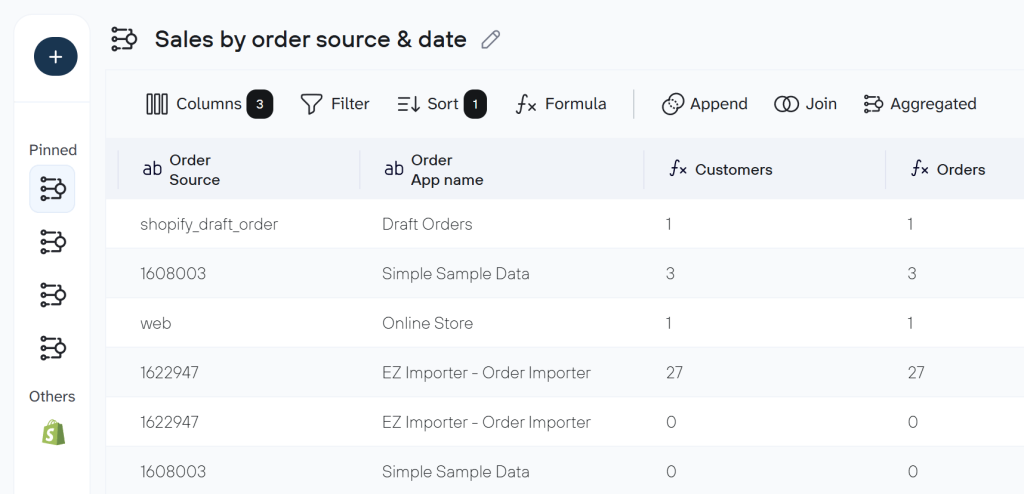
Before your Shopify data reaches BigQuery, you control exactly what gets sent and how it’s structured. This is where you filter out test orders, hide fields you don’t need in the destination, rename columns, add calculated fields, and aggregate raw rows into summary tables.
These steps also matter if you plan to analyze the data with AI later. Cleaner, well-labeled data produces better results, and filtering at this stage means sensitive fields never leave Coupler.io.
You don’t have to build every data model from scratch. Coupler.io offers pre-built dataset templates for Shopify that handle common reporting setups: orders with COGS and gross margin, sales by new vs returning customers, inventory stockout forecasts, top-selling products, and blended Shopify + GA4 performance views, among others. Pick a template when setting up your data flow and adjust it from there.
Step 3. Send data to BigQuery and schedule refresh
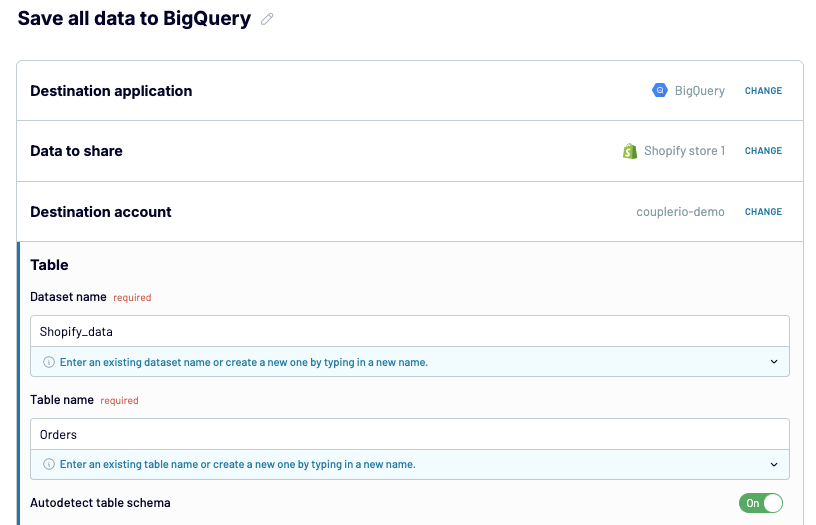
Finally, it’s time to integrate Shopify to BigQuery and send the store data to it. First, connect your Google BigQuery project using the Google Cloud JSON key file.
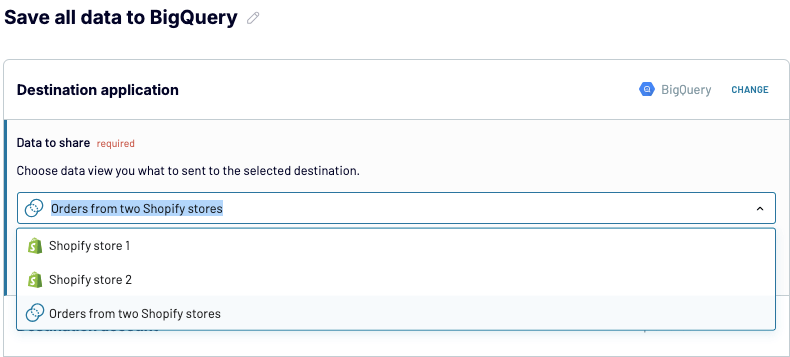
If you’ve connected multiple data sources, you’ll also need to select which data you want to import to BigQuery under the Data to share section.
Select the dataset and table where you want to import Shopify data. Enable the Autodetect table schema option for convenience.
Select one of the import modes:
- Replace for substituting the existing data with the new one
- Append for adding the new data to the existing one
You can add more destinations to the same data flow if you need this Shopify data elsewhere, for example, in Google Sheets, a Data Studio dashboard, or an AI tool like Claude or ChatGPT. Each destination is configured within the same flow, so you don’t have to rebuild the pipeline.
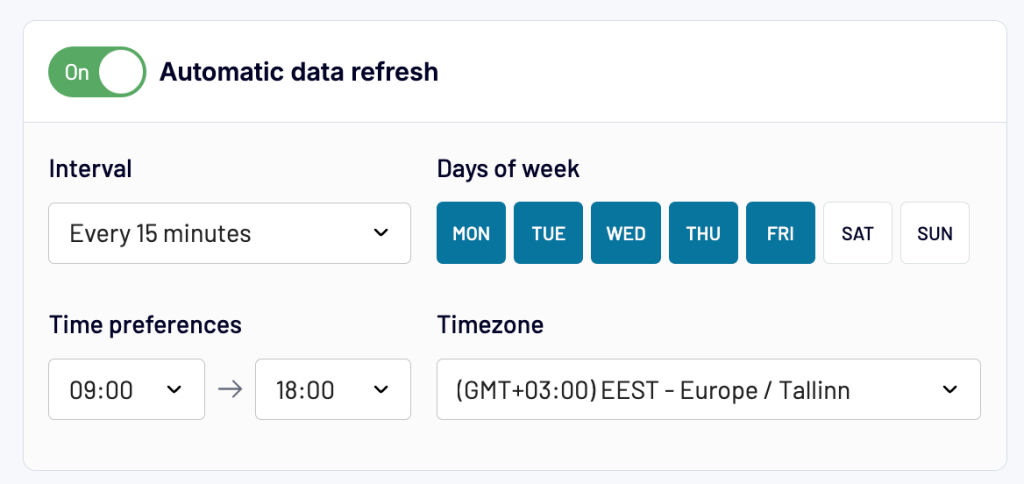
Use the scheduling feature to keep BigQuery tables up to date with fresh Shopify data. It allows you to select either time intervals for refreshes or set specific times for data transfers.
To start the Shopify to BigQuery integration, click SAVE AND RUN.
Bonus step. Analyze your Shopify data with AI
Once your Shopify data is flowing into BigQuery on a schedule, you can go beyond dashboards and ask questions about it directly.
Coupler.io’s AI Agent lets you ask plain-English questions about your synced data and get verified answers.
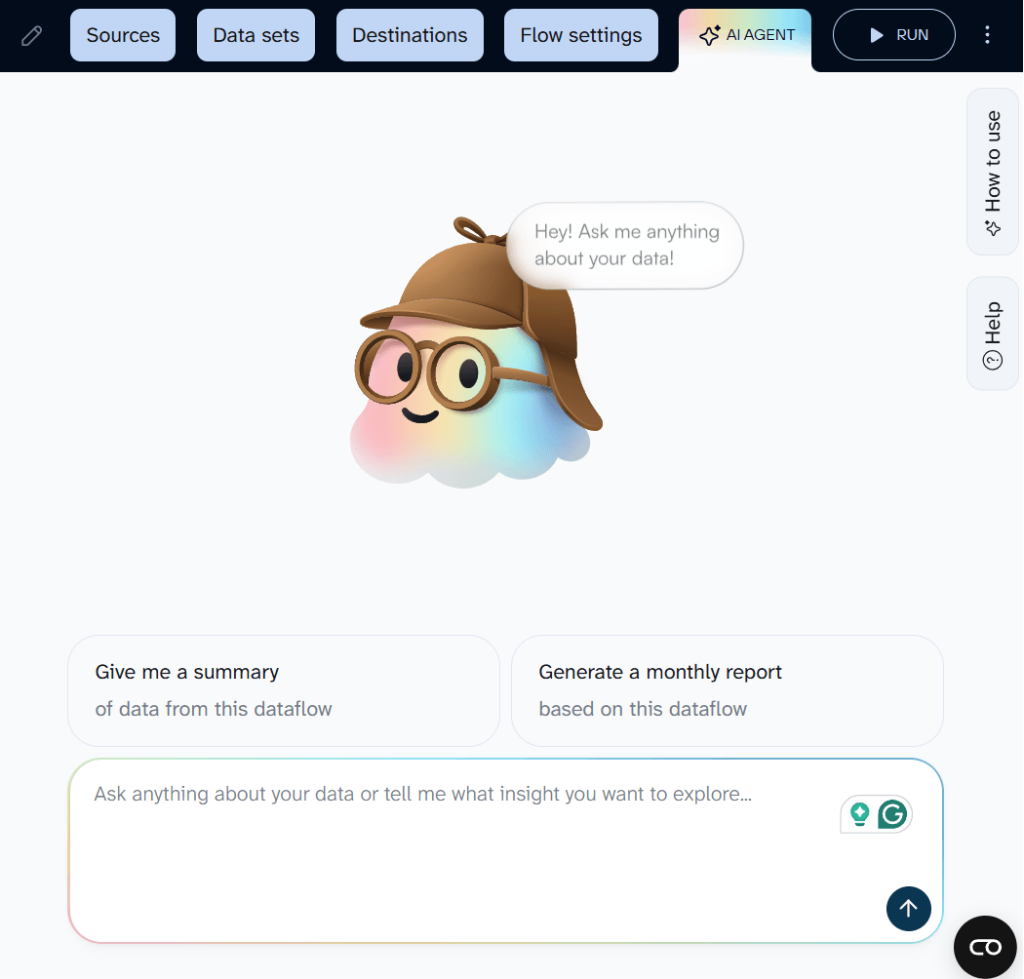
The Analytical Engine behind it runs the calculations first, validates the results, and only then passes confirmed numbers to the AI layer, so the answers are grounded in your actual data, not hallucinated.
If you filtered out sensitive fields or renamed columns, that cleanup carries over here too. AI Agent only works with the data you’ve chosen to include, not your raw Shopify account.
You can also send your Shopify data to external AI tools through Coupler.io’s AI Integrations (for structured exports to ChatGPT, Claude, and others) or connect multiple datasets at once through MCP for broader analysis across sources.
What data you can export from Shopify to BigQuery with Coupler.io
With Coupler.io’s Shopify connector, you can export the following data entities to BigQuery:
- Orders
- Products
- Inventory
- Customers
- Products with variants
- Orders with line items
- Orders with activities
- Order fulfillments with line items
- Orders with shipping lines
- Orders refunds transactions
Each entity comes with column-level controls, date filters, and status filters (financial, fulfillment, product status), so you can narrow the export to exactly the records you need before data leaves Shopify.

Connect Shopify to BigQuery with Coupler.io
Get started for freeOther methods to move data from Shopify to BigQuery
Coupler.io handles most Shopify-to-BigQuery use cases without code. But if you need data entities beyond its standard set or just want a one-off export, there are two other options.
Integrate Shopify to BigQuery via the Shopify API
Shopify’s Admin API gives you access to data beyond Coupler.io’s standard entities, such as custom metafields, specific webhook payloads, deeply nested order attributes, and more. You can pull it through the API and load it into BigQuery via Coupler.io’s JSON connector or a custom script. But first, you need to get a Shopify API token.
Get Shopify API token
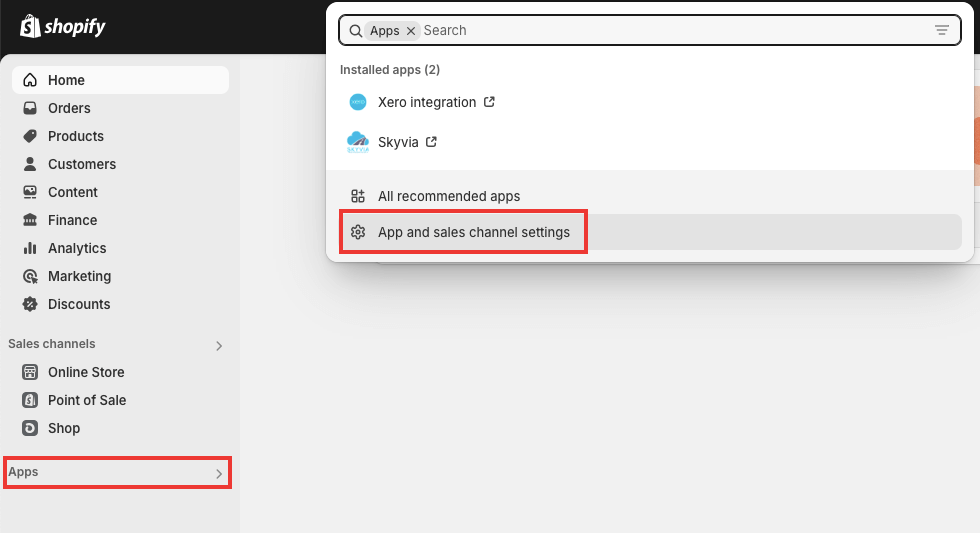
In your Shopify account, click Apps and select App and sales channel settings.
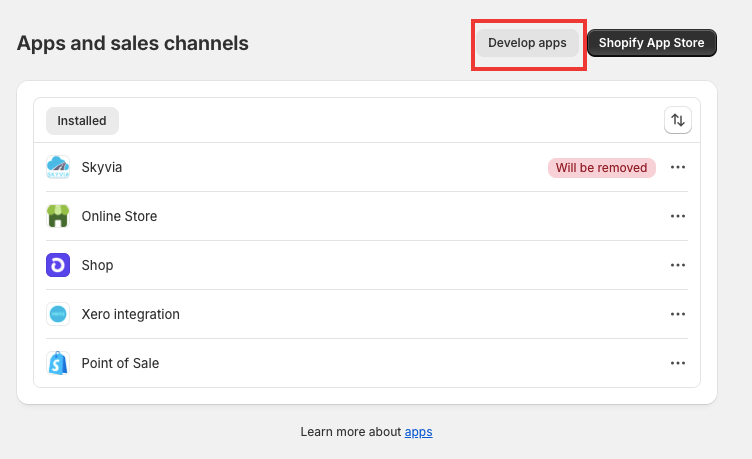
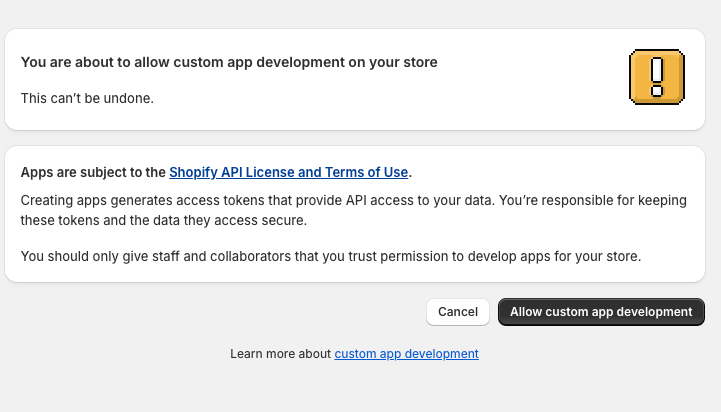
A warning message will appear if you have not yet developed apps in your Shopify store. Click Allow custom app development to continue.
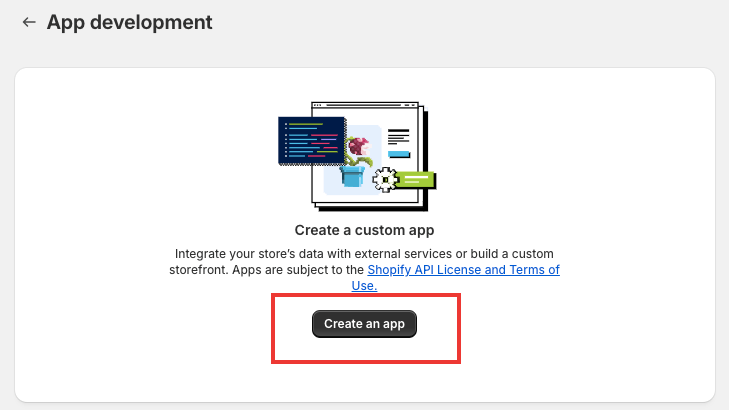
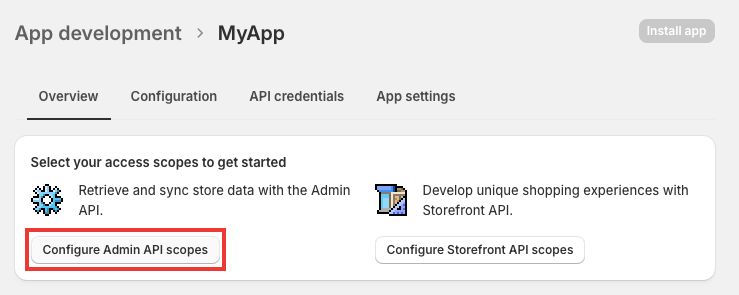
Click Create app and provide a name for this new app in the window that appears.
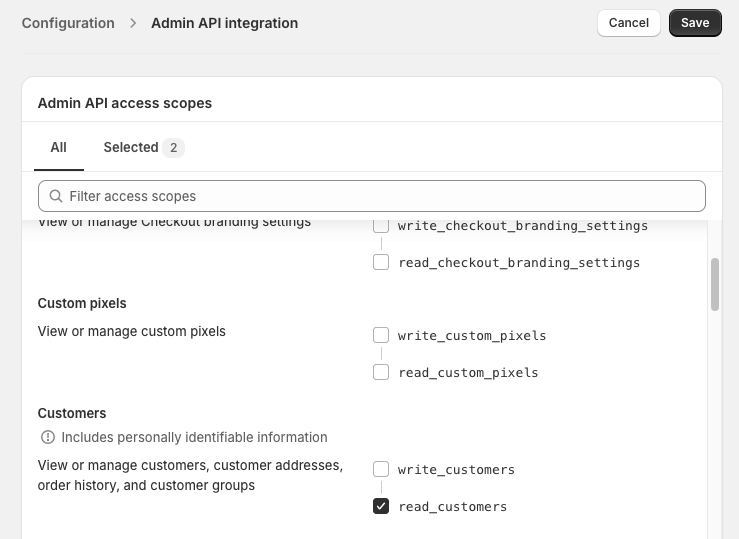
Then, click Configure Admin API scopes.
- Customers –
read_customers - Inventory –
read_inventory - Orders –
read_orders - Products –
read_products
Once everything is done, click Save.
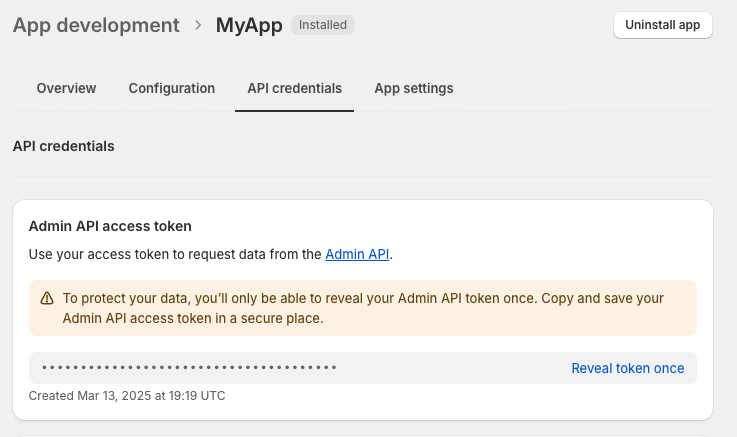
Afterwards, you will find your Shopify API token in the Admin API section.
Export Shopify data with JSON API connector
To avoid complex scripts and hours of coding and script creation for Shopify to BigQuery integration, use the JSON API connector provided by Coupler.io to accelerate the process. To do so, click Proceed in the widget below to create the importer. We have already pre-selected BigQuery as a destination app.
In the JSON settings, fill in the required fields:
- URL –
https://{shop}.myshopify.com/api/{api_version}/graphql.json{shop}– insert your store name, which you can find{api_version}– insert the actual API version
The store name can be found in the URL address of your Shopify account – the last part of the address string, as shown in the screenshot below:
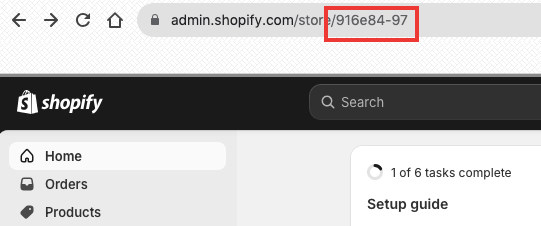
So, the sample URL string will look as follows:
https://916e84-97.myshopify.com/api/2024-07/graphql.json
- HTTP – pick up the required REST API method.
- GET – to retrieve a resource item
- PUT – to update an existing resource item
- POST – to create a new resource item
- DELETE – to delete a resource item
NOTE: Since retrieving data in this case is necessary, select the GET option from the HTTP method drop-down list.
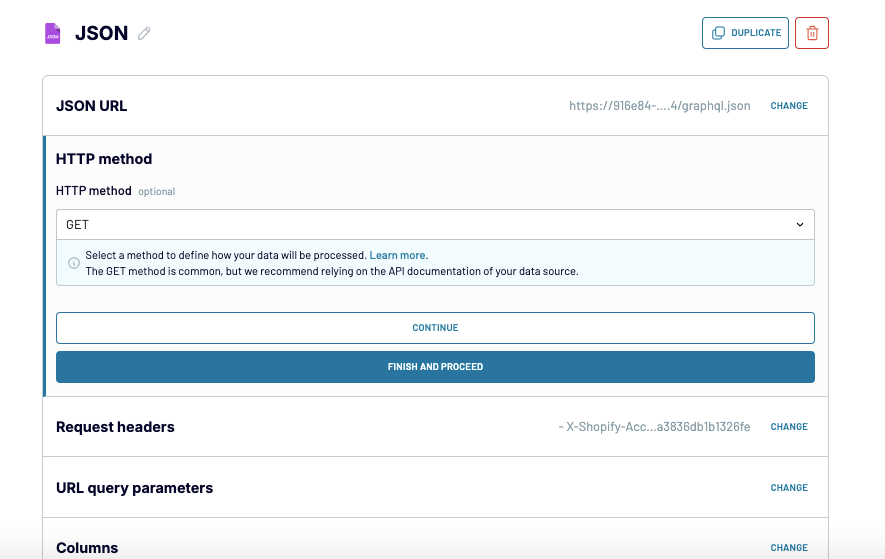
- Request headers – specify your API access token using the following HTTP header.
X-Shopify-Access-Token:{your-api-access-token}
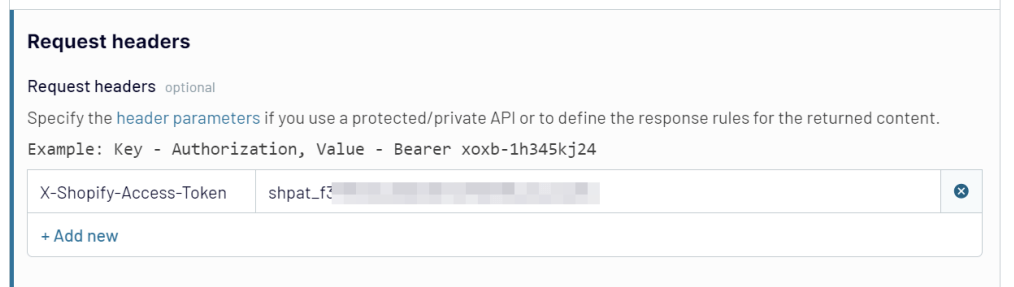
NOTE: You can find your Shopify access token in the Admin panel of your e-commerce store. Go to Apps on the left panel and select the recently created app to retrieve the token.
- URL query parameters – specify query parameters to narrow your search results (optional).
- Columns – provide the names of columns separated by a comma.
- Path – Enter the string to nested objects if any (optional).
The next two steps are similar to those described in the integration method above.
- Check the preview generated by Coupler.io and decide how to organize and manage data using the available options.
- Once ready, provide your BigQuery destination details to import Shopify data.
Connect Shopify and Shopify API to BigQuery with Coupler.io
Get started for freeSend Shopify data to Google BigQuery manually
The manual method doesn’t involve any additional tools for data transfer. It consists of two principal steps:
- Extracting Shopify data into a CSV file.
- Adding data from the file to Google BigQuery tables.
Step 1. Download a CSV file from Shopify
- Log in to your Shopify account by providing the necessary credentials.
- Go to the section from which you would like to export items. In our example, we extract the Products data.
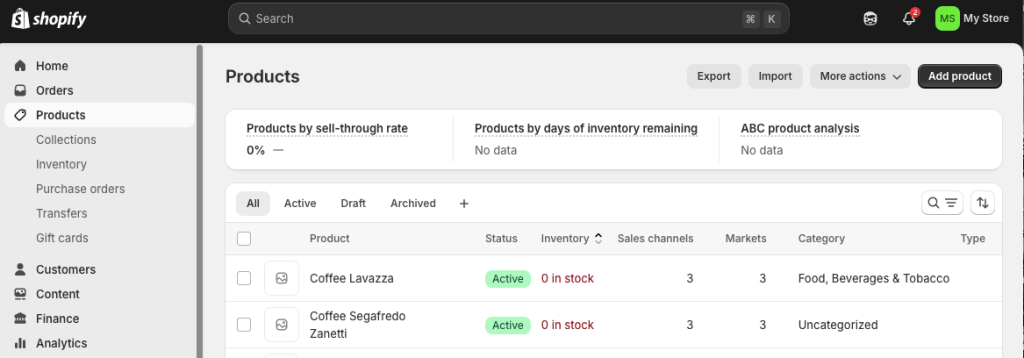
- Click on Export in the upper part of the screen and specify the data extraction options.
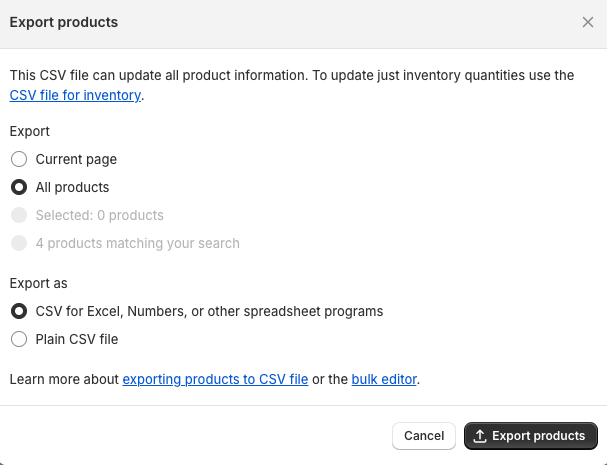
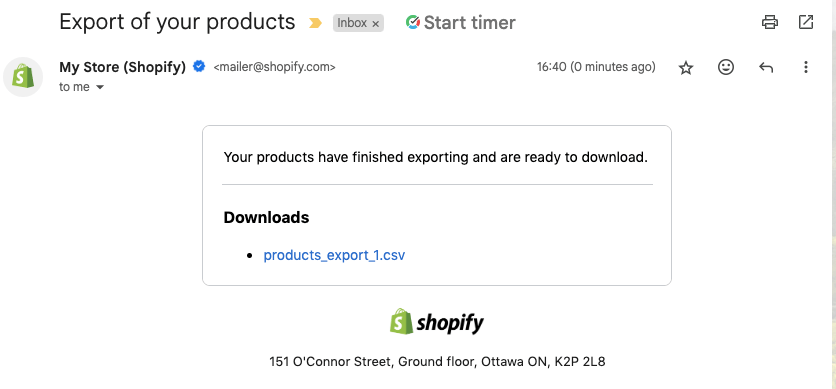
- Once you click Export products, the file will arrive in the email box associated with your Shopify account. Click on that email and download the CSV file to your computer.
You can carry out the same procedure for data extraction from your other e-stores.
Step 2: Upload data from CSV to BigQuery
- Go to the Google Cloud Console and select BigQuery from the panel on the left.
- Create a new project or select an existing one. Make sure you have the necessary dataset ready for Shopify data import. If not, you can create one later in the file upload stage.
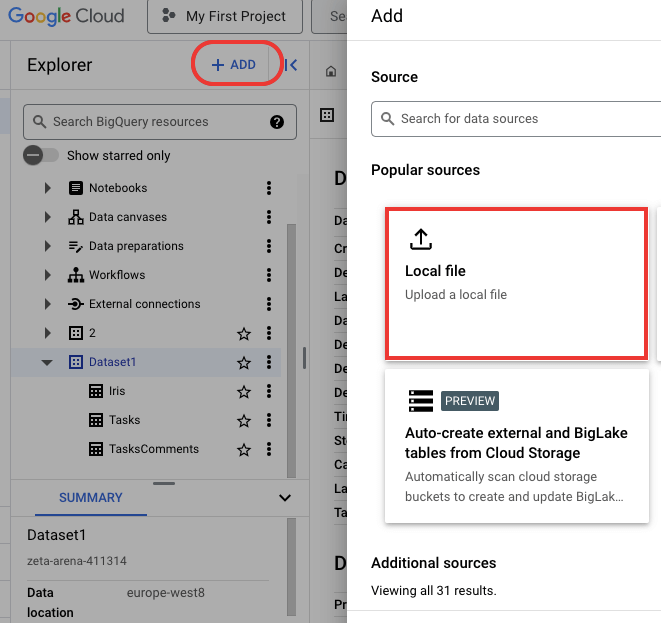
- Click +ADD and select the Local file options.
- In the window that appears, select the CSV file from your computer. Then, specify the project and dataset where the new table with Shopify needs to be added. Enter the table name and check the Auto detect option.
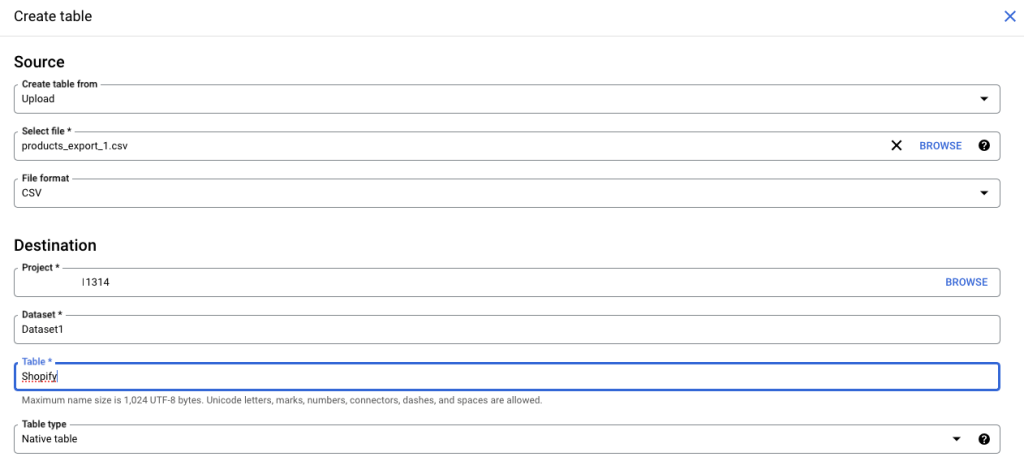
- Check the provided details once again and click Create table.
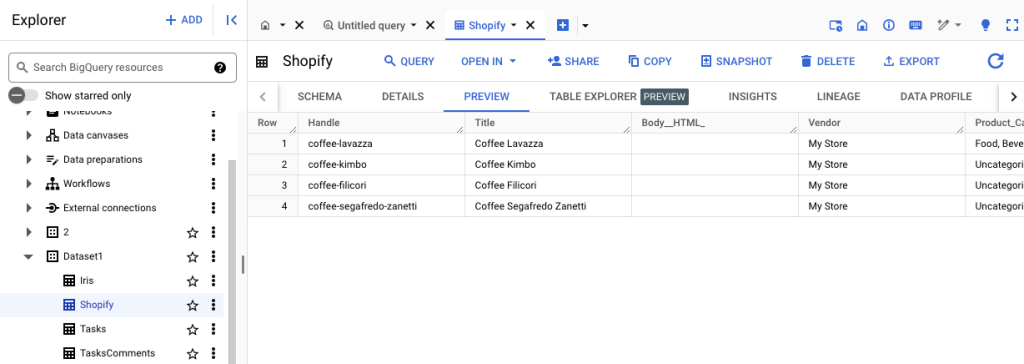
- In the list of tables, click on the needed one and go to the PREVIEW tab.
What data can be exported from Shopify to BigQuery – comparison table
Even though Shopify comprises a large quantity of heterogeneous data, not all of it can be exported, at least not with each integration method. For instance, the information on products, orders, inventory, and customers can easily be retrieved using Coupler.io. The same data and several other items (gift cards, discount codes, abandoned checkouts, etc.) can be extracted into a CSV file. Meanwhile, any data can be pulled using Shopify REST APIs.
Please find a detailed breakdown of Shopify items and their availability for extraction with each integration method mentioned above.
| Coupler.io | CSV | REST API | |
|---|---|---|---|
| Products | ✅ | ✅ | ✅ |
| Product variants | ✅ | ❌ | ✅ |
| Inventory items | ✅ | ✅ | ✅ |
| Orders | ✅ | ✅ | ✅ |
| Orders with line items | ✅ | ❌ | ✅ |
| Orders with activities | ✅ | ❌ | ✅ |
| Order fulfillments with line items | ✅ | ❌ | ✅ |
| Orders with shipping lines | ✅ | ❌ | ✅ |
| Orders refunds transactions | ✅ | ❌ | ✅ |
| Customers | ✅ | ✅ | ✅ |
| Product collects | ❌ | ❌ | ✅ |
| Product collections | ❌ | ❌ | ✅ |
| Product smart collections | ❌ | ❌ | ✅ |
| Gift cards | ❌ | ✅ | ✅ |
| Inventory levels | ❌ | ❌ | ✅ |
| Abandoned checkouts | ❌ | ✅ | ✅ |
| Refunds | ❌ | ❌ | ✅ |
| Transactions | ❌ | ❌ | ✅ |
| Order risks | ❌ | ❌ | ✅ |
| Discount codes | ❌ | ✅ | ✅ |
| Price rules | ❌ | ❌ | ✅ |
| Reports | ❌ | ✅ | ✅ |
| Metafields | ❌ | ❌ | ✅ |
| Articles | ❌ | ❌ | ✅ |
| Blogs | ❌ | ❌ | ✅ |
| Comments | ❌ | ❌ | ✅ |
| Pages | ❌ | ❌ | ✅ |
| Payments | ❌ | ❌ | ✅ |
| Disputes | ❌ | ❌ | ✅ |
| Balance | ❌ | ❌ | ✅ |
| Payouts | ❌ | ❌ | ✅ |
| Transactions | ❌ | ❌ | ✅ |
Ready-to-use dashboards to analyze your Shopify data
Google BigQuery is often seen as a solid foundation for Shopify analytics and other advanced data operations, but it doesn’t support creating visual reports and dashboards. Therefore, using BI and data visualization tools for reporting makes sense.
Coupler.io connects BigQuery to BI solutions, such as Power BI, Looker Studio, and Tableau. It also provides multiple pre-made dashboards for these tools. This lets you bypass data loading into BigQuery by quickly collecting data from Shopify and other sources and displaying it in your preferred reporting system.
Let’s look at some of the most popular reporting dashboard templates.
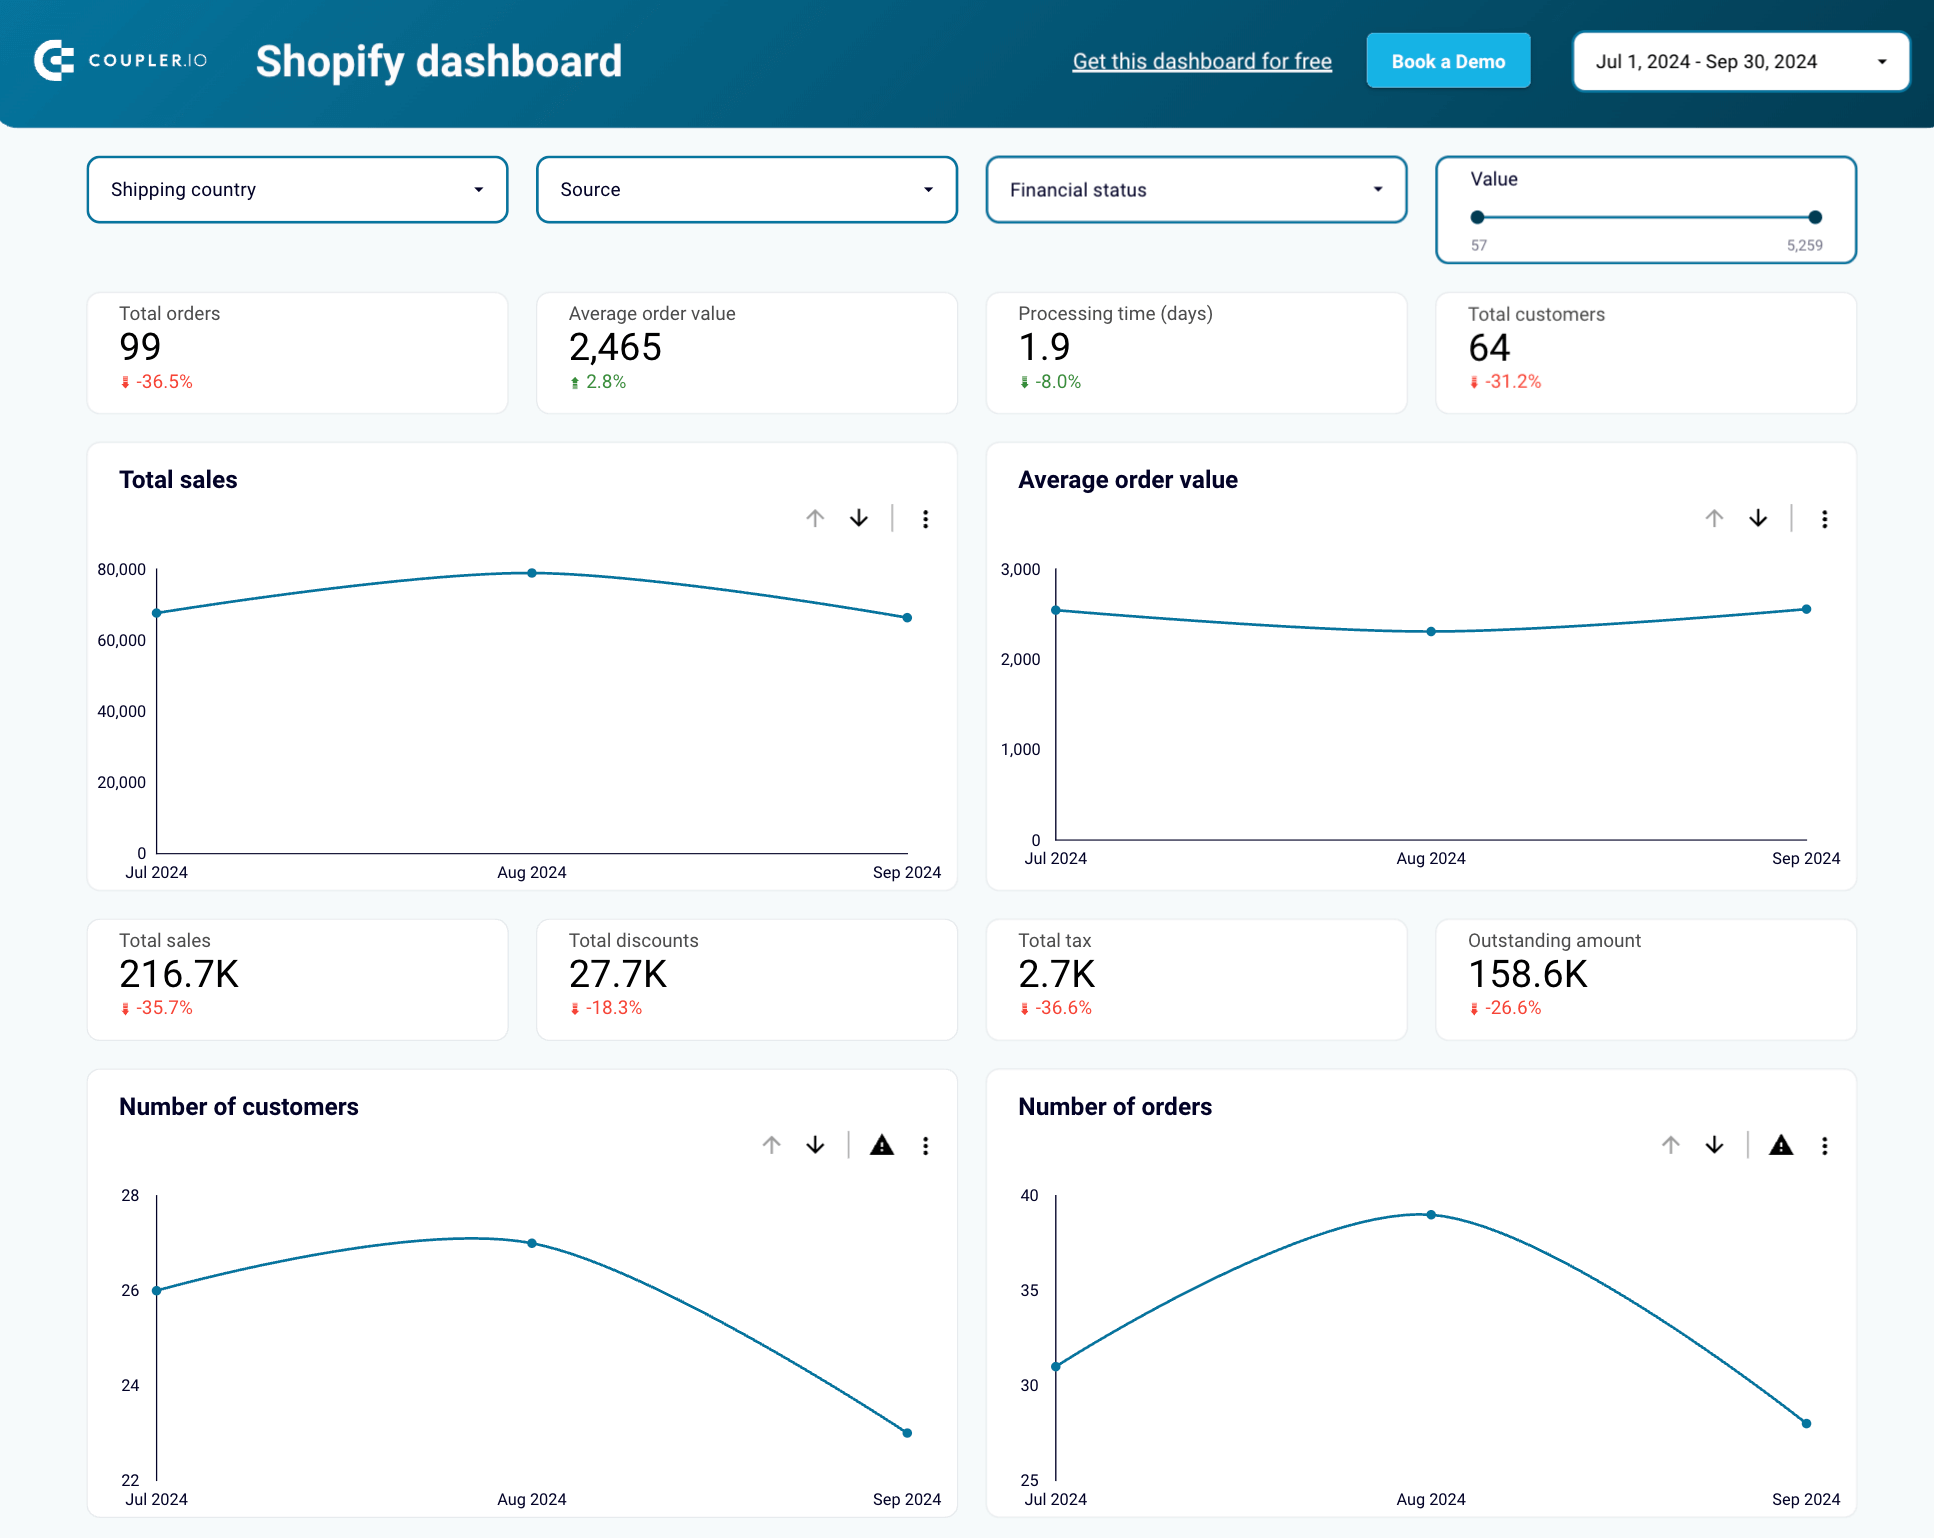
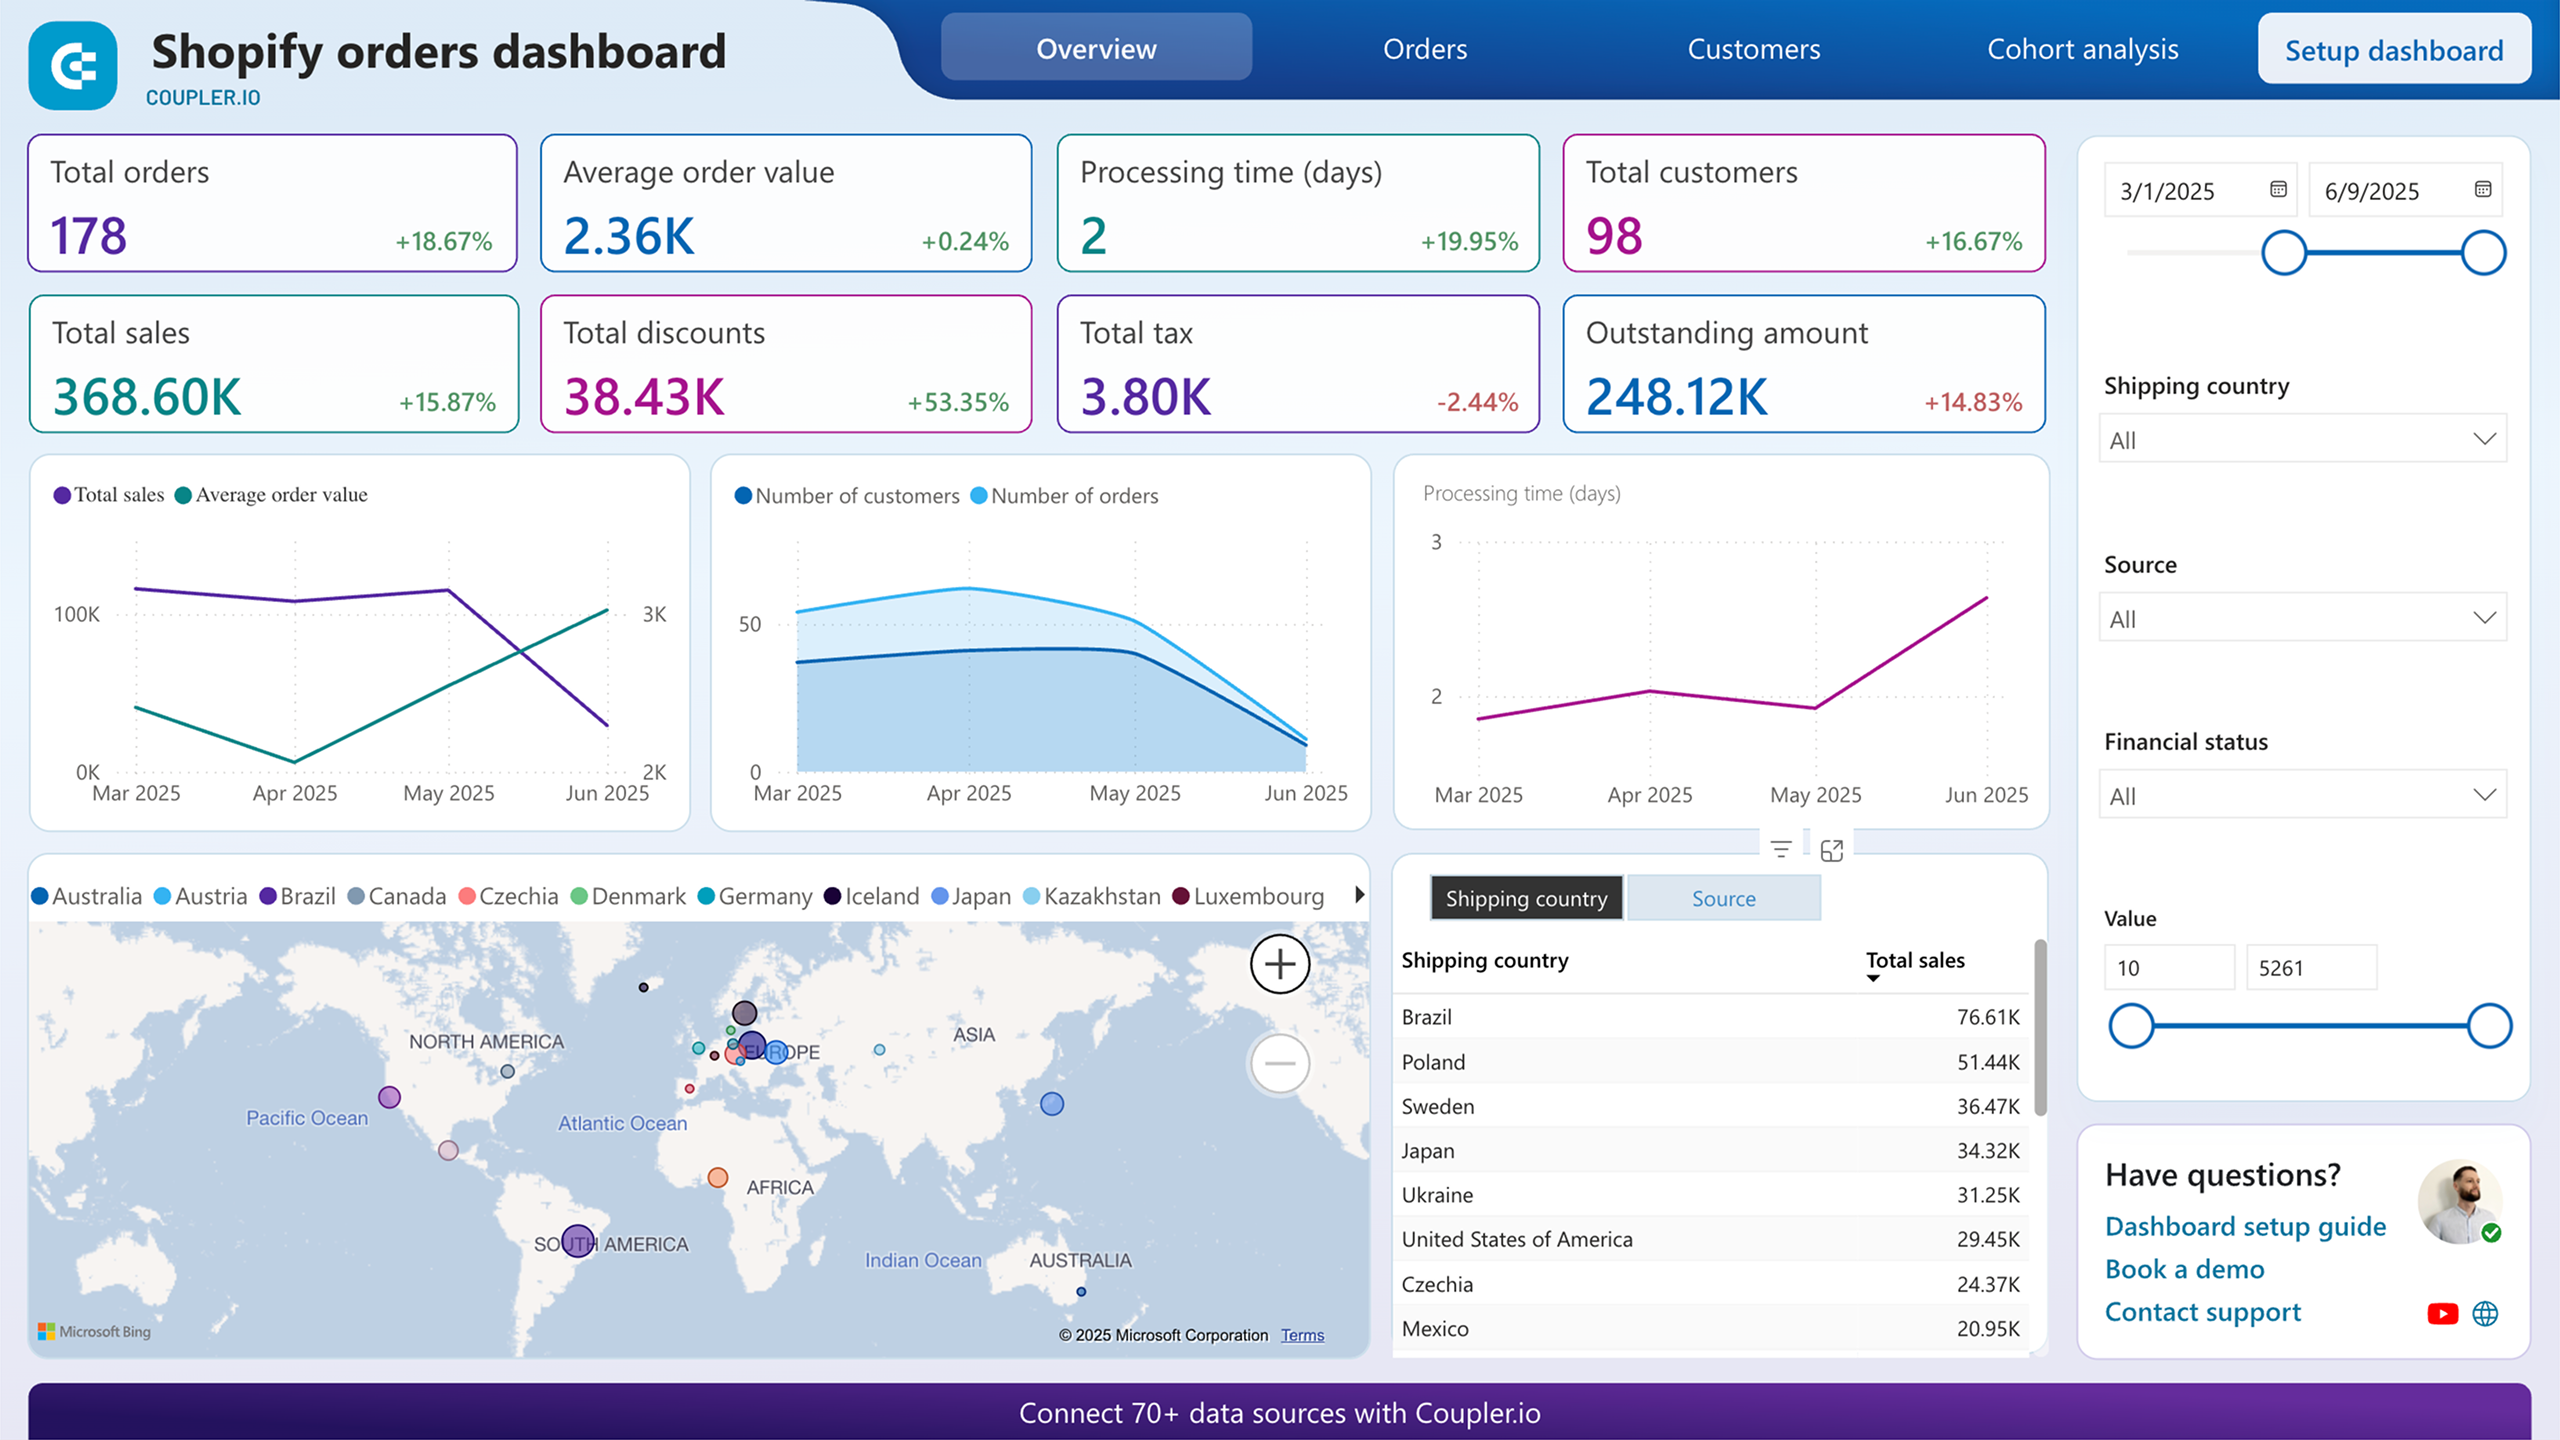
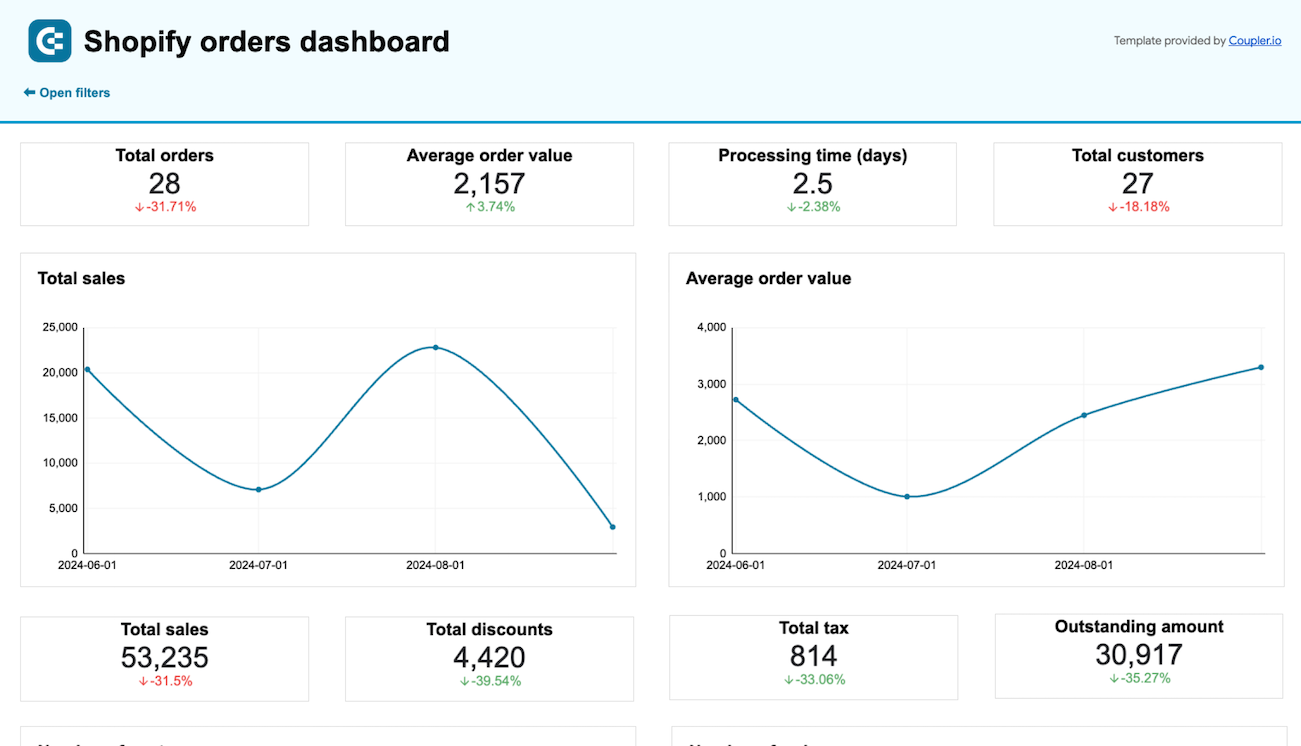
Shopify orders dashboard
When you need to understand how your store performs across regions, channels, and customer segments, scattered Shopify admin screens won’t cut it. The orders dashboard brings together regional sales and refund data, top-selling products, order sources, and new vs returning customer dynamics into a single report.
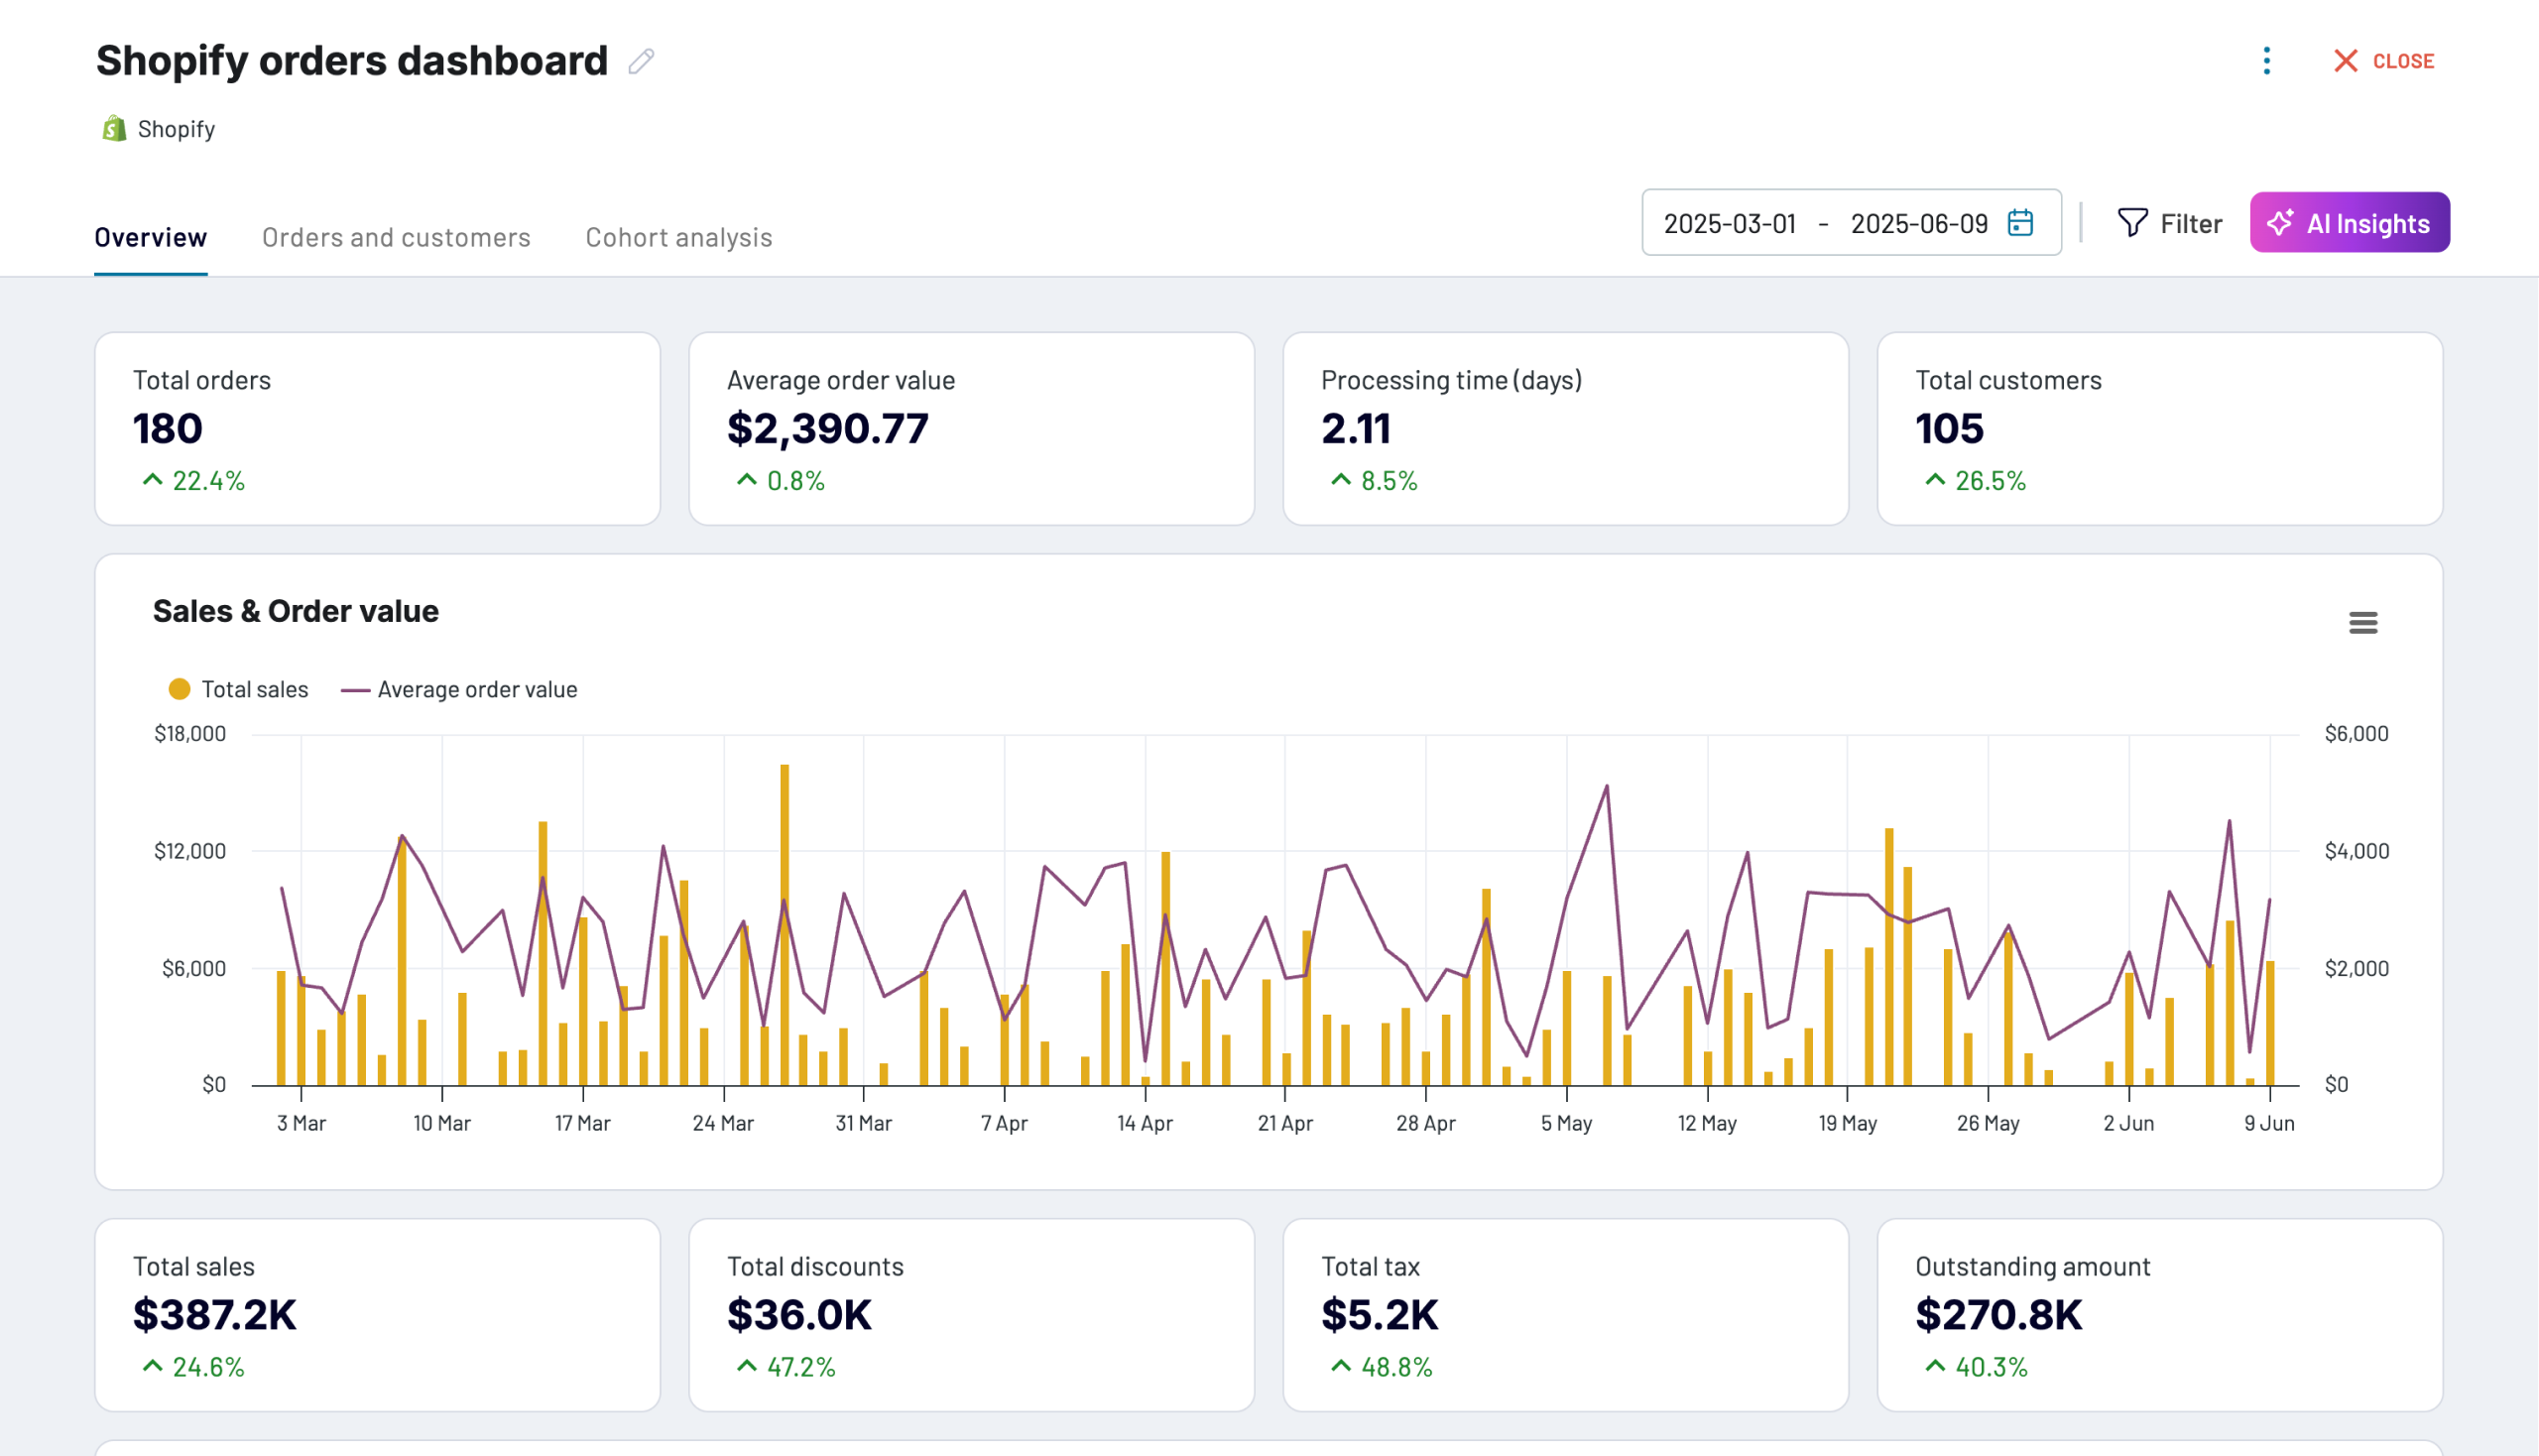
What insights does the dashboard provide?
- Regions where your products are the most popular and lots of sales take place, allowing you to retarget your sales strategy.
- Geographical locations with the highest number of refunded and pending orders help you detect problematic regions and start looking for an appropriate solution.
- Sources from which most sales orders result, allowing you to concentrate marketing strategies on the best-performing ones
- The top-selling items in the e-store help keep popular products in stock.
- Purchasing habits and dynamics of new or returning customers enable you to enhance your customer care approaches.
How to use it
This dashboard template is designed in Coupler.io and is also available as a template in Looker Studio, Power BI, and Google Sheets. Thanks to the pre-built Coupler.io connector, the information about your orders will be pulled from Shopify on a schedule and added to the report. To start using this template, follow the step-by-step instructions in the Readme tab.


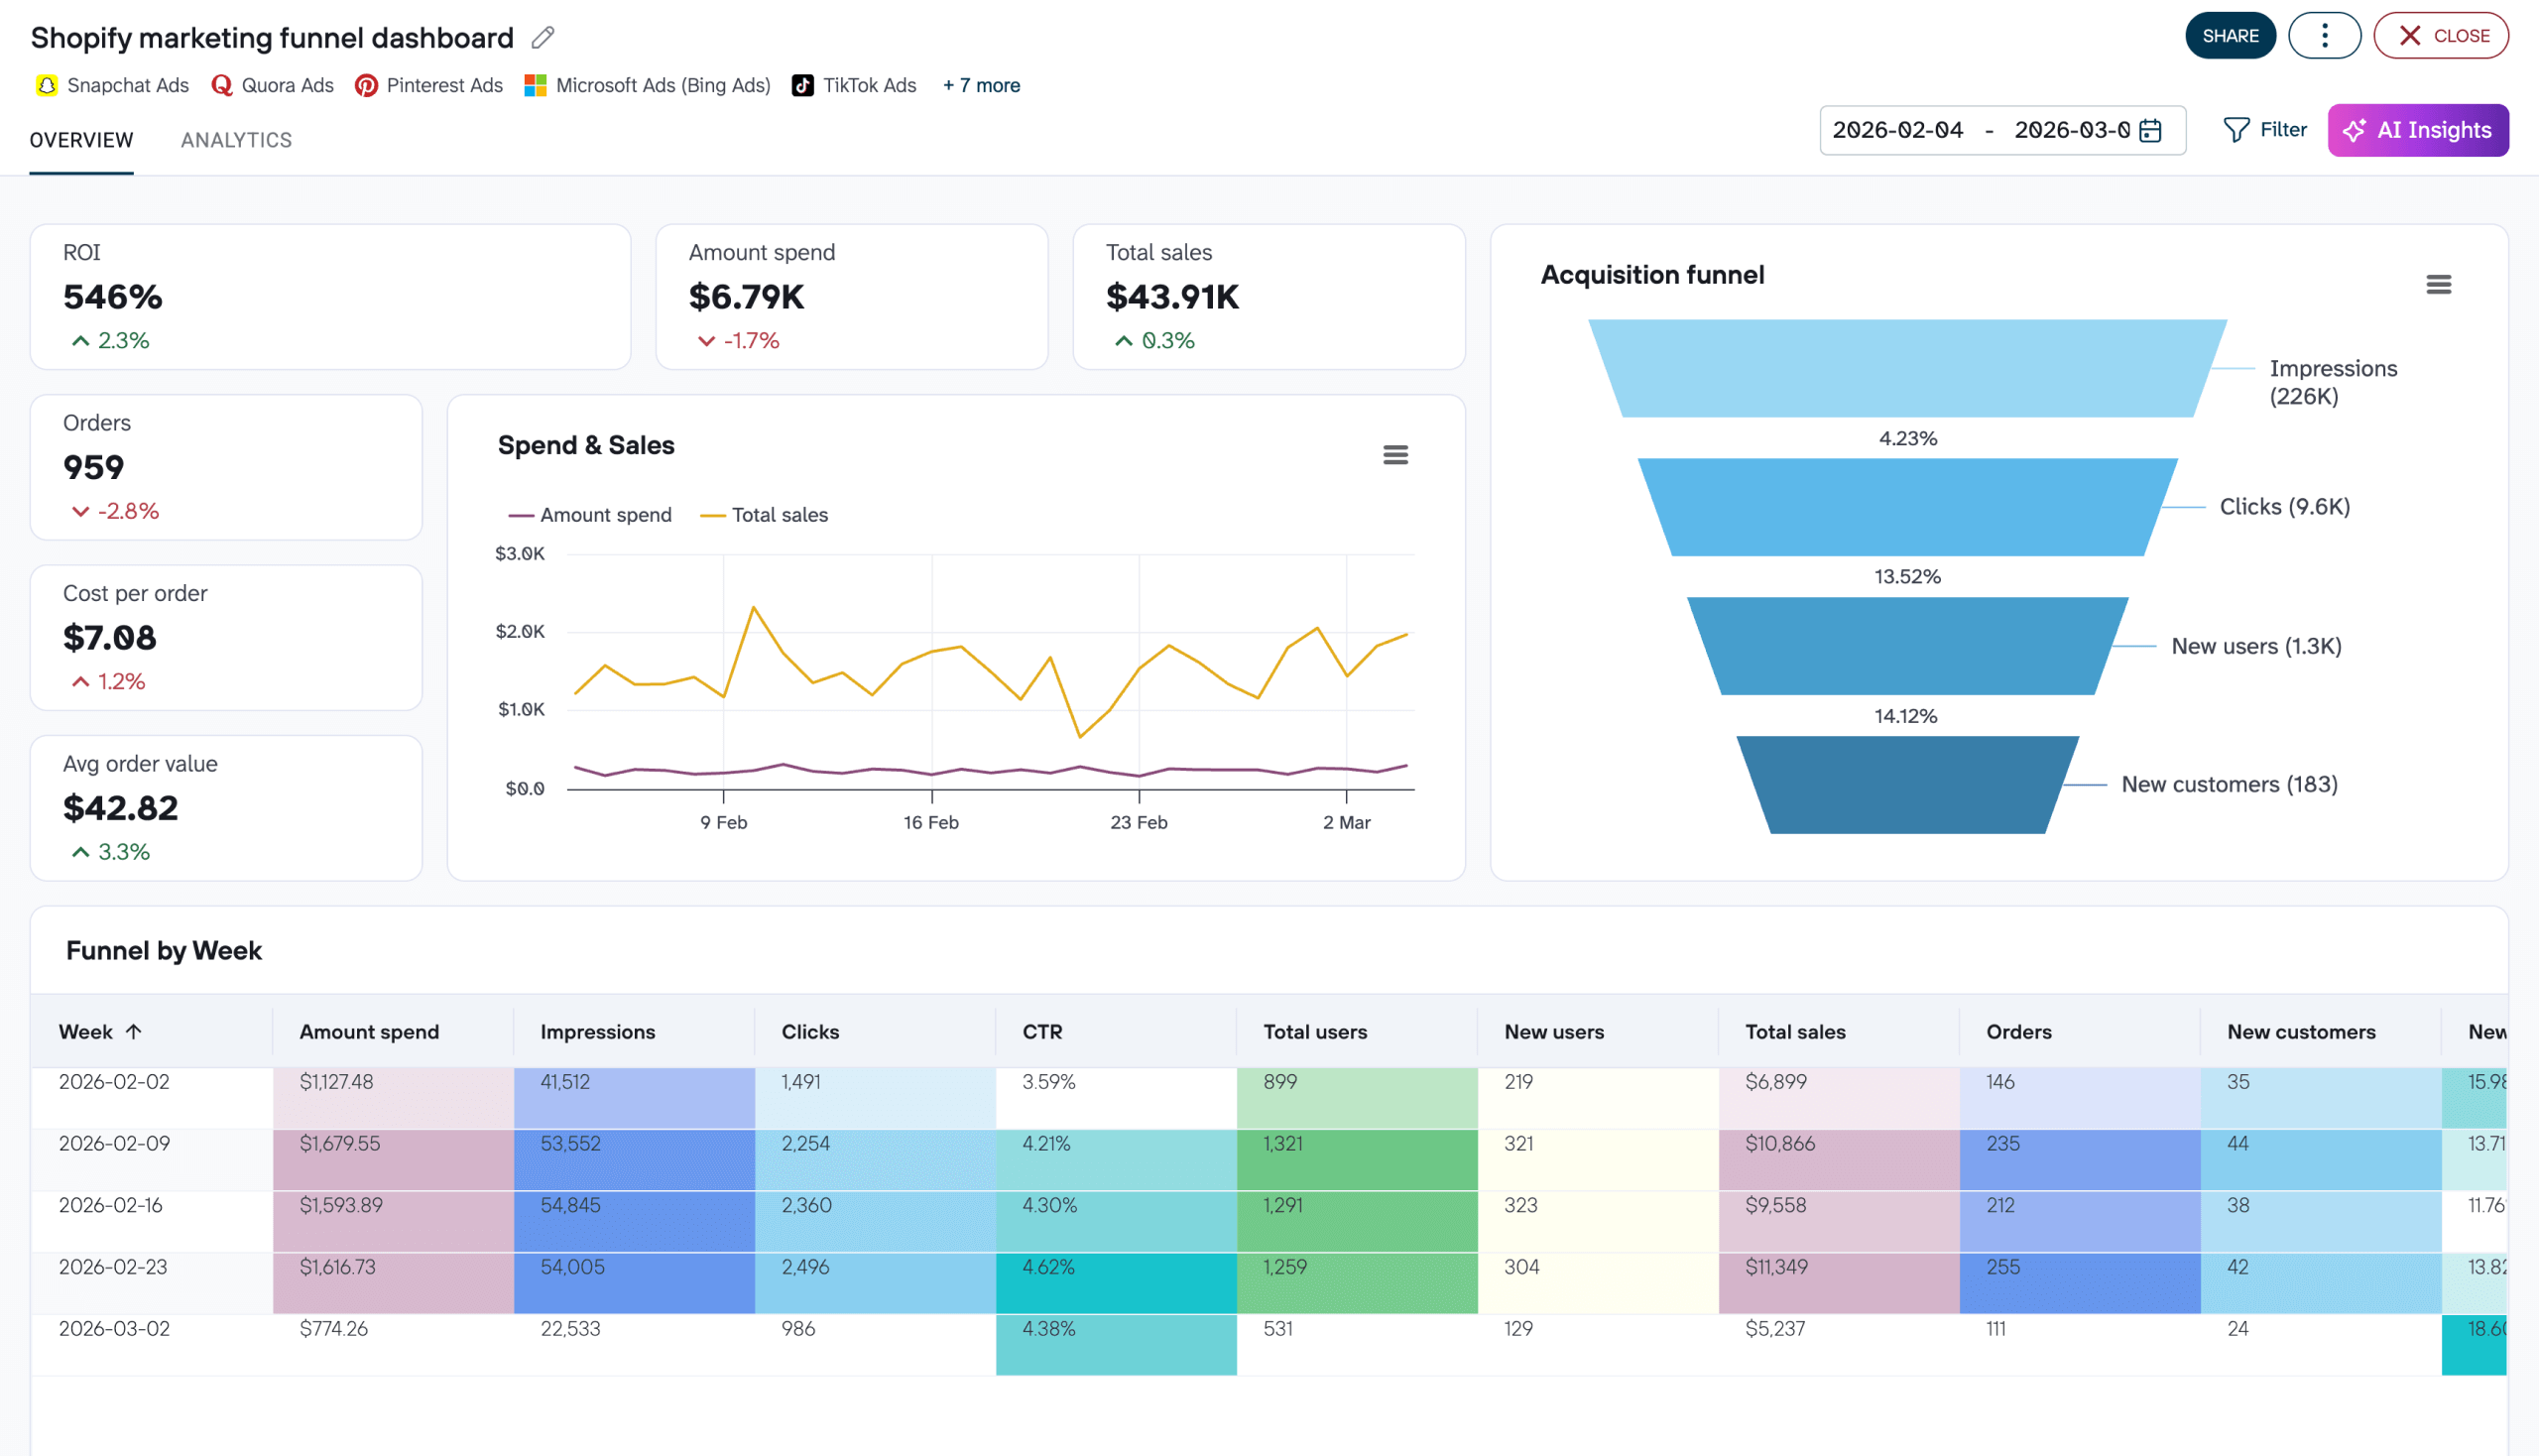
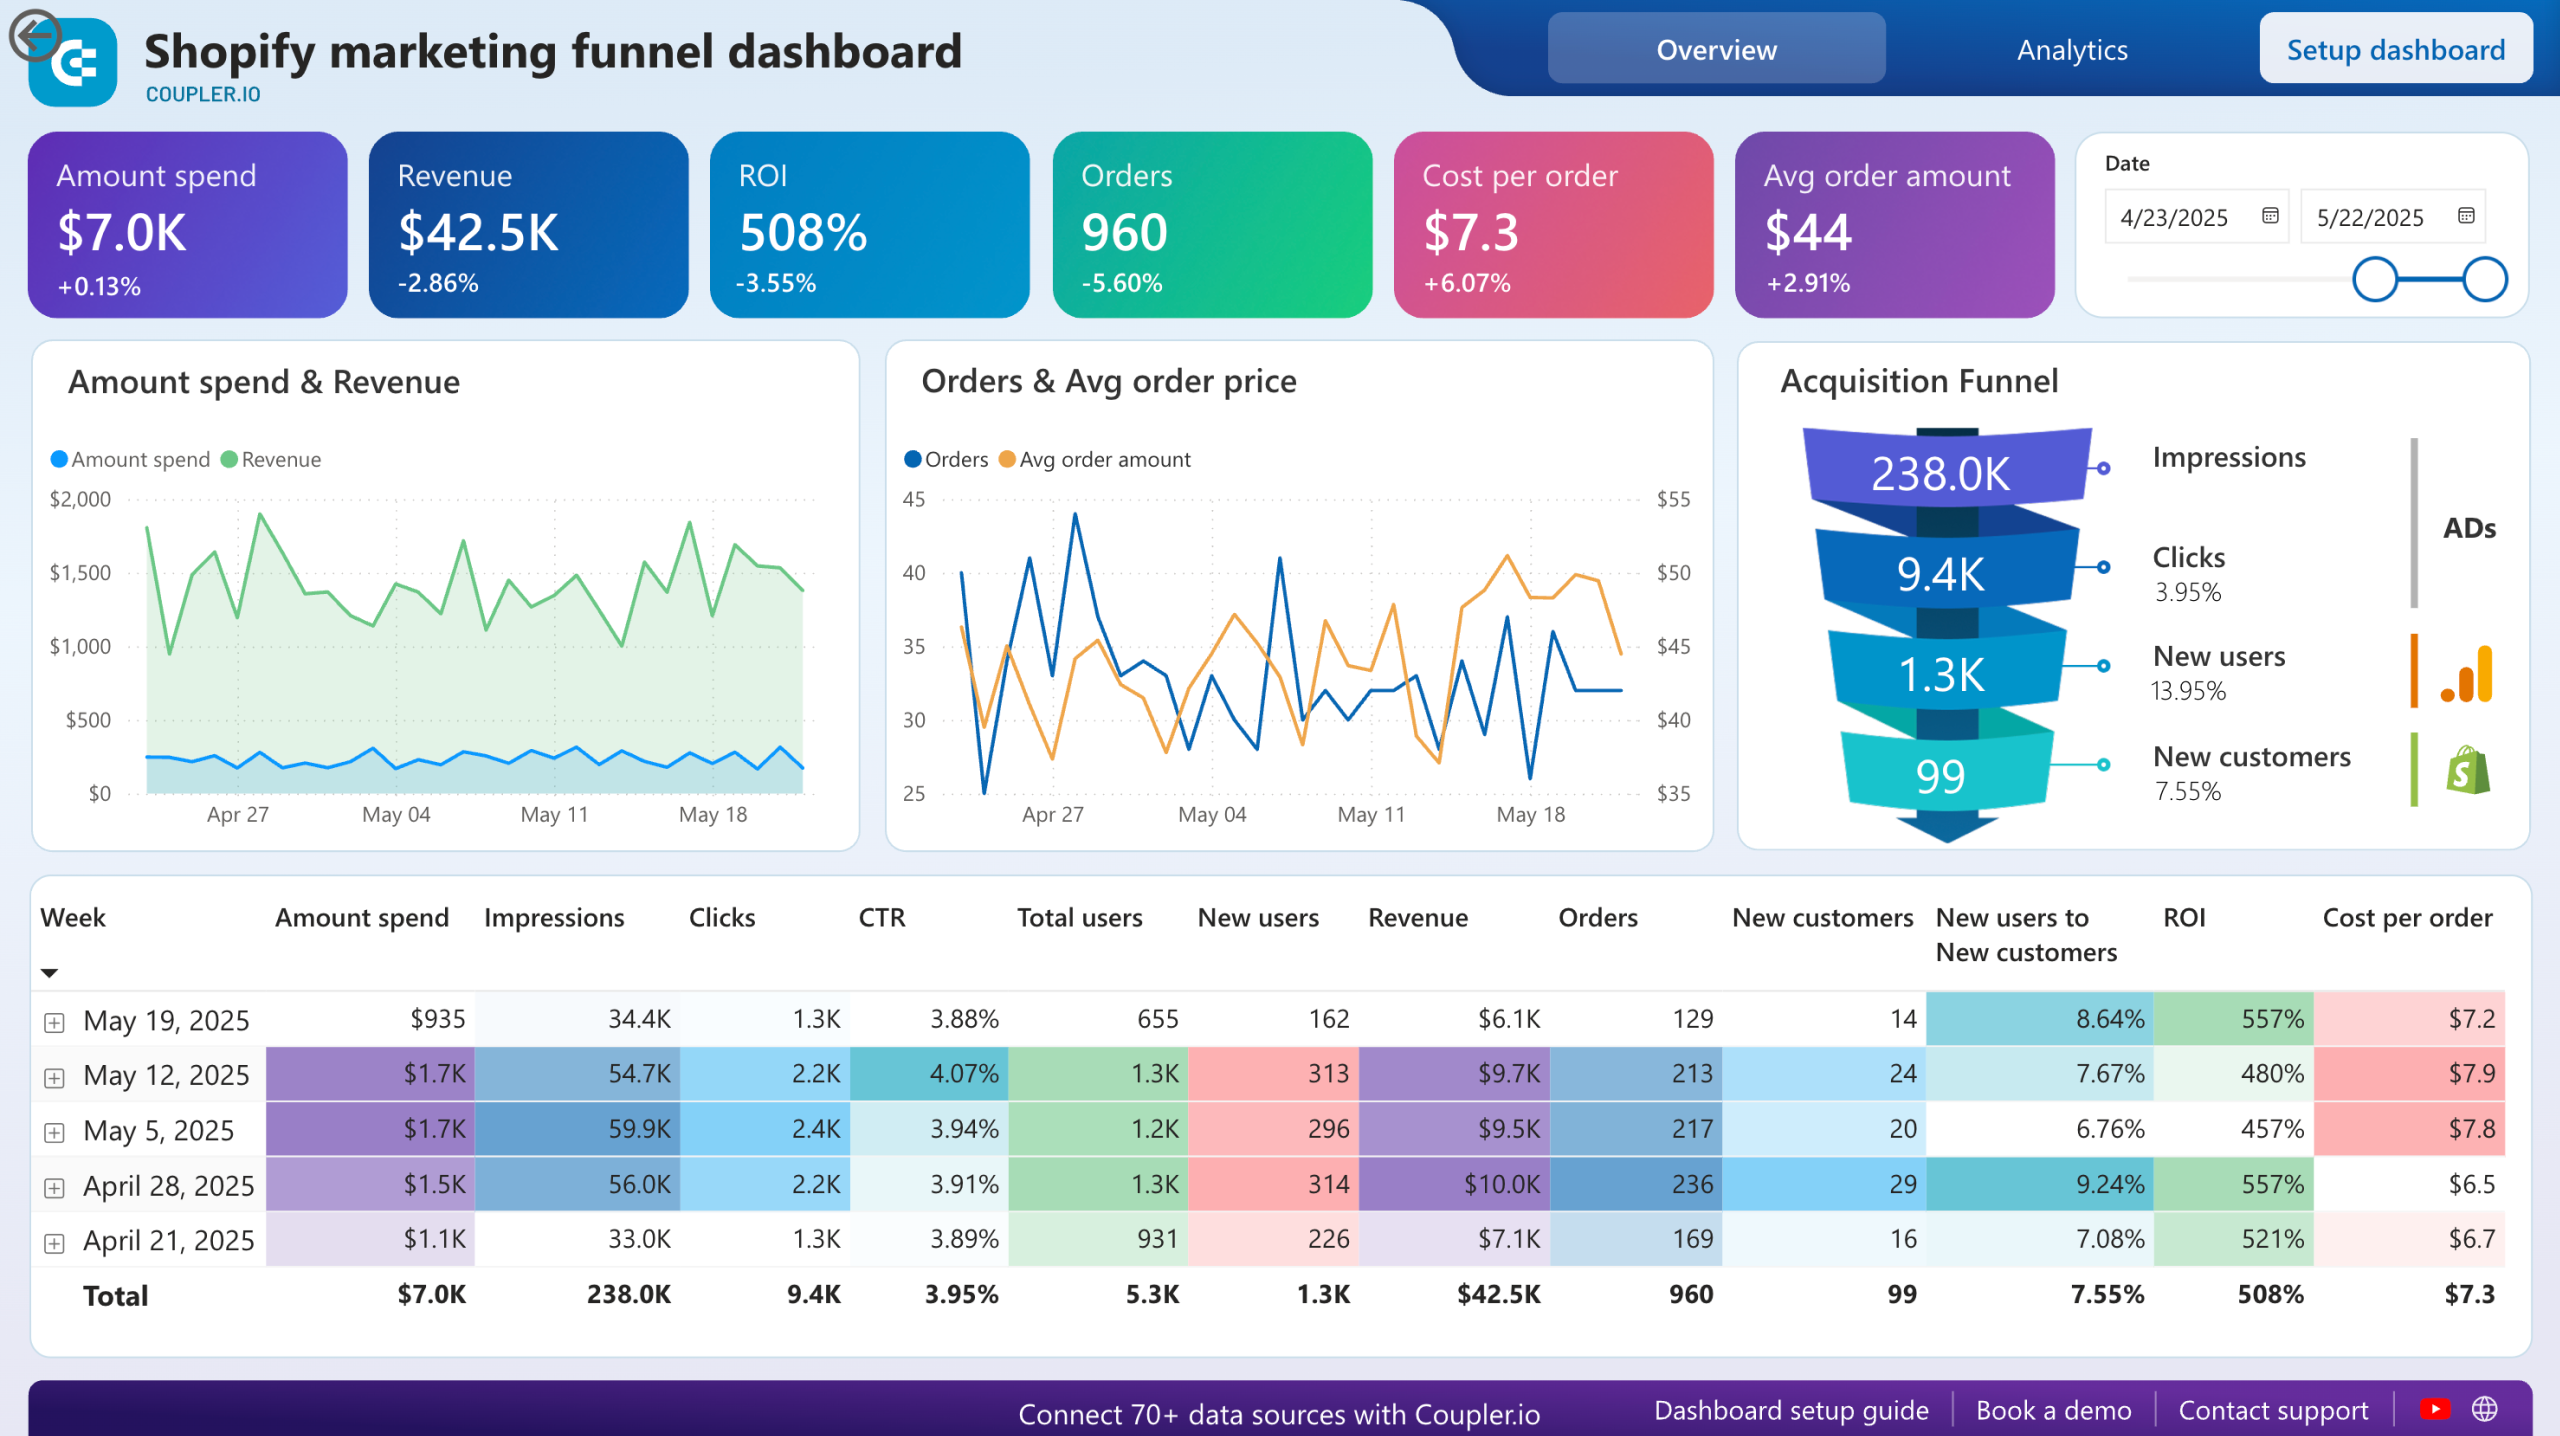
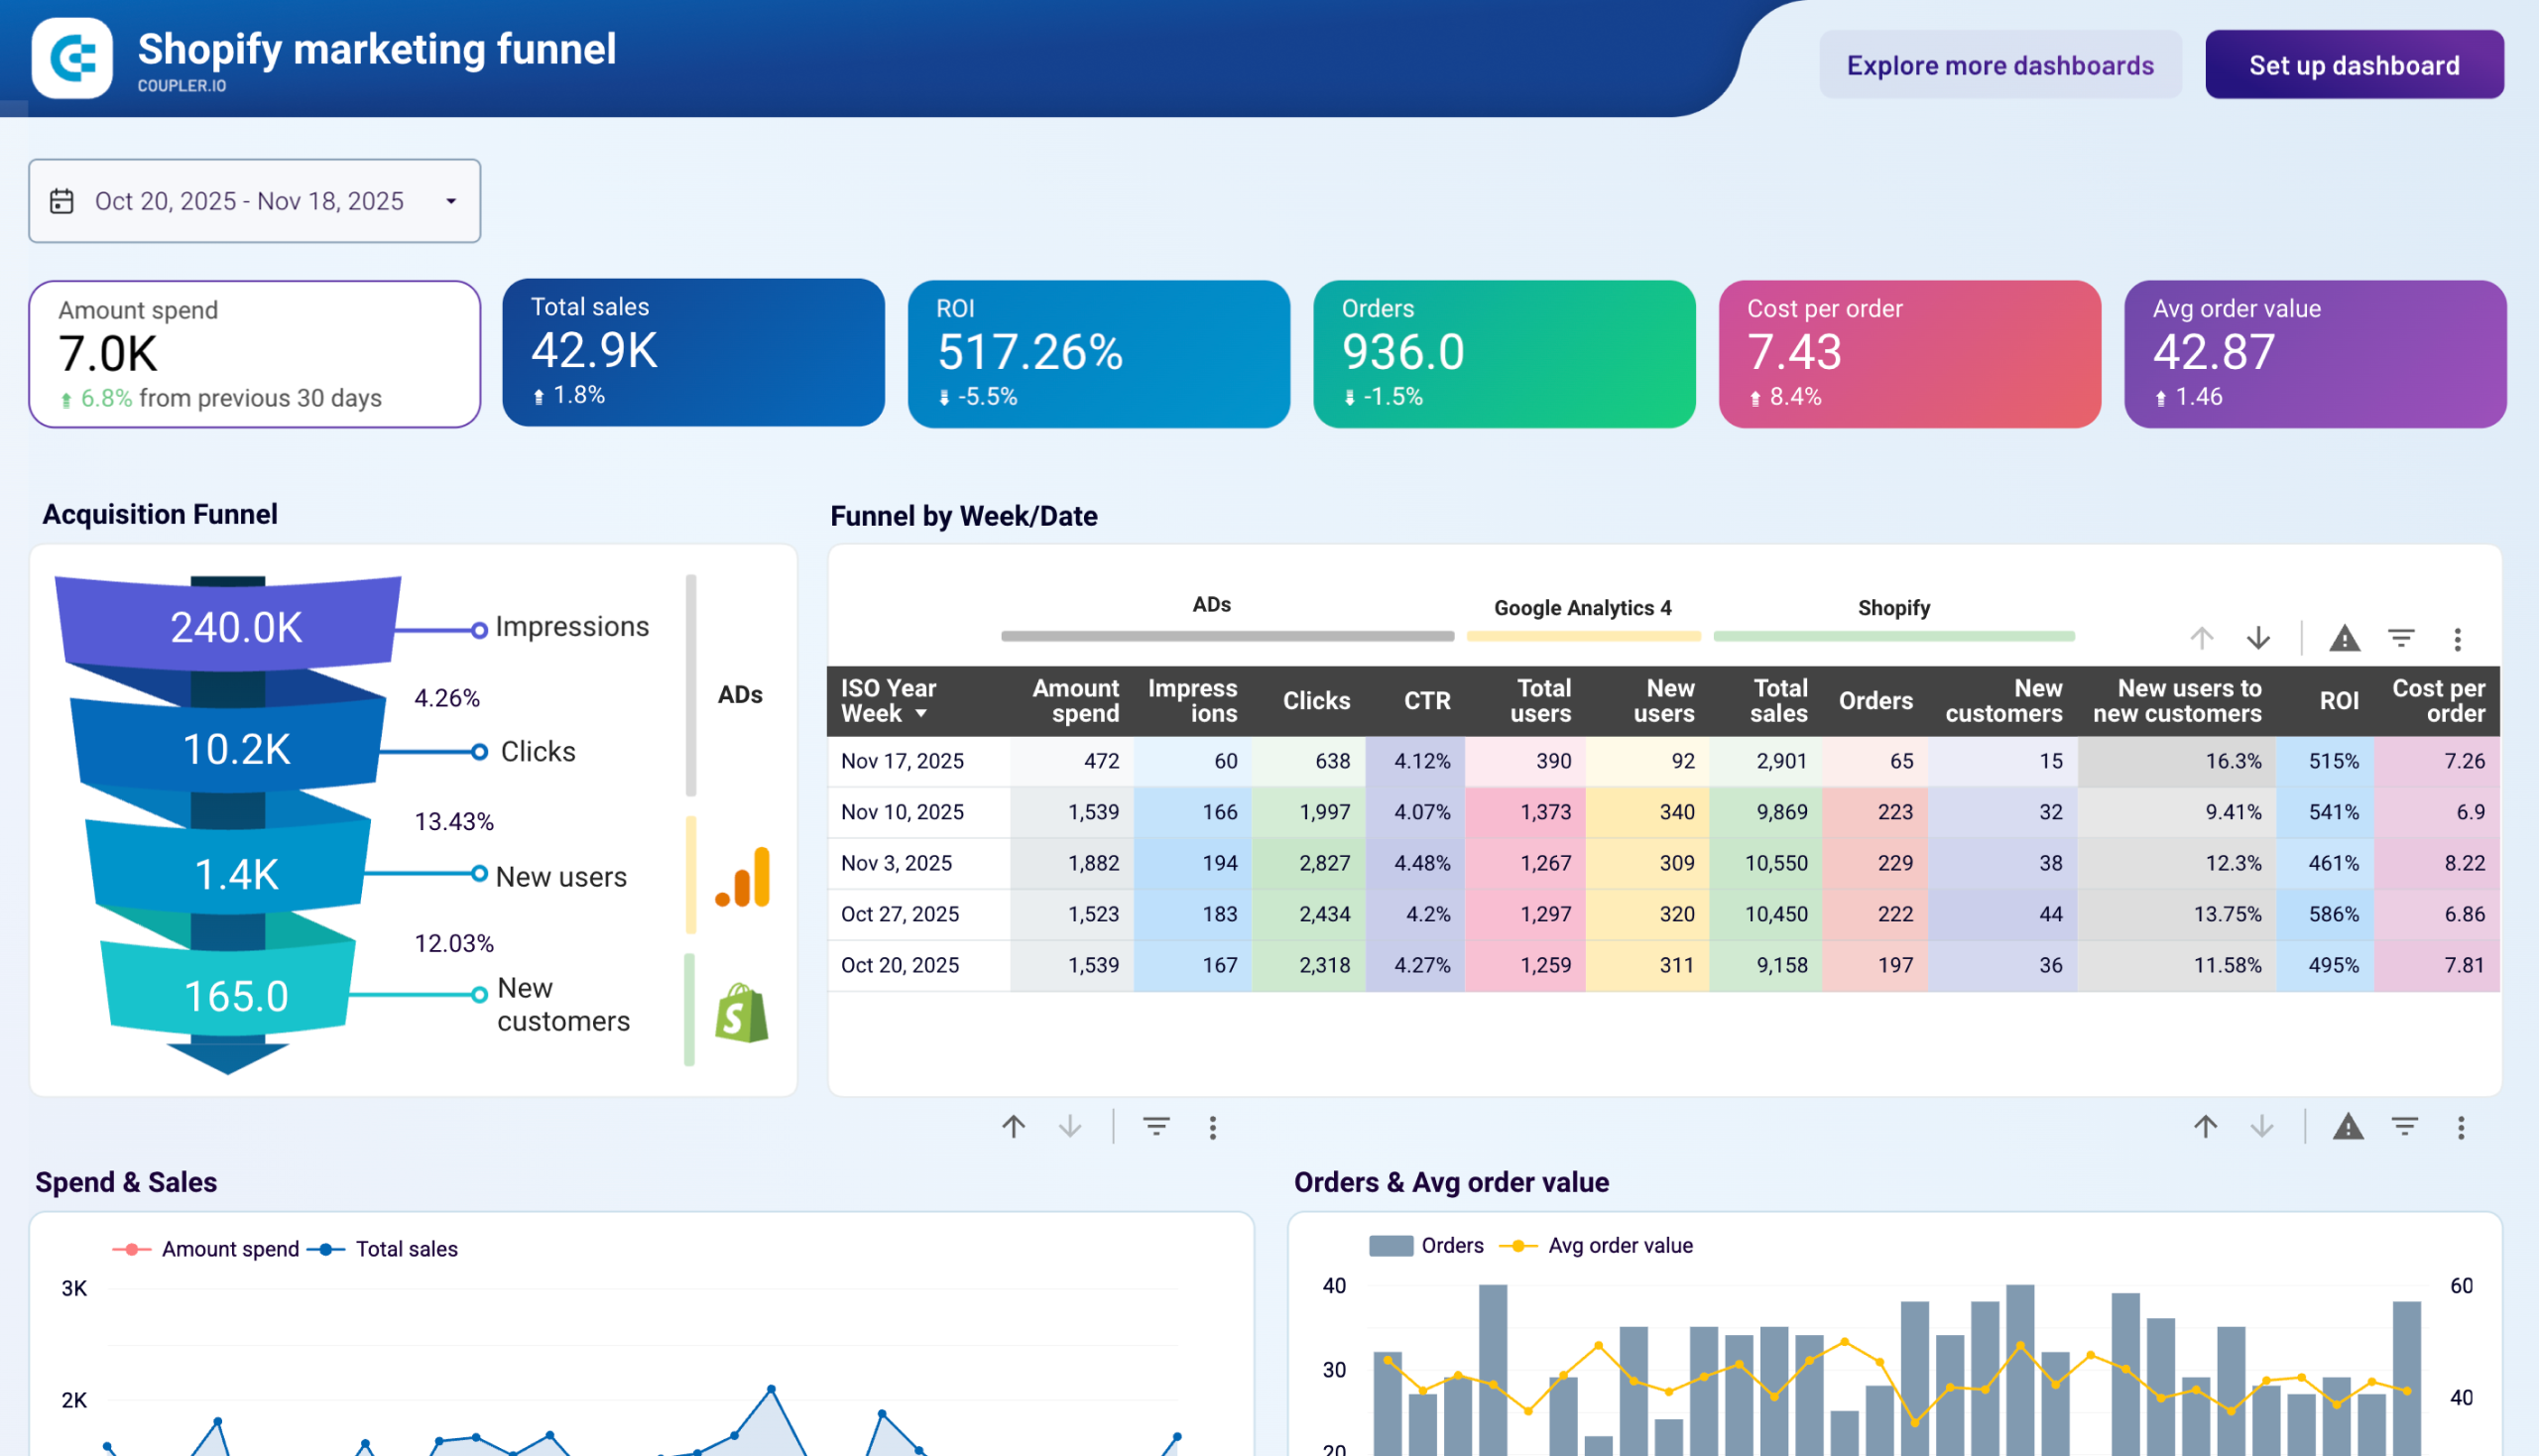
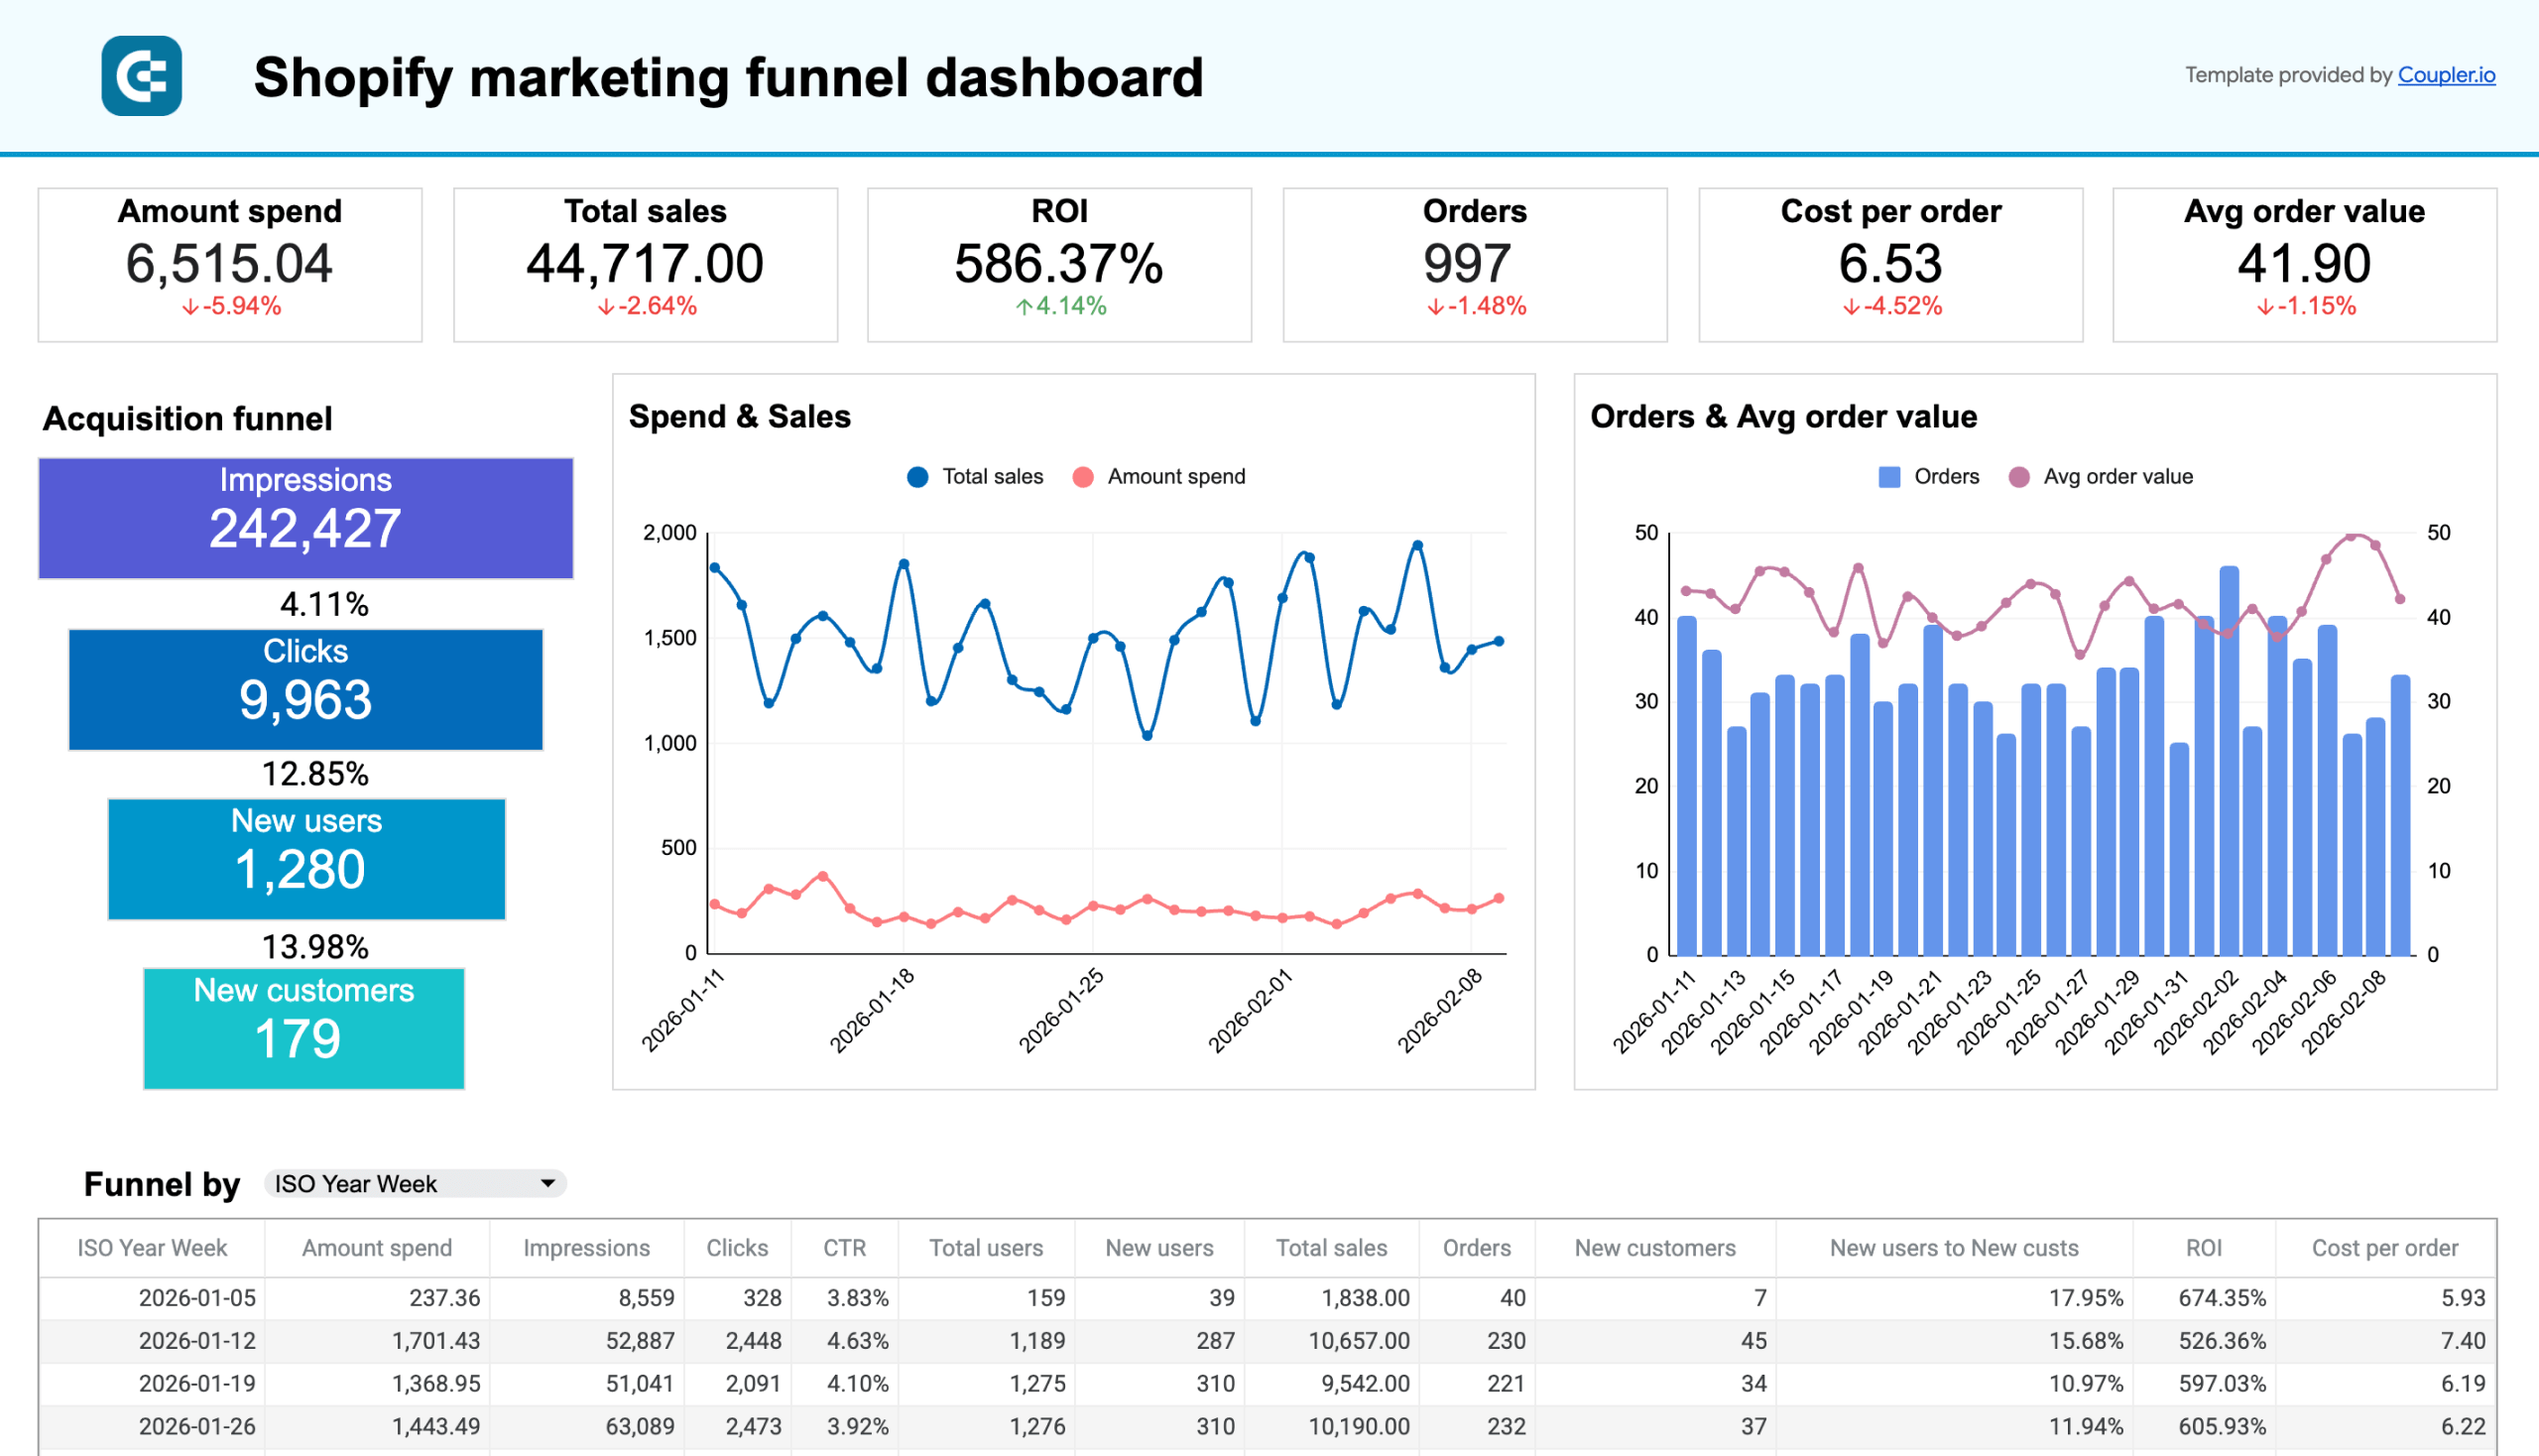
Shopify marketing funnel dashboard
Understanding whether your ad spend results in Shopify purchases actually requires data from GA4, Google Ads, Instagram Ads, and Shopify in the same place. The marketing funnel dashboard connects all of them and maps the full acquisition path — from impressions and clicks through site sessions to completed orders.
Shopify marketing funnel dashboard
 Preview dashboard
Shopify marketing funnel dashboard
Preview dashboardWhat insights the dashboard provides
- KPIs, including ROI, average order amount, and many others, allow you to evaluate the current acquisition funnel performance.
- The weekly data for impressions, clicks, total users, and new users show how spending translates into sales, plus the ratio of costs spent on advertising to sales, allowing you to make data-driven decisions on boosting your store’s performance.
- Expense tracking for each advertising platform is done to avoid budget exceedance.
- The dynamics of PPC campaigns, website traffic, and Shopify store customers to compare results over time.
How to use it
This dashboard is designed for use in Looker Studio as a template equipped with a Coupler.io connector. It automates data extraction from Shopify, GA4, and ad platforms and loads it into the dashboard on a schedule. To start using this template, follow the guidelines provided in the Readme tab.


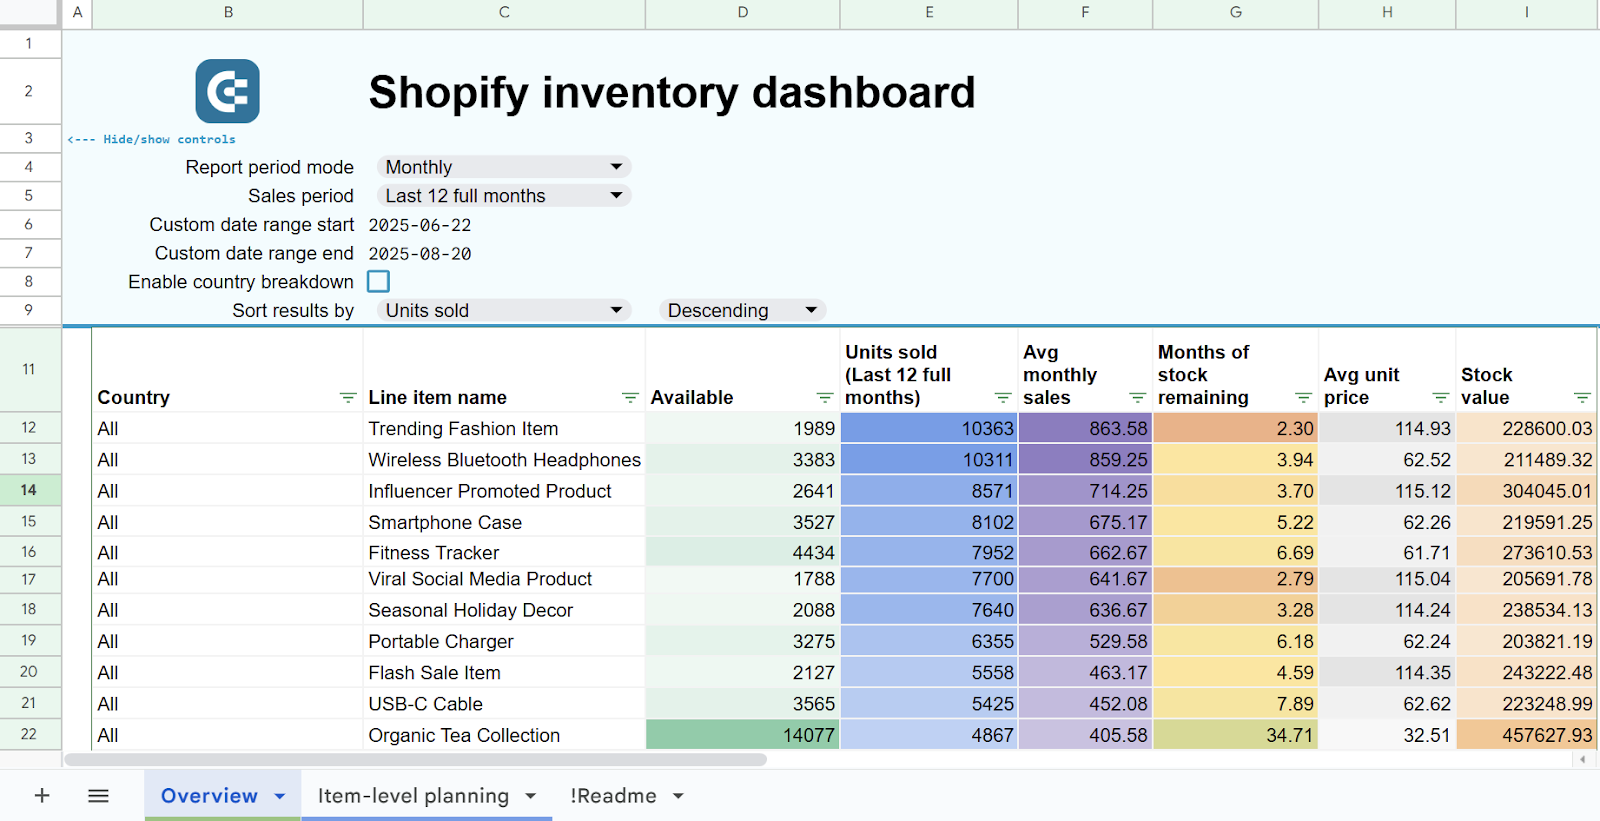
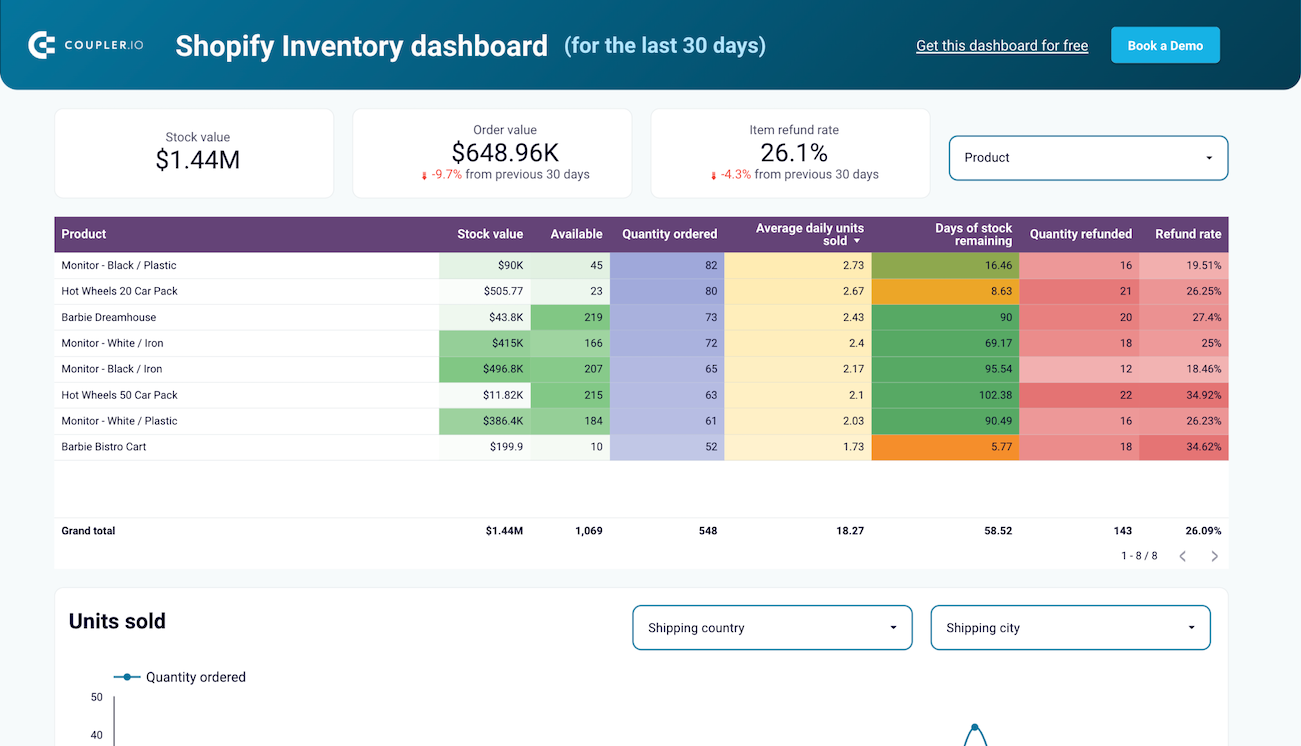
Shopify inventory dashboard
Running out of stock on a top seller costs more than overstocking a slow mover, but Shopify’s native inventory view doesn’t tell you which scenario is coming. The inventory dashboard calculates stock value, average daily units sold, and estimated time until stockout across all warehouse locations.
Inventory dashboard template for Shopify
 Preview template
Inventory dashboard template for Shopify
Preview templateWhat insights the dashboard provides
- Detailed inventory observation with characteristics such as stock value, availability, average daily units sold, etc., allowing you to replenish your stock in a timely manner.
- Information on the return rates by country gives you an idea of the geographical areas with elevated refund levels.
- Sales monitoring in real-time allows you to explore the purchase items and peak sales times.
- Stock availability by city and country lets you compare stock across all your warehouse locations to optimize product distribution and prevent stockouts.
How to use it?
This dashboard template was created in Looker Studio. You can freely use it to populate your reports with always up-to-date data from Shopify using the built-in Coupler.io connector. Check the Readme tab for detailed guidelines on how to configure and use this template.
Refresher: Prepare a project in BigQuery before integration
Before you send your Shopify data to Google BigQuery, some preliminary steps need to be taken. This set of guidelines is particularly useful for those who are new to Google BigQuery and need to prepare storage requirements beforehand.
In your Google Cloud Console, select BigQuery from the left menu panel.
Click My First Project next to the Google Cloud sign in the upper panel and click New project.
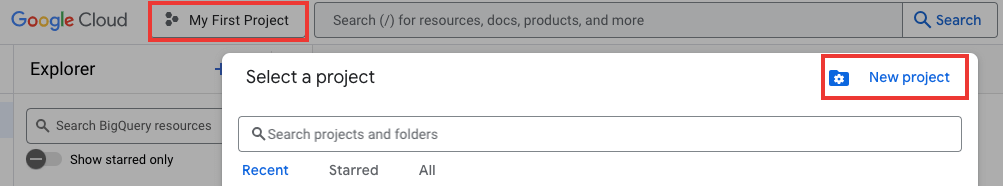
Fill in the required fields or accept the automatic suggestions and click Create.
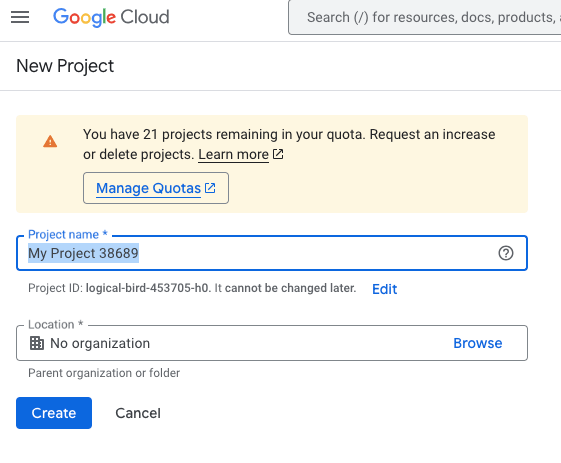
The newly created project appears in the Explorer panel.
Beyond the integration between Shopify and BigQuery
Real-world e-commerce setups rarely stop at one store or one data source. You might be running multiple Shopify stores alongside WooCommerce, pulling ad spend from Meta and Google, and tracking finances in QuickBooks or Xero. Coupler.io connects to over 400 sources, so all of that data can land in BigQuery or any other destination through the same platform. And once the data is there, you’re not limited to dashboards. You can ask questions about your combined datasets using AI Agent or send structured data to Claude, ChatGPT, and other AI tools through AI Integrations.
Automate Shopify reporting with Coupler.io
Get started for free