Marketing data lives in Google Ads and Meta Ads. Sales sits in HubSpot or Pipedrive. Finance runs on QuickBooks or Xero. Ecommerce revenue comes out of Shopify, and analytics comes from GA4. Every app answers one question well, but none shows the whole picture. As a result, anyone building a report ends up exporting CSVs, cleaning columns, stitching data together by hand, and more.
Extract, Transform, Load is the workflow that solves this. ETL pulls data from scattered systems, prepares it against defined rules, and loads it where reporting, analysis, and machine learning models can consume it. Below, you’ll find how each stage works, how ETL compares with ELT, when a business team actually needs the process, and how to run the whole workflow through Coupler.io without a data engineer or a custom pipeline.
What is ETL?
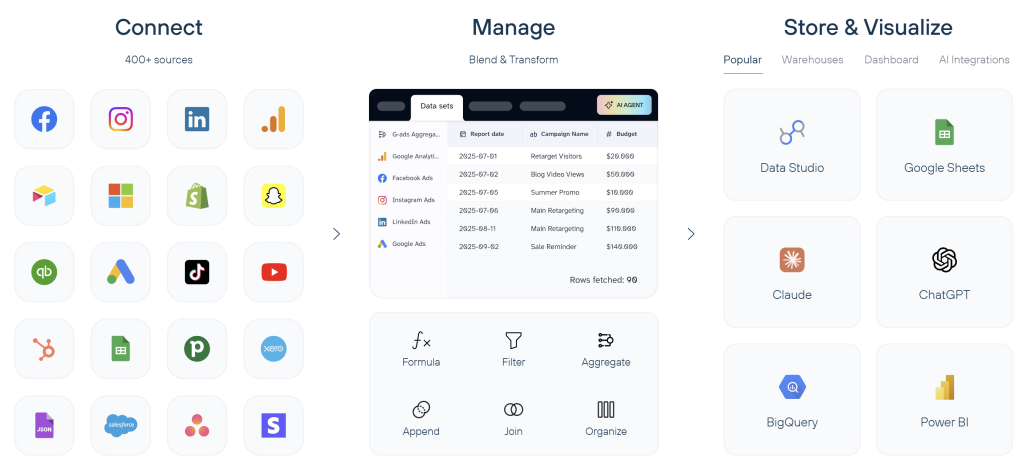
ETL meaning stands for Extract, Transform, Load. It’s a data integration process that collects data from one or more sources, prepares it according to defined rules, and loads the resulting dataset into a destination for reporting, analysis, storage, or other business use. The three stages, in order
- Extraction – pull data from source systems (apps, databases, files).
- Transformation – clean, reshape, and combine the data so it fits the destination’s structure and the reporting logic.
- Loading – move the prepared dataset into the destination.
Two points that often get blurred:
- The destination doesn’t have to be a single central repository or central database. For business reporting, it’s just as often a spreadsheet, a data warehouse, or a BI tool feeding a dashboard.
- ETL is one approach to data integration, not a synonym for it. Data integration is the broader category and includes processes that don’t follow the transform-before-load sequence (ELT, for example, reverses the last two steps).
The concept of ETL underlies different approaches and data integration systems. For example, in Coupler.io, each stage has evolved and been renamed, yet ETL remains the platform’s foundation.
What is an ETL pipeline
An Extract Transform Load pipeline is the ETL process implemented as a repeatable, scheduled workflow: the specific connections, transformation rules, destinations, and refresh logic that run the workflow. ETL is the pattern; an ETL pipeline is its running implementation.
Benefits and challenges of ETL
| Benefits | Challenges |
|---|---|
| Dataflow automation replaces recurring manual data movement between apps | Refresh intervals create some data latency |
| Applies consistent transformation rules across sources | Source APIs and connector limits can affect what gets extracted |
| Improves the quality and consistency of reporting data | Weak data validation rules produce incorrect or incomplete downstream data |
| Reduces manual exports and spreadsheet cleanup | Custom pipelines require implementation and maintenance resources |
| Makes combined datasets easier to trace and reuse | Schema or API changes can break flows without monitoring |
The more spread the data is across different apps, the harder it is to get the big picture of the business. A reliable, automated ETL solution can have a major impact on an organization’s ability to understand its data and make informed decisions. At the same time, automations save time and help avoid common errors that typically arise when data is moved manually between different apps or locations.
With Coupler.io, TradeZella used consolidated data and dashboards to identify funnel improvements. Activation increased from 28% to 65%, and retention improved 2.5 times.

Create self-updating ETL pipelines with Coupler.io
Get started for freeHow ETL works
Every ETL implementation walks through the same three stages, whether it’s a custom pipeline written by a data engineer or a scheduled data flow set up in Coupler.io. The mechanics are the same. What changes is who does the work.
1. Extract data from the source systems
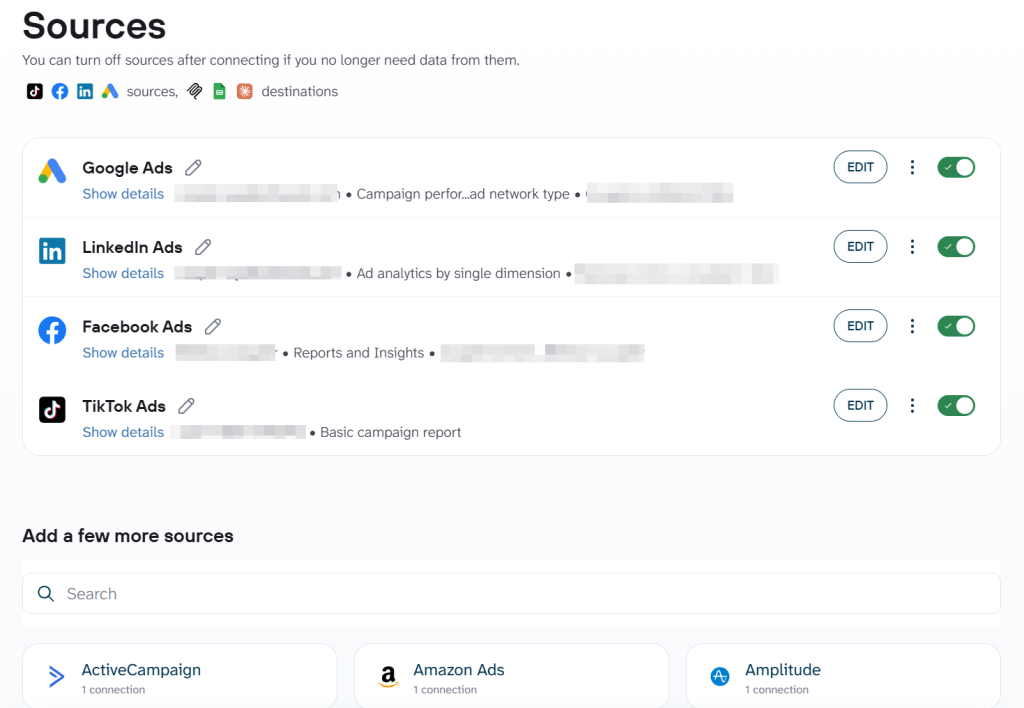
The first stage pulls data out of the systems where it lives: advertising platforms, CRMs, ecommerce tools, accounting apps, analytics platforms, spreadsheets, databases, and cloud storage. Each source has its own API and its own field structure.
In classic ETL pipelines, extracted data lands on a staging server (also called a staging area) where it waits for transformation before being loaded to the destination. Modern managed platforms handle staging differently depending on the destination.
Two extraction modes come up in most business workflows:
- Full extraction pulls the complete dataset each time. Useful for smaller sources or when historical data changes.
- Incremental extraction pulls only new or changed records since the last run. Faster, lighter on source APIs, standard for large sources.
Coupler.io connects to 420+ data sources through maintained connectors, so extraction doesn’t require API scripting. You pick the source (Google Ads, HubSpot, Shopify, QuickBooks, GA4, and so on), choose the account, select the data entity, and set the date range. All sources are available on every plan.
2. Transform and combine the data
Raw fields extracted from different apps rarely align. Column names differ, date formats differ, currency handling differs, and metrics that look the same in two systems often mean different things.
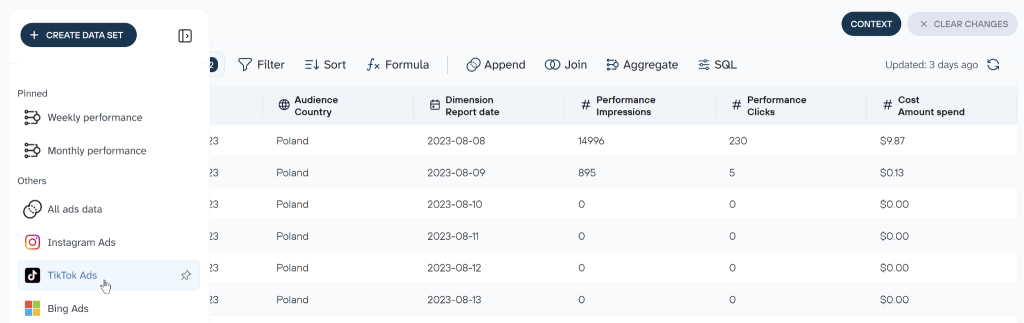
The transformation operations that matter most for business reporting:
- Select, hide, and rename columns so the dataset shows only what the report needs.
- Filter rows to narrow the scope by date, region, account, or any other field.
- Change data types and standardize formats. Handle dates, currencies, country codes, and timezone conversion.
- Add formulas or calculated columns to derive new metrics (ROAS, CPA, conversion rate, margin).
- Aggregate data to roll up rows by day, week, campaign, product, or region.
- Join datasets using matching fields, so two sources can be analyzed as one.
- Append datasets with compatible structures, so data from multiple accounts stacks into a single table.
Coupler.io handles all of these through its Transformation feature: a no-code interface where you set the rules once, and they run on every scheduled refresh. The dataset you build in Coupler.io can be connected to more than one destination.
Transformation and data blending overlap but aren’t the same. Transformation changes the structure, format, or values within data. Blending combines data from multiple sources into a single analysis-ready dataset. For a deeper look, see data blending tools.

An accounting firm saved 40 hours monthly on reporting with Coupler.io
Project Alfred blended HubSpot deal flow with Xero invoices to produce 12–24 month cash-flow forecasts, saving the accounting firm 20–40 hours a month on reporting.
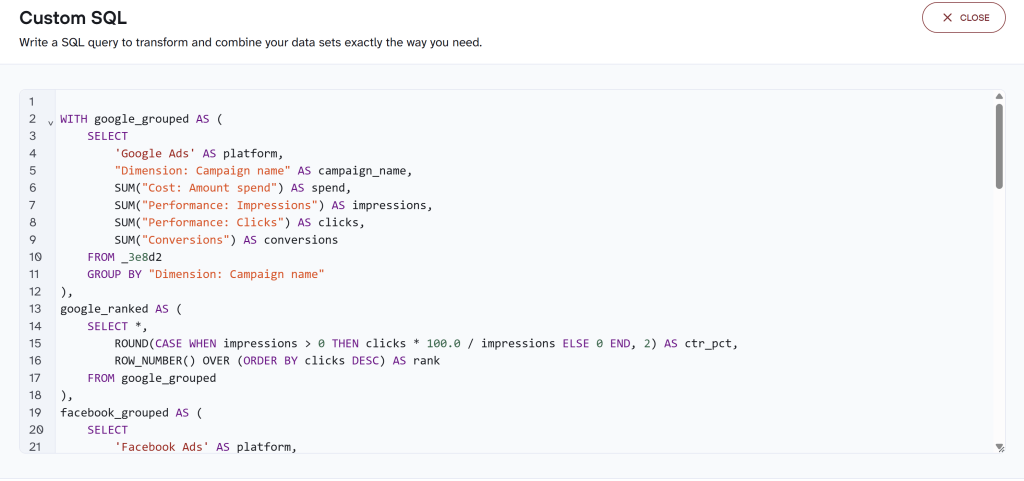
Review case studyFor complex or reusable preparation, an SQL transformation can express the logic more efficiently than a long chain of individual transformation steps. Coupler.io supports persistent SQL transformations, and Coupler AI can generate the SQL from a plain-language request. The query stays visible and editable, and the resulting dataset refreshes with the data flow.
3. Load prepared data into a destination
The correct destination depends on what the team plans to do with the data. Business reporting rarely calls for one universal destination.
| Business need | Possible destination |
|---|---|
| Familiar operational reporting | Google Sheets or Microsoft Excel |
| Scalable storage and deeper analysis | BigQuery, Snowflake, PostgreSQL, or Redshift |
| Dashboards and stakeholder reporting | Google Data Studio (recently renamed back from Looker Studio), Power BI, Tableau, or Coupler.io dashboards |
| Conversational analysis | A Coupler.io dataset queried through Coupler AI or a supported external AI tool |
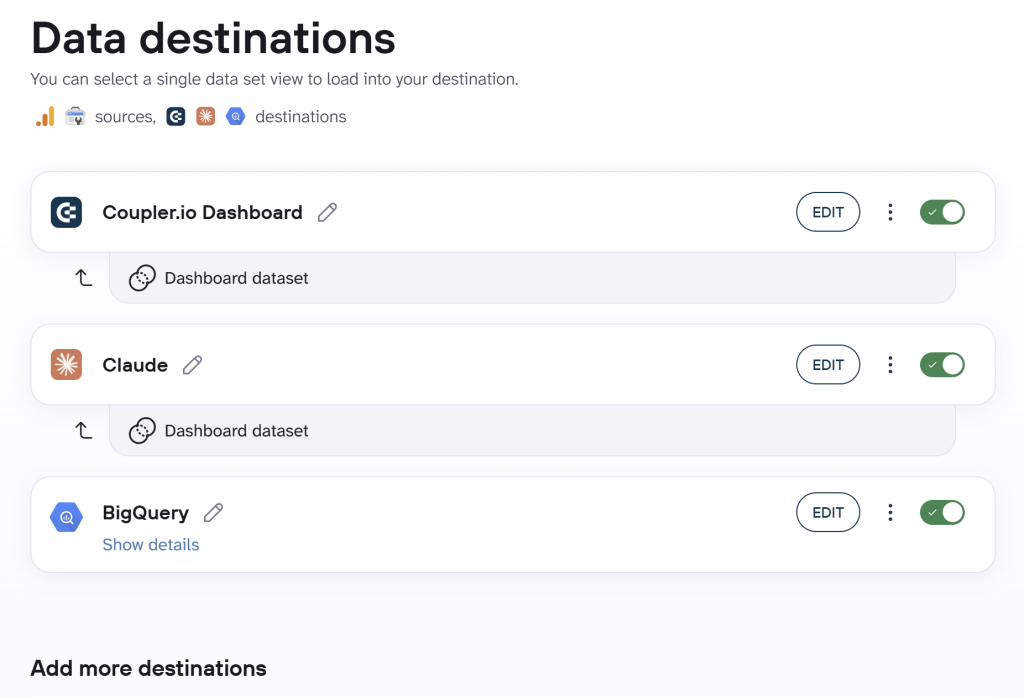
A single Coupler.io data flow can send prepared data to multiple destinations within the same data flow. Your GA4 + Search Console dataset can land in BigQuery for the analytics team, a Coupler.io or Data Studio dashboard for the marketing team, and in Claude for anyone willing to chat with the data. One pipeline instead of three separate ones.
4. Schedule and monitor the recurring workflow
Scheduling isn’t a fourth letter in ETL, but it’s what turns a one-time transfer into an actual pipeline. In Coupler.io, you configure the refresh cadence on the data flow: hourly, daily, weekly, or on a custom schedule matching the reporting cycle.
Source APIs change, schemas shift, and validation rules can silently let bad data through. A working ETL setup includes run history, refresh status, and error notifications. For deeper monitoring and performance tuning, see ETL process optimization.
How to manage an ETL process with Coupler.io
Coupler.io is a data integration and AI analytics platform, which many business teams use as an ETL solution. It handles all three ETL stages plus scheduling in one workflow, without the ETL developer time or ETL infrastructure that a custom pipeline requires.
In Coupler.io, an ETL pipeline is called a data flow. You can create it in two ways: describe what you need in plain language to Coupler AI and let it set up the flow. For account authorization, you’ll be prompted to sign in or enter the required credentials. Although the AI agent manages the setup flow, you’re in control.
Let Coupler AI do the data work for you
Tell Coupler AI what you need to know, from which source, and how often. It connects your account, sets up the data flow, keeps it refreshed, and lets you analyze the results inside Coupler.io or another AI tool.
Try for free
The traditional way to configure the flow is manually through the interface:
- Step 1. Connect data
- Create a data flow and connect one or more supported sources. Pick from 420+ data sources covering advertising platforms, CRMs, ecommerce apps, accounting tools, analytics platforms, warehouses, and files.
- Select the data and configure source-specific settings. Choose the account, data entity (campaigns, contacts, invoices, sessions), date range, and any filters the source supports.
- Step 2. Preview and organize the dataset
- Apply the transformation rules the report needs: hide columns, rename fields, add calculated columns, filter rows, aggregate.
- Join or append additional sources when needed. Coupler.io combines records from multiple accounts of the same platform (append), or blends data from different platforms (join) into one analysis-ready table.
- Step 3. Connect destinations
- Follow the in-app instructions to connect the needed destinations, Coupler.io dashboards, or connections to external AI tools.
- Run the flow and set its refresh schedule. Choose the cadence (refresh frequency): hourly, daily, weekly, or a custom interval.
Here are some of the popular integrations available:
- Airtable to Google Sheets
- WordPress to Google Sheets
- Hubspot to Google Sheets
- Xero to Google Sheets
- CSV to Google Sheets
- Shopify to Google Sheets
Automate data collection, transformation, and delivery with Coupler.io
Book a product demoHow Coupler AI extends ETL technology
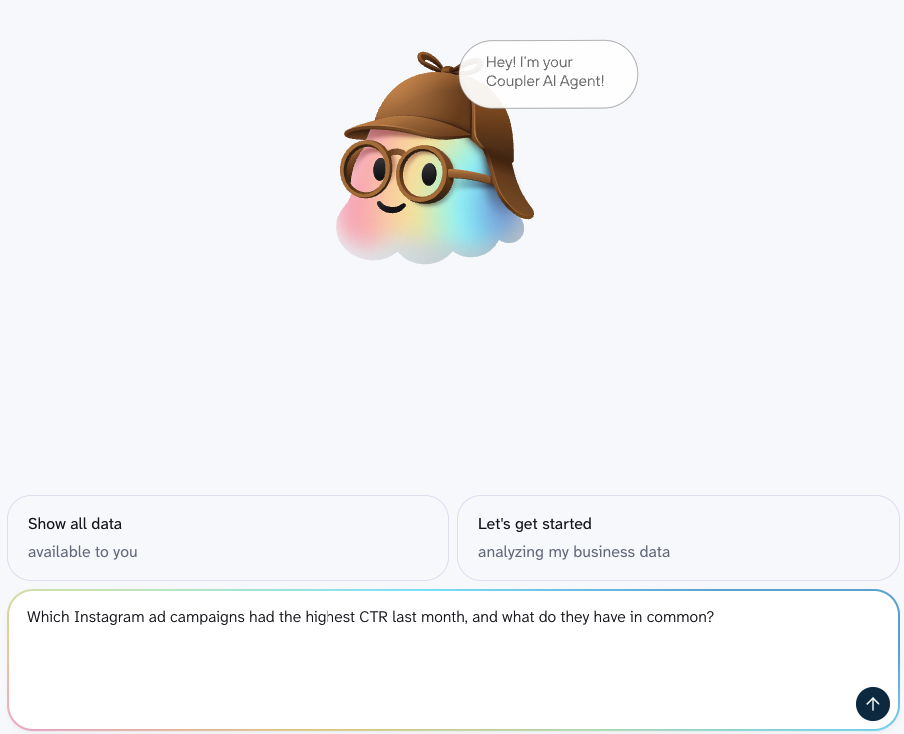
Coupler AI works through Coupler.io’s connections to business apps. It can guide users through creating or adjusting supported data flows and then analyze the prepared datasets produced by those flows.
Build and manage data flows conversationally
You can describe the data job in plain language, and Coupler AI walks through setup or adjusts an existing flow. Adding LinkedIn Ads to a weekly marketing reporting flow, or filtering a HubSpot flow to only closed-won deals: these are edits the reader can request instead of navigating the interface manually.
The scope is supported data flows on connected sources. Coupler AI doesn’t set up everything automatically, and it doesn’t work with sources outside the connector library.
Analyze the prepared data
Once a data flow is running, you can ask questions about the dataset directly in Coupler.io or make the data available in AI integrations for Claude, ChatGPT, Gemini, Perplexity, Cursor, and other compatible AI tools through Custom MCP. Copilot is also supported, though the connection goes through Copilot Studio with a different, admin-managed setup.
Inside Coupler.io, Coupler AI translates your question into a query. Coupler.io’s Analytical Engine runs the calculation against the dataset and returns the processed result. The AI model interprets and explains that result. Numbers come from the calculation layer; phrasing comes from the AI.
Two features shape the answers. Skills are pre-built analytical workflows for recurring analyses (marketing, finance, sales, and others), which you can also create and share yourself. Context supplies definitions for fields, metrics, exclusions, and business terminology, reducing the risk that the AI interprets technically correct data in the wrong business sense.
AI complements dashboards and reports. It handles follow-up questions and ad hoc exploration. It doesn’t replace governed reporting or human judgment.
ETL use cases for business teams
Every ETL implementation solves a version of the same problem: data lives in more than one app and someone needs a single, refreshed view of it. Five common cases:
- Marketing performance reporting. Sources: ad platforms (Google Ads, Meta, LinkedIn), analytics (GA4). Key transformation: standardize campaign naming and blend spend with conversion data. Output: a cross-channel dashboard for weekly reviews.
- Sales pipeline reporting. Sources: CRM (HubSpot, Pipedrive, Salesforce). Key transformation: filter to active deals and calculate stage conversion rates. Output: pipeline health and forecast.
- Ecommerce revenue and advertising-spend analysis. Sources: store platform (Shopify, WooCommerce), ad platforms. Key transformation: combine store revenue with advertising and analytics data by date, channel, campaign, or another available attribution field. Output: ROAS and margin reporting.
- Financial reporting. Sources: accounting (QuickBooks, Xero), payments (Stripe), spreadsheets. Key transformation: normalize currencies and reconcile invoice data across sources. Output: cash-flow, P&L, or receivables dashboard.
- Agency reporting. Sources: same platforms as above, but across multiple client accounts. Key transformation: separate client datasets and apply the same reporting logic to each. Output: white-labeled dashboards or scheduled client reports.
Cross-platform marketing reporting is a common ETL use case because every advertising platform stores performance data separately. Clear Performance Ads unified Google Ads, Meta Ads, and Amazon Ads into client dashboards and now runs all client reporting in about 15 minutes a week with one person.
Explore other ETL use cases for marketing, sales, ecommerce, and finance.
ELT use cases
Typical ELT use cases skew toward large-scale exploratory analysis rather than governed reporting. Big data processing, storing large datasets to track historical changes, and integrating raw data from multiple sources for data science and machine learning projects all fit the pattern. The value comes from having raw data available for open-ended querying. Warehouses like BigQuery, Snowflake, and Databricks are the typical destinations.
Explore multi-source ETL setups with Coupler.io
Book a demoETL vs. ELT: what is the difference?
ETL and ELT (Extract Load Transform) differ in one thing: when transformation happens.
- ETL transforms data before loading it into the target repository.
- ELT loads data first and transforms it inside the destination, using the compute of a cloud warehouse or lakehouse.
ELT is common with cloud-based warehouses that handle both structured and unstructured data efficiently. ETL is more often paired with on-premise warehouses or governed destinations where the schema is strict, and the reporting model is defined up front.
| Factor | ETL | ELT |
|---|---|---|
| Transformation point | Before loading | After loading |
| Typical destination | Structured reporting system or governed target | Cloud warehouse, lake, or lakehouse |
| Raw-data retention | Usually limited | Commonly retained |
| Best fit | Defined reporting needs, pre-load validation, sensitive-field removal | Large or changing datasets, flexible downstream analysis, warehouse-native transformation |
| Main trade-off | Less flexible when requirements change | Higher storage and compute use, more responsibility for governing raw data |
Aly Hussein, Data Consultant, explains the underlying distinction:
In ETL, heavy transformations are done before loading, so the data that lands in the warehouse is already clean, validated, and shaped to a strict schema.
In ELT, raw data is loaded first and can be transformed directly inside the warehouse. This avoids extra data movement and leverages the warehouse’s own compute for faster ingestion and better scalability.
The ETL future development often discussed by data teams is a shift toward hybrid platforms that support elements of both patterns, not the wholesale replacement of one approach by the other.
However, it’s better to ignore common oversimplifications like:
- ETL is inherently slow while ELT is inherently fast
- ETL only fits small datasets
- ELT requires no maintenance
- ELT automatically breaks GDPR compliance.
None hold as blanket rules. Each depends on data volume, destination, governance, and team resources.
When to use ETL or ELT
The choice isn’t always binary. Modern platforms support elements of both. But the defaults are worth naming.
Use ETL when the team has a defined reporting model, needs transformation or sensitive-field removal before loading, and prefers controlled, ready-to-query outputs. This fits finance, compliance, and cases where the destination is a spreadsheet, BI tool, or governed warehouse consumed by non-technical reporting users.
Use ELT when the organization runs on a scalable cloud warehouse (Snowflake, BigQuery, Databricks), wants to retain raw data for exploratory analysis, expects requirements to change often, and has the resources to manage warehouse-side transformations and governance.
Aly Hussein, adds a practical recommendation:
Use ETL when strict data quality, rigid schemas, or significant pre-storage cleanup is required (e.g., finance, compliance, legacy data warehouses).
Use ELT when working with modern cloud platforms (Snowflake, BigQuery, Databricks) and you need fast loading, scalable in-warehouse transformations, and flexibility for large or semi-structured data.
How to choose an ETL tool
ETL tools differ on who they’re built for and how much engineering work they expect from the user. Some cover the full extract-transform-load flow; others specialize in extraction, transformation, or orchestration. A short list of criteria:
- Coverage of current and expected data sources. The right ETL solution connects to the platforms the team already uses and the ones on the roadmap.
- Destinations for spreadsheets, warehouses, BI, and AI. Different teams need different outputs.
- No-code transformation and data blending. Determines whether a business team can build and maintain flows without an engineer.
- Refresh scheduling and reliability. Recurring reporting depends on flows running when they’re supposed to.
- Reusable prepared data across several outputs. One dataset feeding multiple destinations keeps numbers consistent.
- Pricing model and cost of scaling. Some tools charge per row, others per connector, others per query.
- Governance, security, and support. Access controls, compliance certifications, and support response times matter once the pipeline is in production.
Coupler.io fits business teams automating SaaS reporting and analysis without an engineering-heavy pipeline. It isn’t built to replace engineering-scale infrastructure for extremely high-volume or deeply custom pipelines.
For a detailed comparison, see best ETL tools. For a broader look at keeping the whole analytics setup manageable, simplify data analytics covers the tooling and process choices that keep reporting sustainable.
Frequently asked questions
What’s the difference between ETL and data integration?
Both terms describe combining data from multiple sources into a single view. Data integration is the umbrella; ETL is a specific pattern within it that follows extract-transform-load in that order. Using “data integration” in a scoping conversation signals the broader goal (any technique that unifies data, including replication, virtualization, and streaming). Using “ETL” signals a specific implementation where transformation happens before loading.
How do ETL and reporting work together?
Reporting depends on ETL having done its job first. In a business intelligence workflow, ETL is the layer that produces the prepared data; reporting is the layer that presents it. If numbers show up inconsistently across dashboards, the fix usually starts one layer down at the ETL step, not in the reporting tool. A well-designed setup treats the prepared Coupler.io dataset (or the analogous warehouse table) as the source of truth so every dashboard, spreadsheet, and AI query pulls from the same numbers. When a metric definition needs to change, the change happens once in the transformation logic rather than being reapplied in every downstream report.
How to manage an ETL process
Managing an ETL process is less about the initial build and more about what happens after. Clear ownership of each pipeline, a documented refresh schedule, and monitoring on source and schema changes catch problems before stakeholders see broken dashboards. Change management matters too: metric definitions drift, source fields get deprecated, and stakeholder requests keep coming. A custom pipeline puts pipeline architecture, data modeling, data warehouse architecture, and this ongoing maintenance on the data engineering team. A managed platform absorbs the infrastructure work so the team focuses on the reporting logic.
What are the ETL vs ELT pros and cons?
Framing the choice as an ETL vs. ELT pros-and-cons list can miss the underlying question: what your destination is optimized for. A governed reporting warehouse or a BI tool consumed by non-technical users benefits from ETL’s pre-load validation and defined outputs. A cloud warehouse used for exploratory analysis and machine learning benefits from ELT’s raw-data retention and warehouse-native compute. The specific trade-offs (storage cost, flexibility, governance responsibility) fall out of that primary decision rather than driving it.
Do you need an Extract Transform Load process?
You probably need an ETL process when:
- Data for one report comes from more than one app.
- Someone on the team repeatedly exports and cleans the same files.
- Metrics need to be standardized before they can be compared across sources.
- Dashboards go stale because their source data isn’t refreshed consistently.
- The team wants a reusable dataset for reporting, ad hoc analysis, or AI.
If two or more are true, the manual effort is already costing time. The question is whether to build a custom pipeline or use a managed platform.
A custom ETL pipeline can be justified for highly specialized engineering requirements: proprietary sources without connectors, extreme volume, or transformation logic that only a data engineering team can maintain. For the recurring business reporting workflows most teams actually run, a managed platform such as Coupler.io covers the same ETL process with less setup and a shorter path from source to dashboard.
Mailtrap used consolidated reporting to inform decisions, and MRR increased by 466% over three years. No business can operate well without a proper analysis of data taken from different sources, and analyzing data is crucial once that data lives in one prepared, refreshed place.
Run ETL and AI analytics with Coupler.io
Get started for free