Running a WooCommerce store without analytics is like trying to paint without a brush. Your store will function normally; however, you will not have access to the metrics that can help you improve its performance and scalability. You won’t be able to tell if your business is doing well or not.
The solution here lies in putting analytics into action, as this will allow you to analyze the information you collect on your customer’s interactions with your online store, purchases, sales, orders, and more.
You’re at the right place if you’re looking to learn how to run analytics for WooCommerce using its built-in tools, as well as how to implement analytics outside of WooCommerce, which we can assist with.
Analytics for WooCommerce
When it comes to WooCommerce stores, no two are the same. Each may be different in terms of size, items offered, and so forth. Running analytics for WooCommerce using its built-in tools provides shop owners with useful information about the performance of their items, the demographics that their customers fall into, customer behavior, etc. All of this can be used to develop an effective business strategy and actionable plan.
But if you want more control over how your analytics are set up, such as the ability to add or remove metrics, do custom calculations, etc., you’ll have to build your analytics dashboard outside of WooCommerce. This is the only way to get the level of customization freedom you want. More of this can be seen in the WooCommerce analytics Dashboard DIY chapter.
Native WooCommerce analytics conversion tracking
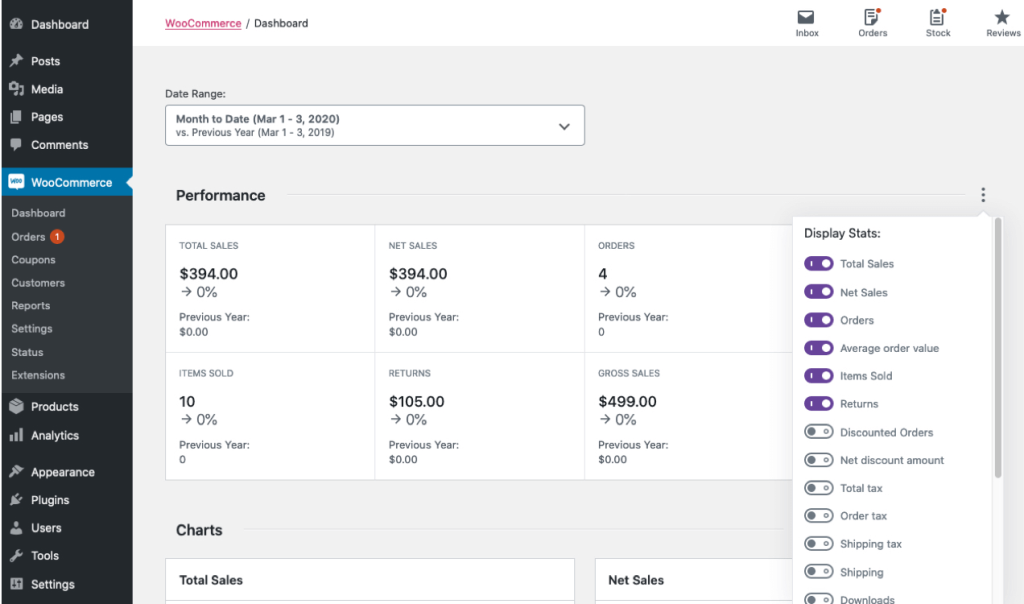
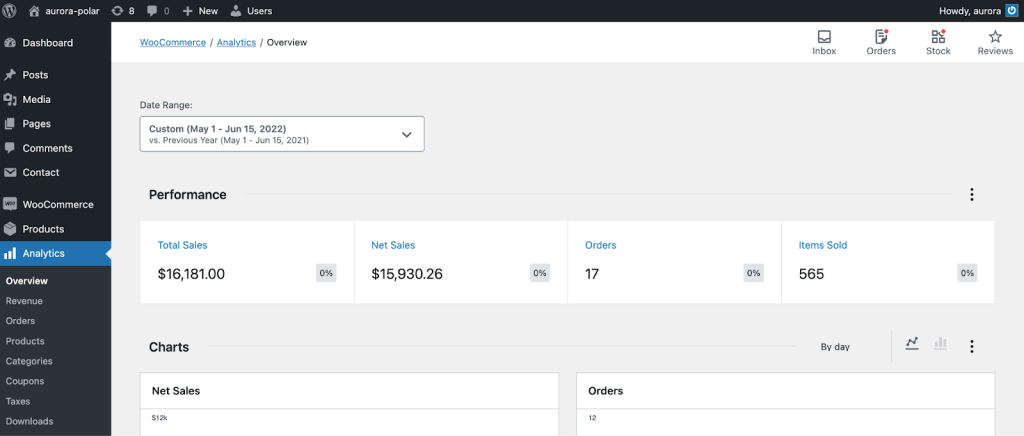
WooCommerce analytics dashboard overview
The goal of the WooCommerce analytics overview dashboard is to provide you with the metrics for your store in a way that is easy to read and interpret. This only works with WordPress v5.3 and above. In the overview dashboard, we have these sections: “Charts,” “Performance,” and “Leaderboards.” Each of them can be tailored to highlight the metrics that are most important to your business.
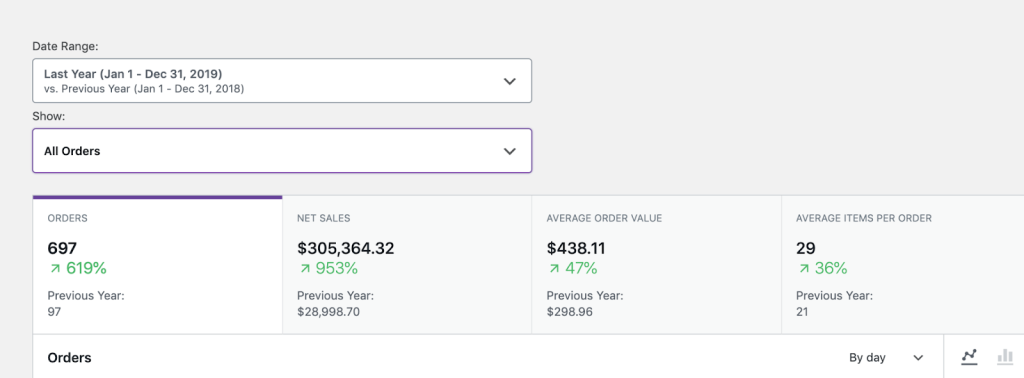
Performance
This is the first part of the dashboard overview. When running analytics for WooCommerce, the performance section gives you an overview of your store’s stats relating to the time period that you select.
The store stats show percentages, which are usually highlighted with either a red or green mark. The green percentage mark shows that your store is thriving, and it is recommended to always be at that mark.
The metrics that are often shown include total sales, net sales, orders, items sold, variations sold, etc. Many store owners use this for comparison, as it quickly gives a snapshot of how the store is doing.
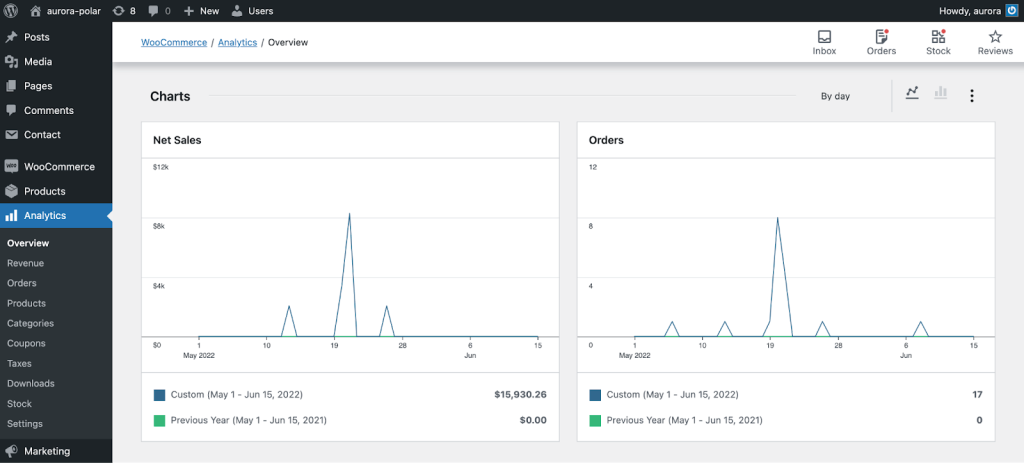
Charts
This section provides you with a visual representation of the data you’ve collected in the form of charts and graphs. It gives you more information based on the time period you choose, so you can get a better idea of how well your store is doing. The following are some of the metrics you may see in the chart section:
- Total Sales
- Orders
- Average Order Value
- Gross Discounted Amount
- Shipping
- Downloads, etc.
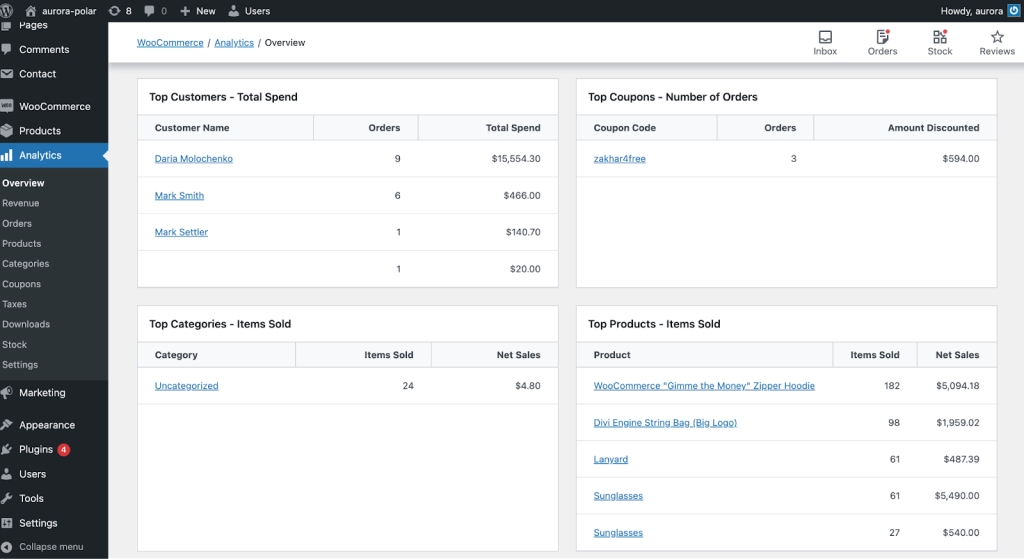
Leaderboards
This is the last section of the WooCommerce analytics dashboard. Here you can see which of your products, orders, customers, coupons, and categories performed best throughout the selected timeframe. This section is important when running analytics for WooCommerce because it tells you more about the products that are popular in your store and the regular customers who are making a big difference in the growth of your store. It also lets you see if the overall trend of interest in certain products you offer is positive or negative.
WooCommerce analytics report
Although the overview dashboard is a great place to keep an eye on some important metrics, WooCommerce also provides a wide variety of other reports that can be used to dig deeper into your store’s performance. Let’s take a look at some of them.
| Report Metrics | Description |
| Categories report | Here, you can find information on the different product categories available in your store. |
| Coupons report | This report displays data related to discount amount, coupon code, and number of discounted orders. |
| Product report | The statistics in this report allow you to analyze the sales performance of each product in your store. |
| Tax report | From this report, you can get more information on the taxes collected on your store. |
| Customer report | In this report, you can get more data on your customers – when they registered, their geographical location, etc |
| Downloads report | This report provides insight into the performance of your store’s downloadable products. |
| Orders report | The statistics in this report include information on your order volume, shipping, payment method, and returns, etc. |
| Revenue report | Here, you can view the daily revenue of your store. |
| Variations report | This report provides insight into the sales performance of product variations in your store. |
| Stock report | From this report, you can get information to analyze the inventory of your store. This report is only available for stores with stock management enabled. |
WooCommerce Analytics Settings
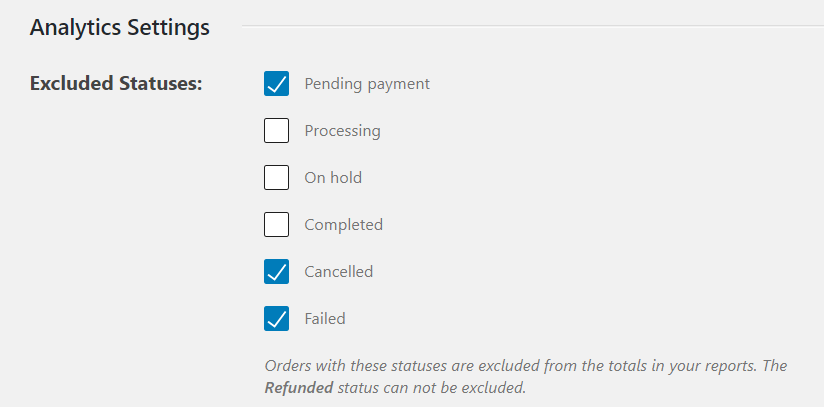
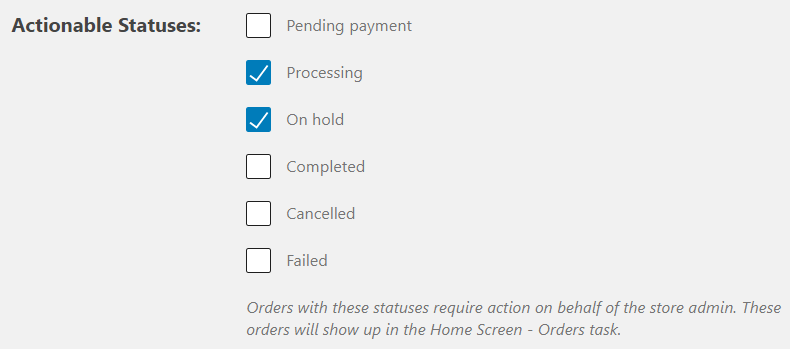
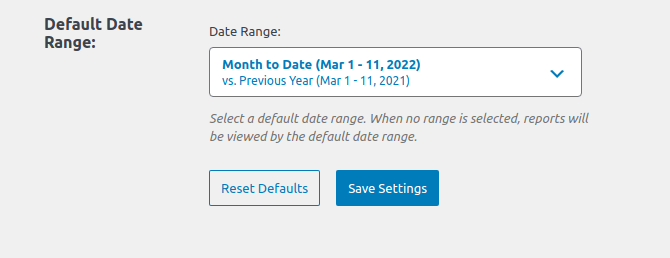
You can personalize your report to reflect the information that is most important to you. To do this, go to Analytics > Settings and from there you will see a list of actions that can be carried out.
- Excluded Statuses: When this setting is enabled, checked statuses are excluded from the analytics reports but unchecked statuses are included.
- Actionable Statuses: In this setting, you can select the statuses that require maximum attention, and the orders with such statuses will be displayed on the Home Screen
- Default Date Range: Date in the WooCommerce dashboard is usually displayed in a month-to-date format. You may, however, choose to modify the timeframe for the reports using the date range selector.
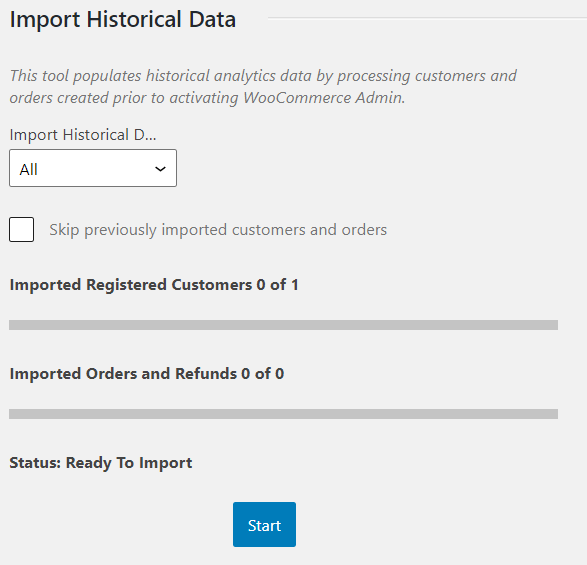
- Import Historical Data: This setting enables you to import your past data. Including all relevant past transactions in the report will give you a more comprehensive understanding of how successful your company has been.
WooCommerce analytics dashboard DIY
One of the reasons one might consider creating their own WooCommerce analytics dashboard is to be able to customize it in a lot of different ways. This gives you ultimate control of your dashboard. You’ll be able to show the data that works best for you.
When running analytics for WooCommerce using the native dashboard, you won’t be able to add any custom metrics to it or display your data in the way that you want to. This is because you’ll be limited to using only the default metrics that the platform provides.
When you create your own WooCommerce analytics dashboard, you have a lot of choices on how to organize, calculate, filter, and show your raw WooCommerce data in the manner that you want. To illustrate how to go about this, we’ll show you a step-by-step process on how to set up a custom analytics dashboard for your WooCommerce orders.
Tools to build a custom WooCommerce analytics dashboard
The first thing you need to do in order to create a WooCommerce dashboard that is unique to your business is to choose the appropriate tool for the task. The following is a list of software that may be used for the purpose of data processing, transformation, and visualization.
- Spreadsheet apps: Spreadsheet applications, like Excel and Google Sheets, provide users with the ability to do complex computations and analyses, develop new metrics, and fine-tune the figures shown on their dashboards. In addition to this, its integrated visualization capabilities enable you to construct useful dashboards with minimal work required.
- Data analytics tools: The use of data analytics solutions such as BigQuery, Databricks, and Cloudera, amongst others, may provide you with useful insights into the operations of your store, as well as the preferences of your customers. For instance, if you export your WooCommerce store to BigQuery, you will be able to make use of the built-in machine learning algorithms to do an in-depth analysis of your data.
- Data visualization tools: You will be able to conduct an in-depth analysis of your findings and construct expert-level dashboards by making use of data visualization tools like Looker Studio, Tableau, and Power BI, amongst others.
WooCommerce analytics export
After figuring out the tool to use for your dashboard, the next step is to export the data you want on your dashboard to the tool of your choice. This process shouldn’t be done manually, as this would be too time-consuming and inefficient. To keep your dashboard up-to-date, you’ll need to refresh your data regularly, exporting it again and again.
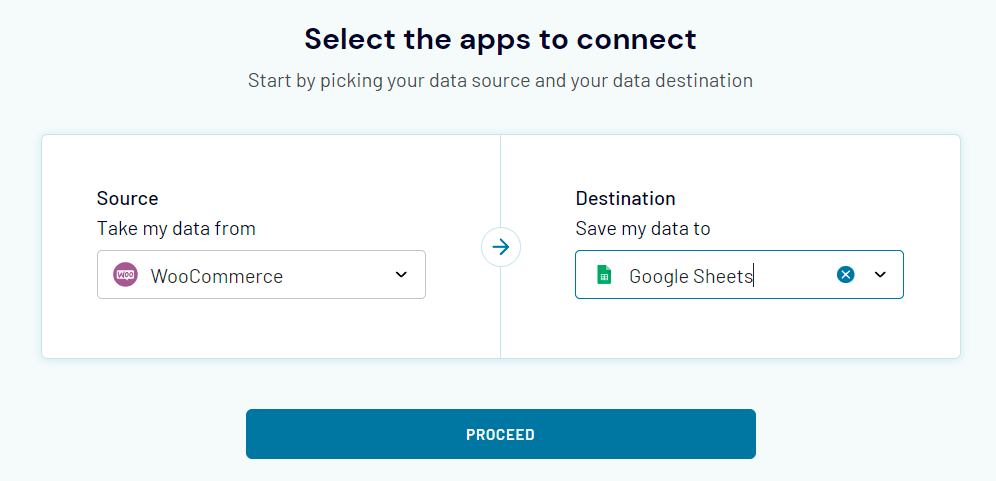
So, it’s important to automate the data flow from WooCommerce to your dashboard. For this example, we will use Coupler.io. This data integration solution will help us automate the export of data from Woocommerce to Google Sheets. In addition, it will keep updating WooCommerce data in a spreadsheet on a schedule or timeframe of your choosing.
Note: Coupler.io is a solution that allows you to export data automatically from 60+ various sources, such as WooCommerce, HubSpot, Pipedrive, and others, into Google Sheets, Excel, BigQuery, or Looker Studio.
The process is rather simple. First, sign up to Coupler.io and click Add new importer. Select WooCommerce as a source and Google Sheets as a destination, and then click Proceed.
In addition to Google Sheets, you can export WooCommerce to Excel or load data from WooCommerce to Google BigQuery. For building more advanced reports, you can connect WooCommerce to Looker Studio and enjoy custom data visualization options.
Then you’ll need to take the following steps:
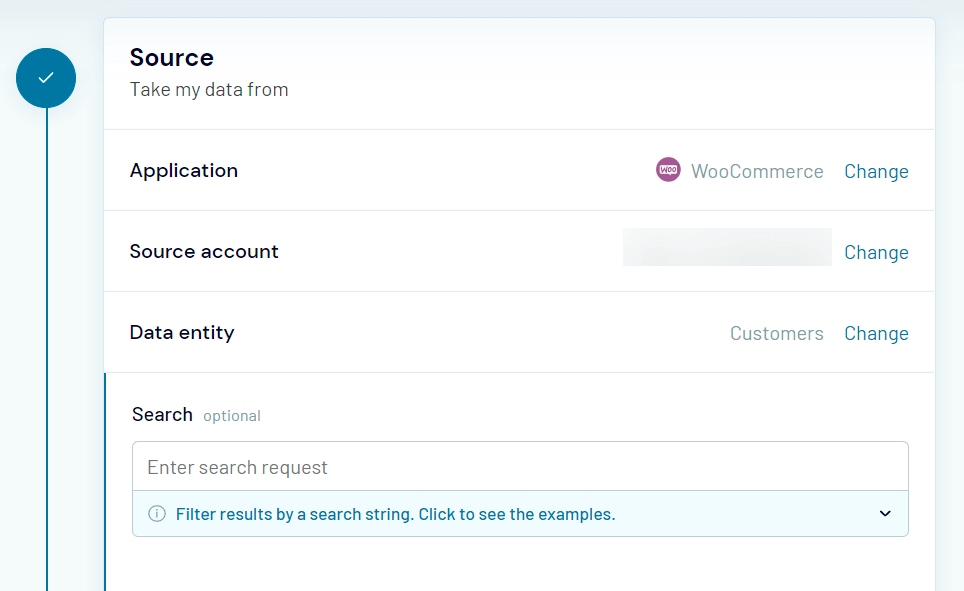
Configure source
- Connect your WooCommerce account.
- Select Orders as the data entity.
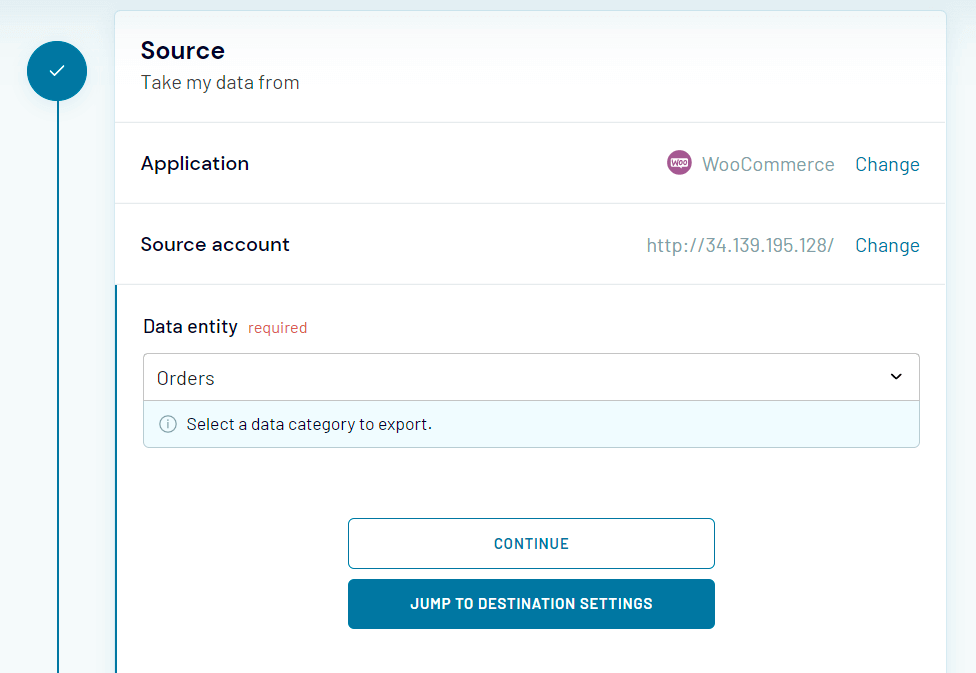
You can also specify the period to filter your data should you wish.
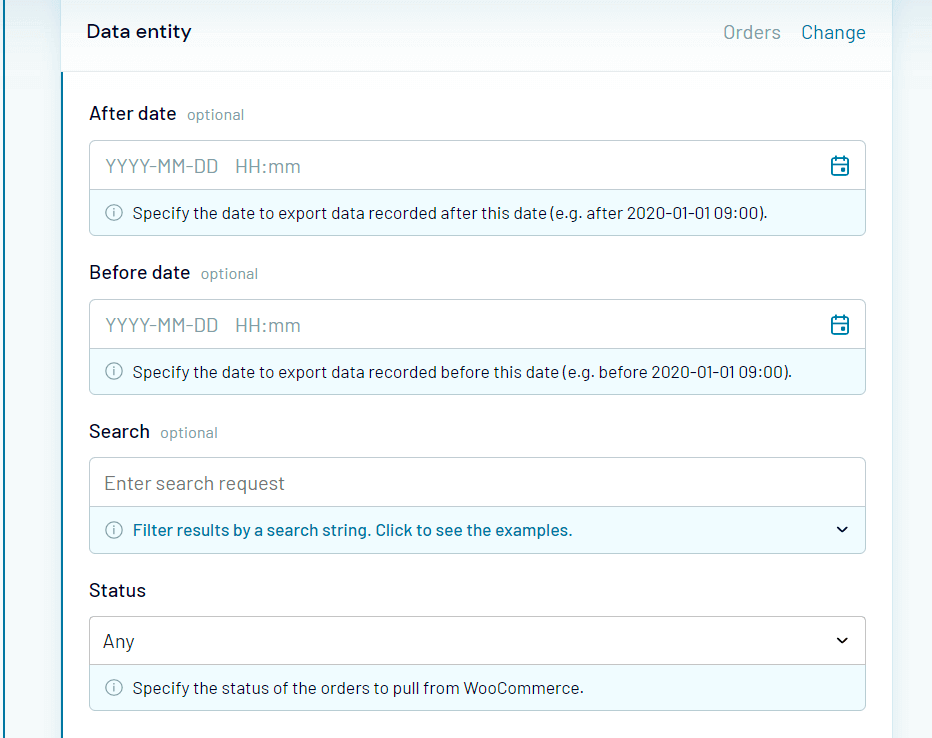
Note: We only exported Orders data for our dashboard, but you can also benefit from other data entities including Products, Customers, etc.
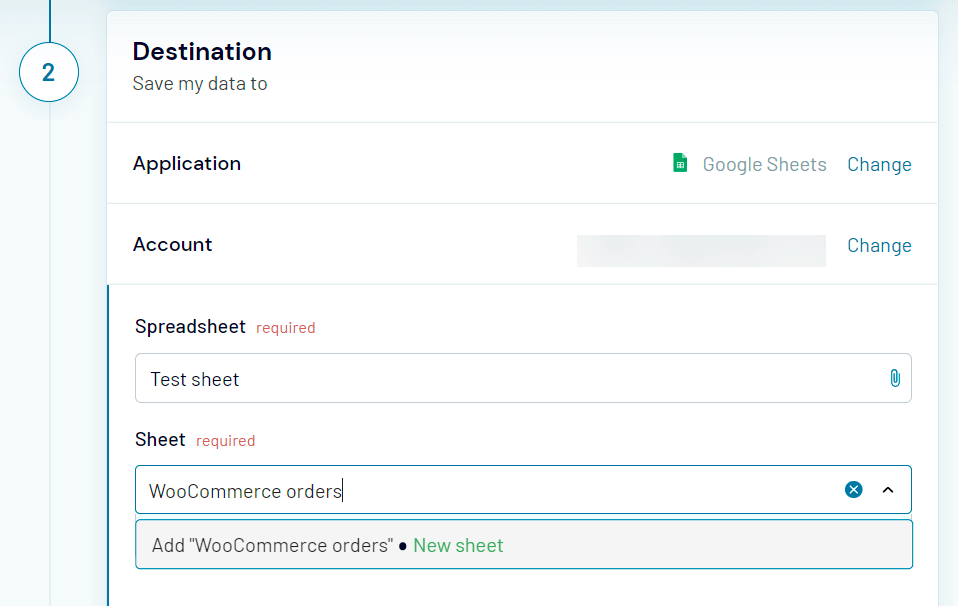
Configure destination
- Connect your Google account
- Select a Google Sheets document on your Google Drive and specify a sheet to load data to. You can create a new sheet by typing a new name.
Configure schedule
This step is needed to automate the data export from WooCommerce to Google Sheets so that our analytics dashboard can be self-updating. Enable the Automatic data refresh and set up a frequency. Exports can be set at an interval ranging from once a month to once every 15 minutes, depending on what you prefer.
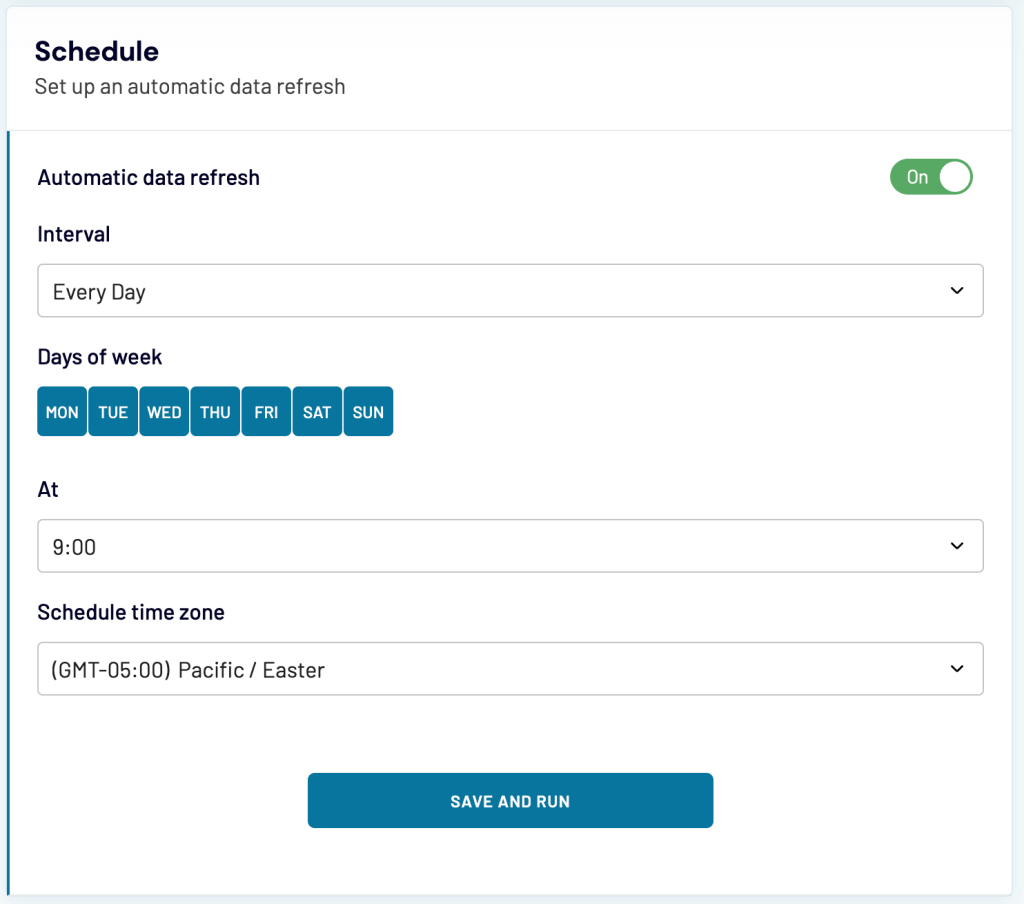
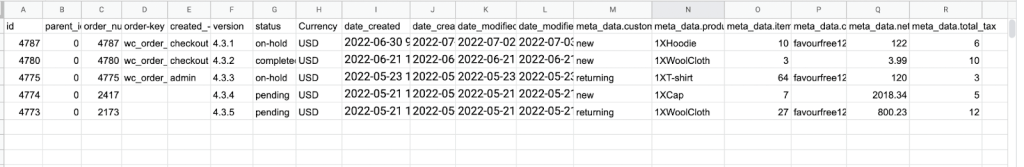
In the end, click Save and Run to make it work. There you go! Here’s an example of WooCommerce data exported to a spreadsheet:
Building the WooCommerce order analytics dashboard
After you’ve imported your data into Google Sheets, you’ll be able to do the needed analysis and manipulate your data the way you want. At this stage, you are at liberty to let your creative juices flow as you organize your metrics to display the data on your dashboard.
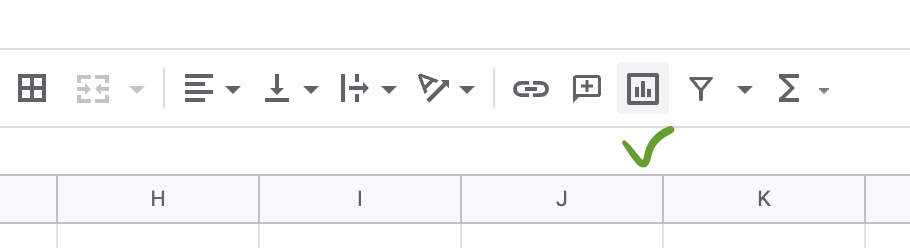
In our example, we want to visualize how the orders are split by country/region. To do this, we will use the Chart editor in Google Sheets.
- Select the chart icon on the control panel.
- On the opened Chart editor, select Setup, then scroll down and choose a chart. We’ll go with a pie chart, but it can also be a donut or regular pie chart.
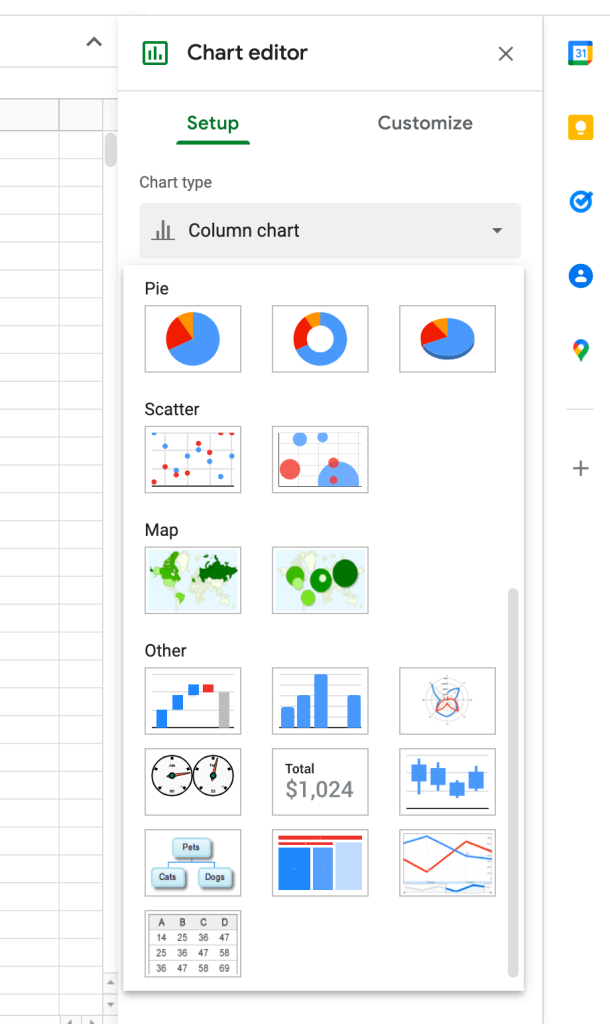
- Next, select the data range icon in front of the Data range field and add the range of data you want to display in your chart.
- Press Enter and view your chart.
Below is a pie chart that shows the country with the highest number of orders.
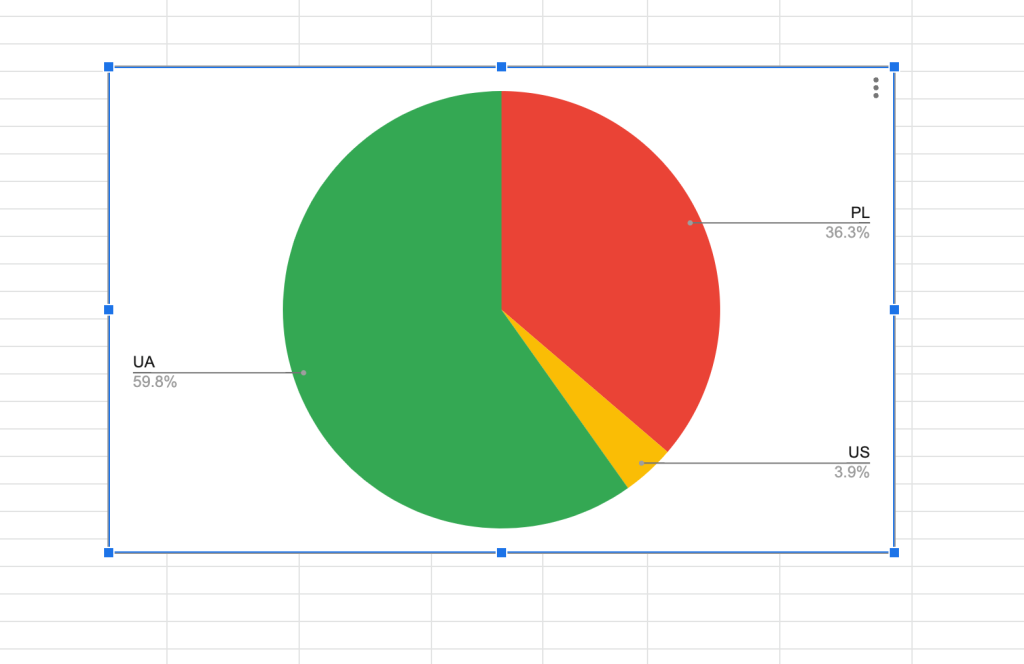
From the chart, you can see that most orders come from Ukraine with a percentage of 59.8%. The chart above shows you right away where most of your orders are coming from.
Another example here is a bar chart that shows the payment method used by customers when placing an order.
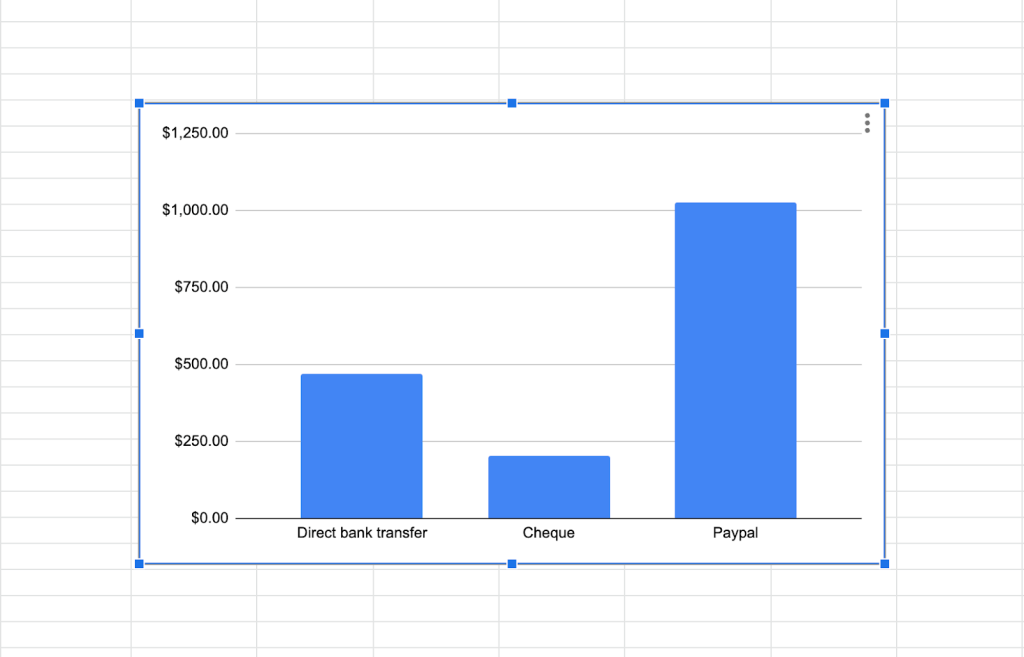
From our chart, it’s clear that the most popular payment method used by people when placing orders is Paypal.
As you can see, this is only an illustration; the underlying capability of Google Sheets allows you to do much more than what you see here. When running analytics for WooCommerce, your data may be manipulated in many ways. You can check for the date with the highest order, the product with the highest order, the status of your order, etc. You may also use other types of charts, such as scatter charts, tables, charts with a lot of possible combinations, treemaps, and timelines, in your dashboard.
You can even add information from other sources to the same spreadsheet. For example, you can fetch your sales data from Salesforce and accounting details from QuickBooks or Xero. Then, you can blend that data with your WooCommerce exports and build a dashboard encompassing various aspects of your business.
In addition, you can easily give other people access to this dashboard to collaborate and make informed decisions.
How to build a dashboard for your WooCommerce customer analytics
Just like we’ve seen in the section above, you can use Coupler.io WooCommerce integration to create your own tailored customer dashboard to show customer details the way you want them. The only difference is that when selecting the data entity to export, you’ll need to select Customer.
Note: You are not limited to using Google Sheets as a destination to create your analytics dashboard; you can also use BigQuery or Excel.
What to do if native WooCommerce analytics is not working?
If your WooCommerce analytics is not working, the first thing you’ll need to do is clear the cache by heading to WooCommerce > Status > Tools > Clear analytics cache > Click Clear. Once you have done that, attempt to run it again.
If the problem persists, then go to WooCommerce > Status > Scheduled Actions to see if any stalled processes are stopping the new data from being imported.
If this does not resolve the issue, or if you are unable to access the dashboard at all, the issue may be caused by conflicts between your theme and your plugins. In this particular scenario, you will need to deactivate all of the plugins and then carry out the activity that resulted in the issue again.
If the problem has been fixed after you have finished the conflict test, the root cause of the issue may have been a plugin or a theme that you disabled in order to test for compatibility issues. Turning off all of your plugins one at a time and then turning them back on one at a time can help you figure out which one of them is causing the issue. You should continue doing this until you locate the plugin that is causing the issue.
WooCommerce Analytics – which option is the best one to use?
To be fair, WooCommerce analytics do provide you with some helpful insights, but they do have some limitations. Because of this, shop owners may have a hard time analyzing their first-party data. Most of them choose to export their raw data in order to create useful reports and dashboards, and this trend is likely to keep going.
This article’s goal has been to show you that WooCommerce analytics are not in any way exclusive to WooCommerce. You can improve your reports, add data from other sources, and do a lot more with your analytics. Ultimately, the solution that will work best for you will depend on what you want to accomplish. We are certain that you will decide on one that is most suitable to your needs and requirements. Good luck with your data!
