Native Facebook Ads analytics is limited, so experienced marketers tend to load Facebook data to BI tools to have top-level reporting. Power BI is one of these, and it is definitely a good choice for data visualization and building superb reports that you can customize and share easily. Let’s explore three methods to connect Facebook Ads to Power BI.
How you can connect Facebook Ads to Power BI
So, how do you get data from Facebook Ads? The simplest way is to manually export information in CSV and then upload the file to Power BI. But you’re not likely to do this, are you? The connection between Facebook Ads and Power BI can be done in one of the following ways:
- No-code connector by Coupler.io
Coupler.io, a data integration platform, offers a cloud Facebook Ads connector, so you won’t need to download or install anything. The Facebook Ads to Power BI connection is carried out in your web browser in less than 2 minutes.
- ODBC connector by CData
For this option, you need to download an ODBC driver, install it, and configure the data source connection. It takes more than 5 minutes to connect Facebook Ads to Power BI, and it may require some technical expertise.
- Custom connection via Facebook Ads API and an SQL database
This method is for tech-savvy users, mostly data engineers or analysts. You need to write a script to retrieve data from Facebook Ads via the API and load it to an SQL database. Then, you can get the data from this database to Power BI using the native connector.
You now have a general understanding of each method, but seeing them in action is better. Let’s do this.
How to connect Facebook Ads to Power BI using the web integration by Coupler.io
Step 1. Extract data from Facebook Ads
To connect Facebook Ads to Power BI with Coupler.io, click Proceed in the form below. You’ll be prompted to create a Coupler.io account for free.
After that, proceed to the connection setup.
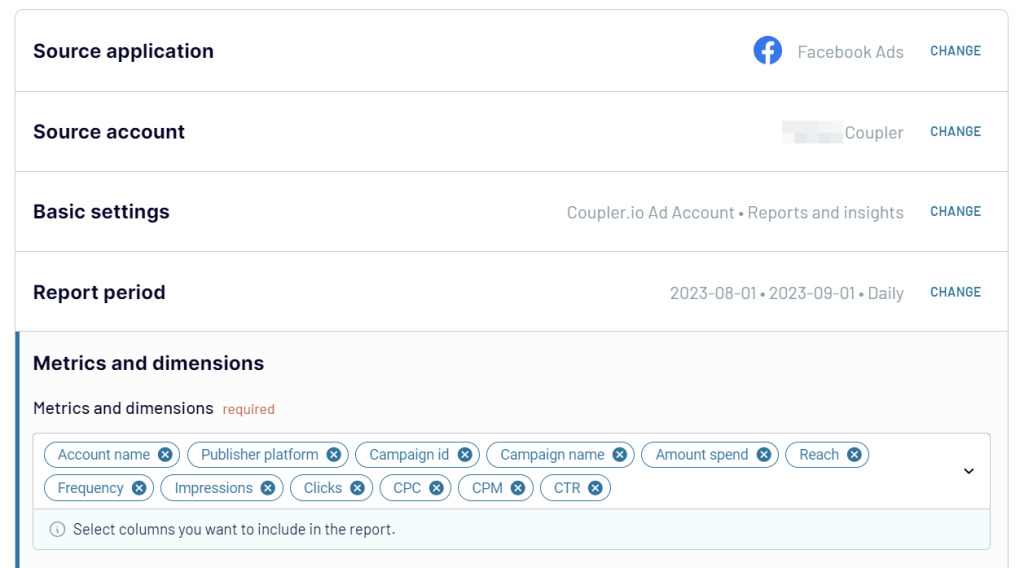
Connect the Facebook account with access to your Ads Manager. Then select the type of report to export. You can get a list of ads, ad sets, and campaigns, as well as the Reports and Insights data entity. The latter allows you to load information about the performance of your campaigns. When you choose it, you can specify the reporting period and metrics+dimensions such as conversions, CPC, and others to include in the report.
Before you proceed to the next step, you can add one more source to connect. This can be another Facebook Ads account or even another application. In this article, we have demonstrated an example of what it may look like. Now, let’s preview and transform your Facebook Ads data.
Step 2. Transform data
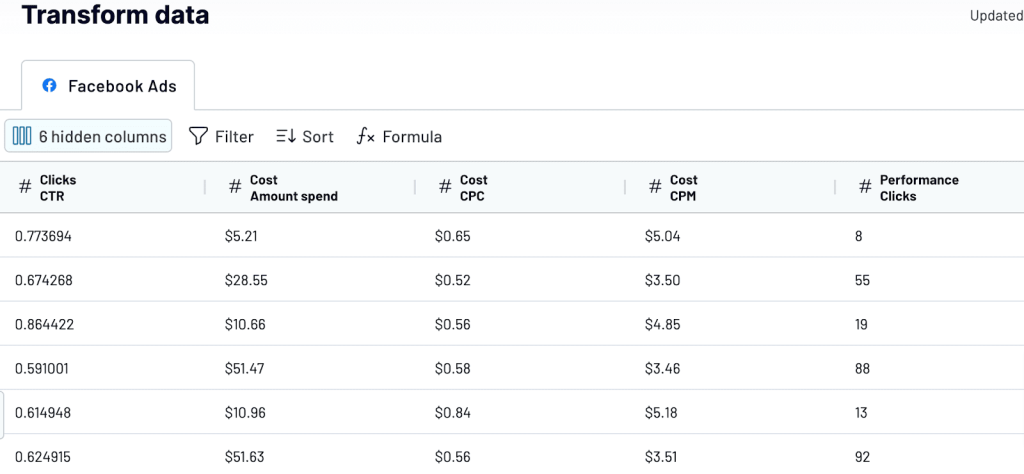
During this step, Coupler.io fetches data from Facebook Ads for you to preview. In addition, you can make some on-the-go transformations:
- Hide/unhide columns
- Sort and filter data
- Add new columns using the supported formulas
Step 3. Load data to Power BI and schedule refresh
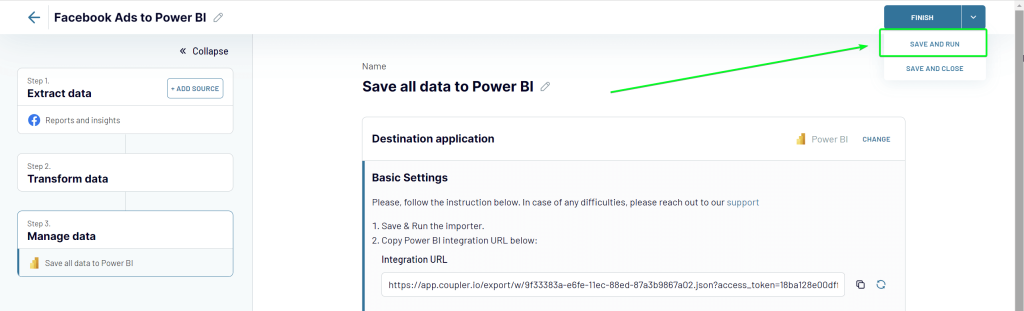
Now, the part where you actually load data from Facebook Ads to Power BI. Save and run the importer using the button in the top right corner.
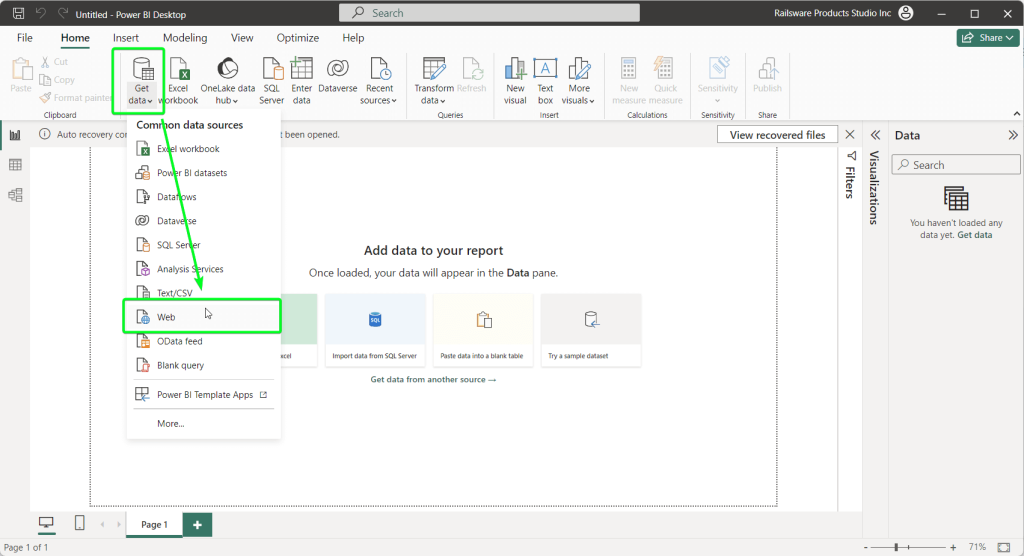
Then copy the Power BI integration URL and go to Power BI. You’ll need to select Get data => Web and insert the URL into the respective field.
After you click OK, your Facebook Ads data will be loaded to the Power Query Editor, where you can transform it if needed.
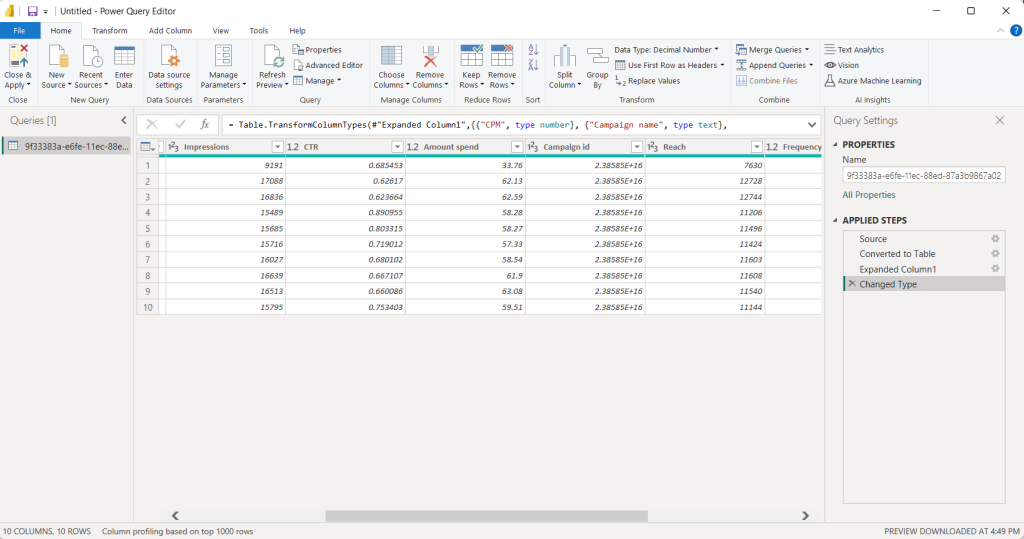
From this step, you can create your Power BI report based on the Facebook Ads data… but hold on! We forgot to enable the automatic data refresh so your report could be self-updating.
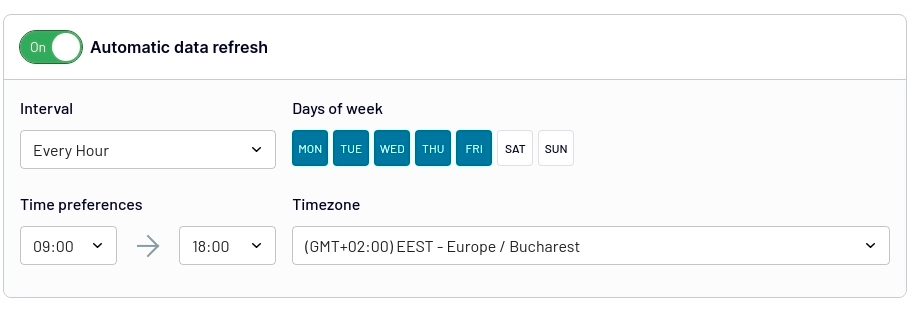
For this, go back to Coupler.io, toggle on the Automatic data refresh, and configure the schedule you like. With Coupler.io, you can have your Facebook Ads data refreshed as frequently as every 15 minutes!
All in all, we spent around 2 minutes to connect Facebook Ads to Power BI with Coupler.io. The Power BI connector is very intuitive, and each step is supported with a wizard, so you won’t get lost.
By the way, in addition to Power BI, Coupler.io allows you to load data to Looker Studio, Google BigQuery, Google Sheets, and Microsoft Excel. And that’s not all. You can also benefit from ready-to-use dashboard templates to kick off your reporting with ease.
Pros and cons of connecting Facebook Ads to Power BI using Coupler.io
| Pros | Cons |
|---|---|
| – Fast and intuitive setup – Automatic data refresh on a custom schedule – Support for other data sources, including advertising apps – Ready-to-use dashboard templates | The refresh interval is limited to every 15 minutes on the most expensive subscription plan. See pricing details |
Dashboard templates for unified Facebook Ads reporting in Power BI
Using Coupler.io not only means automating data flow from Facebook Ads to Power BI. This reporting automation platform also offers many ready-to-go dashboard templates. They can save you hours of setup time and provide proven reporting frameworks. Whether you’re running Facebook Ads exclusively or as part of a multi-platform strategy, these ready-to-use dashboards offer comprehensive analytics solutions.
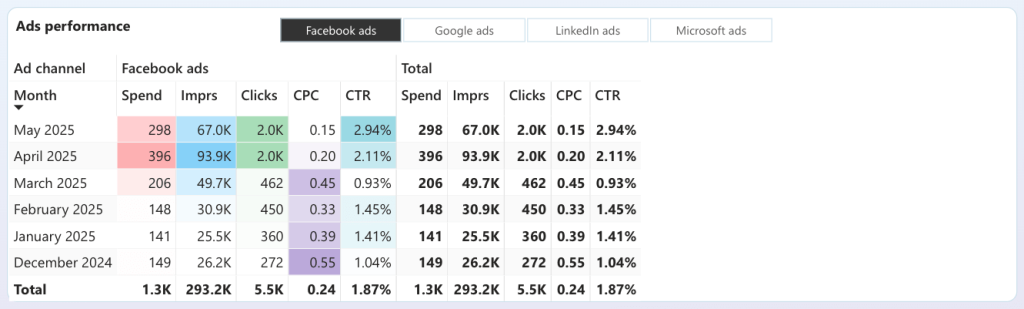
Facebook Ads dashboard
The Facebook Ads dashboard offers focused reporting specifically for Facebook advertising campaigns. This template is ideal for marketers who primarily use Facebook Ads or want detailed insights into their Facebook advertising performance.
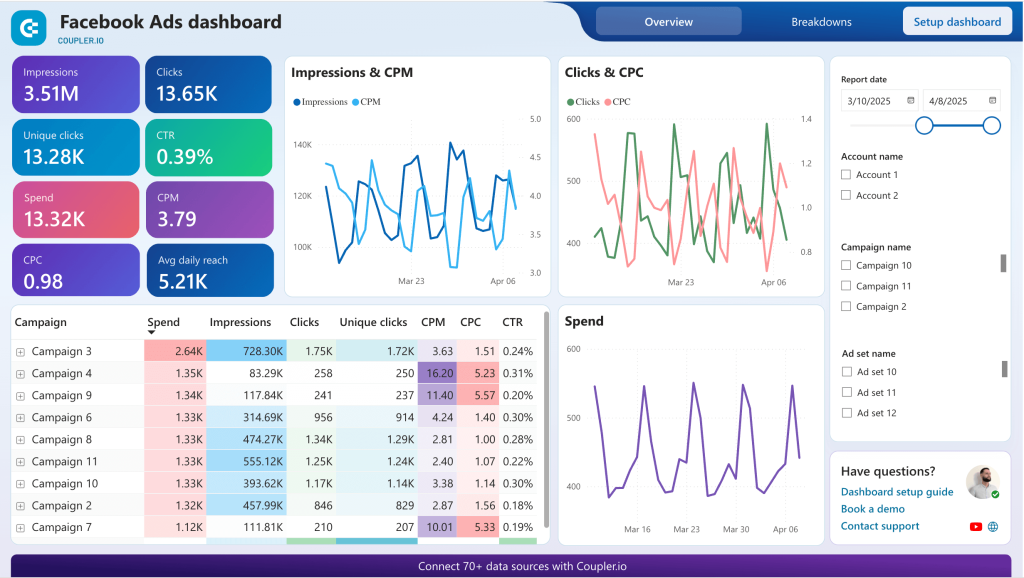
Key features:
- Campaign performance overview: Monitor essential metrics like impressions, clicks, CTR, CPC, and conversions
- Ad spend breakdown: Track spending dynamics over time with detailed cost analysis
- Audience insights: Analyze performance across different demographics and audience segments
- Creative performance: Compare the effectiveness of different ad creatives and formats
What you can monitor:
- Essential Facebook metrics: Track reach, impressions, clicks, cost-per-click, and conversion rates
- Campaign optimization: Identify top-performing ads and audiences for budget reallocation
- Spending efficiency: Monitor cost per acquisition and return on ad spend
- Performance trends: Spot seasonal patterns and optimization opportunities
This dashboard is perfect for Facebook-focused campaigns and provides deep insights into platform-specific performance metrics. To start using the Facebook Ads dashboard template, follow the instructions on the Setup dashboard tab to connect your Facebook Ads account and load data to your Power BI report.
Multi-channel PPC dashboard
For marketers running Facebook Ads alongside other advertising platforms, the multi-channel PPC dashboard provides a unified view of all your paid advertising efforts. This dashboard is specifically designed to solve the challenge of switching between Facebook Ads Manager, Google Ads, LinkedIn Ads, and other platforms to gather performance data.
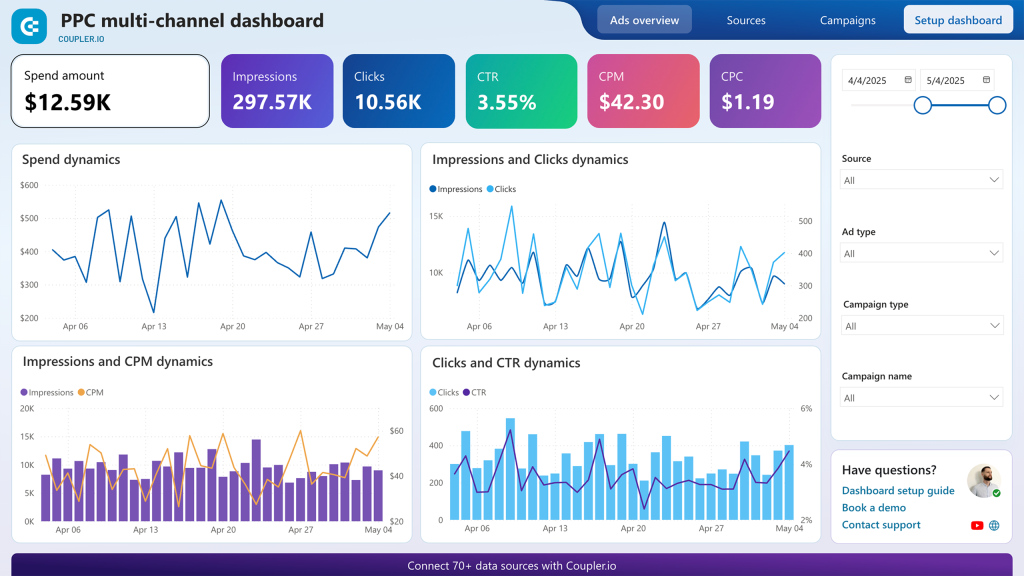
Key features:
- Unified platform integration: Connects Facebook Ads with Google Ads, LinkedIn Ads, Twitter Ads, TikTok Ads, Quora Ads, and Bing Ads in one interface
- Cross-platform comparison: Compare Facebook’s CTR, CPC, and conversion rates directly against other advertising channels
- Consolidated spend tracking: Monitor your advertising budget allocation across all platforms with unified reporting
- Real-time performance metrics: Track impressions, clicks, conversions, and ROI across all channels simultaneously
What you can monitor:
- Platform performance comparison: See how Facebook’s average CPC compares to Google Ads, LinkedIn Ads, and other channels
- Budget optimization insights: Identify which platforms deliver the best ROI for your marketing spend
- Campaign effectiveness: Compare conversion rates and customer acquisition costs between Facebook and other advertising channels
- Spend dynamics: Track daily spending patterns across all platforms with automatic data refreshes
This dashboard eliminates the need to manually export data from multiple advertising platforms and provides the foundation for data-driven budget allocation decisions.
All-in-one marketing dashboard
Managing your diverse marketing channels can be overwhelming, but understanding their combined impact is crucial for success. The All-in-one marketing overview dashboard (Power BI) transforms fragmented data into a cohesive, insightful view of your entire marketing performance. This powerful tool empowers marketers and business leaders alike to identify trends and make strategic decisions that drive real growth.
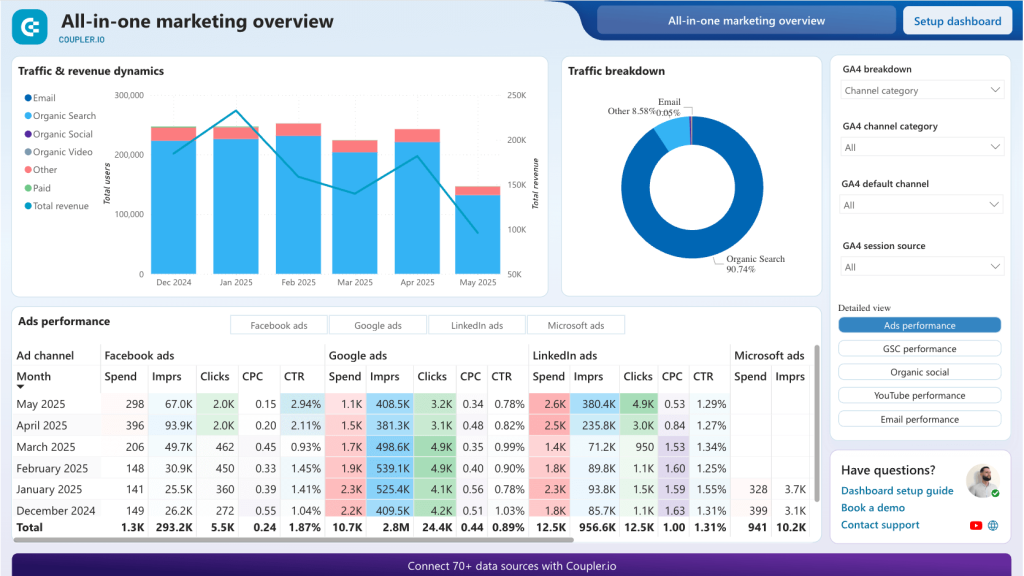
With the dashboard, you get exceptional capabilities for optimizing your Facebook Ads strategy. The consolidated (monthly), visual overview of essential Facebook Ads metrics reveals paid ads KPIs, such as spending, impressions, clicks, Cost-Per-Click (CPC), and Click-Through-Rate (CTR). All to effectively monitor your ad budget over time, see trends, and gain valuable insights on user engagement and cost efficiency of your paid ad efforts.
Key features:
- Multi-channel marketing overview: Consolidate data from Facebook Ads, email marketing, organic social, and other channels
- Customer journey tracking: Follow prospects from initial Facebook ad impression through conversion
- ROI analysis: Compare the effectiveness of Facebook Ads against other marketing investments
- Performance attribution: Understand how Facebook Ads contribute to overall marketing goals
What you can monitor:
- Marketing channel comparison: See how Facebook Ads perform relative to other marketing efforts
- Customer acquisition analysis: Track the full customer journey from Facebook ad click to purchase
- Budget allocation guidance: Optimize spend across all marketing channels based on performance data
- Integrated campaign insights: Understand how Facebook Ads support broader marketing objectives
Ready to gain these powerful insights and take control of your Facebook Ads and your entire marketing ecosystem? Click the button below to open the dashboard in Power BI. Next, use the Setup dashboard button to see easy configuration guidelines and start doing your marketing the data way.
Google Analytics PPC dashboard
The Google Analytics PPC dashboard integrates data from multiple advertising platforms (Facebook Ads, Google Ads, LinkedIn Ads, etc.) with data from GA4. This gives you a complete picture of how each channel contributes to your PPC and overall marketing goals.
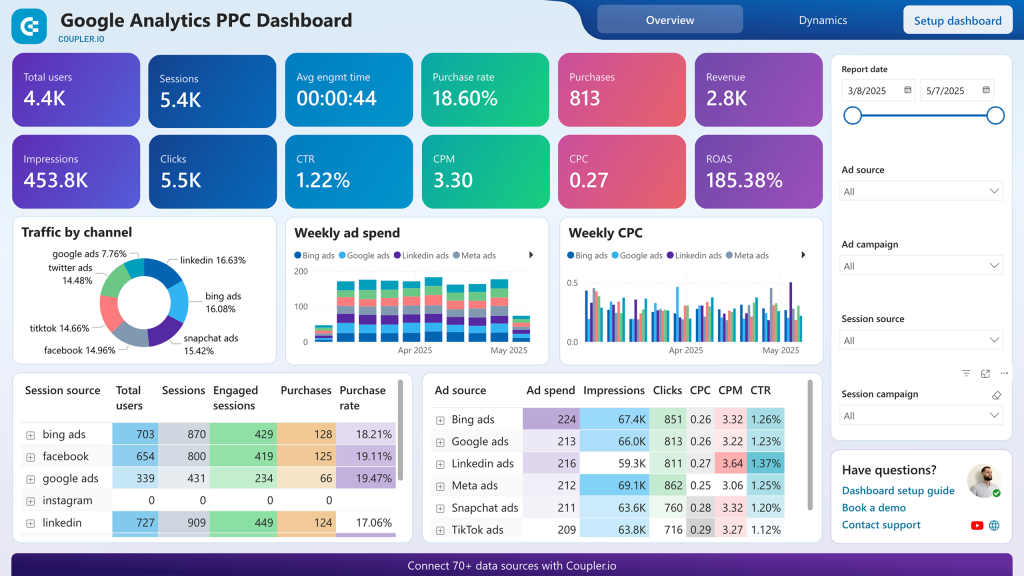
The report provides visibility into the customer journey, i.e., what happens after users click your ads and visit your website. You can track combined PPC KPIs, such as impressions, clicks, CTR, and CPC, alongside business metrics like purchase rate, revenue, and ROAS.
Key features:
- Web analytics integration: Connect Facebook Ads data with GA4 for comprehensive user journey analysis
- Cross-platform advertising insights: Compare Facebook Ads performance with Google Ads, LinkedIn Ads, and other platforms
- Conversion tracking: Monitor the complete customer journey from Facebook ad click to website conversion
- Revenue attribution: Track how Facebook Ads contribute to actual sales and revenue
What you can monitor:
- Post-click behavior: Understand what happens after users click your Facebook ads
- Conversion funnel analysis: Track the path from Facebook ad impression to purchase
- Customer lifetime value: Analyze the long-term value of customers acquired through Facebook Ads
- Cross-channel attribution: See how Facebook Ads work together with other marketing channels
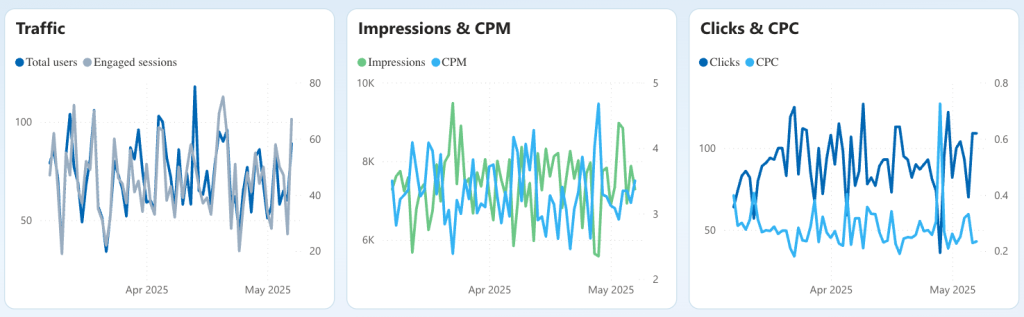
Use the charts to identify the platforms that bring the most visitors to your site and offer the best return on investment. Additionally, you can filter by session source to understand which ad platforms generate the most purchases for your business. In the Dynamics tab, line charts provide insight into campaign trends, allowing you to spot correlations between clicks and CPC or revenue and purchases.
All these dashboard templates are available for free and can be set up in minutes. The setup process is straightforward, and your dashboards will automatically update with fresh data from all connected platforms. You’ll get insights into your Facebook advertising performance and its relationship to your broader marketing efforts.

Explore other PPC report templates by Coupler.io
Get started for freeConnect Facebook Ads to Power BI using the desktop connector
If the web connector is not what you’ve been looking for, check out this option that relies on an ODBC driver.
ODBC (Open Database Connectivity) is a standard API for accessing database management systems. You can use ODBC drivers to load raw data to Power BI from various sources, including Facebook Ads. To do this, you need to download and install a respective ODBC driver. For this example, we’ve chosen the Facebook Ads Power BI Connector by CData. Here is what it looks like when installed on Windows OS.
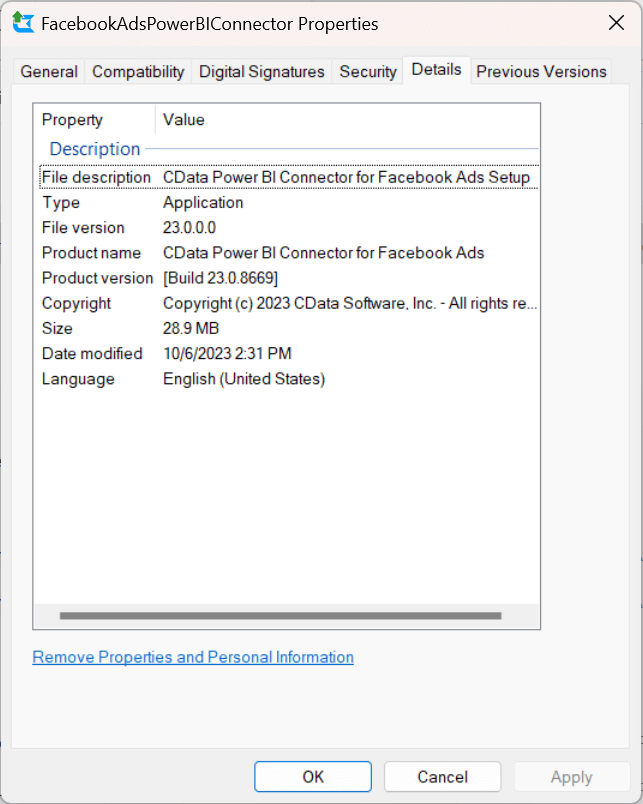
Note: During the installation, I was asked to copy the file
CData.FacebookAds.pqxfromC:\Program Files\CData\CData Power BI Connector for Facebook AdstoC:\Users\[my-name]\Documents\Power BI Desktop\Custom Connectors. The issue was that this folder did not exist, so I had to create it and copy the file. Without doing this, your Facebook Ads connector won’t be available in the list of Power BI connectors.
- Once you have installed the connector, you need to configure the DSN (data source name).
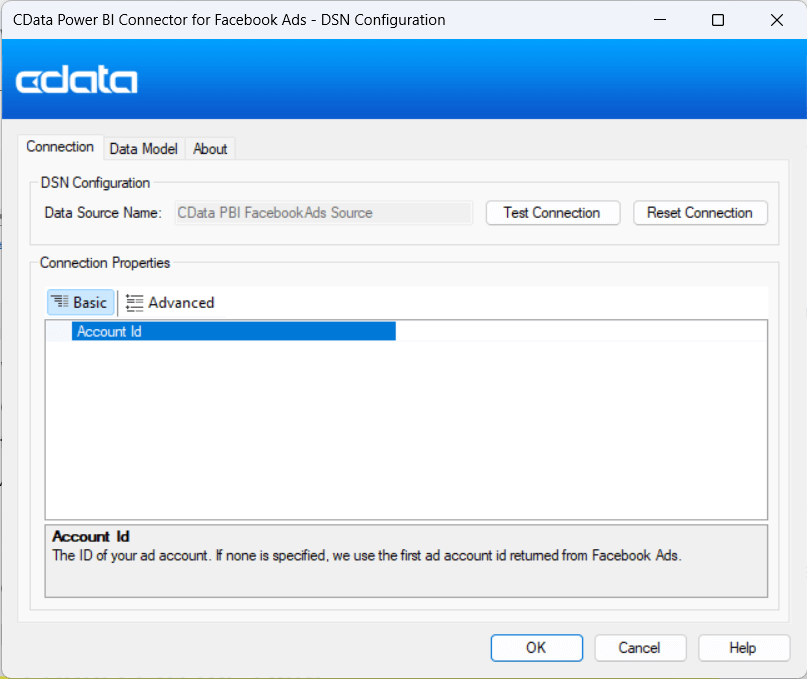
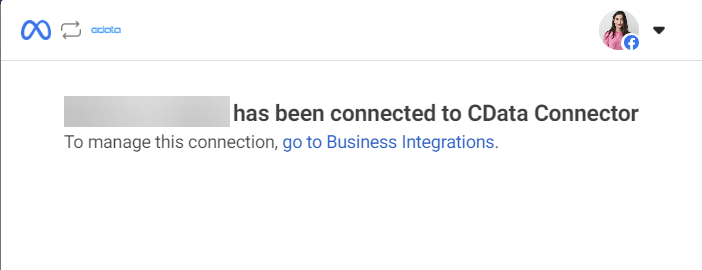
- You’ll be redirected to the web browser to connect the CData connector to your Facebook Ads page.
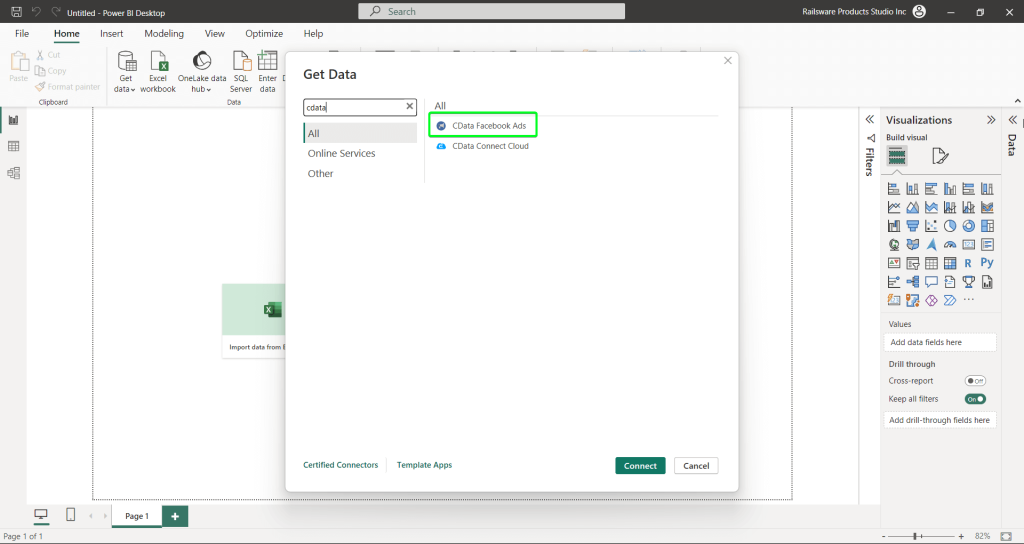
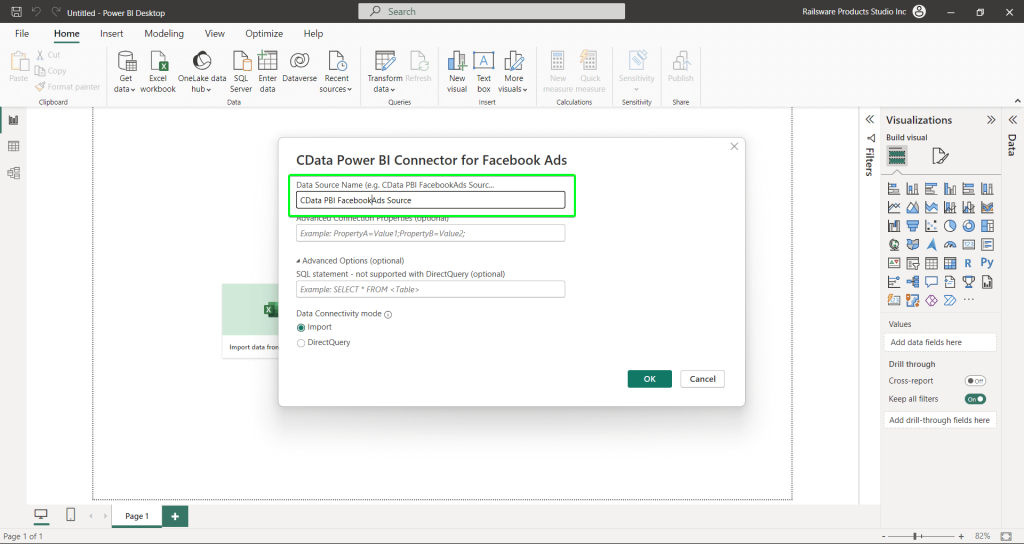
After the successful connection, you can navigate to Power BI => Get data => More… => CData Facebook Ads. Your connector is available on the list of Power BI connectors.
Then, enter the data source name, the one that was used when configuring the connection to Facebook Ads.
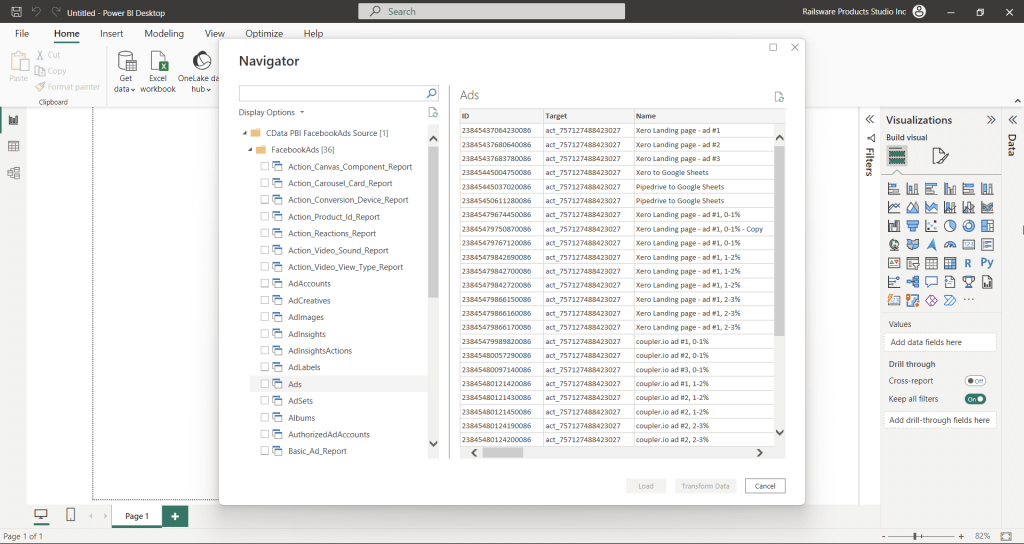
- In the next window, you’ll see a navigator with Facebook Ads tables. Choose the ones you want to load to Power BI and proceed: you can transform data or load to Power BI without transformations. It’s up to you.
That’s it! The ODBC connected by CData did its job, but it took more than 5 minutes for download, installation, configuration, and data loading.
Pros and cons of connecting Facebook Ads to Power BI using ODBC driver
| Pros | Cons |
|---|---|
| – The connector is selectable in Power BI – Selection of Facebook Ads data in Power BI navigator | – Not free – Requires installation |
Custom connection via Facebook Ads API
The third option we are going to explore is custom integration. You can write code in Python or another programming language to connect Facebook Ads to Power BI via the API. We won’t focus on this method in detail since it requires a separate guide. However, below you will find the key steps essential to creating this custom integration:
- Create a Facebook Business App to generate an access token for Facebook Ads API. We’ve covered this step in our Facebook Ads API tutorial.
- Create a code script to:
- Retrieve the data from Facebook Ads API. You need to determine what data you want to retrieve from the API. If you opt for Python to make a script, you can install facebook-sdk and import the important libraries — urllib3, facebook, and requests.
- Load the data from Facebook Ads to an SQL database.
To execute the code, you need to use a cloud tool such as Google Cloud, ASW, or anything else.
- Load data from an SQL database to Power BI using one of the built-in connectors.
Pros and cons of connecting Facebook Ads to Power BI via the API
| Pros | Cons |
|---|---|
| – Customized connection – Facebook Ads data backup in an SQL database | Requires technical expertise to understand how the API works and how to write a code script |
Which option to get Facebook Ads to Power BI will work best for you?
As a marketer, you are unlikely to consider the API connection since it requires deep technical expertise to set up. On the other hand, if your project has a data analyst or data engineer who can manage the setup, then this will probably be your choice.
If you are limited in resources, then the first two methods, Coupler.io and ODBC driver, will make the difference in connecting Facebook Ads to Power BI. The former is web-based, meaning you won’t have to download and install any software on your computer. Besides, it allows you to scale your reporting needs. For example, you can also load your Facebook Ads to Redshift, HubSpot, Salesforce, and Shopify or connect your Facebook Ads to Tableau, not to mention many advertising platforms. Make a wise choice and good luck!
Automate data export from Facebook Ads to Power BI with Coupler.io
Get started for free