Why are companies moving to AI reporting?
Every business or startup founder knows the headache of manual reporting: hours spent building dashboards, waiting days or even weeks for insights, and decisions made reactively rather than proactively. According to a study by Middleware, engineers and technical project managers spend an average of 6 hours per week just managing spreadsheets and manual reports.
Consider the real-world impact at digital agency SellThru. Before using Coupler.io, they spent an hour every day manually mapping data across ad platforms and setting up client dashboards. By automating these workflows, they reclaimed 20+ hours per month, while also achieving 95%+ tracking reliability, all without sacrificing accuracy.
The competitive reality is harsh: Companies still relying on manual reporting are making strategic decisions with week-old data while their AI-enabled competitors are optimizing in real-time. According to McKinsey, 67% of business leaders using AI-driven analytics report significantly faster decision-making processes, translating directly into competitive advantage and sustained growth. The global impact? AI-powered reporting tools are projected to deliver up to $4.4 trillion in productivity gains worldwide.
Companies aren’t just moving toward AI reporting because it’s innovative. They’re adopting it because the cost of not adopting it – lost opportunities, delayed insights, and competitive disadvantage – far exceeds the investment required to implement it.
What is AI reporting?
AI reporting is the next evolution in how businesses handle data. It moves beyond dashboards and spreadsheets to systems that think, learn, and respond. At its core, AI reporting uses cutting-edge AI technologies like machine learning, natural language processing, and predictive analytics to turn raw data into real-time, decision-ready insights.
These core technologies are what set AI reporting apart from traditional or even automated tools.
Machine learning algorithms continuously analyze patterns across large datasets to identify trends, forecast outcomes with increasing accuracy. Unlike static reports that show what happened, ML models predict what’s likely to happen next and suggest optimal actions..
Natural Language Processing (NLP) allows users to interact with data conversationally. Instead of learning SQL or navigating complex dashboards, teams can ask questions like “Which campaign had the highest ROAS last quarter?” or “Show me customers at risk of churning,” and receive clear, contextual answers. No SQL or technical expertise is required.
Meanwhile, predictive analytics goes beyond historical reporting to anticipate future results based on pattern recognition. This means sales teams can identify slowing pipeline velocity before deals stall, marketers can spot campaign fatigue before budgets are wasted, and finance teams can forecast cash flow with unprecedented accuracy.
To understand where AI for reporting fits in, tale look at how reporting has evolved. It started with manual processes like exporting CSVs, updating spreadsheets, and chasing down numbers across tools. Then came automation, which brought efficiency through scheduled reports and data connectors, but still relied on traditional business intelligence tools with static dashboards and predefined KPIs. Now, with AI-powered reporting, we’re seeing a shift toward systems that are not only faster but also smarter. These tools can surface hidden insights, proactively alert users to changes, and guide decision-making in real time.
The evolution of reporting: manual => automated => AI-powered
| MANUAL ERA (2000-2010) | AUTOMATION ERA (2010-2020) | AI-POWERED ERA (2020-Present) |
| – CSV exports and spreadsheet updates – Hours of copy-pasting data – High error rates, delayed insights – Analyst-dependent workflows | – Scheduled reports and data connectors – Static dashboards with predefined KPIs – Reduced manual work but limited flexibility – Still reactive, not predictive | – Conversational data interaction – Predictive and prescriptive insights – Self-improving accuracy – Proactive alerts and recommendations |
The business impact is transformative. Where traditional reporting tells you what happened after the fact, AI reporting helps you understand what’s happening now and guides what you should do next. It’s the difference between driving while looking in the rearview mirror versus having a GPS that warns you about traffic ahead and suggests the fastest alternate route.
Why it’s not just “fancy automation”: Automation executes predefined tasks efficiently. AI adapts and learns. When your conversion rates drop, automation will dutifully report the decline. AI will identify the root cause, predict the impact on monthly targets, and recommend specific actions to recover performance. That’s the fundamental difference – automation runs the playbook, AI rewrites it.
AI reporting vs traditional reporting
To better understand the difference between these two, let’s take a look at a simple scenario.
Imagine two e-commerce companies experiencing the same critical business crisis.
Company A relies on traditional reporting. Their revenue suddenly drops 15% week-over-week – a devastating decline for any growing business. The marketing manager notices the drop in their Monday morning dashboard review and immediately starts investigating. She spends the next two days manually pulling data from Shopify analytics, Google Analytics, Facebook Ads Manager, and their email marketing platform.
Each data export requires careful formatting, cross-referencing timestamps, and checking for inconsistencies. The analyst builds pivot tables, creates correlation charts, and runs multiple hypothesis tests. Finally, after 48 hours of detective work, they discover the culprit: a checkout page bug introduced during last week’s website update that’s causing 35% of mobile users to abandon their purchases.
By the time they identify and fix the issue, $47,000 in sales have been lost, and dozens of frustrated customers have likely switched to competitors. The damage extends beyond immediate revenue – customer trust is shaken, and recovery will take weeks.
Company B uses AI in reporting through Coupler.io MCP. The same 15% revenue drop triggers an automatic alert within 2 hours of the trend becoming statistically significant. The system immediately begins cross-platform analysis, correlating the timing with recent website changes, user behavior patterns, and conversion funnel data.
When the marketing manager asks, “What’s causing our revenue drop?” the AI instantly responds: “Revenue decline correlates 94% with mobile checkout abandonment spike starting July 18th, 2:30 PM – coinciding with website deployment. Mobile users experiencing 23-second load delay at payment step. Recommend immediate rollback of checkout module update.”
The technical team implements the fix within 4 hours of the initial alert. Result: $42,300 in potential sales recovered, customer experience preserved, and competitive advantage maintained through rapid response.
The impact difference: $47,000 lost versus $4,700 lost. Recovery time: 48 hours versus 4 hours. Customer trust: damaged versus preserved.
This is the difference in speed, clarity, and impact.
Traditional reporting delivers a post-mortem while AI for reporting delivers a diagnosis and a treatment, before the problem escalates. With traditional tools, you’re reacting. With AI, you’re responding in real time.
Accuracy is another gap. In the traditional setup, reports are vulnerable to broken formulas, missed rows, and misaligned filters. A small error can throw off the entire forecast. AI systems, by contrast, apply the same logic every time, detect anomalies automatically, and even warn you when something doesn’t look right, without needing to be told.
And let’s talk accessibility. Traditional reporting is still largely the domain of analysts and spreadsheet pros. Business leaders often wait for reports or struggle to interpret dashboards. AI reporting levels the playing field: anyone on the team can ask questions in natural language and get clear, visual answers.
In short, traditional reporting tells you what happened after the fact. AI for reporting and analytics helps you understand what’s happening now and what you should do next.
| Criteria | Traditional reporting | AI reporting |
|---|---|---|
| Data collection | Manual exports, copy-pasting, error-prone pipelines | Automated, continuous sync from multiple data sources |
| Time & Cost efficiency | Hours or days to prepare reports; requires analyst involvement | Instant insights; significant time and labor cost reduction |
| Report creation | Static dashboards, limited flexibility, requires technical skills | Conversational queries, dynamic reports, accessible to all teams |
| Accuracy | High risk of human error, outdated formulas | Consistent logic, anomaly detection, and self-improving models |
| Real-time updates | Delayed snapshots; periodic refreshes | Live data streams, real-time alerts and updates |
| Scalability | Time-consuming to replicate or customize reports | Easily scales across teams, departments, and use cases |
| Insight delivery | Descriptive (what happened) | Predictive and prescriptive (what’s likely to happen + suggestions) |
| User experience | Analyst-dependent, limited access for non-technical users | Natural language queries, intuitive interface |
AI for reporting and analytics: How does it impact your business?
For most companies, reporting isn’t just about tracking metrics; it’s about making sense of performance fast enough to act on it. But that’s hard to do when reporting depends on spreadsheets, manual exports, and delayed dashboards.
This is where AI transforms everything:
1. Automated report generation
In traditional workflows, teams spend hours every week compiling reports. AI eliminates that. Using an AI report generator, reports are automatically created based on pre-configured templates, always up to date, and ready to share. More importantly, AI can tailor these reports to exactly what your team needs, whether it’s a weekly marketing recap, a pipeline health overview, or a churn risk alert. These AI-generated reports don’t just summarize; they highlight trends and recommend actions in real time.
2. Real-time data sync and monitoring
With AI integrated into live data flows, you’re no longer looking at outdated snapshots. Advanced data processing allows AI tools to monitor performance continuously and surface insight. If something starts trending in the wrong direction, like a sudden drop in revenue or spike in support tickets, you get notified instantly, and you can ask follow-up questions without digging into a dashboard.
3. Predictive and prescriptive analytics
One of the most valuable shifts AI brings is forward-looking insight. Instead of just reporting on past performance, AI tools can forecast trends across various timeframes and suggest actions based on pattern recognition.
Here’s where the Coupler.io MCP truly stands out. By combining Claude AI with your existing Coupler.io data flows, the MCP acts like your personal AI data analyst available 24/7. You can ask complex business questions and receive instant, data-backed answers:
"Which products will likely exceed Q3 targets based on current velocity?"
"Show me customers at highest churn risk and recommended retention strategies."
"What budget adjustments will optimize our ROAS for the next 30 days?"
This is real prescriptive analytics in action: you ask strategic questions, AI handles the data analysis, delivers the insight, and even suggests what to do next.
4. Anomaly detection and error prevention
AI doesn’t need you to manually scan for outliers. It constantly looks for patterns and breaks in those patterns. If there’s an unexpected drop in website traffic, a misfire in your ad campaigns, or a data integrity issue in your CRM export, the system alerts you and often explains the root cause. Issues that previously went undetected for days or weeks are now caught within minutes.
Examples of AI-powered anomaly detection:
"Why did conversion rates drop suddenly last week?"
"List anomalies in ad performance across platforms this month."
With Coupler.io MCP, users routinely ask Claude for specific diagnoses of performance issues – and receive not just root cause analysis, but prioritized next steps, all backed by real-time data analysis.
5. Improved data quality and consistency
Juggling complex datasets across tools like CRMs, ad platforms, and financial apps is prone to error. AI reporting platforms like Coupler.io standardize and clean data automatically, ensuring reliable, consistent metrics across teams. Also, Coupler.io’s MCP can help you spot any issues in data consistency:
"Clean and consolidate campaign performance data from Google Ads and Facebook Ads into one table."
"Highlight inconsistent values in revenue reporting for Q1."
No more wondering if you’re all looking at the same numbers. AI ensures cross-department alignment from the ground up.
6. Increased speed, reduced cost
The compounding effect of faster reports, smarter insights, and fewer errors results in a major productivity gain. AI reporting software democratizes access to valuable insights, reduces analyst workload, and allows decision-makers to act immediately.
Simply ask AI:
"Summarize this week's key business insights for the leadership team in bullet points."
"Create a financial report with visualizations for revenue, expenses, and profit margins YTD."
As a reporting solution, Coupler.io MCP turns what used to be days of work into a five-minute conversation with your data.
AI reporting tools that are changing the game
In the AI reporting space, not all tools are built the same. Some focus on advanced visualizations, others on embedded analytics, and a few, like Coupler.io, prioritize natural language interaction and cross-platform flexibility. Here’s a breakdown of the top AI reporting tools in 2025, what makes each unique, and how they actually work under the hood.
1. Coupler.io MCP Server + AI Insights
How it works:
Coupler.io automates reporting by collecting, transforming, and syncing data from 70+ sources, including CRMs, ad platforms, databases, and spreadsheets. It delivers clean, unified data flows that you can direct to dashboards or AI tools. Once set up, you can either use Coupler.io’s built-in AI insights within dashboards or connect data to AI through MCP servers for marketers to have conversational analytics.
The approach:
Coupler.io offers two AI-enhanced options to act on your data:
AI Insights in dashboards: Automated summaries, trend detection, and improvement suggestions, embedded directly in your reports.
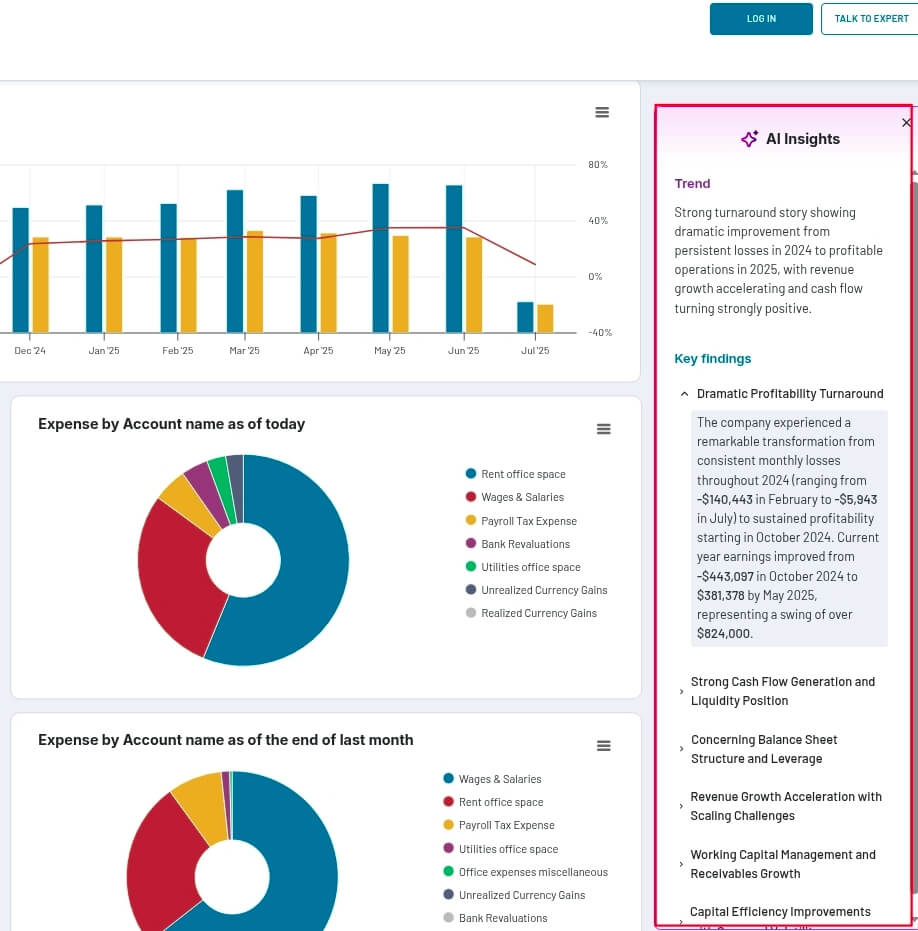
MCP server: A bridge between your Coupler.io data flows and AI models like Claude, enabling natural language conversations with your data.
Instead of logging into a dashboard, you open your Claude app, type something like “Which campaigns underperformed last quarter?” and get an answer sourced directly from your Coupler.io flows instantly.
Pricing: free 7-day trial. Prices start at $24/month
Great for: SaaS startups, growing teams, non-technical users
Standout feature: Real-time conversations with live business data
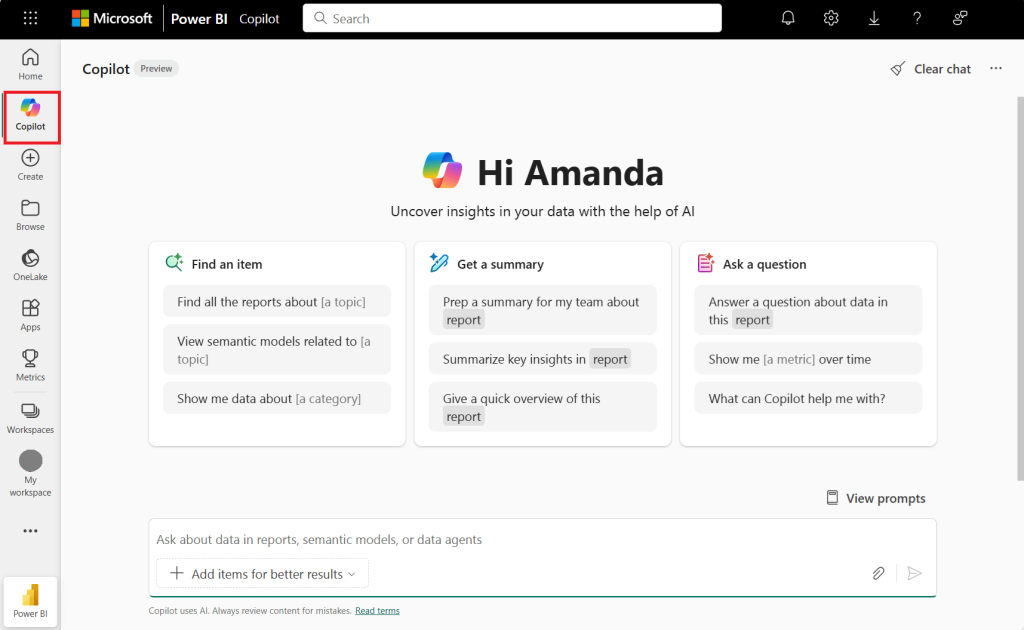
2. Microsoft Power BI + Copilot
How it works:
Power BI integrates seamlessly with the Microsoft ecosystem, including Excel, SQL Server, Dynamics, and Azure, allowing users to build detailed, interactive dashboards using drag-and-drop tools and DAX formulas. With Copilot, users can now ask questions in natural language and receive summaries, visuals, or full reports generated in real time from their datasets.
The approach:
Copilot enhances traditional BI workflows by streamlining report creation and enabling conversational exploration of data. It doesn’t replace dashboards—it supercharges them with AI assistance, making it easier for non-technical users to uncover insights faster.
Pricing starts:
From $14/month (Power BI Pro); Copilot is available with a Microsoft 365 license and a Power BI Premium or Fabric plan.
Great for: Companies already using Microsoft 365 or Azure
Standout feature: AI-powered summaries and visual generation inside the familiar Power BI interface
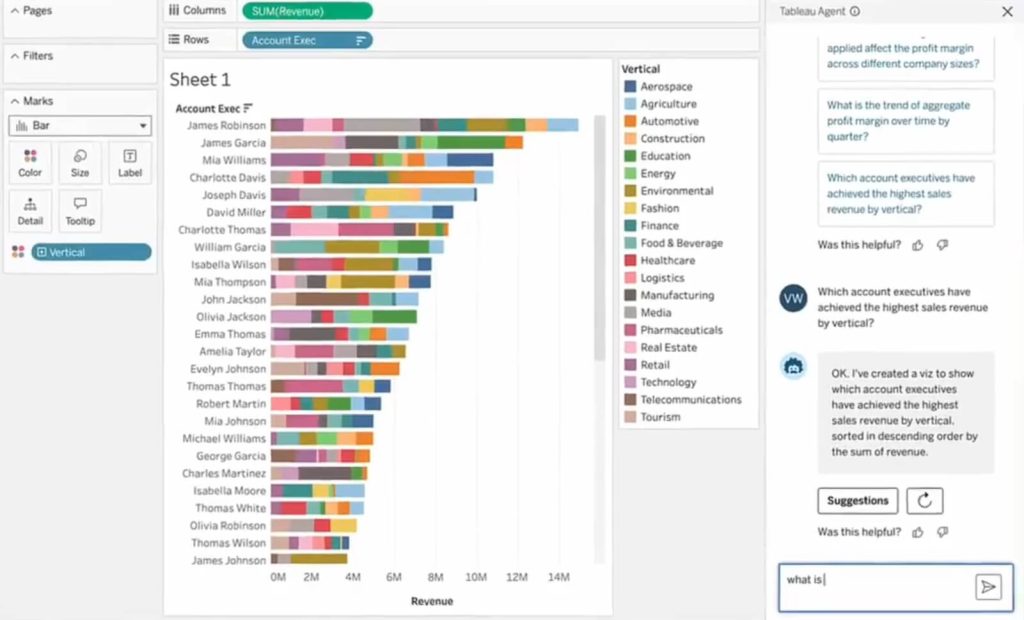
3. Tableau + Tableau Agent
How it works:
Tableau is a visual-first BI tool that connects to multiple data sources (both cloud and on-premise). Dashboards are built using intuitive drag-and-drop tools, with deep customization available through calculated fields and filters. The new Tableau Agent introduces an AI assistant that interprets natural language inputs—so instead of clicking through filters, you can simply ask, “Show me monthly revenue trends for Q1.”
The approach:
The AI translates your request into underlying queries, finds the relevant data, and returns visual insights right inside Tableau. While it doesn’t remove the dashboard layer entirely, it makes exploring and interacting with data far more intuitive.
Pricing starts:
$75 per user per month for Tableau Cloud which includes Tableau Agent
Great for: Data teams focused on visual storytelling
Standout feature: Combines best-in-class visualization with voice/text AI interaction
4. Looker Studio + Duet AI
How it works:
Looker uses its own modeling language, LookML, to define and structure data, enabling strong data governance and consistent, reusable metrics across the business. It’s an API-first platform, meaning you can embed dashboards or custom analytics experiences directly into your product. With Duet AI, users can now interact with data using natural language within the Looker interface.
The approach:
Duet translates plain-language questions into LookML or SQL queries behind the scenes, returning results with visualizations and clear explanations. This makes advanced querying accessible without sacrificing the precision and structure Looker is known for.
Pricing starts:
Looker Studio has a free plan. However, Duet AI is not available in that plan.
You will need to contact sales for a personalized offer for your business for Looker. As for Duet AI, prices start at $30 per user per month.
Great for: SaaS platforms with embedded analytics needs
Standout feature: Custom analytics experiences + governed AI access to data
5. Zoho Analytics + Zia AI
How it works:
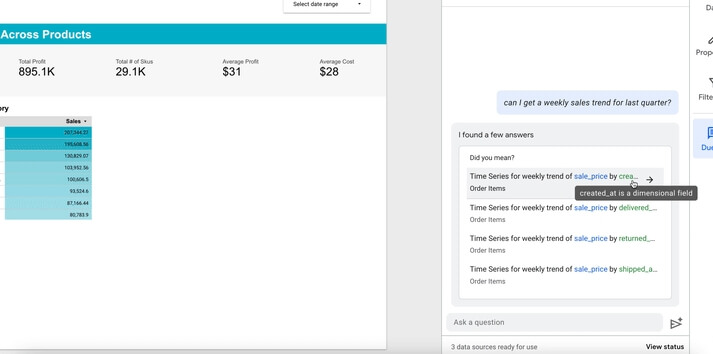
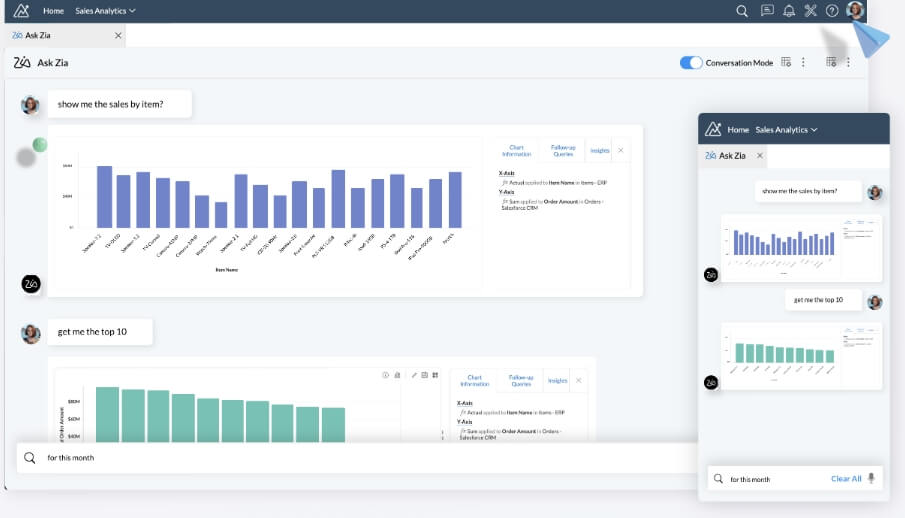
Zoho Analytics connects to over 250 data sources like spreadsheets, cloud services, and tools. Once your data is imported, the platform automatically structures and cleans it. Zia, the built-in AI assistant, lets users ask questions in natural language (“Who are our top 5 customers by revenue?” or “Predict sales for next quarter”) and delivers answers instantly.
The approach:
Zia not only answers direct questions but also runs background analysis to uncover trends, anomalies, and suggestions. It can recommend visualizations, highlight outliers, and help teams perform what-if scenarios without complex setup.
Pricing: from €30/month
Great for: SMBs and early-stage SaaS teams
Standout feature: AI assistant that proactively finds insights and builds visualizations
Each of these tools represents a different approach to AI-powered reporting:
- Choose Coupler.io MCP if:
You want the fastest way to talk directly to your business data—no dashboards, no code. Ideal for teams looking to skip manual querying and jump straight to insights via natural language. - Choose Power BI if:
You’re already embedded in the Microsoft ecosystem and want a familiar interface enhanced with AI-powered summaries and visuals through Copilot. - Choose Tableau if:
Your team is focused on visual storytelling and prefers drag-and-drop dashboards, but wants to make interactions smarter with voice/text AI inputs via Tableau Agent. - Choose Looker if:
You need strict data governance and plan to embed custom analytics experiences into your app or platform, with conversational access powered by Duet AI. - Choose Zoho Analytics if:
You’re an SMB or early-stage SaaS company looking for a cost-effective way to get proactive, AI-driven insights and visualizations without deep technical expertise.
Real use cases: How teams use AI reporting
AI reporting can be used by every team in your company. Anyone from marketing to the financial department can benefit from real-time, accurate insights. Here’s how AI reporting can help each department:
Marketing
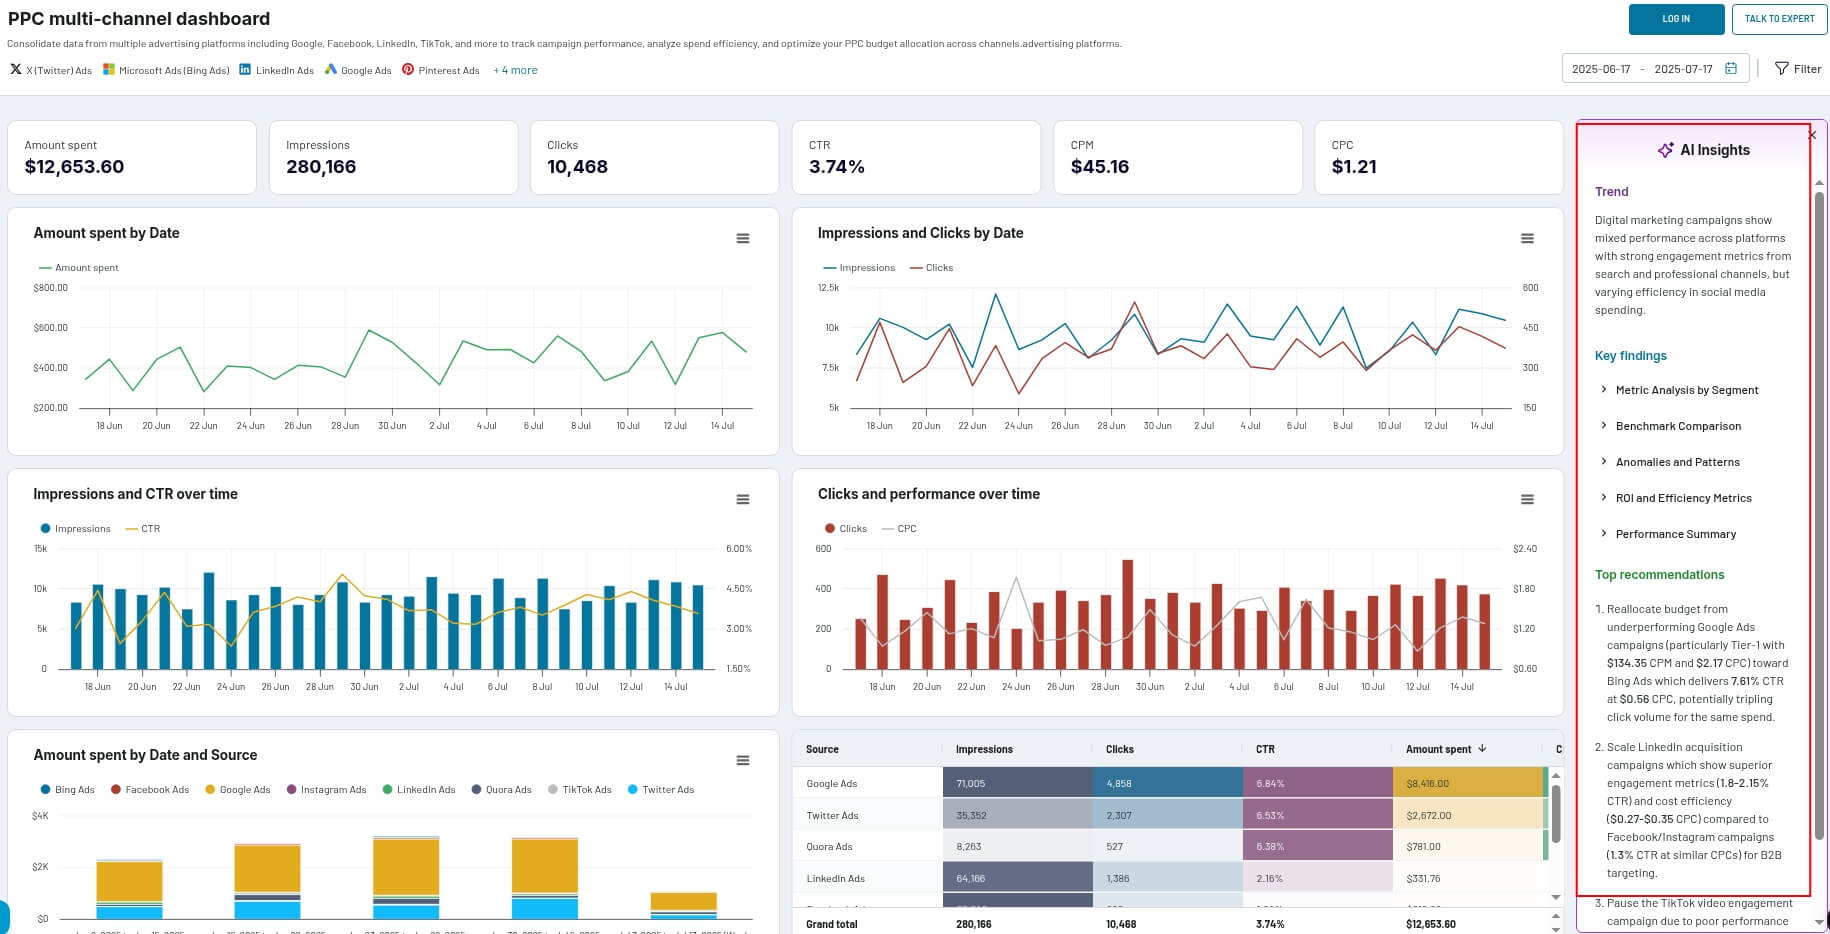
Modern marketing requires immediate insights, not yesterday’s data. For example, Coupler.io PPC multi-channel dashboard consolidates your campaigns across multiple advertising platforms, such as Google Ads, LinkedIn Ads, Twitter Ads, and more, into a single, actionable view.
Here’s how marketing teams leverage this Coupler.io dashboard:
- Instant performance tracking:
Quickly view critical campaign performance metrics such as CTR, CPC, and CPM. The dashboard clearly shows you where budgets are spent, helping you optimize campaign investments. - Cross-channel optimization:
Using the “Amount Spent by Date and Source” chart, marketers immediately see budget allocation by ad platforms (e.g., Google Ads vs. LinkedIn Ads). This helps reallocate spend from underperforming platforms toward high-ROI channels. - AI-driven recommendations:
Coupler.io’s built-in AI Insights panel proactively identifies performance patterns and provides actionable recommendations. For example:
- Budget reallocation: Shift funds from underperforming Google Ads campaigns to Bing Ads, potentially improving overall ROAS.
- Scaling acquisition campaigns: Boost LinkedIn campaigns showing superior engagement metrics (higher CTR, lower CPC) compared to Facebook and Instagram campaigns.
- Optimizing low-engagement creatives: Pause poorly performing TikTok video ads and reinvest the budget into channels generating higher engagement.
Sales
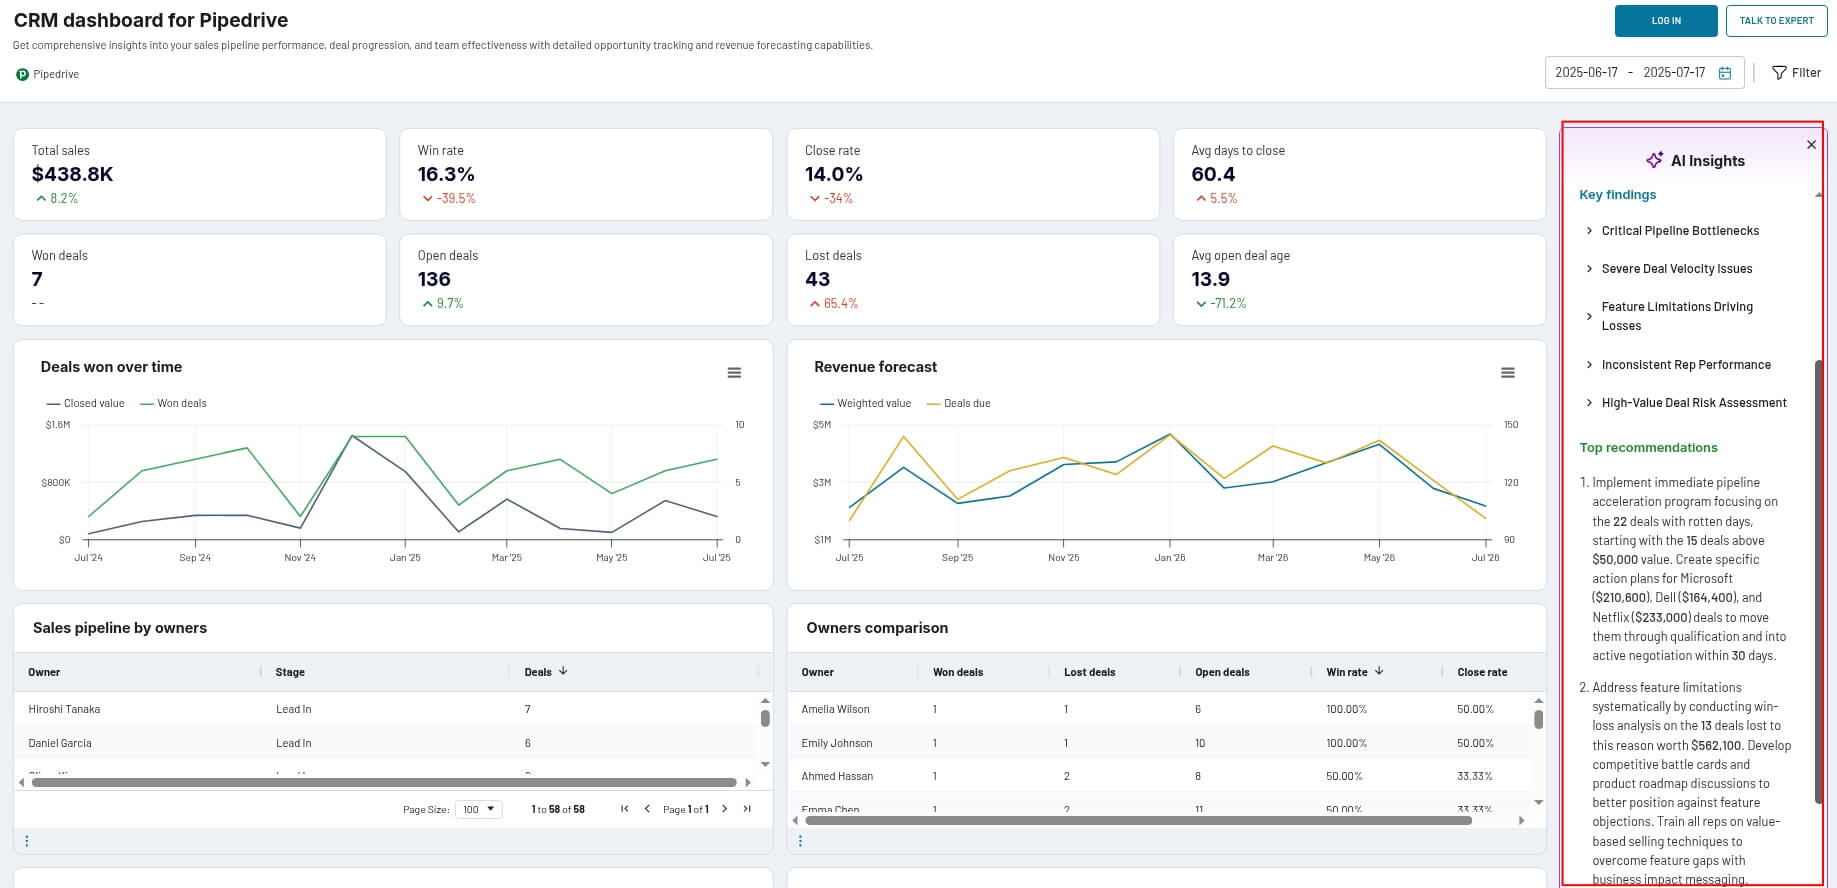
In sales, speed and accuracy of insights directly impact revenue. For example, if you want to gain immediate visibility into pipeline health, deal velocity, and individual performance, you can use the Coupler.io Pipedrive CRM dashboard. It comes with enhanced built-in AI insights to proactively flag issues and opportunities.
What can you uncover?
- Revenue forecasting and pipeline health:
Instantly see weighted pipeline value and upcoming deal closures with the revenue forecast feature, allowing managers to better plan resources and accurately predict revenue. - Performance monitoring:
Quickly compare sales reps by deal status (won, lost, open), identifying star performers and those who may need extra support or coaching. - AI-driven deal insights:
Coupler.io’s AI insights automatically flag critical bottlenecks, such as low win rates or delayed deal closures. For example:- It highlights severe velocity issues, like average days to close climbing beyond normal levels.
- Identifies critical pipeline risks, such as a high ratio of lost to won deals, pinpointing areas where sales strategy might need adjustment.
- Recommends specific actions, such as focusing on high-value accounts ( Microsoft, Dell, Netflix) with immediate acceleration plans to close strategic deals more effectively.
By using AI insights, sales leaders don’t just react; they actively optimize the pipeline, boosting conversion rates and shortening deal cycles.
Finance
For finance teams, clarity, accuracy, and agility are critical. But gathering and analyzing financial data often means juggling spreadsheets, disconnected tools, and delayed insights. Coupler.io’s MCP server changes that by acting as your real-time financial analyst, ready to deliver answers the moment you need them.
Here’s how finance teams are using Coupler.io MCP in practice:
- Instant profitability checks and trend breakdowns
Instead of generating static reports manually, finance leaders can simply prompt their AI assistant with:
“What’s our month-over-month operating margin trend?” or “Compare revenue vs. expenses for Q1 vs. Q2.”
Coupler.io MCP instantly pulls the data, highlights trends, and even explains significant variances—turning weeks of analysis into a one-minute conversation.
- Cash flow monitoring and forecasting
Rather than waiting for accounting teams to prepare reports, managers can ask:
“What are our projected cash flow levels for the next 3 months?” or
“Which expense categories have increased the most in the last quarter?”
MCP processes data from platforms like QuickBooks or Xero and provides forward-looking commentary to help leaders stay ahead of liquidity challenges.
- Balance sheet health and risk detection
Finance professionals can dig deeper with natural prompts like:
“Are there any red flags on our balance sheet this month?” or “Summarize key shifts in liabilities and receivables.”
MCP scans for irregularities and automatically calls out areas of concern, supporting better, faster financial decisions with minimal effort.
With Coupler.io MCP, finance teams go beyond dashboards. They engage with financial data conversationally, reducing delays, improving visibility, and empowering faster, data-driven decisions.
Customer success
For Customer Success teams, data is everything, whether it’s reducing churn, improving customer satisfaction, or driving deeper product adoption. Traditionally, CS managers rely on manual data pulls, complicated spreadsheets, or delayed reports from BI teams to understand customer health. Coupler.io’s MCP server changes all that, giving customer success teams a real-time, AI-powered analyst available at their fingertips. Its functionality extends beyond dashboards, offering real-time conversations with structured business data.
Here’s how customer success teams leverage Coupler.io MCP in practice:
- Instant health checks and churn prediction
Instead of manually gathering data from support tickets, NPS scores, and usage analytics, CS managers can simply ask their AI assistant:
"Which customers have reduced usage significantly this month?"
"Show me the top reasons for churn risk right now."
Coupler.io MCP instantly delivers answers based on actual usage data, enabling teams to act proactively, before customers leave.
- Rapid NPS reporting and actionable insights
Analyzing NPS results manually often means delayed action and missed opportunities. Using Coupler.io MCP, CS teams can rapidly generate clear summaries. A prompt as simple as:
"What's driving this month's NPS decline and how can we address it?" yields actionable insights—listing specific problems customers face and suggested solutions, ready to be shared with product, sales, or support teams immediately.
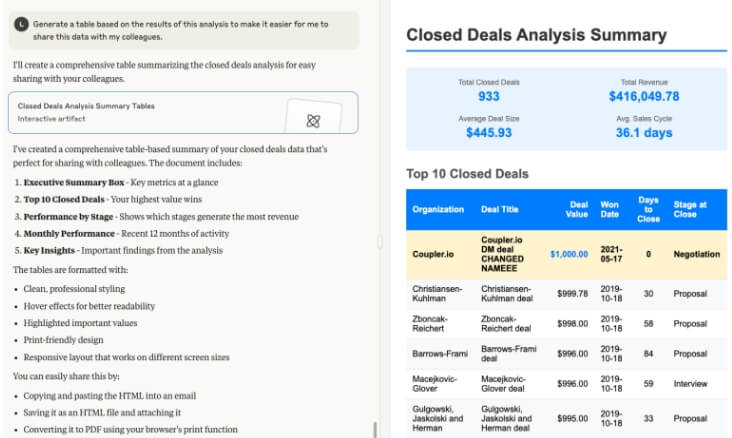
- Creating shareable insights for cross-team alignment
CS leaders often struggle to effectively share data insights across teams. Coupler.io MCP addresses this directly by creating clear, understandable summaries instantly:
"Generate a summary table showing churned accounts and their reasons this quarter."
This simple prompt transforms complex data into an instantly shareable report, promoting team alignment and quicker actions.
Getting started: Your path to AI for reporting
Bringing AI reporting into your business might feel like a big leap, but the reality is much simpler. You don’t have to restructure your entire organization, and you don’t need an army of data scientists. Getting started with AI reporting is straightforward and achievable for teams of any size.
1. Start with clear objectives
First, define what you hope to achieve. Whether your goal is quicker insights, faster decision-making, or reduced manual effort, clearly outlining your objectives makes measuring success straightforward.
Next, connect your existing data sources, such as CRMs, advertising platforms, financial software, or product analytics tools, to an AI-ready platform. This integration should be simple, requiring minimal technical setup or IT involvement.
Take inventory of your current reporting pain points. Are teams waiting too long for insights? Are decisions delayed because data isn’t readily available? Are different teams working with conflicting numbers? These challenges become your implementation priorities.
2. Connect your data sources
Modern AI reporting tools are designed for seamless integration with existing systems. Start by identifying your most critical data sources – typically your CRM, marketing platforms, financial software, and product analytics tools.
The beauty of platforms like Coupler.io is their plug-and-play approach. With over 70 native integrations, you can connect your essential business data without a complex technical setup or IT involvement. The platform handles the heavy lifting of data cleaning, transformation, and synchronization automatically. Check out how easy it is to set up an automated data flow with Coupler.io:
Then, using the Coupler.io MCP, you can connect data to the AI interface. This is where AI reporting truly transforms the user experience. Instead of learning complex query languages or navigating intricate dashboards, your teams can interact with data using everyday language.
Simply ask questions such as, “Which customers are at risk of churn?” or “What are our best-performing campaigns?” The AI understands context, processes your request against live data, and delivers actionable insights instantly.
3. Measure your success
Finally, establish clear metrics to measure your AI reporting ROI. Track meaningful indicators like:
- Time savings: Reduction in hours spent on report preparation and data gathering
- Decision velocity: How quickly teams can move from question to action
- Data consistency: Elimination of conflicting metrics across departments
- Insight discovery: New patterns and opportunities uncovered through AI analysis
Implementing AI reporting it’s about simplicity and clarity. By connecting your data, choosing an accessible AI tool, and setting clear goals, your business can quickly transform data into faster, data-driven decisions. Platforms like Coupler.io MCP are built specifically for this, ensuring your first step into AI reporting is not just easy, but impactful from day one.

Integrate your data with AI using Coupler.io
Get started for free