What is the Airtable Claude integration?
When you need Claude to analyze your Airtable data, you save it as a CSV, clean it up, and then paste it into the chat. By the time you’re done, the numbers are already stale, and you’re repeating the same steps next week.
The Airtable Claude integration is a direct connection between your Airtable bases and Claude that removes the need for manual export entirely. It lets you ask about your pipeline, inventory, or content calendar in plain language and get answers from live data.
The reliable way to do this on a schedule is Coupler.io’s Airtable Claude connector. It syncs your Airtable views at intervals you set and runs calculations through its Analytical Engine before Claude sees the numbers. That means no stale exports and no reconnecting a fresh CSV every Monday. You give Claude a prompt, and Claude interprets verified results instead of guessing at math.

Headline: Load your Airtable views into Claude with Coupler.io
Start for freeHow to connect Airtable to Claude using Coupler.io
Coupler.io is a no-code data integration platform and AI analytics solution. It connects to 400+ source apps, including Airtable, and delivers data to Claude for interpretation.
For Airtable, this automation matters because Airtable’s native export button forces you to download a separate CSV for each view in your base. If you have multiple tables, that adds up to a stack of manual exports every time you need up-to-date numbers. With Coupler.io, you can instead connect each view once, get it into Claude on a schedule, and analyze the latest data without touching a CSV again.
Here’s how to connect Airtable to Claude using Coupler.io step by step:
Step 1: Create a data flow for Airtable data
To start creating a data flow with Airtable as the source and Claude as the destination, click Proceed in the form below:
Next, sign up for Coupler.io (no credit card required).
To bring Airtable data into Claude, you must provide a shared URL for the view to be exported.
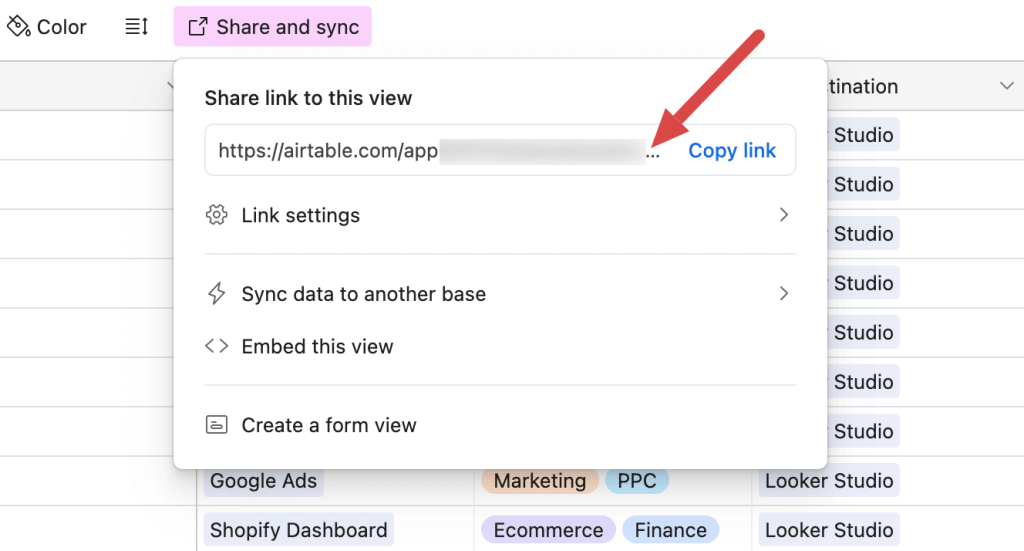
To get a shared URL of a specific Airtable view, click Share and sync in the menu and copy the URL you’ll see below.
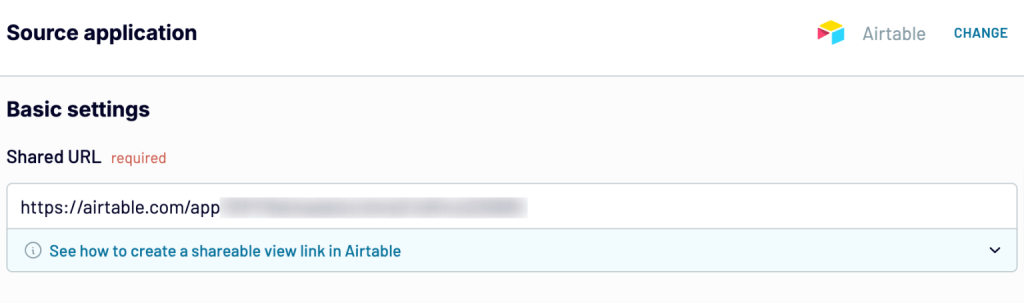
Paste the URL into the corresponding field in Coupler.io.
If your view is password-protected, proceed and specify the password in the respective field.
Before moving forward to the next step, you can add more sources to the same data flow. Blend records from different views and accounts within Airtable, or even merge data from other apps in a single place.
Coupler.io also lets you attach business context to the dataset so Claude gets the necessary background for accurate analysis. For example, specify that a record with no activity logged in the past 7 days counts as stalled, and there’s no need to clarify this in every chat.
Step 2: Connect Claude
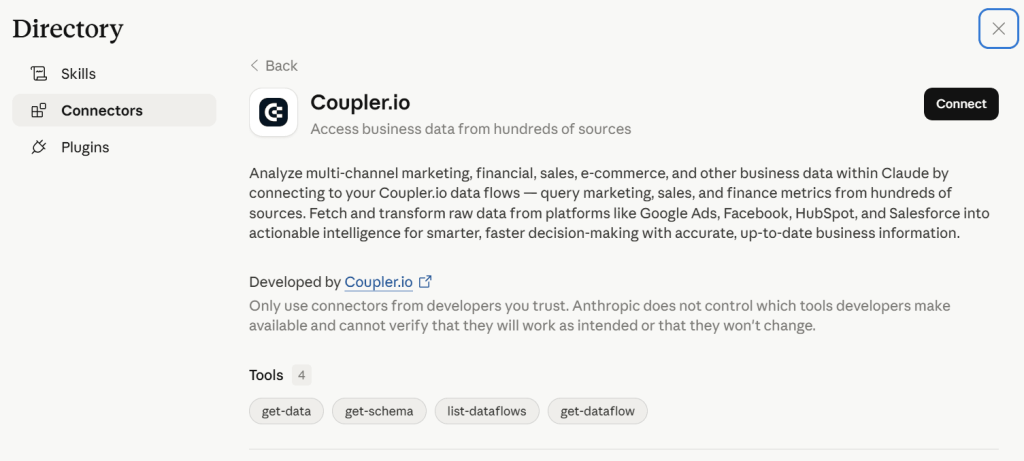
When you’re ready with your data, click Get connector, which takes you to the Coupler.io connector page in the Claude app. Follow the instructions to complete the setup, go back to Coupler.io, and run the data flow from Airtable to Claude.
Next, turn on Automatic data refresh and specify the schedule. You can have your data updated as often as every 15 minutes. Click Save and run to activate your automation.
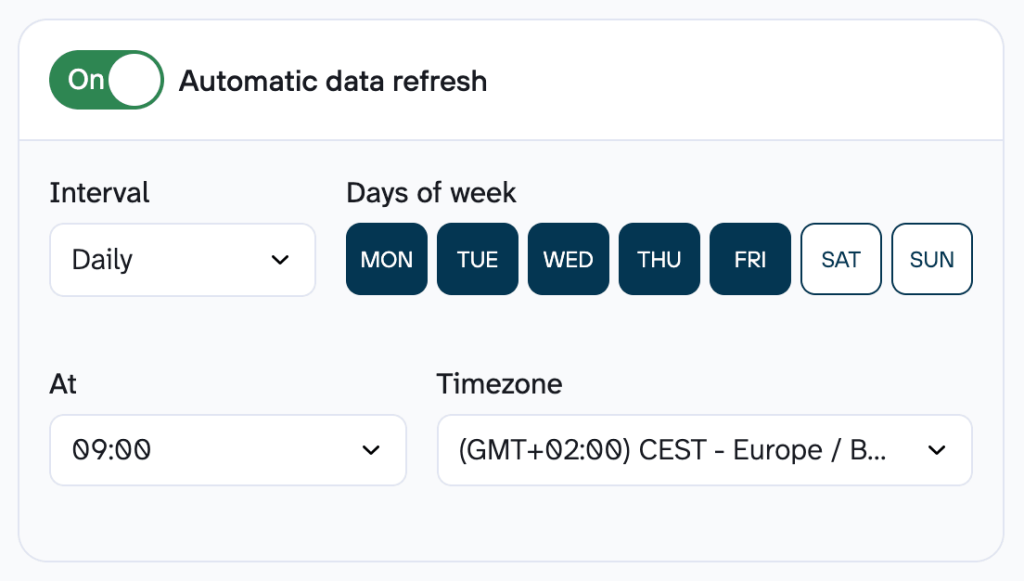
With automatic data refresh, Coupler.io pulls updated records from your Airtable views on the schedule you choose. To confirm you’re working with the most recent Airtable data in Claude, ask it to re-fetch the data mid-chat or start a new conversation. For multiple bases or ongoing analyses, create a separate Claude Project for each. This way, Claude keeps context isolated so it doesn’t blend datasets. This works whether you’re using Claude on the web or in the desktop app.
Coupler.io also teaches Claude the dataset structure before analysis begins, which reduces column misinterpretation.
The flow is similar when you connect Google Sheets to Claude with Coupler.io.
Step 3: Start a chat with Claude about Airtable data
After the first successful run, open Claude and allow it to connect to the Coupler.io MCP server when prompted. Now, you can gain insights into your Airtable data with Claude AI through natural language.
A useful prompt should match a real operational decision. For sales rep allocation, that could look like:
Using the Deals table (linked to Accounts and Sales Reps), pull total closed-won revenue and win rate by rep for this quarter, using the Stage field to identify closed deals and the rollup from Accounts for deal size. Which reps are above our 25% win-rate target, and if I reassign 3 open leads per week from reps below target to reps above it, what’s the projected impact on quarter-end revenue?
Here’s what Claude would return:
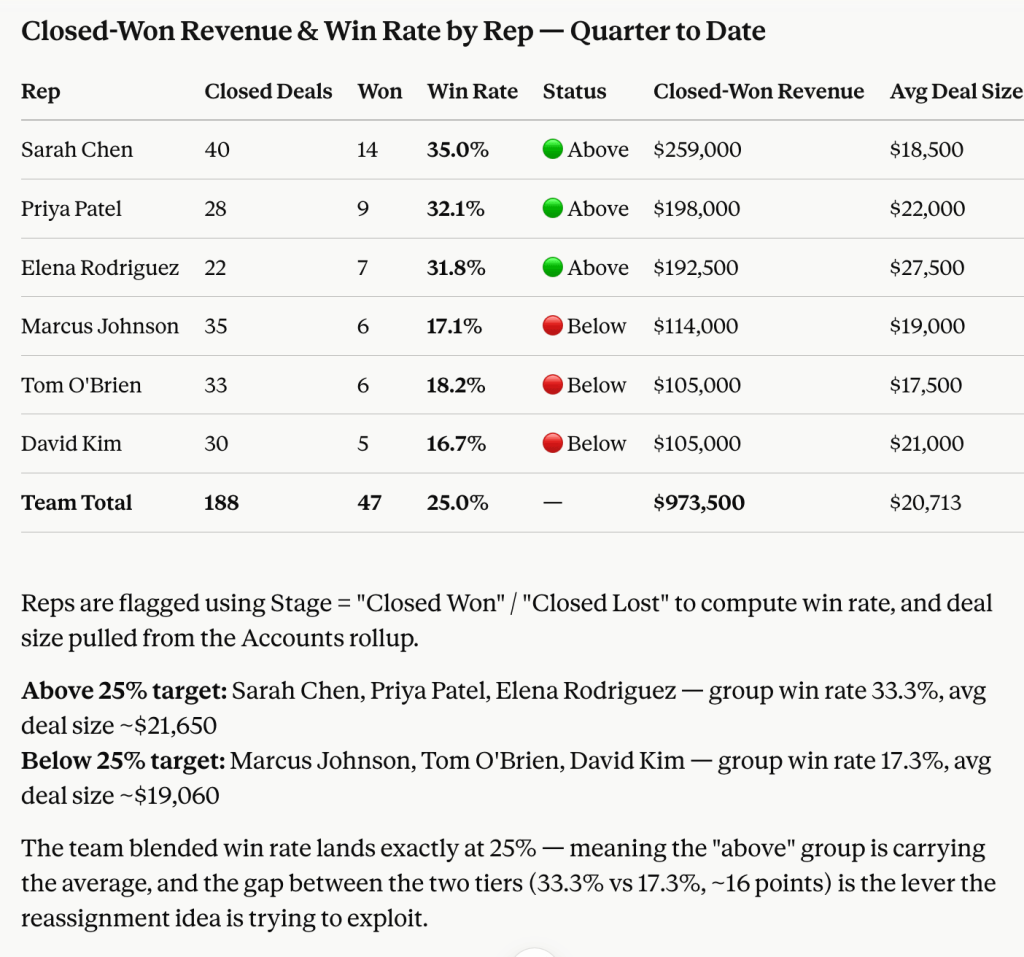
Claude pulls from the linked Deals → Sales Reps → Accounts structure, groups by rep, and returns a table flagging who’s above and below the 25% win-rate threshold. It follows with a short projection: if a set number of leads move weekly from below-target reps to above-target reps, here’s the estimated revenue lift by the end of the quarter.
Analyze Airtable data in Claude with Coupler.io
Get started for freeWhat you can do with Airtable data in Claude
Once Coupler.io is running the sync, the value of your analysis comes down to the questions you ask. I tested five prompts built around decisions that are slow or error-prone to check by hand.
Spot stalled deals
Before a forecast call, a rep needs to know which deals are stalled. Scrolling through a Pipeline table in search of stale records is slow, and it’s easy to miss a deal with no recent activity if you’re scanning by close date instead of by activity history.
To flag deals that risk missing their close date, so a rep can re-engage before the forecast call rather than after, use the prompt below:
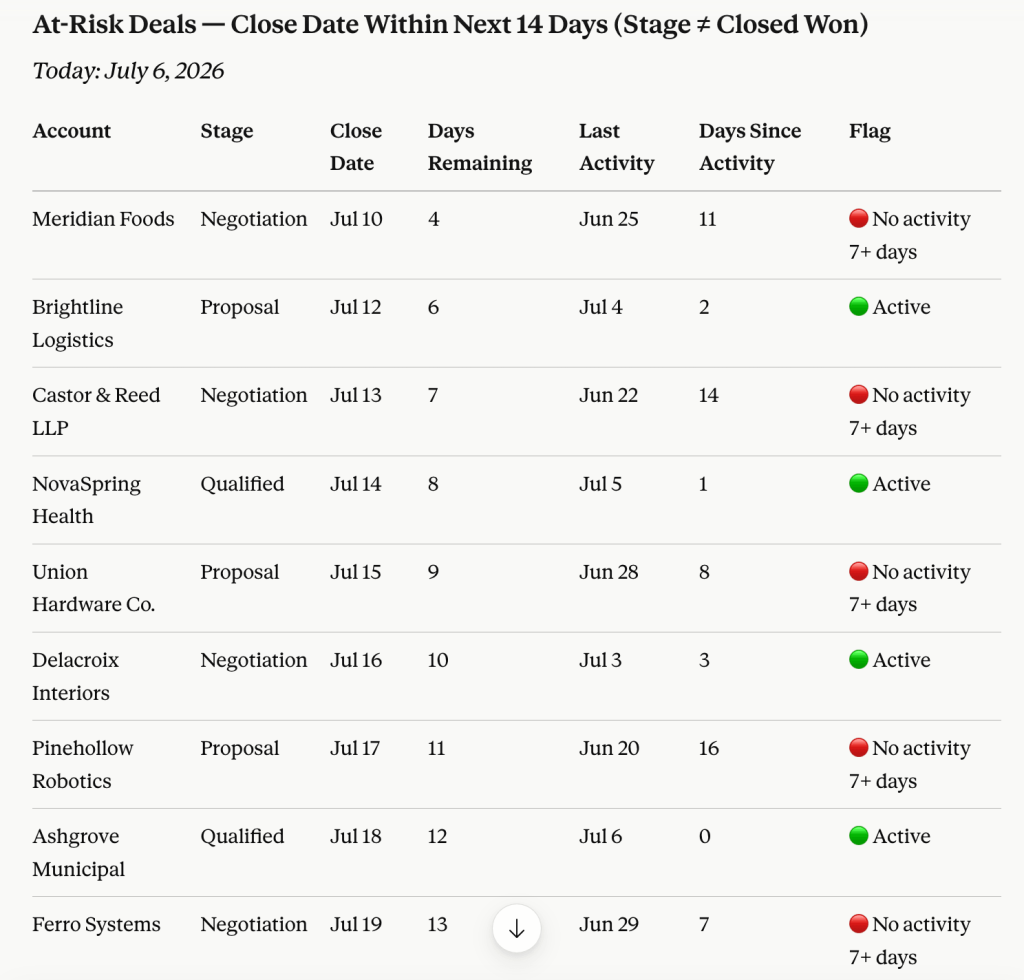
Look at the Pipeline table and list every deal with a Close Date in the next 14 days where Stage is not Closed Won. For each one, tell me the last activity date and flag any stalled deals.
Because I defined “no activity in 7 days = stalled” as business context back in Step 1, Claude applies that rule automatically. The response is a table listing each stalled deal with account name, close date, days remaining, last activity date, and a flag for anything with no logged activity in the past week.
Here are key takeaways:
- Deals flagged with zero activity in 7+ days are the ones to call first.
- By running these two days before the forecast call, reps get time to re-engage before the deadline.
- If the same account shows up flagged week after week, that’s usually a dead deal.
Catch schedule slips
An editor who manages a content calendar across several writers can’t always tell at a glance which pieces are blocking the schedule versus which are a day or two behind. If they decide to cross-reference publish dates and statuses across dozens of rows, they will lose time that should have gone into fixing the bottleneck.
To give an editor a prioritized punch list of what’s blocking the calendar instead of a manual scan, ask Claude:
Group the Content Calendar table by Status, then list every item assigned to a writer where the Publish Date has passed, but the Status is not Published. Sort by how many days overdue each one is.
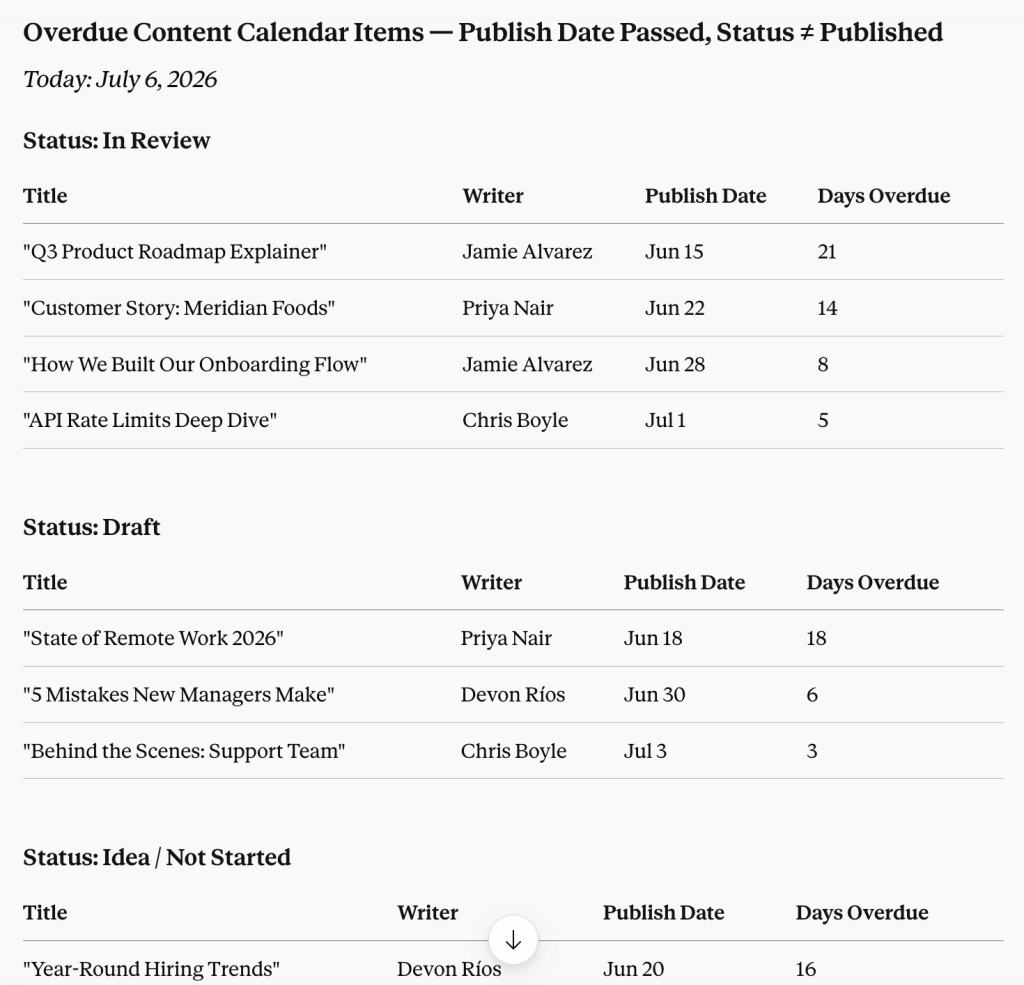
Anything more than 5 days overdue usually means the piece is stuck in review. Two or more overdue items from the same person point to a capacity problem worth raising in the next planning meeting.
Forecast stockouts
An inventory manager who tracks dozens of SKUs across an Airtable base can’t reasonably calculate weekly sell-through rates by hand for every product, every week. By the time a stockout shows up in the current stock count, it’s often too late to reorder before the shelf empties.
To turn raw order history into a reorder list before a popular item runs out, insert the prompt:
Using the Inventory base, calculate the average weekly units sold per SKU over the last 6 weeks, compare it to the current stock on hand, and flag any SKU projected to run out within 21 days.
The 6-week rolling window works because Coupler.io keeps re-syncing the stock records on schedule. So Claude provides a ranked list of SKUs by days until projected stockout, with the 6-week average velocity and current stock level shown side by side for each one.
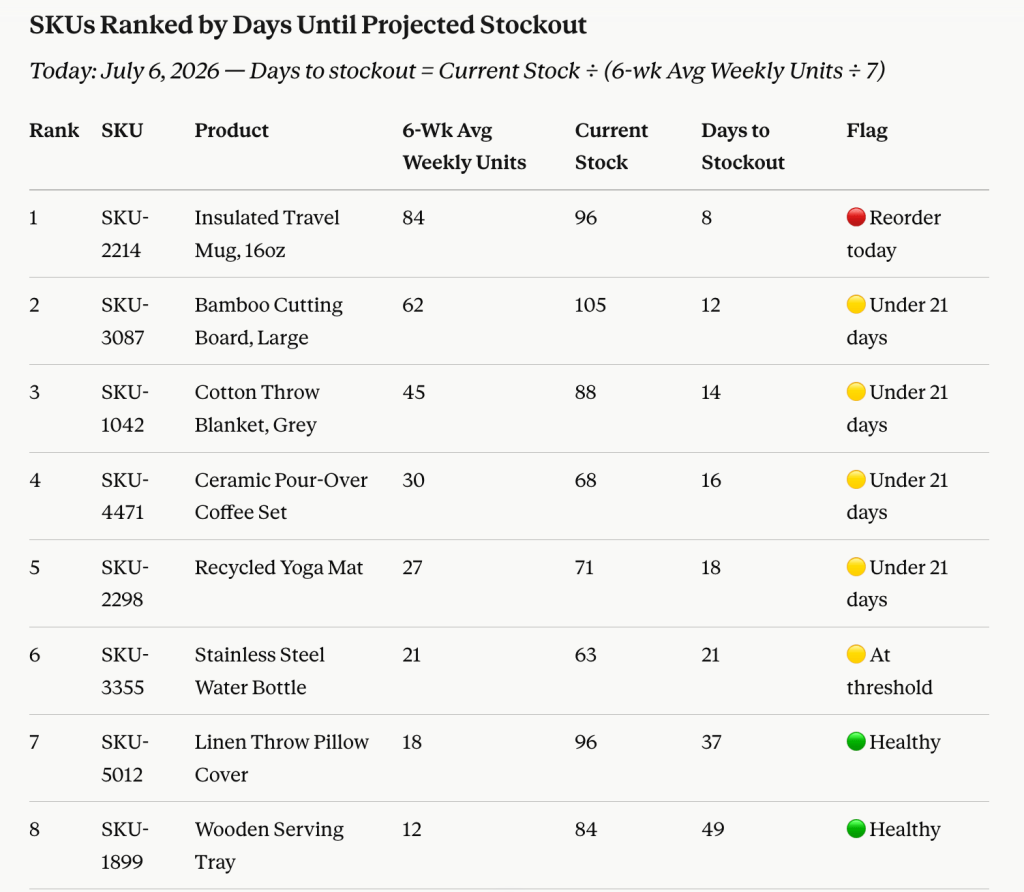
From these results, SKUs projected to run out in under 10 days require immediate reorder, while a rising 6-week average combined with low stock signals accelerating demand. So the analysis should be repeated weekly to catch spikes before they lead to stockouts.
Flag budget overruns
To identify budget drift by category, along with the underlying transactions, without creating a monthly pivot table, use the following prompt:
Compare this month’s records in the Expenses table to last month’s, grouped by Category. Show me which categories increased by more than 20%, and list the individual transactions driving each increase.
Claude sorts the categories by percentage increase, each with the specific transactions responsible, so finance can trace an overrun back to a vendor or purchase instead of just a category total.
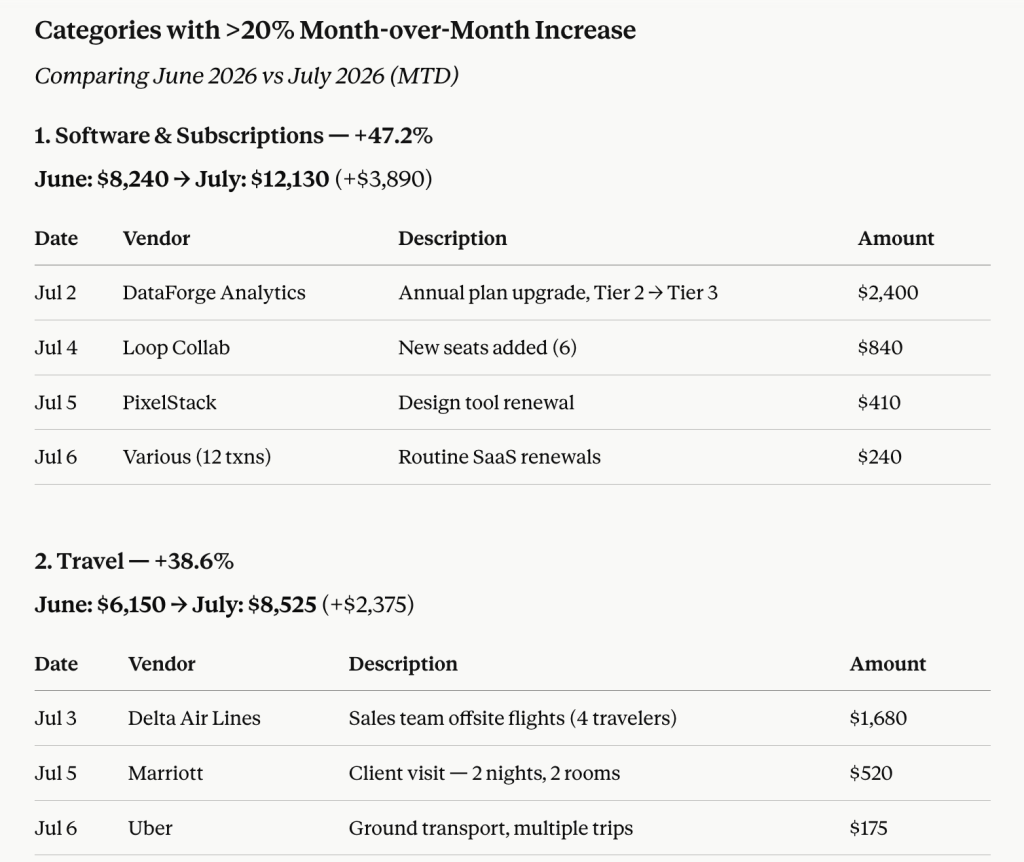
Below is what we learned from the results above:
- A 20%+ jump in one category is worth a conversation with whoever owns that budget line, even if the dollar amount looks small.
- Line items tied to a single vendor or a one-time purchase normally don’t need action. Recurring increases across multiple transactions do.
- This replaces a manual pivot table every month, and the transaction-level detail means finance doesn’t have to dig for the “why” separately.
Prioritize feedback themes
A product manager sorting through a Feedback Tracker full of tags can tell what’s mentioned most, but raw volume hides which issues are accelerating right now. A theme with 200 total mentions collected over a year looks more urgent than one with 30 mentions in the last month, even if the second one is the one about to become the top complaint.
To help a product manager prioritize based on momentum rather than raw volume, here’s what to paste in your Claude chat:
Summarize the Feedback Tracker table: identify the 5 most common tags overall, then compare tag frequency in the last 30 days against the prior 30 days. Tell me which themes are growing fastest.
This comparison depends on the Coupler.io dataset being refreshed on a schedule. As a result, we get the top 5 tags by total volume, plus a separate ranking by 30-day growth rate, so a smaller but fast-growing theme doesn’t get buried under older, higher-volume tags.
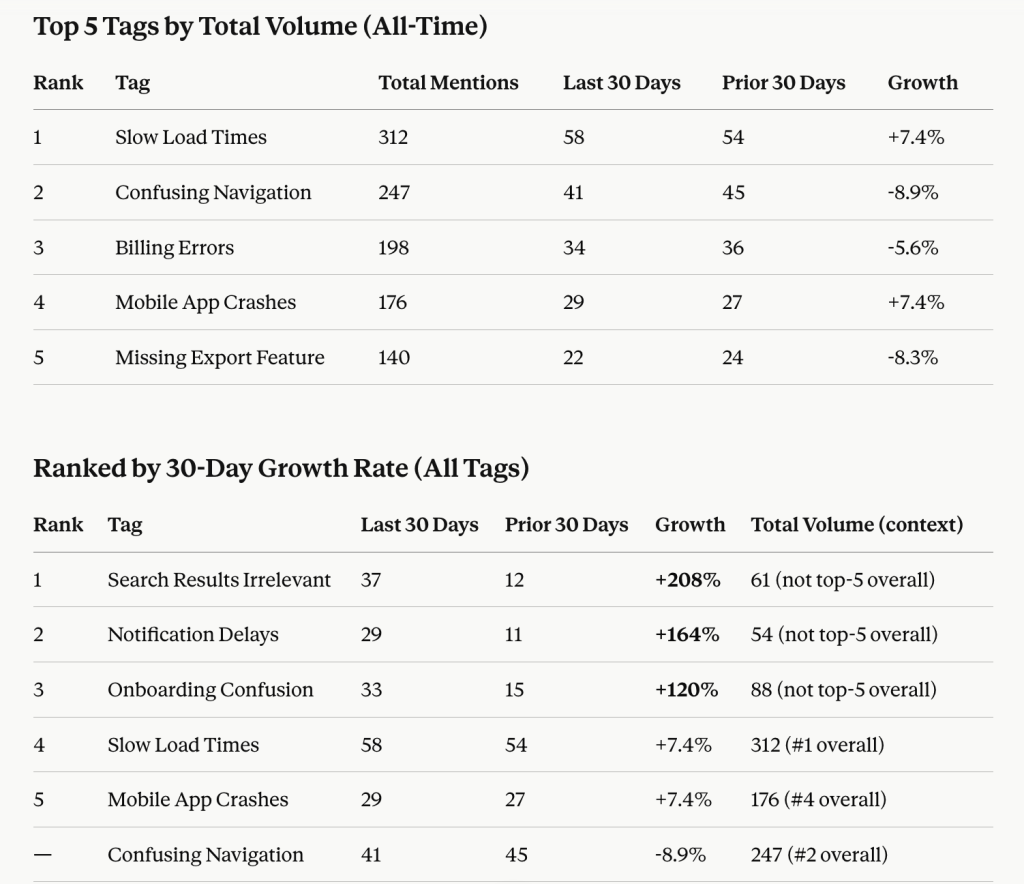
A tag with high total volume but flat growth is often a known issue already on the roadmap. Any tag climbing fast in the last 30 days, even from a small base, is the one worth investigating before it becomes the top complaint.
The tables Claude returns above are Artifacts, saveable and shareable, so you can revisit results, share them with stakeholders, and avoid repeating the same analysis.
Talk to Claude about your Airtable data
Try Coupler.io for freeOther ways to get data from Airtable to Claude
Coupler.io’s Airtable to Claude integration is the way to launch a scheduled, recurring flow of structured data without owning any infrastructure, handling API keys, etc. The other options fit narrower situations, from single one-off questions to full control over the pipeline or connecting Airtable to internal systems alongside Claude. Below is how you can alternatively get data from Airtable to Claude, and where it holds up.
Manual export
Airtable doesn’t let you download an entire table as a CSV, but you can export any single view. Open your base, go to the table you need, and save the file straight to your device. If your base has multiple tables, you’ll need to repeat this for every view separately.
This works fine for a one-off analysis: pull a CSV, paste the relevant data into a Claude conversation, and ask your question. However, it breaks down the moment you need the same report on a recurring basis. Every refresh means re-exporting each view by hand and re-uploading it to Claude, and nothing about the process runs on its own.
Native Airtable connector in Claude
An official Airtable connector is available in Claude’s Connectors directory. Set it up once through OAuth in Claude’s settings, and Claude can read, create, and update existing records in your base inside a conversation. Ask it to pull open tasks from a project tracker, log new records, or update a deal stage, and it acts on your Airtable data without opening the app.
Native Airtable Claude connector is the right tool when you want Claude to check something in Airtable mid-conversation or make a quick update, but it isn’t built as a running data pipeline. There’s no automatic refresh, and each conversation starts anew, so it doesn’t accumulate a persistent, analysis-ready dataset the way a scheduled export does.
Airtable MCP server
The connector above is a pre-authorized way into the Airtable MCP server, with Airtable handling the OAuth setup for you inside Claude’s Connectors directory. To get the MCP server ready yourself, you need to register an OAuth client with Airtable, choose the scopes to grant, then point your MCP settings at the server URL and credentials. Airtable also issues personal access tokens as an alternative to OAuth.
This makes sense in two situations. First, Claude Code doesn’t have a one-click connector the way Claude.ai does. So if you need Claude Code to read and write Airtable records from the terminal, you set up the MCP connection with a personal access token yourself. Second, if you want a narrower set of permissions than the native connector’s default scope, your own OAuth client lets you set that scope explicitly.
Outside of those two cases, you get a similar thing the native connector already offers: conversational, in-session access to Airtable records, without scheduling or a persistent dataset. You take on token management and scope configuration, but end up with no data pipeline to show for it.
Coupler.io’s connector is also MCP-based, but it arrives as a ready-to-use Claude connector, no server to build or maintain.
Custom MCP server
To build your own MCP server for Airtable, you need to write the server and host it somewhere reachable over the public internet.
It works when:
- You’re combining Airtable with internal systems that have no pre-built connector.
- There’s a need for precise control over which tools and data Claude can access.
- Airtable is one piece of a larger internal analytics tool your team is already building.
But you’re now maintaining infrastructure and keeping it running as Airtable’s API or your own internal systems change. For most teams asking Claude questions about a sales pipeline or content calendar, this is more engineering effort than the problem calls for.
API scripts and function calling
API scripts give you a fixed pipeline to connect Airtable to Claude: authenticate against Airtable’s REST API with a personal access token, pull the tables and fields you need, transform the data, and push it wherever Claude can read it. This is close to what Coupler.io does under the hood, minus the no-code interface. So you get precise control over exactly which fields, filters, and views reach Claude, and you can schedule the pull to run overnight.
The bottleneck of this method is the real cost. Airtable’s API is rate-limited to 5 requests per second per base, so a script pulling from several tables needs to handle throttling and retries. List requests are paginated, so your script has to loop through pages correctly to return a complete table. Personal access tokens don’t expire on a fixed schedule, but someone still has to manage and rotate them. And if a field gets renamed or a view’s structure changes in Airtable, the script can break quietly until someone notices the numbers look off.
Function calling solves a different problem. Instead of pre-pulling everything, you define functions Claude can call, and Claude decides which one to call based on the question asked. This fits a conversational interface where people ask different, unpredictable questions about the same base. The tradeoff is that you need an application layer between Claude and Airtable’s API: a hosted service that receives the function call, executes it against Airtable, and returns the result. That’s another service to build, deploy, and keep running alongside the base itself.
Airtable Claude connector limitations
The Airtable connector for Claude above has three limits worth calling out, and here’s how Coupler.io handles each one.
No persistent data pipeline
The Airtable-Claude connector is designed for conversational access to Airtable data inside Claude. You can read, write, and analyze records during a chat session, but it isn’t built as a continuously running reporting pipeline that keeps refreshing data in the background.
Coupler.io addresses this by creating a persistent Airtable data pipeline that automatically fetches and refreshes data on a configurable schedule. So the dataset stays ready for reporting and analysis without necessarily needing a new chat session each time.
Large datasets may require selective querying
Claude works with Airtable data conversationally, but like any LLM, it is limited by context size. For large bases, you often have to narrow the scope by table, view, or prompt.
In comparison, Coupler.io can consolidate, filter, transform, and prepare Airtable data before it reaches Claude or another analytics destination. This reduces the amount of raw data that needs to be analyzed in a single chat.
No native reporting or visualization destination
While Claude can summarize and interpret Airtable data in chat and write back to Airtable, it doesn’t natively deliver that data to spreadsheets or BI tools as part of a reporting workflow.
Coupler.io instead exports Airtable data directly to destinations such as Google Sheets, BigQuery, Excel, Tableau, Looker Studio, and more. It also has other AI integrations like ChatGPT, Gemini, and Perplexity. This makes it easier to build automatically refreshed Airtable reports and dashboards alongside the Claude conversation.
What you gain when you connect Airtable to Claude
Manual Airtable exports cost more than the ten minutes at the keyboard. Every CSV download is a decision point: which view, which table, did the password change, and is this the latest version? Multiply that across every table in a base, every week you need fresh numbers, and the real cost shows up as delayed decisions.
However, if you connect Airtable to Claude, you remove that delay. Ask about this week’s pipeline or this month’s inventory, and Claude works from the latest data.
Also, a CSV export gives you one table, but Claude, working from a cross-table dataset, can compare stalled deals against last activity dates in one natural-language question.
For teams making decisions off Airtable data every week, the removed friction adds up. The hour someone used to spend pulling and reconciling exports goes back into the actual decision, and the data waiting for them is recent instead of stale.
Start with Coupler.io if you need Airtable data analytics on a schedule without maintaining a pipeline yourself, but with the calculations and the Claude connection handled out of the box.
Get analysis-ready Airtable data in Claude
Sign up to Coupler.io for free