To load Gorgias data into BigQuery, you normally need a CSV export, a cleanup pass in a spreadsheet, and a file upload whenever someone asks for fresh numbers.
But imagine ticket volume, CSAT scores, tags, and agent response times landing in BigQuery on a schedule you set, ready for SQL queries. And you don’t have to re-upload files, flatten nested ticket data by hand, or chase down last week’s numbers.
Here’s how to connect Gorgias to BigQuery with Coupler.io, so you get up-to-date reporting without any of that manual work.
Set up a no-code Gorgias BigQuery integration for scheduled data flow
Coupler.io is a no-code data integration platform and AI analytics solution. It automatically pulls data from 400+ sources, including Gorgias, to BigQuery on a chosen schedule, and lets you analyze numbers using AI. You can also enrich your Gorgias dataset with orders, ad spend, or website behavior from other systems to work with these figures in a single report.
You have two options to connect Gorgias to BigQuery:
- Use the Coupler.io AI agent to make the setup for you. You simply tell what you need, the built-in assistant will guide you through the setup process, and you’ll get your Gorgias to BigQuery integration ready to use.
Let Coupler AI do the data work for you
Tell Coupler AI what you need to know, from which source, and how often. It connects your account, sets up the data flow, keeps it refreshed, and lets you analyze the results inside Coupler.io or another AI tool.

- Or you can set up the data flow from Gorgias to BigQuery manually, like this:
Step 1: Collect data from Gorgias
First, click Proceed in the form below to get started with Coupler.io for free, no credit card required:
Next, connect your Gorgias account. For this, you need to provide:
- Username (your email) – the email address associated with your Gorgias account. Find it under Settings → You → REST API.
- Password (API key) – your REST API key (not your login password). It’s in the same place: Settings → You → REST API.
- Domain name – your account subdomain only. For example, if your Gorgias URL is
https://coupler.gorgias.com/, entercoupler.
Once connected, choose the Data entity to export, such as Accounts, Customers, Tickets, Custom fields, and so on.
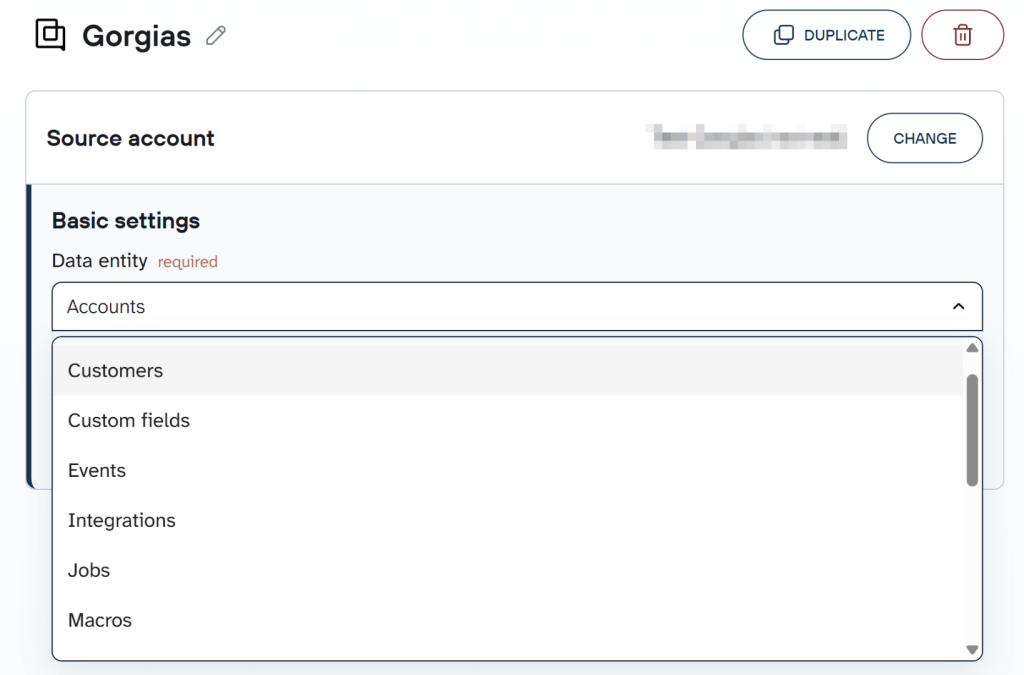
Proceed, and if needed, add sources to the same data flow: connect more data entities, Gorgias accounts, or other apps. Just a reminder that Coupler.io supports over 400 BigQuery integrations. So, you get one dataset for reporting instead of separate exports.
Step 2: Organize your Gorgias data set
Raw Gorgias data comes with nested fields, internal IDs, and metadata that don’t mean much outside the helpdesk. Coupler.io lets you clean this up before you run the data flow, so the table lands ready to query instead of needing a cleanup pass in BigQuery itself:
- Hide or remove columns. Drop internal IDs, raw JSON blobs, or fields like
viaif you only need channel, status, and resolution time. - Rename or rearrange columns. For example, rename
created_datetimetoCreated Atand moveStatuscloser to the front so the table reads clearly in BigQuery. - Filter or sort the data, e.g., show only tickets opened in the last 90 days, exclude spam-flagged tickets, or arrange data by
Resolution Timedescending to spot slow cases first. - Aggregate data, like counting tickets per
Assigneeto see workload distribution, as well as other statistical functions: sum, average, min., and max. - Add calculated columns, such as a
Resolution Hourscolumn by subtractingcreated_datetimefromclosed_datetime. - Combine data, say you can merge Gorgias ticket tags with Shopify order IDs to link a support conversation back to the order that triggered it.
You apply any of the actions above once in the data flow, and every scheduled refresh after that runs the same automatically. When your data is all set, move forward.
Step 3: Load data to BigQuery
Now you’re ready to connect your Google BigQuery account. First, generate a Google Cloud JSON key. These instructions walk through that process, which runs through the Google Cloud console rather than Coupler.io itself.
When BigQuery is connected, specify the dataset and table where Coupler.io should export the data. You can type in new names to create a fresh dataset or table on the spot. Toggle on Autodetect table schema so Coupler.io structures the columns correctly on import.
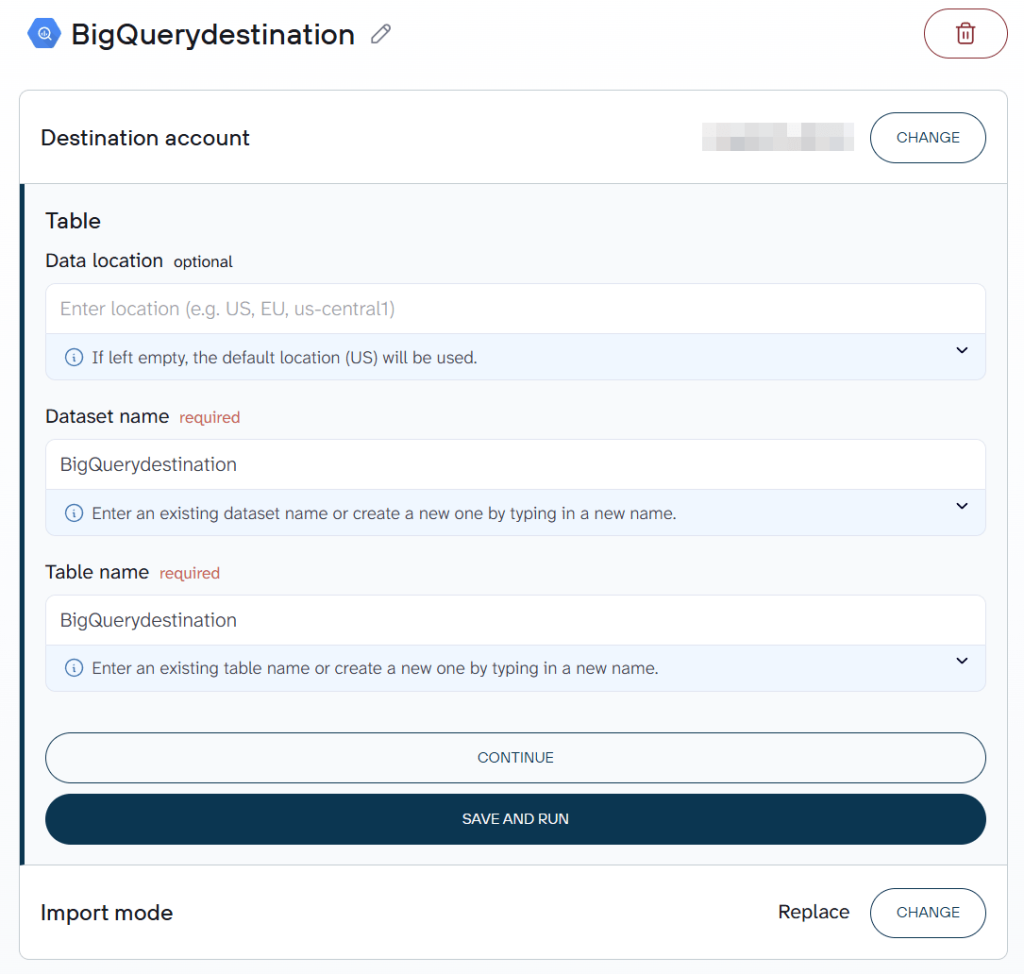
Additionally, you can change the import mode – replace or append – if needed. On the first import, it won’t matter. On scheduled refreshes, it will:
- Replace – swap the old Gorgias dataset with the updated version on every refresh.
- Append – add the updated version below the previous one, which helps if you want to track changes over time.
If BigQuery isn’t the only place you want to send your Gorgias data, you don’t need a separate flow for that. Add other destinations, like Google Sheets, Google Data Studio or AI tools, to the same data flow, configure the settings for each, and Coupler.io delivers the same dataset there as well.
Next, enable Automatic data refresh to sync Gorgias data to BigQuery without further manual intervention. Set the schedule with a minimum frequency of every 15 minutes.
Make sure you click Save and run. Only then does Coupler.io automatically export Gorgias data to BigQuery.

Sync Gorgias data to BigQuery on schedule
Get started with Coupler.io for freeBonus: Coupler.io’s AI Agent
To analyze your Gorgias dataset using AI but without exporting it to BigQuery or any other external tool, do it right in Coupler.io’s AI Agent. It’s a conversational assistant built into Coupler.io that works with one click on the data you’ve already connected. So you can ask questions about your Gorgias figures without leaving the dataflow you’ve just created in Coupler.io. For example, type in How many tickets did we get last week? or What’s our average CSAT this month? and get a response right in chat.
Load Gorgias tickets into BigQuery with Coupler.io
Get started for freeWhat data can you load with Coupler.io’s Gorgias BigQuery connector?
Here are some of the data entities you can pull from Gorgias to BigQuery:
- Tickets – the core record of a customer’s support request, tracking the full communication history and status.
- Messages – individual messages that make up a ticket, such as emails, chats, and social messages.
- Accounts – the top-level Gorgias account, including key settings for your help desk.
- Customers – customer profiles, as well as contact information and interaction history with your support team.
- Events – activities inside Gorgias, like a ticket being created, a message being sent, or a status being changed.
- Satisfaction surveys – CSAT data collected from customers after a ticket closes.
- Tags – labels used to categorize and organize tickets.
To see the full list of data entities available for export with Coupler.io, visit the Gorgias data connector page.
Blend Gorgias data with other information
Helpdesk data means more when you connect it to what happens around it: orders, ad spend, website behavior, or email engagement. A ticket count on its own tells you support is busy. The same ticket count next to order volume, ad spend, or a site outage tells you why.
With Coupler.io, you can bring Gorgias tickets into the same BigQuery dataset as your e-commerce, marketing, and analytics data. Learn more about data blending and data transformation here.
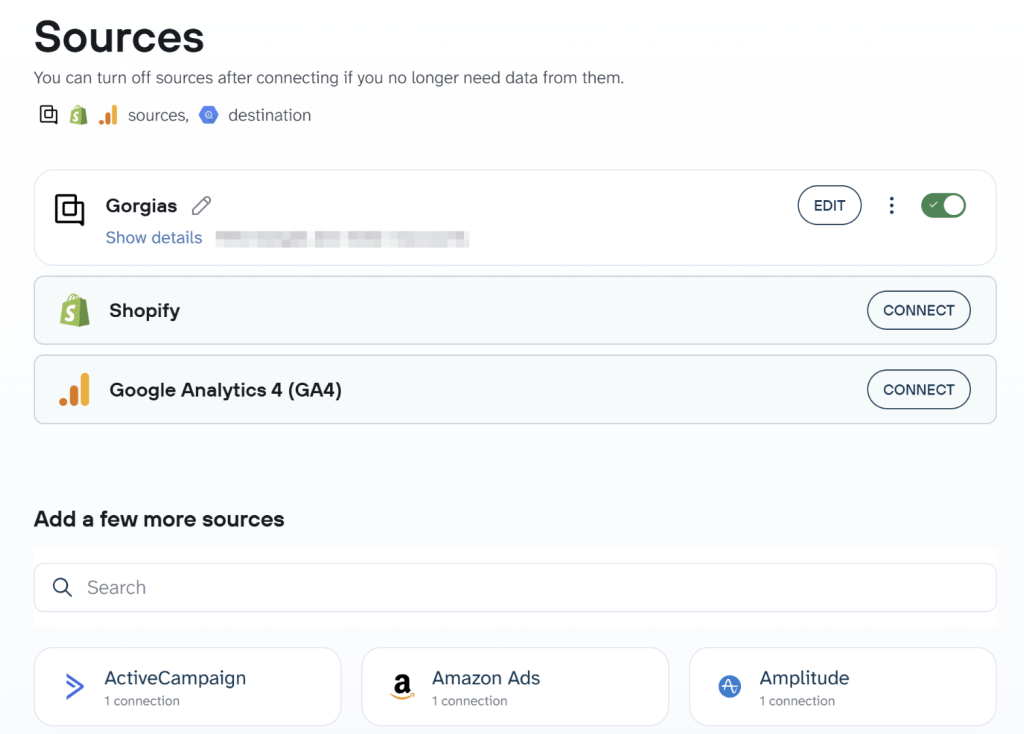
Explore a few ways teams enrich Gorgias data with records from other apps:
Connect support tickets to orders and revenue
Combine ticket data (volume, tags, resolution time) with Shopify order history to see which products or order issues drive the most support requests, and how support quality affects repeat purchases and refunds. If tickets tagged “damaged item” cluster around a specific SKU, that’s a fulfillment problem showing up in your support queue before it shows up anywhere else.
Later, you can use this data set for your ecommerce dashboard in Google Data Studio, Power BI, or even connect BigQuery to AI for conversational analysis.
Link website behavior to support ticket spikes
Blend GA4 session and page-level data with Gorgias ticket timestamps and tags to check whether traffic surges, site errors, or checkout drop-offs line up with jumps in support volume. A spike in “where’s my order” tickets right after a traffic surge often points to a fulfillment bottleneck rather than a support staffing problem.
Evaluate true customer acquisition cost, including support load
Merge ad spend and campaign data with Gorgias ticket volume and CSAT by customer source. This shows which acquisition channels bring in customers who need more (or less) support, which sharpens a channel’s real cost beyond CPA alone. A channel with a low CPA but a high support-ticket rate per customer may cost more overall than the acquisition report suggests.
Combine email engagement with customer satisfaction
Join Klaviyo email engagement metrics with Gorgias CSAT and ticket history to segment customers by satisfaction scores and marketing responsiveness. This is useful for building win-back, or loyalty flows that account for support experience, not just email opens. A customer with a poor recent support experience is a weak target for a “come back” campaign, no matter how often they open emails.
Where else can you pull Gorgias data besides BigQuery?
BigQuery is one destination among those that Coupler.io supports. The data collection and organization steps described above work regardless of where the data ends up. So switching or adding destinations later doesn’t mean rebuilding the flow from scratch. You can connect multiple destinations to the same data flow, and Coupler.io delivers the same Gorgias dataset to all of them on the same schedule.
Here’s where you can load your Gorgias data, except BigQuery:
- Spreadsheets: Google Sheets, Microsoft Excel – best for small teams that want a simple place to review Gorgias data.
- BI tools: Power BI, Looker Studio, Tableau, Qlik – useful for building dashboards and tracking support metrics.
- Databases and data warehouses other than BigQuery: Supabase, Snowflake, PostgreSQL, Redshift – when you need scalable querying of data from Gorgias.
- AI tools: Claude, ChatGPT, Gemini, Perplexity, Copilot, and others – to run deeper analysis that goes beyond quick questions and answers in Coupler.io’s AI Agent.
- Other destinations: monday.com, JSON, etc. – for automated workflows built around these specific apps/formats.
Pro tip: If your team is still deciding between a spreadsheet and a warehouse, a rough rule of thumb is that spreadsheets work fine for one team checking numbers casually. But a warehouse like BigQuery makes more sense once several tools or teams need to query the same support data.
Blend Gorgias with ecommerce, analytics and other data with Coupler.io
Get started for freeWhat are other export methods or ways to connect Gorgias to BigQuery?
Coupler.io automates Gorgias-to-BigQuery dataflows on a schedule, which works best when you need recurring updates and want to avoid manual exports or custom code. But if you only need a one-off export or your team has the engineering resources to build and maintain a pipeline of its own, two alternatives exist: manual CSV export and custom API integration. Below, you’ll find when each one works and what to know before choosing it.
Alternative method 1: Manual CSV export
Gorgias lets you export ticket data as a CSV directly from the interface, without writing any code. Full instructions are in Gorgias’s own documentation.
This method makes sense when:
- You need a one-time export for a specific analysis, not a recurring report
- You only need ticket metadata, not the full message history
- You’re testing what a BigQuery table of Gorgias data should look like before automating anything
- Your team has admin, lead, or owner access in Gorgias (export permissions are limited to those roles)
Here’s what it looks like: From your Gorgias inbox, you select the view that contains the tickets you want. Next, check individual boxes or check the header row to select every ticket on the page, then choose whether to include all tickets in the view. Run export, and Gorgias emails you a download link once the file is ready. Save that file and upload it to BigQuery.
The exported CSV includes ticket metadata and links back to the tickets, but not full message content unless you export from an analytics drill-down instead of a standard view. If you need message history, Gorgias also supports drilling into a metric report and exporting from there, which includes the message thread alongside the same metadata fields.
Only the account owner, admins, and leads can run exports, so if you’re on a smaller plan or a limited role, check permissions before you build a recurring process around this method. The download link that Gorgias emails you also expires after 14 days, which matters if you’re archiving exports rather than loading them somewhere immediately.
The catch: there’s no scheduling, so “data refresh” here means repeating these steps by hand. Every repeat risks a duplicate row or a gap if someone forgets a step, changes the view filter, or leaves the company and takes the process knowledge with them.
Alternative method 2: Custom API integration
The Gorgias REST API gives you full programmatic access to tickets, messages, customers, and more, which means you control exactly what gets pulled and how it’s shaped before it reaches BigQuery. This route uses two APIs together: once you pull ticket data from the Gorgias API, BigQuery REST API is used to load it into BQ.
I would only recommend this if your team already writes and maintains scripts, and someone is willing to own the data pipeline long-term. It gives you full control over the exact fields, schema, and logic used. This method works well if you need custom logic that a no-code tool doesn’t support, like joining ticket data with an internal system Coupler.io doesn’t connect to, or applying unstandard business rules.
The process is as follows: You connect to Gorgias with API credentials, pull ticket data from the API, and flatten the nested response into separate tables before loading it into BigQuery. If you prefer, you can route the data through Google Sheets first, then let BQ read it from there through a scheduled load or a Sheets-linked table. You still need Google Cloud access, scheduling, and retry logic to keep the pipeline running automatically. This approach works when you need custom logic or a source that a no-code tool doesn’t support.
The trade-off of this method is ongoing maintenance: rate limits change, and API versions get deprecated. Plus, someone on your team has to own the script when it breaks, usually at the worst possible time, like the morning a report is due.
What to do with Gorgias data in BigQuery?
Gorgias-BigQuery integration itself is a matter of setup, but its value shows up once you start querying your connected data in BQ. Here are four examples below that don’t need a data engineer to run. They’re standard SQL against a table that Coupler.io already refreshes on schedule, which means the query only needs to be written once. After that, the same query pulls current numbers every time someone runs it.
The following SQL examples assume you’ve imported and, where necessary, transformed your Gorgias data into analytics-friendly tables and column names.
Analyze agent performance and workload distribution
Query ticket assignment, resolution speed, and CSAT by agent to spot training needs, balance workloads more fairly, and set KPIs based on actual numbers instead of gut feel. A practical starting query could look like this:
SELECT
  assignee_id,
  COUNT(*) AS ticket_count,
  AVG(resolution_hours) AS avg_resolution_hours,
  AVG(csat_score) AS avg_csat_score
FROM tickets
WHERE created_at >= DATE_SUB(CURRENT_DATE(), INTERVAL 1 MONTH)
GROUP BY assignee_id
ORDER BY ticket_count DESC;
This shows who is handling the most tickets and whether speed or satisfaction is slipping for any specific agent.
Spot recurring issues and product pain points
Aggregate ticket tags and message content over time to surface the most common complaint categories. Grouping by tags over a rolling 30-day window shows whether a specific issue, like a shipping delay or a broken checkout step, is spiking or fading. For example:
SELECT
  tag,
  COUNT(*) AS ticket_count
FROM tickets
WHERE created_at >= DATE_SUB(CURRENT_DATE(), INTERVAL 30 DAY)
GROUP BY tag
ORDER BY ticket_count DESC;
Measure the revenue impact of customer support
Perform customer support analytics on Gorgias’s revenue-attribution data, like Convert, alongside ticket data in BigQuery to see how support interactions affect revenue, not just how many tickets got closed. A query could join tickets with orders by customer_id and compare refund rate, repeat purchase rate, or revenue tied to specific issue types.
SELECT
  t.issue_type,
  COUNT(*) AS ticket_count,
  AVG(o.refund_amount) AS avg_refund_amount,
  AVG(o.repeat_purchase_flag) AS avg_repeat_purchase_rate
FROM tickets t
JOIN orders o
  ON t.customer_id = o.customer_id
WHERE t.created_at >= DATE_SUB(CURRENT_DATE(), INTERVAL 90 DAY)
GROUP BY t.issue_type
ORDER BY ticket_count DESC;
As a result, you see whether certain support cases are linked to higher refund risk or lower repeat purchasing.
Forecast ticket volume and staffing needs
Use historical ticket volume in BigQuery to spot seasonal patterns and plan staffing before a surge hits. For instance, group tickets by day or week, then compare the current period with the same period last year, or feed that history into a forecasting model.
SELECT
  DATE(created_at) AS ticket_date,
  COUNT(*) AS ticket_count
FROM tickets
WHERE created_at >= DATE_SUB(CURRENT_DATE(), INTERVAL 180 DAY)
GROUP BY ticket_date
ORDER BY ticket_date;
That gives you a clean time series you can use for trend analysis, weekly staffing checks, or a forecast model in BigQuery ML
Connect 400+ sources to BigQuery with Coupler.io
Try Coupler.io freeKey challenges in connecting Gorgias to BigQuery
Gorgias doesn’t offer scheduled exports to BigQuery natively, so teams fall back on manual CSV downloads and re-uploads every time they need current numbers. Multiply that by every recurring report a support or ops team runs, and it adds up to hours nobody accounted for in the first place.
Additionally, repeated exports often result in duplicate rows or missed updates, which makes historical reporting unreliable over time. A missed weekly export means a gap in the trend line that’s easy to miss until someone asks why last month’s numbers look wrong.
✅ Solution: Use Coupler.io to automate the entire Gorgias-BigQuery pipeline on a schedule you set, so nobody touches an export button again. Data in BQ is continuously updated, which prevents both duplication and data drift.
Gorgias’s API is complex, rate-limited, and deeply nested
Ticket data comes with nested messages, tags, and custom fields that are hard to flatten into clean, queryable tables. Hit the Gorgias API’s rate limits, and a DIY script can break mid-sync, usually without a clear alert that anything went wrong.
✅ Solution: Coupler.io handles most of the operational pain in a standard Gorgias-BigQuery data flow. You can prepare and deliver clean, structured reports directly into BQ, without writing flattening logic or handling 429 errors yourself.
The more Gorgias accounts, the more operational overhead
Agencies or multi-brand businesses with several Gorgias accounts often end up with fragmented data across separate tables, since each account exports independently and rarely on the same schedule.
✅ Solution: With Coupler.io, you can connect multiple Gorgias accounts into a single, unified BigQuery dataset, so reporting doesn’t depend on stitching files together by hand.
Enterprise ETL/ELT tools pricing is overkill for the Gorgias-to-BigQuery pipeline
Tools like Fivetran or Stitch charge pricing that’s hard to justify when all you need is one reliable Gorgias-to-BigQuery flow rather than a full enterprise data stack covering dozens of systems.
✅ Solution: In Coupler.io, pricing is more based on connected accounts than on data flow, so, for example, setup with one Gorgias account and one BigQuery destination stays more predictable.
It still takes analyst time to turn raw ticket data into insight
Clean tables don’t answer questions by themselves. Someone still needs to write the query, build the chart, and interpret the number for whoever asked. That person is usually the same analyst everyone already goes to for every other question.
✅ Solution: Coupler.io’s AI Agent is a conversational assistant that lets you chat with your data in plain language. So basic questions about ticket volume or CSAT don’t need a SQL query first.