Modern businesses tend to stray away from SAP-like powerhouses capable of doing virtually anything. Instead, they opt for using many different apps that may not be as powerful but in their particular niche, they’re among the best on the market. It gives them flexibility and efficiency but also leads to their data being spread across many different apps and accounts, with seemingly no obvious way to merge it.
This is when data stitching comes into the picture. But what is it, really? How is it relevant for your businesses? And where to get started? Read on as we answer these and many other questions. Or you can spend a couple of minutes watching our video about data stitching at Coupler.io.
What is data stitching?
Data stitching is the process of combining different sets of related data into one common destination. There, the data can be merged, aggregated, summarized, and processed in many different ways. The end goal, most often, is deriving valuable insights, building extensive customer profiles, or merging data from different business entities into a single report.
Marketing professionals, for example, can be interested in pulling data from all their channels and merging it all together for a general report. Accountants, on the other hand, would gladly combine reports from the different business entities they manage into a single destination. The use cases can vary and we’ll talk more about them in the following chapters.
While data stitching can be done manually by simply exporting data from apps regularly and uploading that into Excel, for example, it’s not feasible at all on a larger scale. Luckily, there are a number of tools capable of stitching the data from the apps you use on an automated basis, with little or no coding necessary. We’ll get to those in the Top data stitching services chapter.
Why is data stitching important?
While stitching data may seem like a nice addition, for many professions it has become nearly a necessity. Without it, they’re missing out on tons of valuable information and end up misinterpreting facts or guessing more often than they would like to.
To understand why, let’s look at a simple example. Marketers crave any information they can get about their customers. They want to know about every touchpoint, every click on an ad or a button, every interaction with their website, and so on. All this information is somewhere but it’s spread across different apps or accounts.
A potential customer, let’s name her Jane, clicks on a Facebook ad that pops up on her wall. Jane checks out the landing page an ad leads to, reads more about a business, and then leaves. A few days later Jane types in the website address one more time but this time on her mobile phone. She explores a bit further and eventually makes a purchase.
Many Janes later, the team looks at the data for each channel separately. Checking their Facebook Ads account, they see a very low conversion from that ad running lately so they decide to discontinue it and focus their efforts elsewhere. Meanwhile, Jane and many like her continue using the product thanks to that very ad they saw on Facebook.
Stitching data from Facebook Ads and Google Analytics would allow the marketing team to connect both visits and correctly attribute the user acquisition to the social media platform. The metrics they rely on would have looked differently and so would likely their business decisions.
Common use cases for data stitching
Data stitching isn’t reserved exclusively for marketers. Accountants, analysts, product or HR managers, or C-level executives constantly operate on data. Very often, they can greatly benefit from consolidating it into a meaningful dataset.
For example, accountants frequently manage different business units of the same organization and have to operate on multiple accounts in QuickBooks, Xero, or any other tool. Although these business units run separately, they often make sense to be analyzed as a whole.
A data-driven accountant would fetch a specific report from each business unit – for example, a profit & loss report. Rather than have separate reports in different Excel tabs, they could stitch that data together right away with a capable tool. This would allow them to analyze the profits and losses for the entire company at once. They could perform data aggregation, insert the results into the existing formulas, and compile reports with little to no manual work on their side.
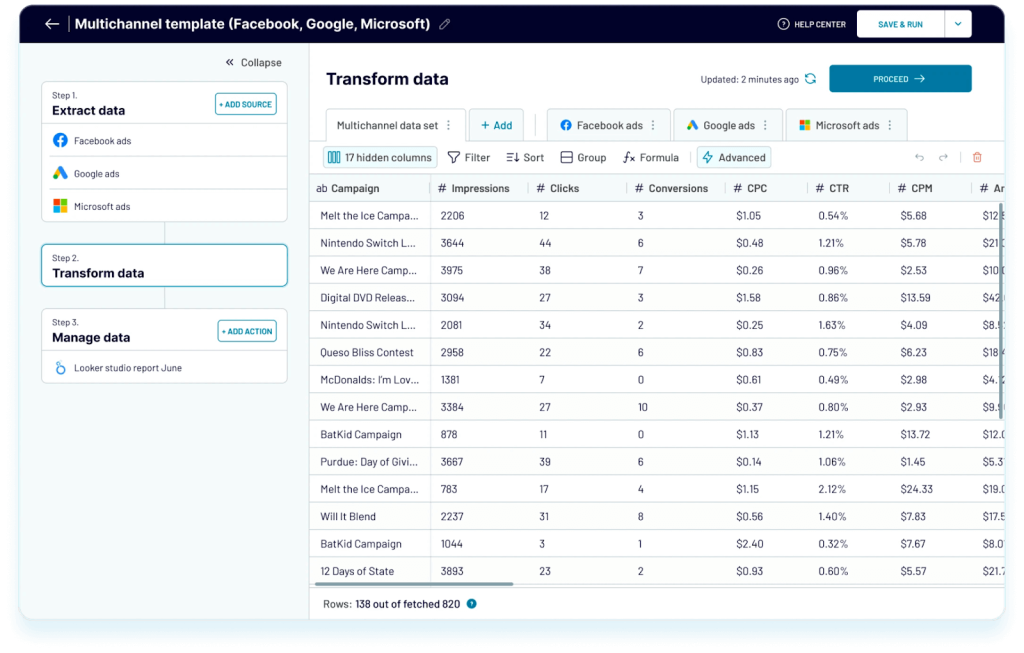
Advertisers rarely limit themselves to just a single channel. Quite opposite – they often run their ads across many different platforms and constantly search for new opportunities to expand their reach. This creates a lot of data in each tool they use.
Many advertisers find it handy to be able to pull all data into a single place – for example, a Google spreadsheet. While each platform differs, they all share common metrics too – impressions, clicks, CPC, CPA, etc. Stitching advertising data into a single fine makes it easy to compare channels, ad groups, and even individual ads running across different channels.
Stitching data is also invaluable for anyone working with spreadsheets on a daily basis. Often, their data is spread across different accounts and hundreds of files and tabs in each. Collecting, for example, expenses from all departments into a single spreadsheet becomes time-consuming and prone to error.
Data stitching solves such problems by automatically pulling the designated data from any file, without even the need to share such files between users. Simultaneously, the stitching software transforms the data into a logical, easy-to-digest format. In this particular example, it could be the list of expenses from all departments imported into a single table for easy processing.
Typical data sources for data stitching
In theory, it’s possible to stitch data from whichever tool you use, as long as the data is exportable. However, some data sources are more commonly used than others, mainly because they can provide meaningful context to the other data you stitch them with.
Marketers rely heavily on analytical data about their leads. Commonly, they use Google Analytics or similar tool to track website visitors. They want to know how users ended up on the website in the first place (traffic sources), how they interacted with it (behavioral data), and how they did towards completing the designated goals (conversions).
Website analytics can be stitched together with the product usage analytics coming from GA, Mixpanel, or plenty of other tools. Connecting the two opens the way to recreate an entire user journey, from the moment they learned about a product until they have settled for a long-term subscription.
Data stitching is often an excellent idea for places online where users use their email addresses. It could be lead generation tools, support channels, online forms, email marketing platforms, and others. Gathering data on every interaction a user had with a brand can help personalize their experience and avoid possible misunderstandings (such as reaching out with a question that has already been asked before).
Outside of marketing, the choice of automated reporting tools can very much differ. Anyone working with financial data will gladly export the relevant reports from the likes of QuickBooks or Xero and try to marry it with the data from payment processors (e.g. Stripe or PayPal) or subscription-monitoring platforms (like ProfitWell). Product managers, on the other hand, will gladly pull their project details from Jira and mix them up with time-tracking data coming from the likes of Harvest or Toggl.
Ultimately, stitching data doesn’t necessarily mean combining data from different apps. Many successful use cases rely on integrations within the same app – blending financial reports together, merging multiple Excel workbooks into one, combining reports from different accounts into a joint summary, and many more.
Top data stitching services
There aren’t all that many tools on the market capable of doing proper online data stitching. Here are our top picks.
Coupler.io
Coupler.io is a data analytics and integration platform that automatically imports data from the sources of your choice. The data is imported into a spreadsheet (Excel, Google Sheets) or a data warehouse (BigQuery) on the schedule you choose – monthly, daily, hourly, or even every 15 minutes.
On top of importing data, Coupler.io is capable of stitching matching data into a single destination file. For example, you can choose to automatically pull a certain report from the accounting tool you manage, for each entity under your control. Coupler.io will automatically stitch all that data together so you can view it as a whole and avoid tedious copy/pasting from one account to another. See how it works in the next chapter.
Coupler.io subscription plans start from $24/month. It also offers a free plan and a 7-day free trial on the Team plan to try the tool first.
SheetGo
SheetGo is a workflow automation platform that allows you to automatically move data between your spreadsheet and data warehouse. Through that, you can eliminate almost all of the manual work and focus that time on deriving insights from your data. The supported apps include Google products (Sheets, BigQuery, Docs, Gmail), as well as Excel.
SheetGo also allows for stitching data between either of the supported apps. You can pull data from the same source (e.g. multiple spreadsheets) or from a mix of apps. As long as the column names match, the data will be combined in a destination file.
SheetGo offers a limited free plan. Paid plans start from $20/month, free trial is available.
Salespanel
Salespanel is a tool for salespeople for monitoring, understanding, and qualifying leads. The platform calls itself a Google Analytics alternative for B2B. It offers a similar type of website analytics as its better-known competitor but is naturally more customized for the sales audience.
Salespanel offers tracking both on the websites and inside of cloud-based products. They stitch together all data they’re able to accumulate on a particular user to give you a clear overview of how they got to know the product, how they interact with it, and which features they’re interested in the most. This, as a result, can help salespeople convert more leads with a personalized approach.
Salespanel plans start from $149/mo, 14-day free trial is available.
Stitch
Stitch, also known as Stitch Data, is an ETL platform. It extracts data from over 130 sources, imports it into a data warehouse of your choice, and makes it easy to connect the data to BI tools for advanced visualization.
Stitch, despite its name, doesn’t do data stitching per se. Users set up automated raw data imports from the supported source apps – for example, Facebook Ads. Once the data is loaded into a data warehouse, it’s up to you to stitch the relevant data together into meaningful datasets. Such an approach gives more flexibility but creates the need for additional work.
Stitch plans are available starting from $100/month, with a free trial available.
Data stitching – case study
Now let’s see some data stitching in practice. In this particular scenario, we’re going to work with Jira and Google Sheets.
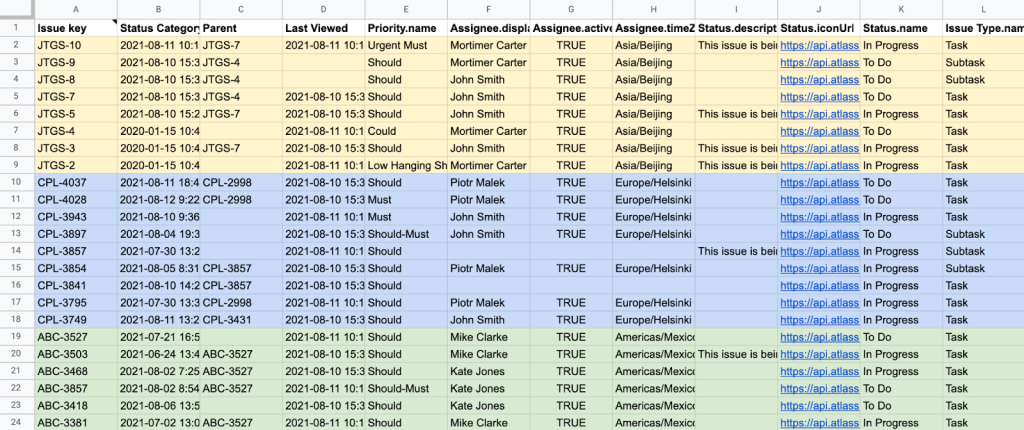
Imagine you’re a senior manager at company X. The company uses several Jira Cloud instances for managing its businesses in Europe, North America, and Asia. Just so it happens, there are some key projects running in each business unit that you need to keep track of. You decide to use Coupler.io to automatically export tasks meeting specific criteria and stitch them together into a single Google Sheets tab.
The result will look just like this:
Here’s how to do it yourself, step-by-step:
- Sign up for a Coupler.io account for free with no credit card required.
- Click the Add Importer button. Pick the Source and Destination app to create a data connector. In our case, it’s Jira and Google Sheets, respectively. Or you can select your source and destination apps in the form below and try the tool right away.
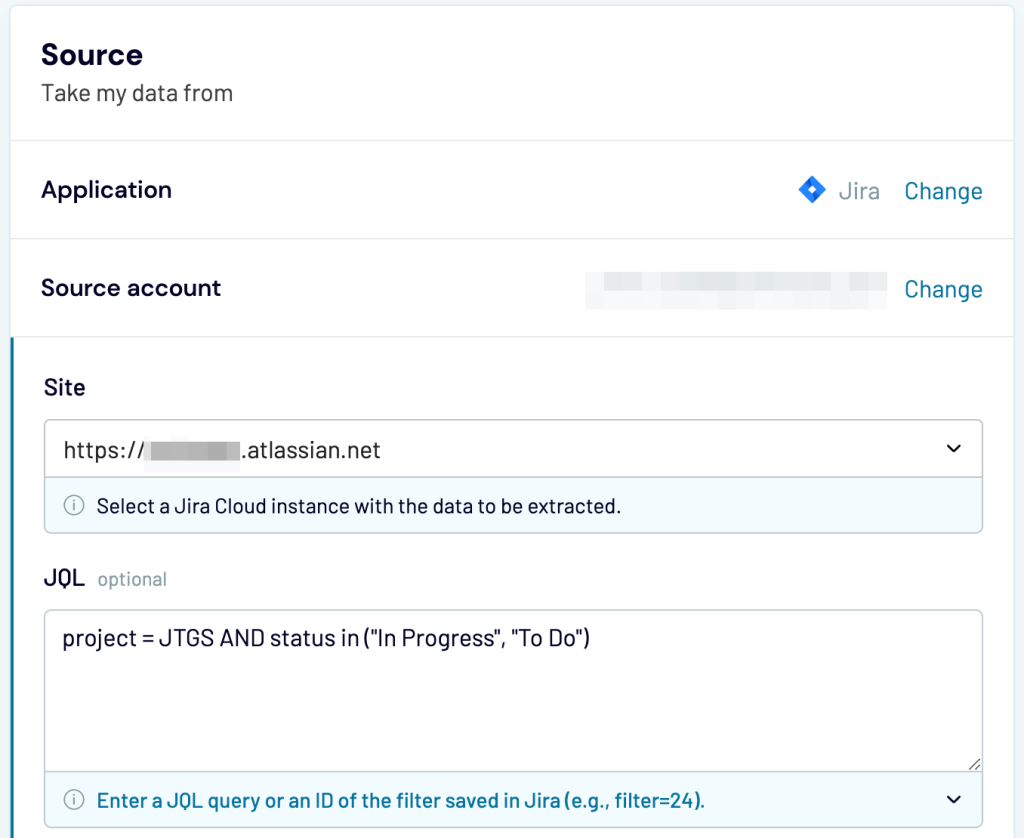
- Click the Connect button and connect your Jira account. Then, pick the Site you want to import the data for and, optionally, specify the filtering criteria. In our case, we want to fetch tasks with the status “To Do” or “In Progress” from the project abbreviated as JTGS.
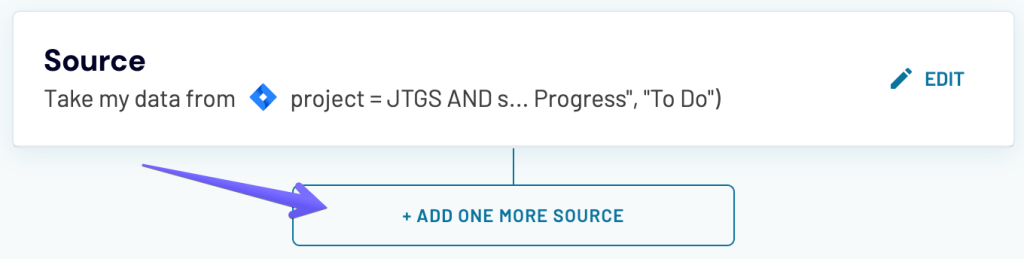
- Now, you could go on, set up a destination and import the data from this project but the idea here was to stitch the data from several projects right away. So let’s do it. Click the Add One More Source button.
- An identical window will open where you can choose to import data from another source – for example, from another Jira project. You could choose to import instead from another app, for example, HubSpot or Airtable, but mixing apps like that would only make sense if at least some of the column names are present in both sources. Learn how this works in detail in our knowledge base.
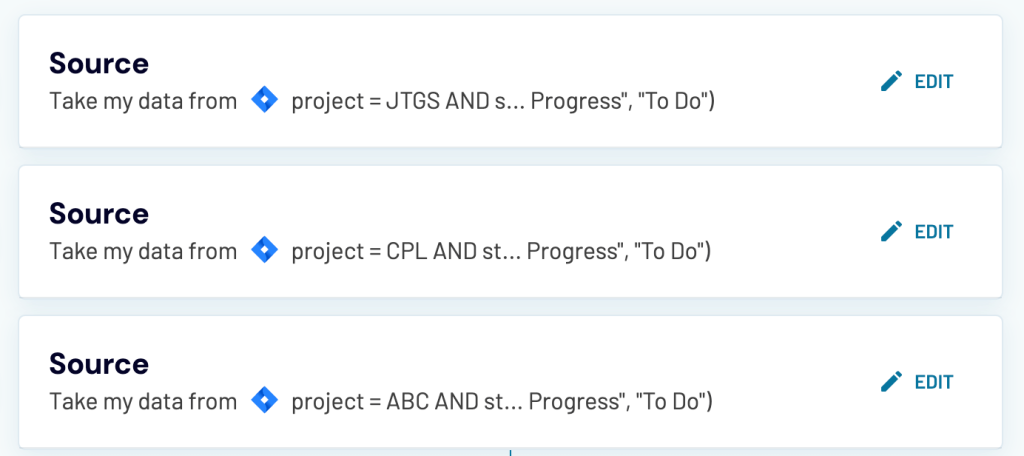
- We’re only interested in the data from Jira so we set up three separate sources, each pulling the data from a different project on a different Jira Cloud instance.
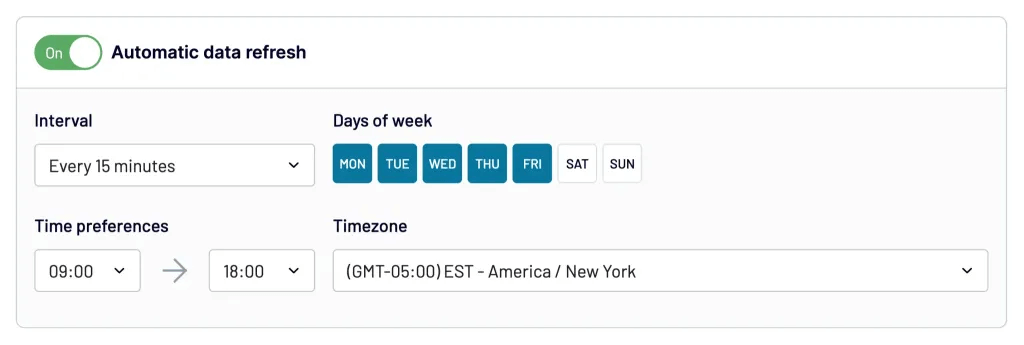
- Finally, we set up a destination for our data, choosing a Google spreadsheet and tab for our data. At this point, we can launch an importer but it’s usually worth setting up a schedule for data refreshes. This will lead to data refreshing at the schedule you choose – for example, every morning. When new tasks pop up or the existing ones are changed, changes will be reflected in your Google Sheets file on the next refresh.
- Click the Save and Run button.
The importer will run for a short bit and will then redirect you to the tab with your import. Here, you can see the tasks from each of the projects imported and colored accordingly.

Note: The data imported isn’t all that colorful out of the box. We used conditional formatting in Google Sheets to automatically color rows based on the first few letters in column A. It helps clearly differentiate one project from another but is absolutely optional.
Data stitching meaning and importance – recap
Let’s recap briefly what we discussed throughout this article.
Data stitching allows you to automatically combine data from different sources into one. Different apps can serve as sources but commonly also the same app can be used multiple times to, for example, stitch data from multiple business instances. We demonstrated that in the case study above.
Data stitching is important because it allows you to connect related data and make it more meaningful. It gives you additional context and helps you derive valuable insights that could not be that obvious when analyzed separately. However, for some purposes, combining data from different sources without stitching can also be a viable option.
Many thanks for your time.