Cross-Platform PPC Analysis: How to Unify Your Advertising Data with Coupler.io
- Looker Studio
- Power BI
- Dashboards
- Facebook Ads
- Google Ads
- Instagram Ads
- LinkedIn Ads
- Microsoft Ads
- Quora Ads
- TikTok Ads

Data fragmentation presents significant challenges to PPC reporting since ad data is scattered across multiple platforms. To create unified reports, marketers have to jump between ad managers, export CSVs, and manually consolidate data. Data blending tools like Coupler.io enables you to eliminate this tedious and time-consuming routine and achieve an efficient reporting workflow.
Two reasons why you need to unify data from advertising sources
Unified performance analysis
As a PPC expert, you understand that viewing each platform in isolation creates significant blind spots. When your campaigns operate across Google, Facebook, LinkedIn, TikTok, and other channels, you need a consolidated view to truly understand customer journeys.
For example, when analyzing a B2B campaign funnel, you might see the following outcomes:
- Google Ads shows 1,500 clicks and 50 conversions
- Facebook Ads shows 2,000 clicks and 35 conversions
- LinkedIn Ads shows 800 clicks and 25 conversions
With a unified analysis, you can see that your total campaign delivered 4,300 clicks and 110 conversions. Google had the highest conversion rate (3.3%) while LinkedIn had the lowest cost per acquisition.
This unified analysis helps identify channel interaction effects, where performance on one platform influences another. For instance, you may notice that increasing Facebook Ad spend correlates with improved Google Search conversion rates two weeks later. This reveals assisted conversion patterns that platform-specific analytics would miss.
Efficient budget allocation
With expertise across multiple platforms, you’re constantly making decisions about where to allocate your next dollar of ad spend. Blended data eliminates the guesswork by providing direct performance comparisons.
Consider a scenario familiar to experienced PPC managers: You’re running a product launch campaign with a $50,000 monthly budget across four platforms:
- Platform A: $15,000 spend, 120 conversions, $125 CPA
- Platform B: $15,000 spend, 75 conversions, $200 CPA
- Platform C: $10,000 spend, 85 conversions, $118 CPA
- Platform D: $10,000 spend, 40 conversions, $250 CPA
With blended data, you can immediately identify opportunities to optimize ROAS by shifting budget from Platform D to Platform C. However, more importantly, you can delve deeper into multi-touch attribution models that reveal how these platforms interact. For instance, Platform D initiates journeys that Platform A completes. Such insights are only possible to gain with a single view of platform analytics.
For sophisticated PPC experts, blended data also enables advanced budget allocation models that factor in diminishing returns. You may discover that Platform C performs brilliantly up to a monthly spend of $12,000 but shows a declining return on ad spend (ROAS) beyond that threshold.
Blend, combine, merge…you name it
Before diving into how to actually consolidate advertising data, let’s clarify some terminology. The data world uses several terms to describe similar processes, but they have subtle differences that are worth understanding.
| Term | What it means | Example | Tools |
|---|---|---|---|
| Blend | Create connections between datasets from different sources while keeping them separate. | Show ROAS by blending Google Analytics conversions with ad spend across platforms. | Coupler.io, Looker Studio, Power BI, Tableau |
| Combine | General term for pulling data from multiple platforms into a unified view without specifying the method. | Combine Facebook Ads, Google Ads, and LinkedIn Ads data into a single report; link ad clicks to branded search behavior. | Coupler.io, Looker Studio, BigQuery, Google Sheets |
| Merge | Permanently join datasets on shared fields to create a new dataset. | Merge CRM and e-commerce data to analyze customer purchases; build a master campaign performance table. | Coupler.io, SQL, Excel, BigQuery |
| Join | Technically join tables based on matching columns (left, right, inner, etc.). | Build a full marketing funnel or multi-touch attribution model across platforms using CRM and web analytics data. | Coupler.io, SQL, BigQuery, dbt, Redshift |
| Append | Stack datasets with the same structure into a single file (adds rows). | Combine monthly Facebook Ads reports into a full-year view; unify time-series PPC data from various channels. | Coupler.io, Excel, Google Sheets, Power BI |
| Aggregate | Summarize data using functions like sum, avg, or count, usually within one dataset. | Group daily PPC data into weekly or monthly insights; segment by location or device for budget forecasting. | Coupler.io, Excel, Power BI, BigQuery, Metabase |
In this article, we use some of these terms interchangeably to describe the process of bringing together data from multiple advertising platforms.
In PPC contexts, “combining data” typically refers to creating unified reports or dashboards that pull from multiple platforms without specifying the exact technical method used.
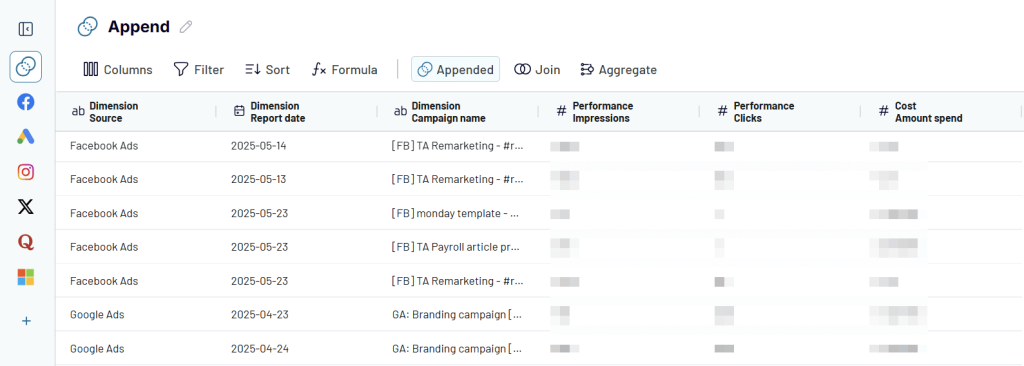
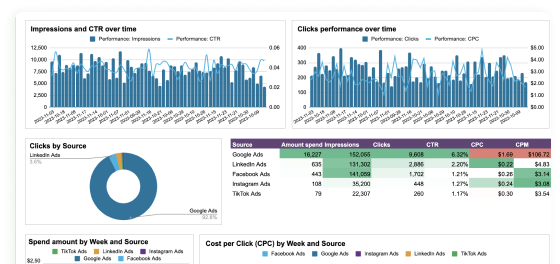
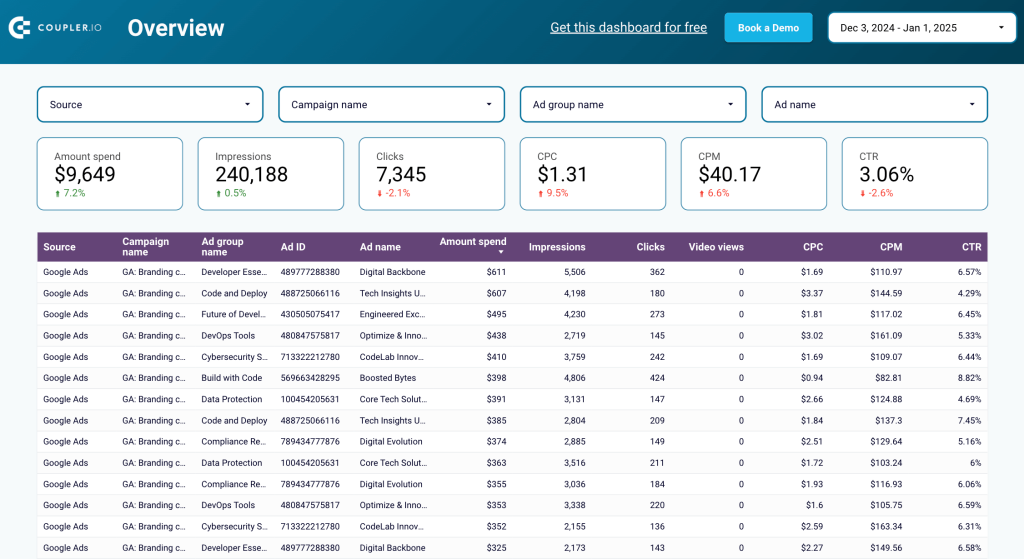
This can involve appending data from similar platforms, such as Facebook Ads, Google Ads, and LinkedIn Ads. You create a unified view of performance across all your advertising channels to compare metrics like clicks, amount spend, CTR, etc. Here is what the result looks like in Coupler.io:
Alternatively, this can involve blending Facebook Ads campaign data with information from Google Search Console to assess the relationship between ad clicks and branded keyword searches. This provides deeper insights than either platform can offer alone and reveals how users who initially engage with Facebook ads ultimately convert through your website. Again, you can easily create a unified view like this in Coupler.io.
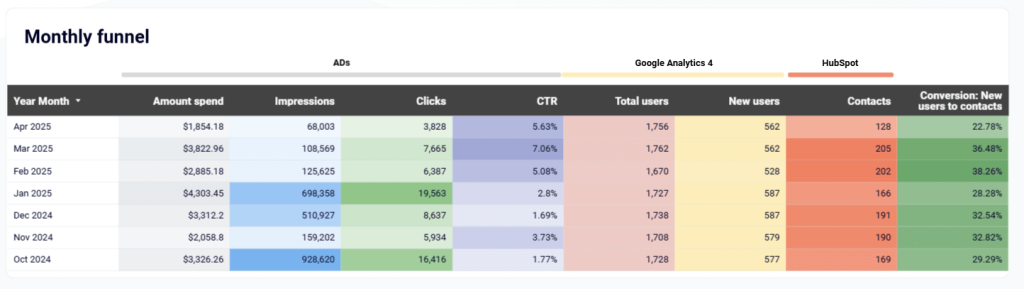
When analyzing multi-platform PPC data, you can use joins to connect campaign performance data with web analytics data or to integrate conversion data from your CRM with ad interaction data. This provides a comprehensive view of how users navigate through your marketing funnel, regardless of the platform they’re using at each stage. Here is an example of joined data in the HubSpot customer acquisition dashboard.
Coupler.io handles the technical complexities of any type of data combining. It supports over 70 data sources and allows you to unify your data loaded from multiple tools.
How to combine data from ads sources with Coupler.io
If you’re managing multiple ad platforms, you need a solution that can connect to all your data sources, perform necessary transformations, and deliver consolidated results. As an advantage, this solution must be user-friendly and accessible to users without coding skills or data engineering resources. Coupler.io is designed to address precisely these needs for PPC specialists. This data and reporting automation platform enables you to collect data from over 60 data sources, organize it into reports, and load it into spreadsheets, BI tools, data warehouses, and even ready-to-use dashboards.
In terms of PPC reporting, Coupler.io:
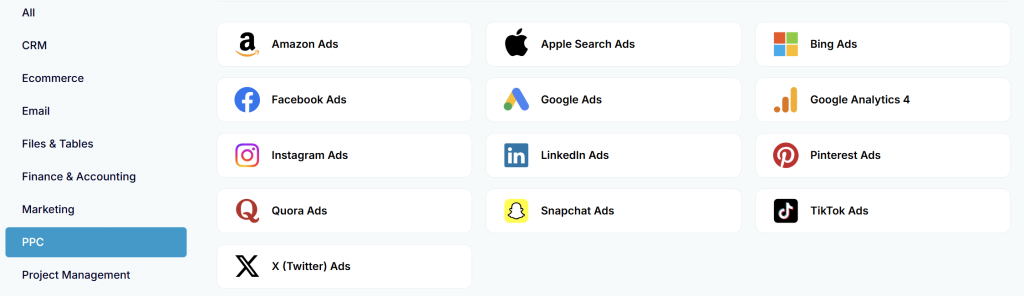
- Connects to all major advertising platforms, including Facebook Ads, Google Ads, TikTok Ads, and so on. Moreover, it enables you to enrich this data with information from Google Analytics 4, CRM apps, finance software, and more.
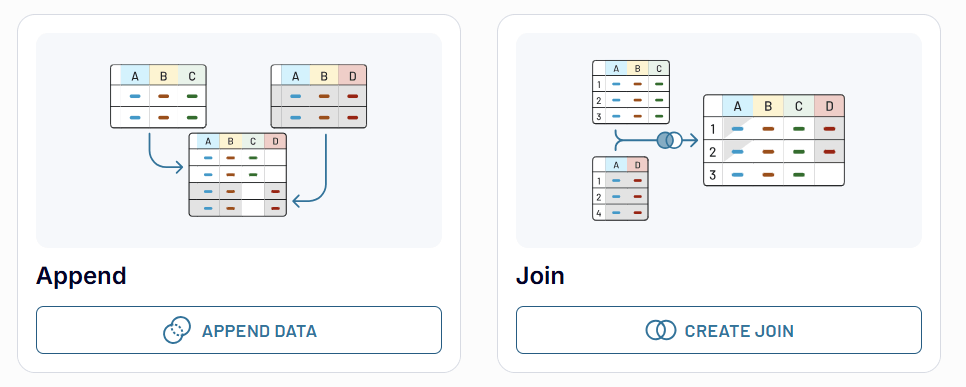
- Provides two methods for merging data from multiple sources:
- Append data to create multichannel reports.
- Join data to create cross-channel reports.
Coupler.io has a particular trump card related to data consolidation – it processes and transforms your data before it reaches visualization tools. This eliminates the timeout errors and sluggish performance (known for native blending capabilities in Looker Studio) that plague more complex cross-platform dashboards.
- Supports data aggregation to drill down into information and reduce the amount of data to export (hence costs).
- Offers predesigned dashboards and templates for single- and multi-channel PPC analytics.
When you need to combine data from multiple ad sources, use the append method. The datasets from Facebook, Google, LinkedIn, and other platforms have a similar structure, i.e., metrics and dimensions. Of course, some platform have their peculiar metrics like CPV in TikTok Ads, but still, the structure of their datasets is similar. Let’s see how you can append data from multiple ad sources with Coupler.io.
Merge data from ads sources using the append method
We’ve recorded a useful video on how to append data in Coupler.io. Feel free to check it out or read the tutorial below.
Step 1. Collect data from ads sources
Sign up for Coupler.io for free (no credit card is required) and create a new data flow.
Then you’ll need to connect all the necessary ad sources one by one. When connecting them, ensure to select the same metrics and dimensions. It’s okay if some sources have more metrics than others. You can hide unnecessary ones or create the missing ones using formulas during the transformation step.
In our example, we’re blending data from Facebook Ads, Google Ads, and LinkedIn Ads. Facebook Ads is the first platform to connect. Others will be added after it. Here is what the connection of these ad platforms looks like.
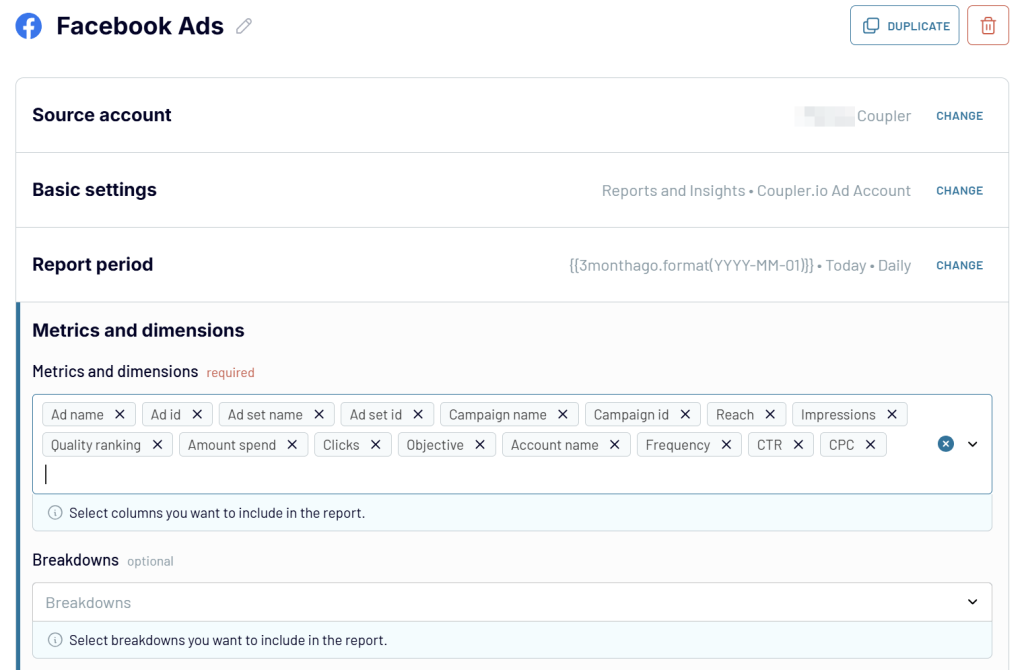
Facebook Ads
- Connect your Facebook account, select Reports and Insights as the report type, and specify the ad accounts you want to track. Coupler.io also allows you to export raw data, such as lists of ads and creatives. However, we need Reports and Insights since this report contains performance metrics.
- Specify the start and end dates for the data to collect.
- Select the columns you want to export (metrics and dimensions).
There are also optional parameters. Consider their relevancy for your reporting needs and specify the appropriate values.
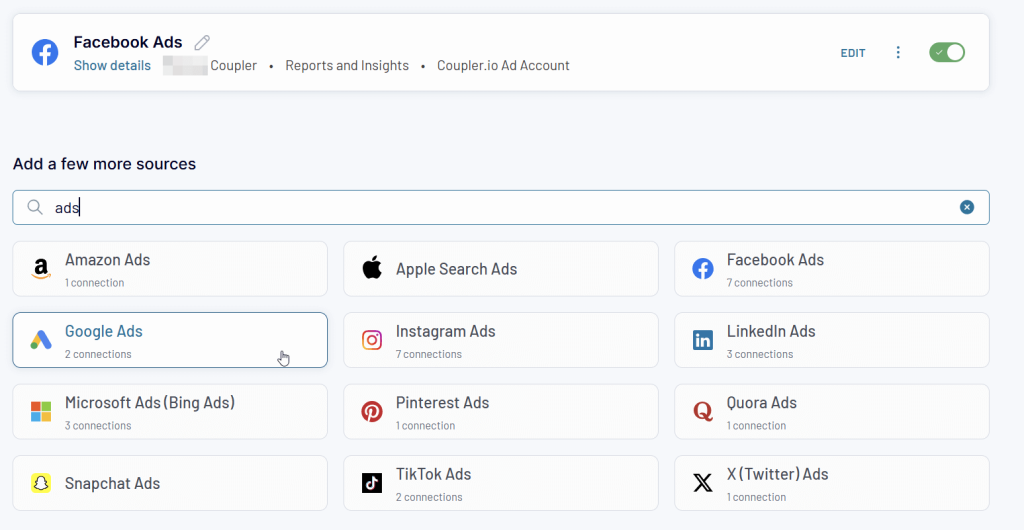
Once your first ad platform is connected, choose the next one in the Add a few more sources block. In our example, we go with Google Ads.
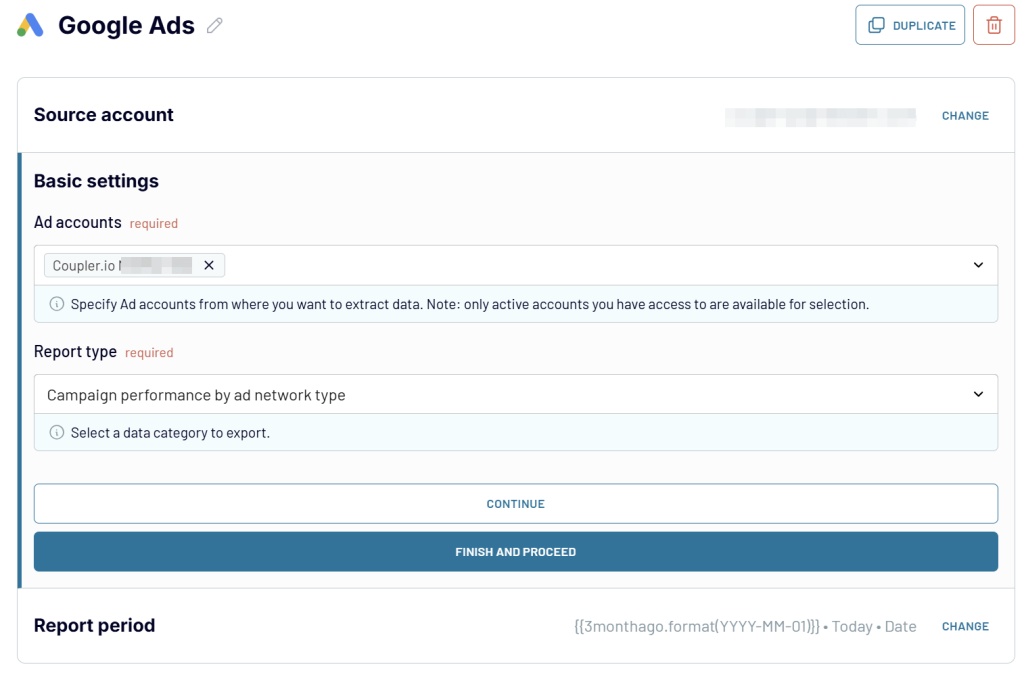
Google Ads
- Connect your Google Ads account, specify ad accounts, and choose the report type. In the case of Google Ads, reports are preset collections of metrics and dimensions. Therefore, you can’t select them one by one, as you can with Facebook Ads. But you can hide the unnecessary ones during the transformation step.
- Optionally, you can specify the start and end dates for your data.
Let’s also connect the third ad platform – LinkedIn Ads.
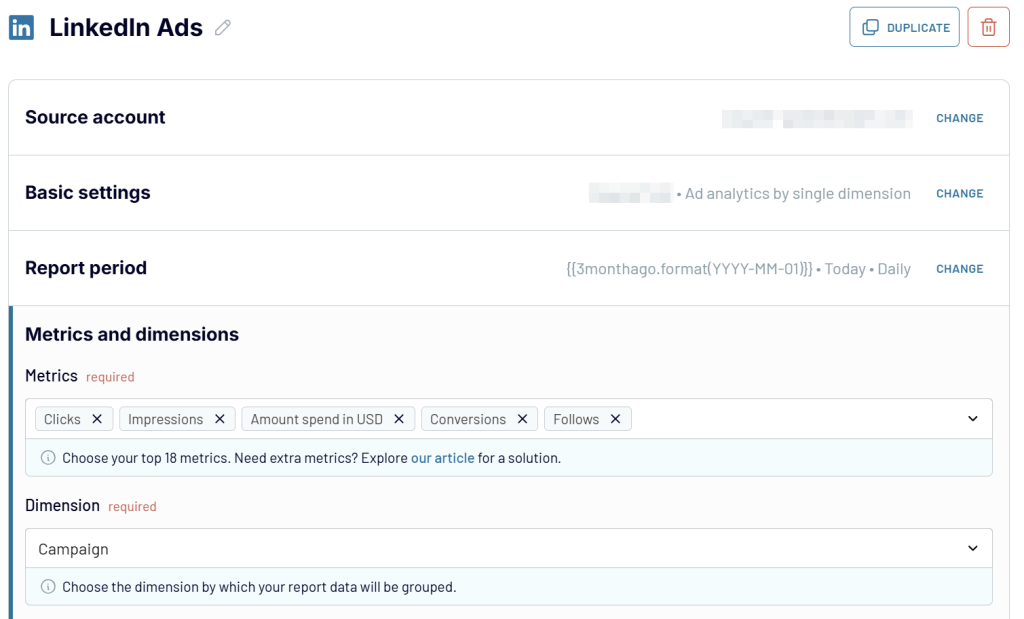
LinkedIn Ads
- Connect your LinkedIn Ads account, specify ad accounts, and choose the report type. When you blend performance data from multiple ad sources, choose either Ad analytics by single dimension or Ad analytics by multiple dimensions. The connection flow for LinkedIn Ads is similar to that of Facebook Ads, as you’ll be able to choose the metrics and dimensions later.
- Specify the start and end dates for the data to collect. Choose how to split data (by day, month, or year).
- Select the metrics and dimensions you want to export
With all the necessary ad sources connected, proceed to the Transformations step, where you can actually blend data.
Step 2. Transform and append data from ad sources
Coupler.io preloads data from the connected ad platforms as separate datasets.
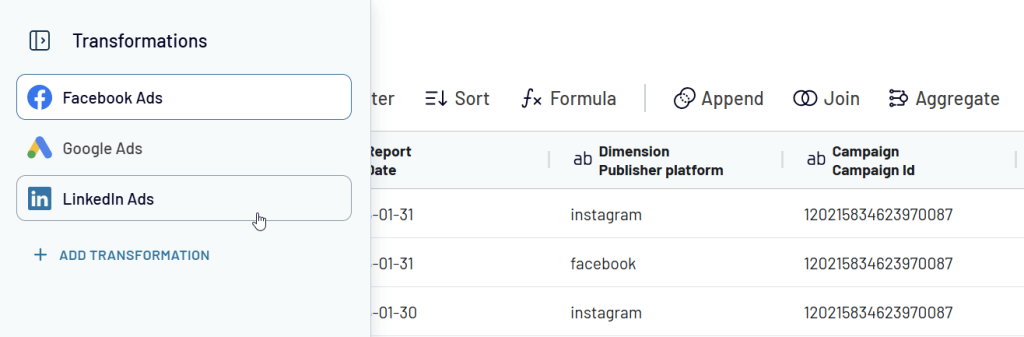
To merge these datasets, you can either click the Append button on the toolbar or +Add Transformation on the left panel and select Append. Then, check the sources you want to combine data from and click Append Data. The outcome will be a new dataset in which the data from the connected sources is placed under the same column(s).
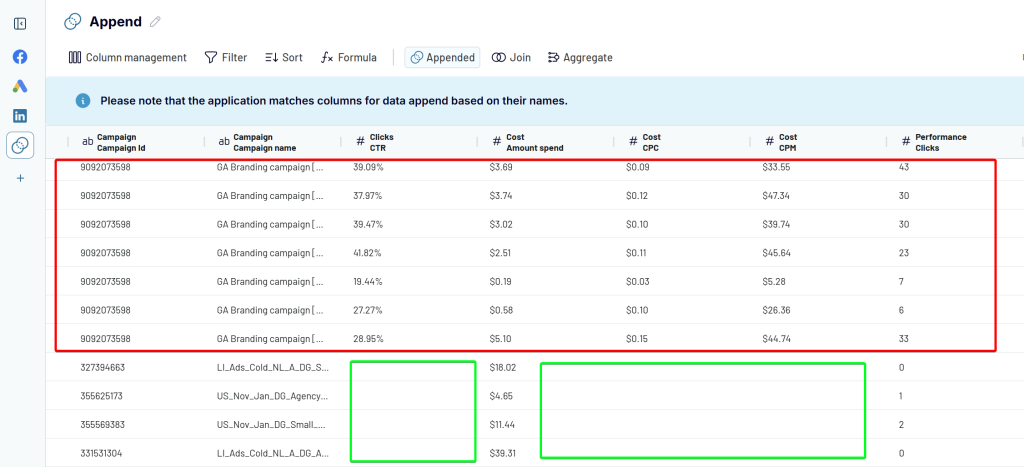
If some data source has columns that are not available in other sources, these columns will be added to the right of the appended dataset. Here is an example:
I forgot to include the metrics CTR, CPC, and CPM for LinkedIn Ads. As a result, these columns have been appended for Facebook and Google Ads. And for LinkedIn Ads, they have no values.
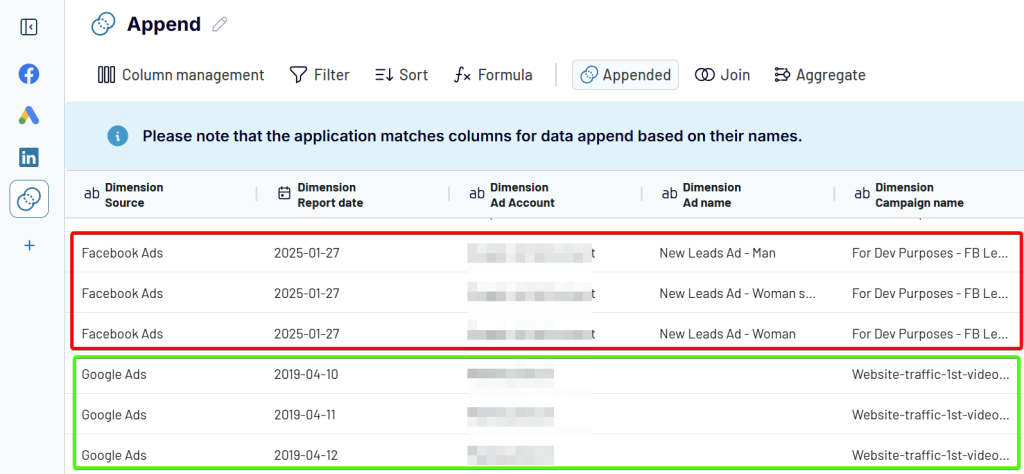
Another example is where Google Ads has columns such as Account ID, Campaign status, Start date, End date, and Budget amount. Facebook Ads and LinkedIn Ads do not have these columns. Here is what the appended dataset looks like:
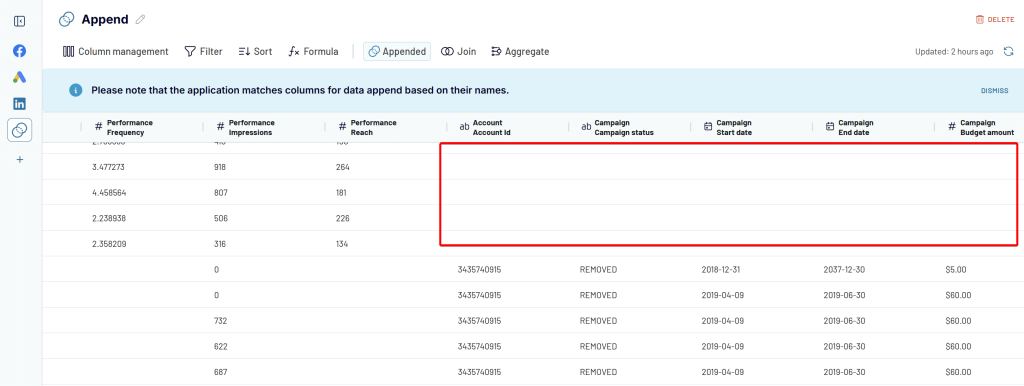
It’s okay to not have 100% identical dataset structures for all your ad sources. At the same time, to compare performance in certain metrics, ensure the columns (metrics and dimensions) across all datasets are available have the same names.
How to create new columns
Coupler.io enables you not only to merge data but also to organize it for efficient analytics. For example, to differentiate between ad platforms in the appended dataset, create separate columns named “Dimension: Source” in each source dataset like this.
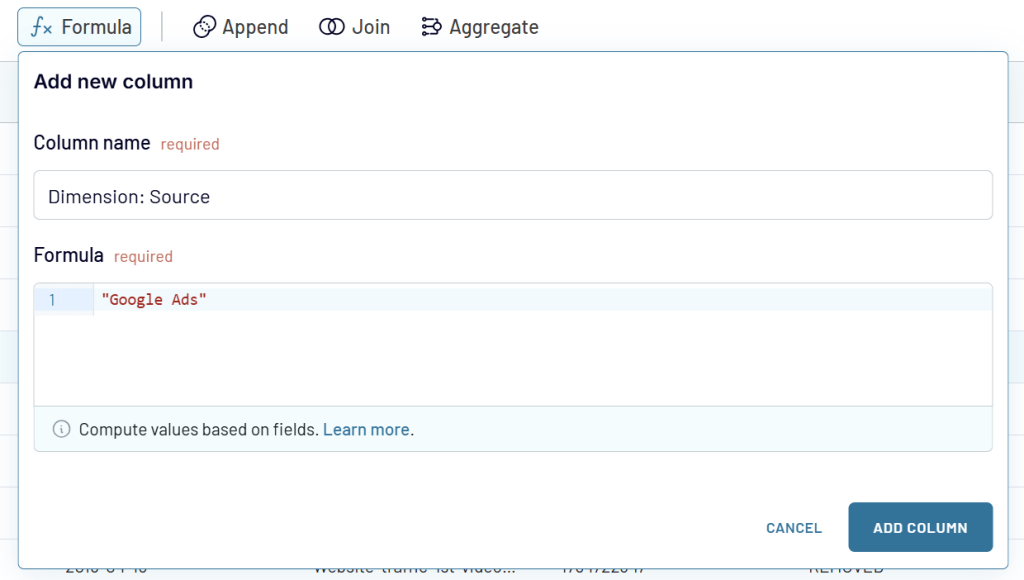
As a result, you’ll see when the data from one source ends and the next source begins in the appended dataset.
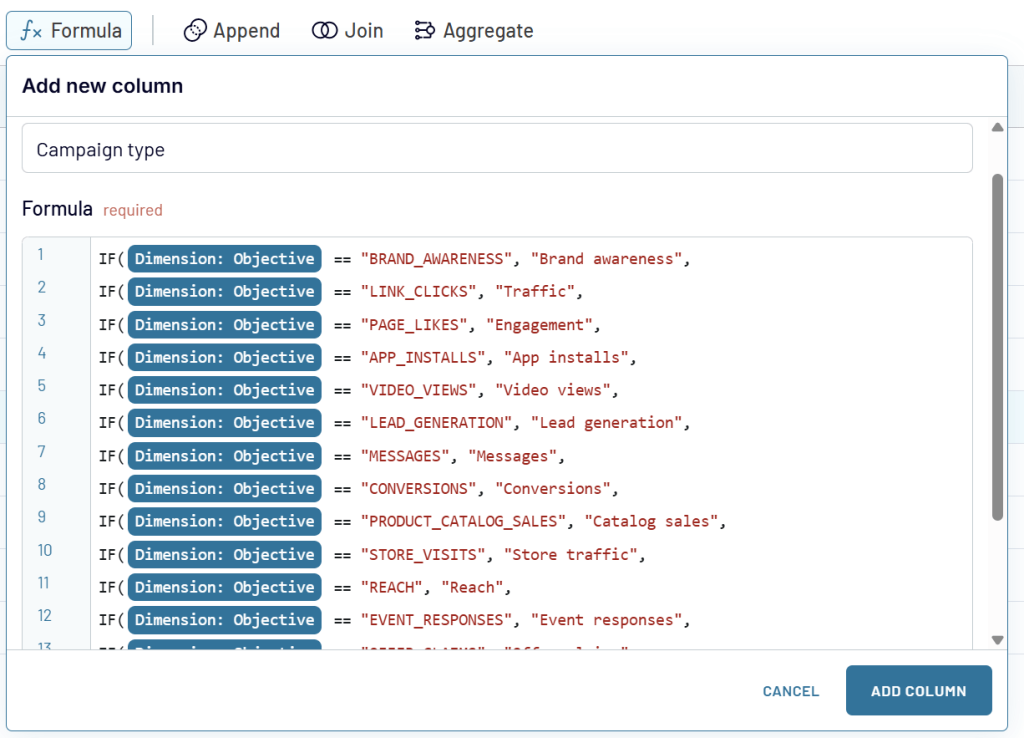
It’s a pretty simple example of using formulas in Coupler.io. Here is a more advanced example, where we’re creating a column to display the Facebook Ads campaign type.
Append creates a dataset where data from one app is placed below the data rows from another app. Columns with identical names are matched and combined, while unmatched columns are included as is. This data blending method is suitable for creating multichannel reports.
At the same time, to enhance your PPC report with information from other sources, such as Google Analytics, CRM apps, and so on, your option is to join data.
Join data from ads source with other information
Join combines data using the left join key. This allows you to keep all the information from your main dataset and only add the matching elements from the other sources. Columns that didn’t match the conditions you specified won’t be included.
For example, let’s use this method to combine data from your ad platforms, such as LinkedIn Ads and Google Search Console. This combination enables you to identify a correlation between paid impressions/clicks on LinkedIn and branded searches in Google.
Step 1. Collect data from ads sources and GSC
You already know what the LinkedIn Ads connection looks like. So, check out the flow for Search Console:
- Connect your Google account, select the sites, and choose the report type: Search results performance.
- Specify the report period, dimensions (Date and Country), and a filter. Since we’re searching for brand queries, our filter will look like this:
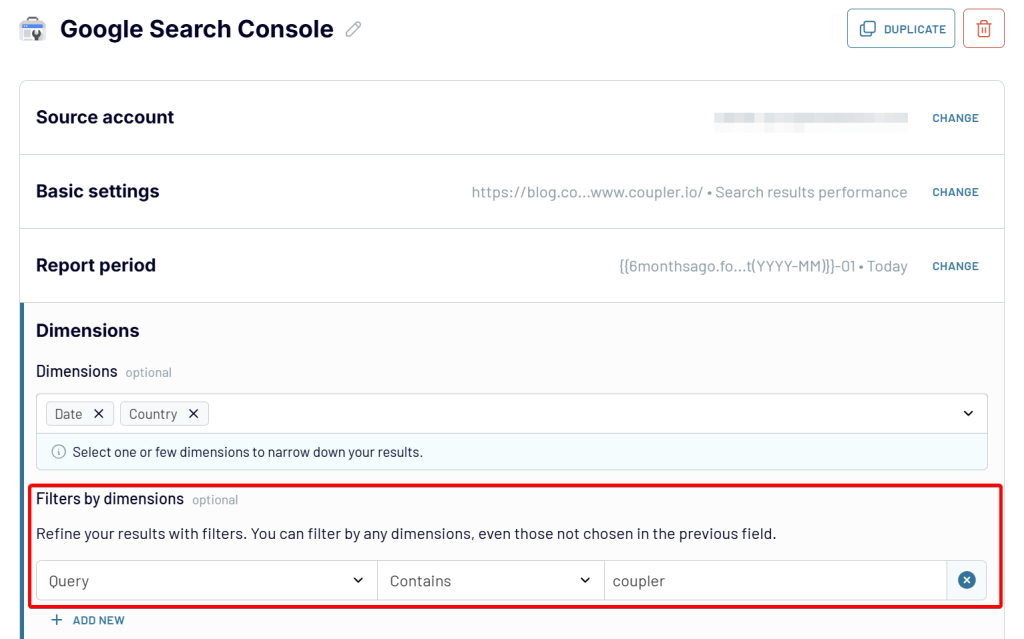
With all the necessary sources connected, proceed to the next step.
Step 2. Transform and join data
Here you will see two datasets: LinkedIn and Google Search Console. Hide the unnecessary columns in each to keep only the valuable metrics and dimensions. Then, click Join using either the toolbar or the +Add transformation button.
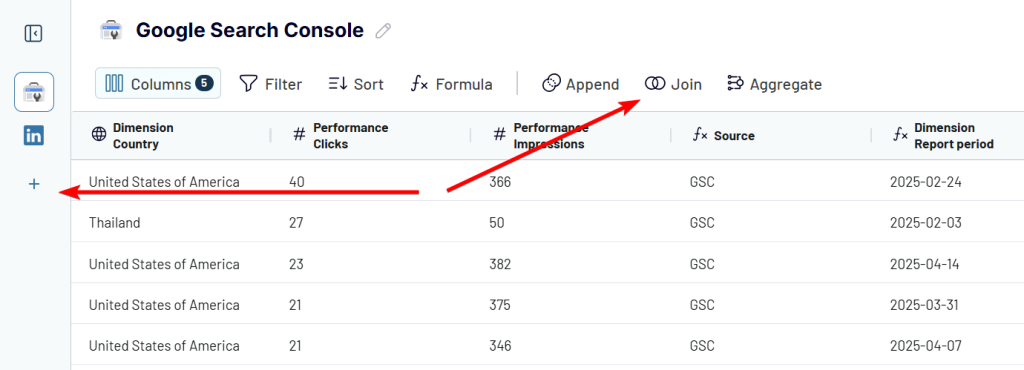
Then select which dataset you want to have on the left and on the right, and which columns you want to join them by.
The idea is to use dimensions as the key columns, i.e., they may have different names but have the same values. For example, in our case, we use the column with date values.

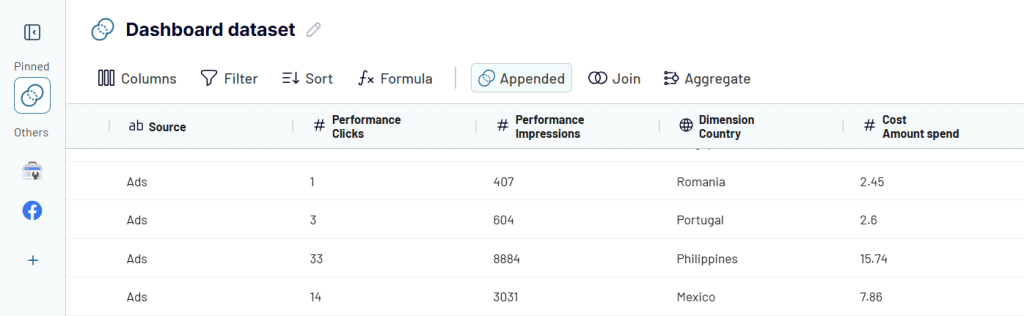
Click Join Data and meet two datasets blended together by date. On the left side, you have performance metrics from LinkedIn Ads; on the right, from Google Search Console.
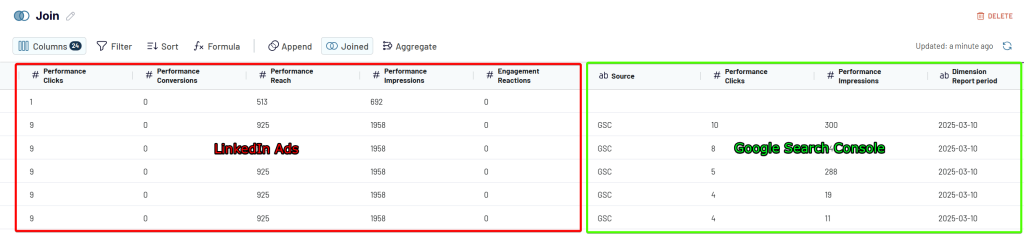
Coupler.io allows you to make multiple joins, which can be helpful in creating complex funnels or other cross-channel reports.
Aggregate data
Unlike the methods above, you don’t need multiple sources to aggregate data.
Data aggregation means summarizing information by grouping data points and applying mathematical functions (sum, average, count, etc.). It’s intended to create higher-level insights and reduce the granularity of the data to reveal broader patterns.
The goal of aggregation is to group data points and apply mathematical functions, such as sum, average, and count. For example, your data set from Google Ads shows the daily performance of campaigns.
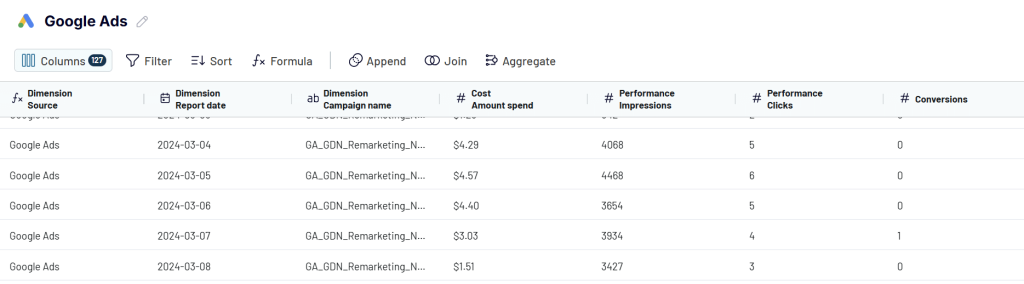
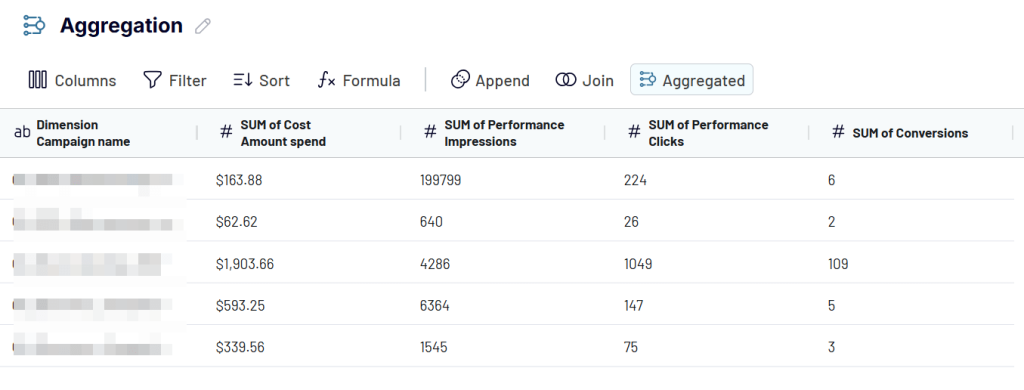
But you need to see the overall performance by campaign. To do this, click Aggregate, select the needed dataset, specify the dimension, metrics, and the operation. In our case, the dimension is Campaign name.
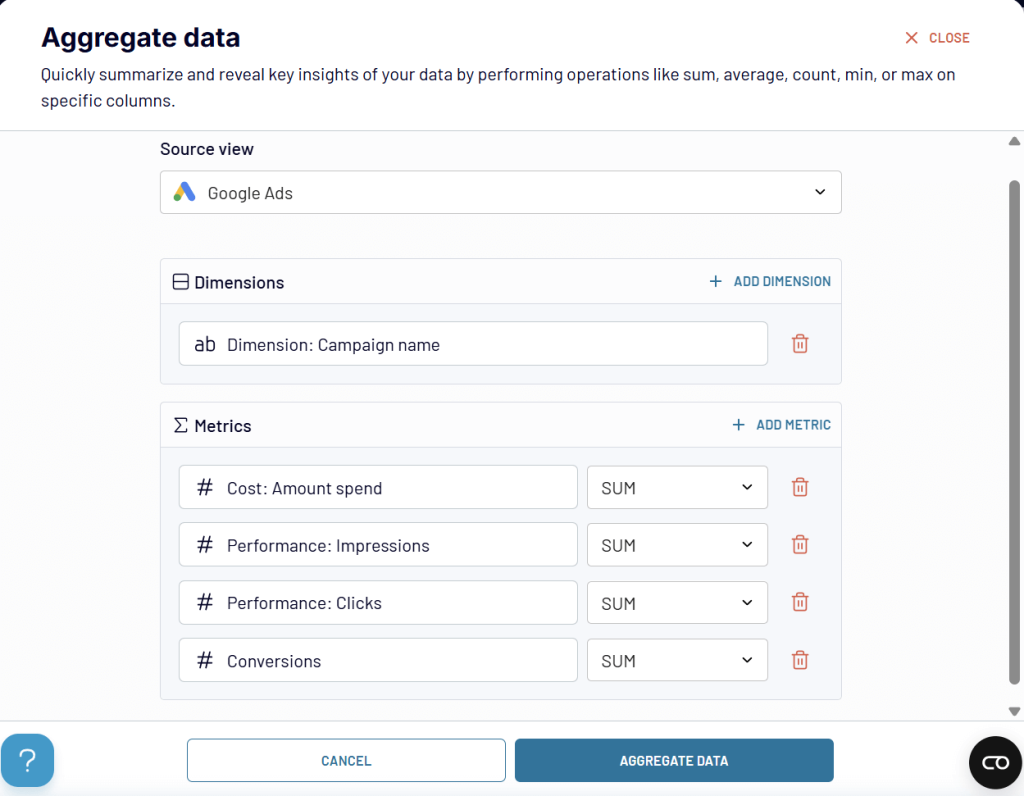
Click Aggregate Data to view a summary of your performance data by campaign.
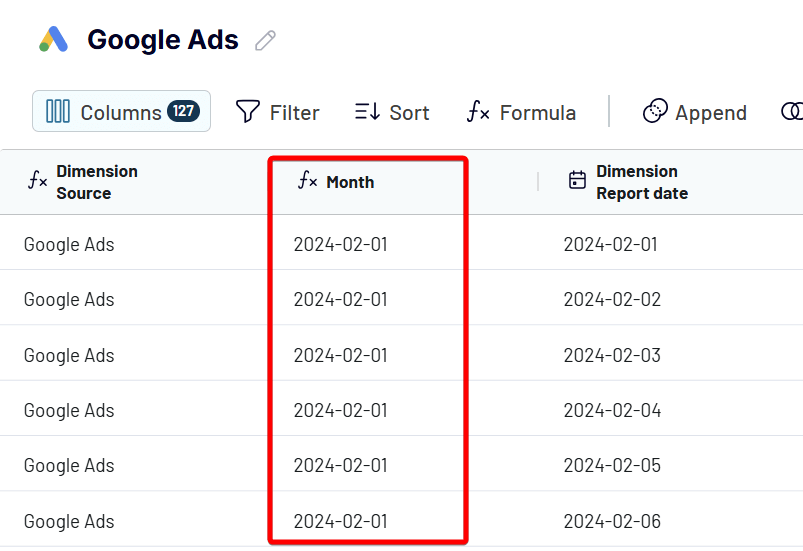
Do you need a monthly or weekly performance aggregation? Coupler.io lets you do this easily. However, to do this, you need to first create a custom column in the Google Ads dataset that will show the month for each day like this:
DATETIME_FORMAT(START_OF_TIME({date-column-name}, “MONTH”), “YYYY-MM-DD”)

Here is what it looks like:
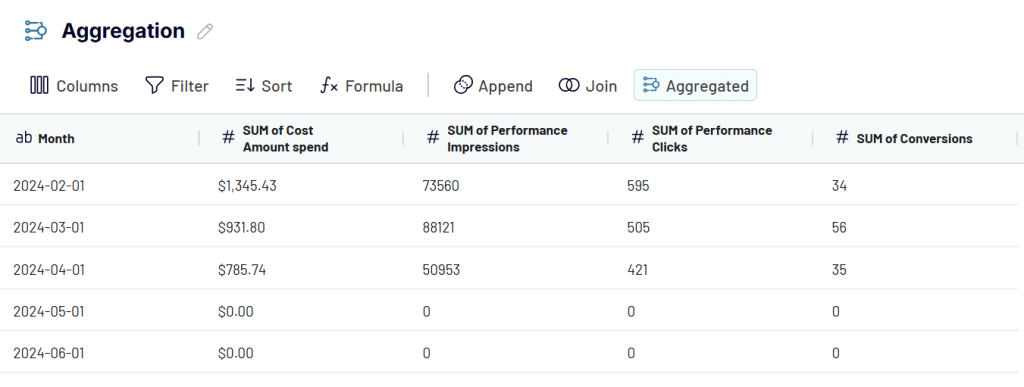
Now, with this new column available, you can use it as a dimension for your aggregation:

Click Aggregate Data and get the monthly performance of your ad campaigns.
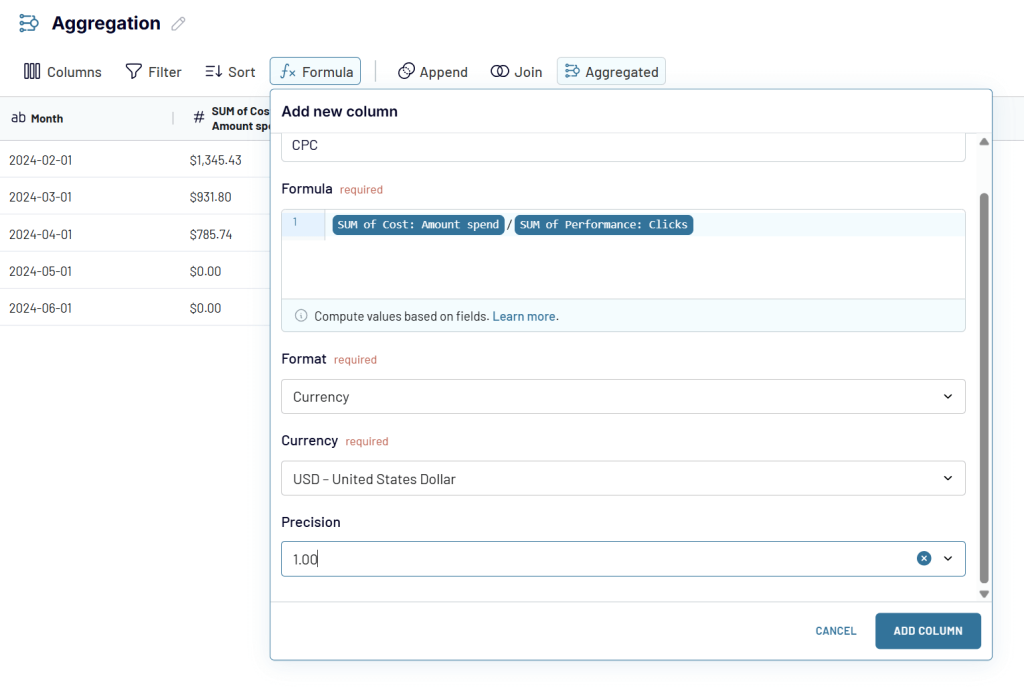
IMPORTANT: How to aggregate ratios
Metrics like Cost Per Click (CPC) or Click-Through Rate (CTR) are calculated as ratios. They represent relationships between two separate metrics:
- CPC is calculated as Cost ÷ Clicks
- CTR is calculated as Clicks ÷ Impressions
Because these metrics are ratios, you can’t simply average them during the aggregation.
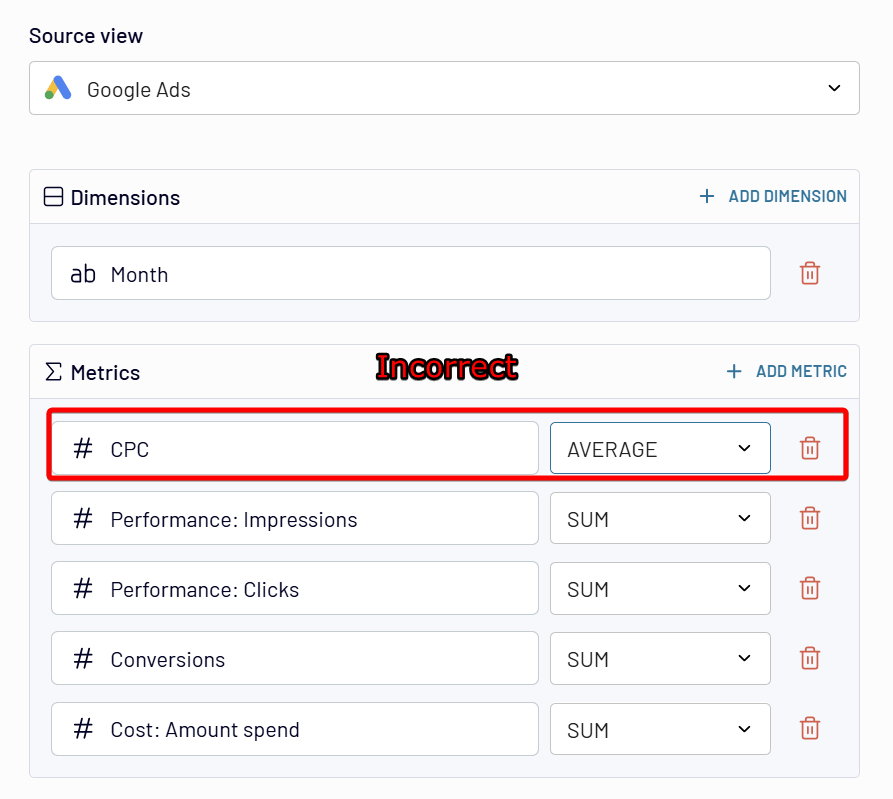
This will produce inaccurate results. Each item’s total number of clicks, impressions, or costs might differ significantly.
Instead, these metrics must be recalculated from their original totals:
- For CPC, sum the total costs and divide by the total clicks.
- For CTR, sum the total clicks and divide by the total impressions.
Example:
| Campaign | Cost | Clicks | CPC (Cost ÷ Clicks) |
| A | $100 | 20 | $5.00 |
| B | $50 | 25 | $2.00 |
If you take a simple average of CPC:($5 + $2) ÷ 2 = $3.50 (incorrect)
Proper calculation:
Total cost ($100 + $50) ÷ Total clicks (20 + 25)
= $150 ÷ 45
= $3.33 (correct)
Therefore, averaging ratio-based metrics directly leads to incorrect results. Always aggregate underlying metrics first and then recalculate. In our example, you’ll just need to add a new formula like this:
Where you can export the blended data
Once your consolidated dataset is ready, choose the needed destination app. for your blended advertising data.
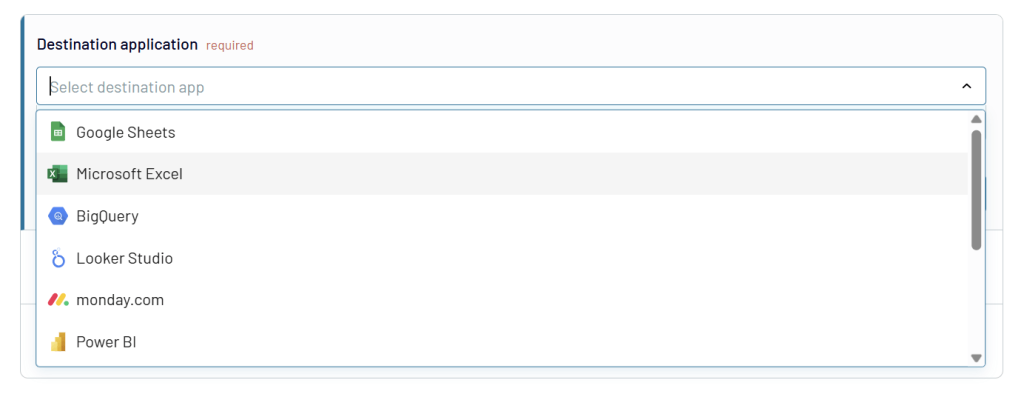
These destinations, automated reporting tools, can be grouped into several categories based on their primary functions:
Spreadsheet Applications
Google Sheets – Perfect for collaborative analysis and sharing with team members. Most PPC managers are already proficient with Sheets, making this a natural choice for quick analyses and shareable reports. Moreover, in Google Sheets, users can combine exported data with manual entries, for example, when analyzing the budget against the amount spent. Coupler.io even provides a ready-to-go dashboard template covering this – PPC monthly budget dashboard.
PPC monthly budget dashboard in Google Sheets
Monitor how much you spend on your ads across multiple platforms using a one-stop PPC monthly budget dashboard template.


Microsoft Excel – Ideal for more complex calculations and offline work. If you’re using advanced Excel features like Power Query or custom macros for PPC analysis, you can feed your blended data directly into your existing workbooks.
Data visualization platforms
Looker Studio – Excellent for creating interactive dashboards with drill-down capabilities. As a PPC specialist, you can leverage Looker Studio’s visualization features while bypassing its limitations in handling multiple data sources. By using Coupler.io to unify your advertising data first, you can create complex cross-platform dashboards in Looker Studio that would otherwise time out or become unusably slow if built with native blending connections
Power BI, Microsoft’s powerful business intelligence platform, enables you to create sophisticated, interactive dashboards and reports with robust data modeling capabilities for in-depth PPC analysis.
Tableau – For teams that use Tableau’s powerful visualization capabilities for deep advertising performance analysis and complex data storytelling.
Data warehouses
BigQuery – Best for large-scale campaigns with massive datasets that exceed spreadsheet capabilities. If you’re running enterprise-level campaigns across numerous accounts, BigQuery provides the computational power for advanced analysis.
PostgreSQL – Suitable for integration with custom applications or BI tools. This option is valuable if you’re working with a data team that needs normalized, structured data for wider business intelligence.
Redshift – For organizations that use Amazon’s data warehouse as their central repository, enabling integration with AWS-based analytics tools and workflows.
Project management & other formats
monday.com – Allows you to visualize and manage your advertising data within your existing project management workflows.
JSON – For technical teams that require data in a flexible, language-independent format that can be easily parsed and used in custom applications.
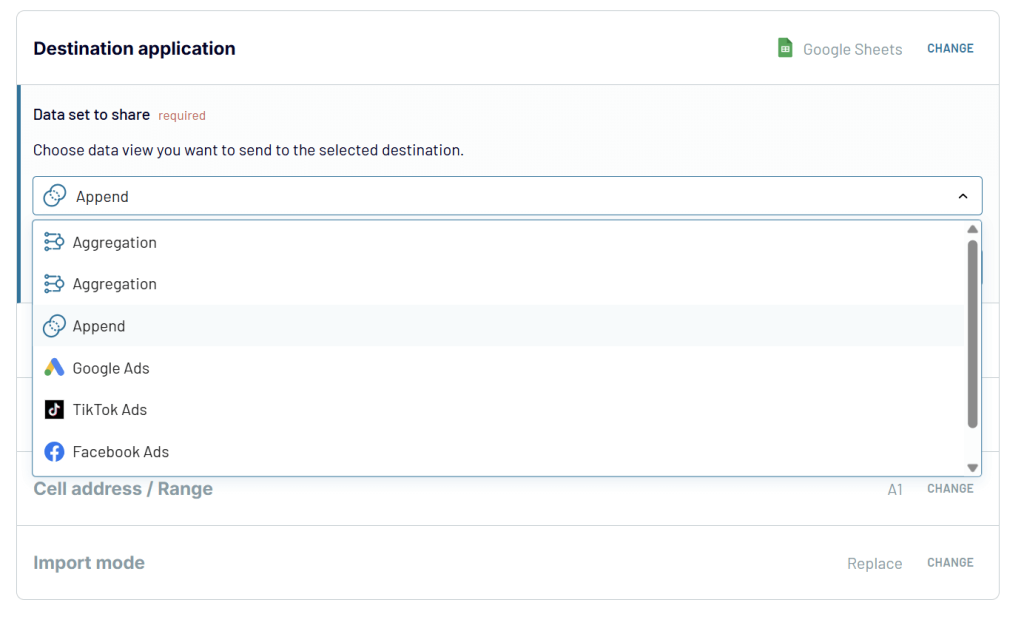
Once you’ve decided on your destination, select the dataset you want to load in the Data to share field. You can either export data from a single source or any of your transformed datasets (joined, appended, or aggregated). Coupler.io handles the proper formatting and delivery to your chosen platform.
A major advantage for PPC specialists is Coupler.io’s automatic data refresh capability. You can schedule refreshes as frequently as every 15 minutes, ensuring your reports and dashboards always reflect current campaign performance without manual intervention. This automation is particularly valuable for agency PPC managers who need to maintain up-to-date reports for multiple clients.
Key metrics across platforms and how they align
When blending data from multiple platforms, it’s important to understand how metrics align across different sources. Let’s explore the most essential PPC metrics that should be tracked across all platforms:
- Impressions: This universal metric indicates the number of times your ad appeared on a screen. It shows the reach of your ad and impacts brand awareness. Whether on Google Ads, Facebook Ads, or LinkedIn Ads, impressions give you insight into your ad’s visibility.
- Clicks: All platforms track the number of times users clicked on your ads. This engagement metric highlights user interest in learning more about your product or service, regardless of platform.
- CTR (Click-through rate): Calculated as (Clicks ÷ Impressions) × 100, CTR shows the effectiveness of your ads. Standard benchmarks vary by platform, ranging from 0.5% to 1% in social ads and 5%-6% in Google Search Ads, depending on the industry and audience.
- CPC (Cost per click): This metric indicates the amount spent for each click on your ad and helps manage ad budgets effectively. Benchmarks vary significantly by platform:
- Google Ads: around $2.5
- LinkedIn Ads: can reach $5
- Facebook Ads: less than $2
- CPM (Cost per mille): The amount spent per 1,000 impressions, especially important for branding campaigns. This metric also varies widely across platforms, with social platforms generally having lower CPMs than professional networks.
- Amount spent: A straightforward metric that shows total campaign spending, critical for budget management across all platforms.
- Conversions: These indicate the number of users who performed a desired action after seeing your ad. Conversion definitions can be customized on each platform but typically include purchases, sign-ups, or downloads.
- Cost per conversion: A key profitability metric, calculated by dividing total campaign cost by the number of conversions.
- ROAS (Return on Ad Spend): This metric tracks the revenue generated by your advertising in relation to the amount spent. A ROAS of 4:1 means $4 revenue for every $1 spent.
- Conversion rate: The percentage of conversions in relation to clicks, with industry benchmarks for e-commerce typically between 2-3%.
When blending data across platforms, you might encounter these challenges:
- Different naming conventions: The same metric might have different names across platforms (e.g., “costInUsd” in LinkedIn Ads vs. “cost_micros” in Google).
- Measurement discrepancies: Platforms may count impressions or attribute conversions differently.
- Platform-specific metrics: Some metrics, like Facebook’s “Relevance Score” or Google’s “Quality Score”, don’t have direct equivalents elsewhere.
- Different attribution models: Google Ads might use a last-click model by default, while Facebook could count view-through conversions.
Coupler.io automatically standardizes metrics across most advertising platforms to ensure consistent naming conventions across all platforms. This saves you hours of manual work that would typically be spent aligning different terminology across platforms. At the same time, you can also do this yourself during the data integration process. It allows users to rename columns, apply transformations, and create calculated fields to ensure consistent reporting across all your advertising channels.
Ready-to-use dashboards for multi-channel PPC reporting
Once you’ve blended your ad data from multiple sources, the next step is to visualize it in a way that provides actionable insights. Coupler.io offers several ready-to-use dashboard templates designed specifically for multi-channel advertising analysis.
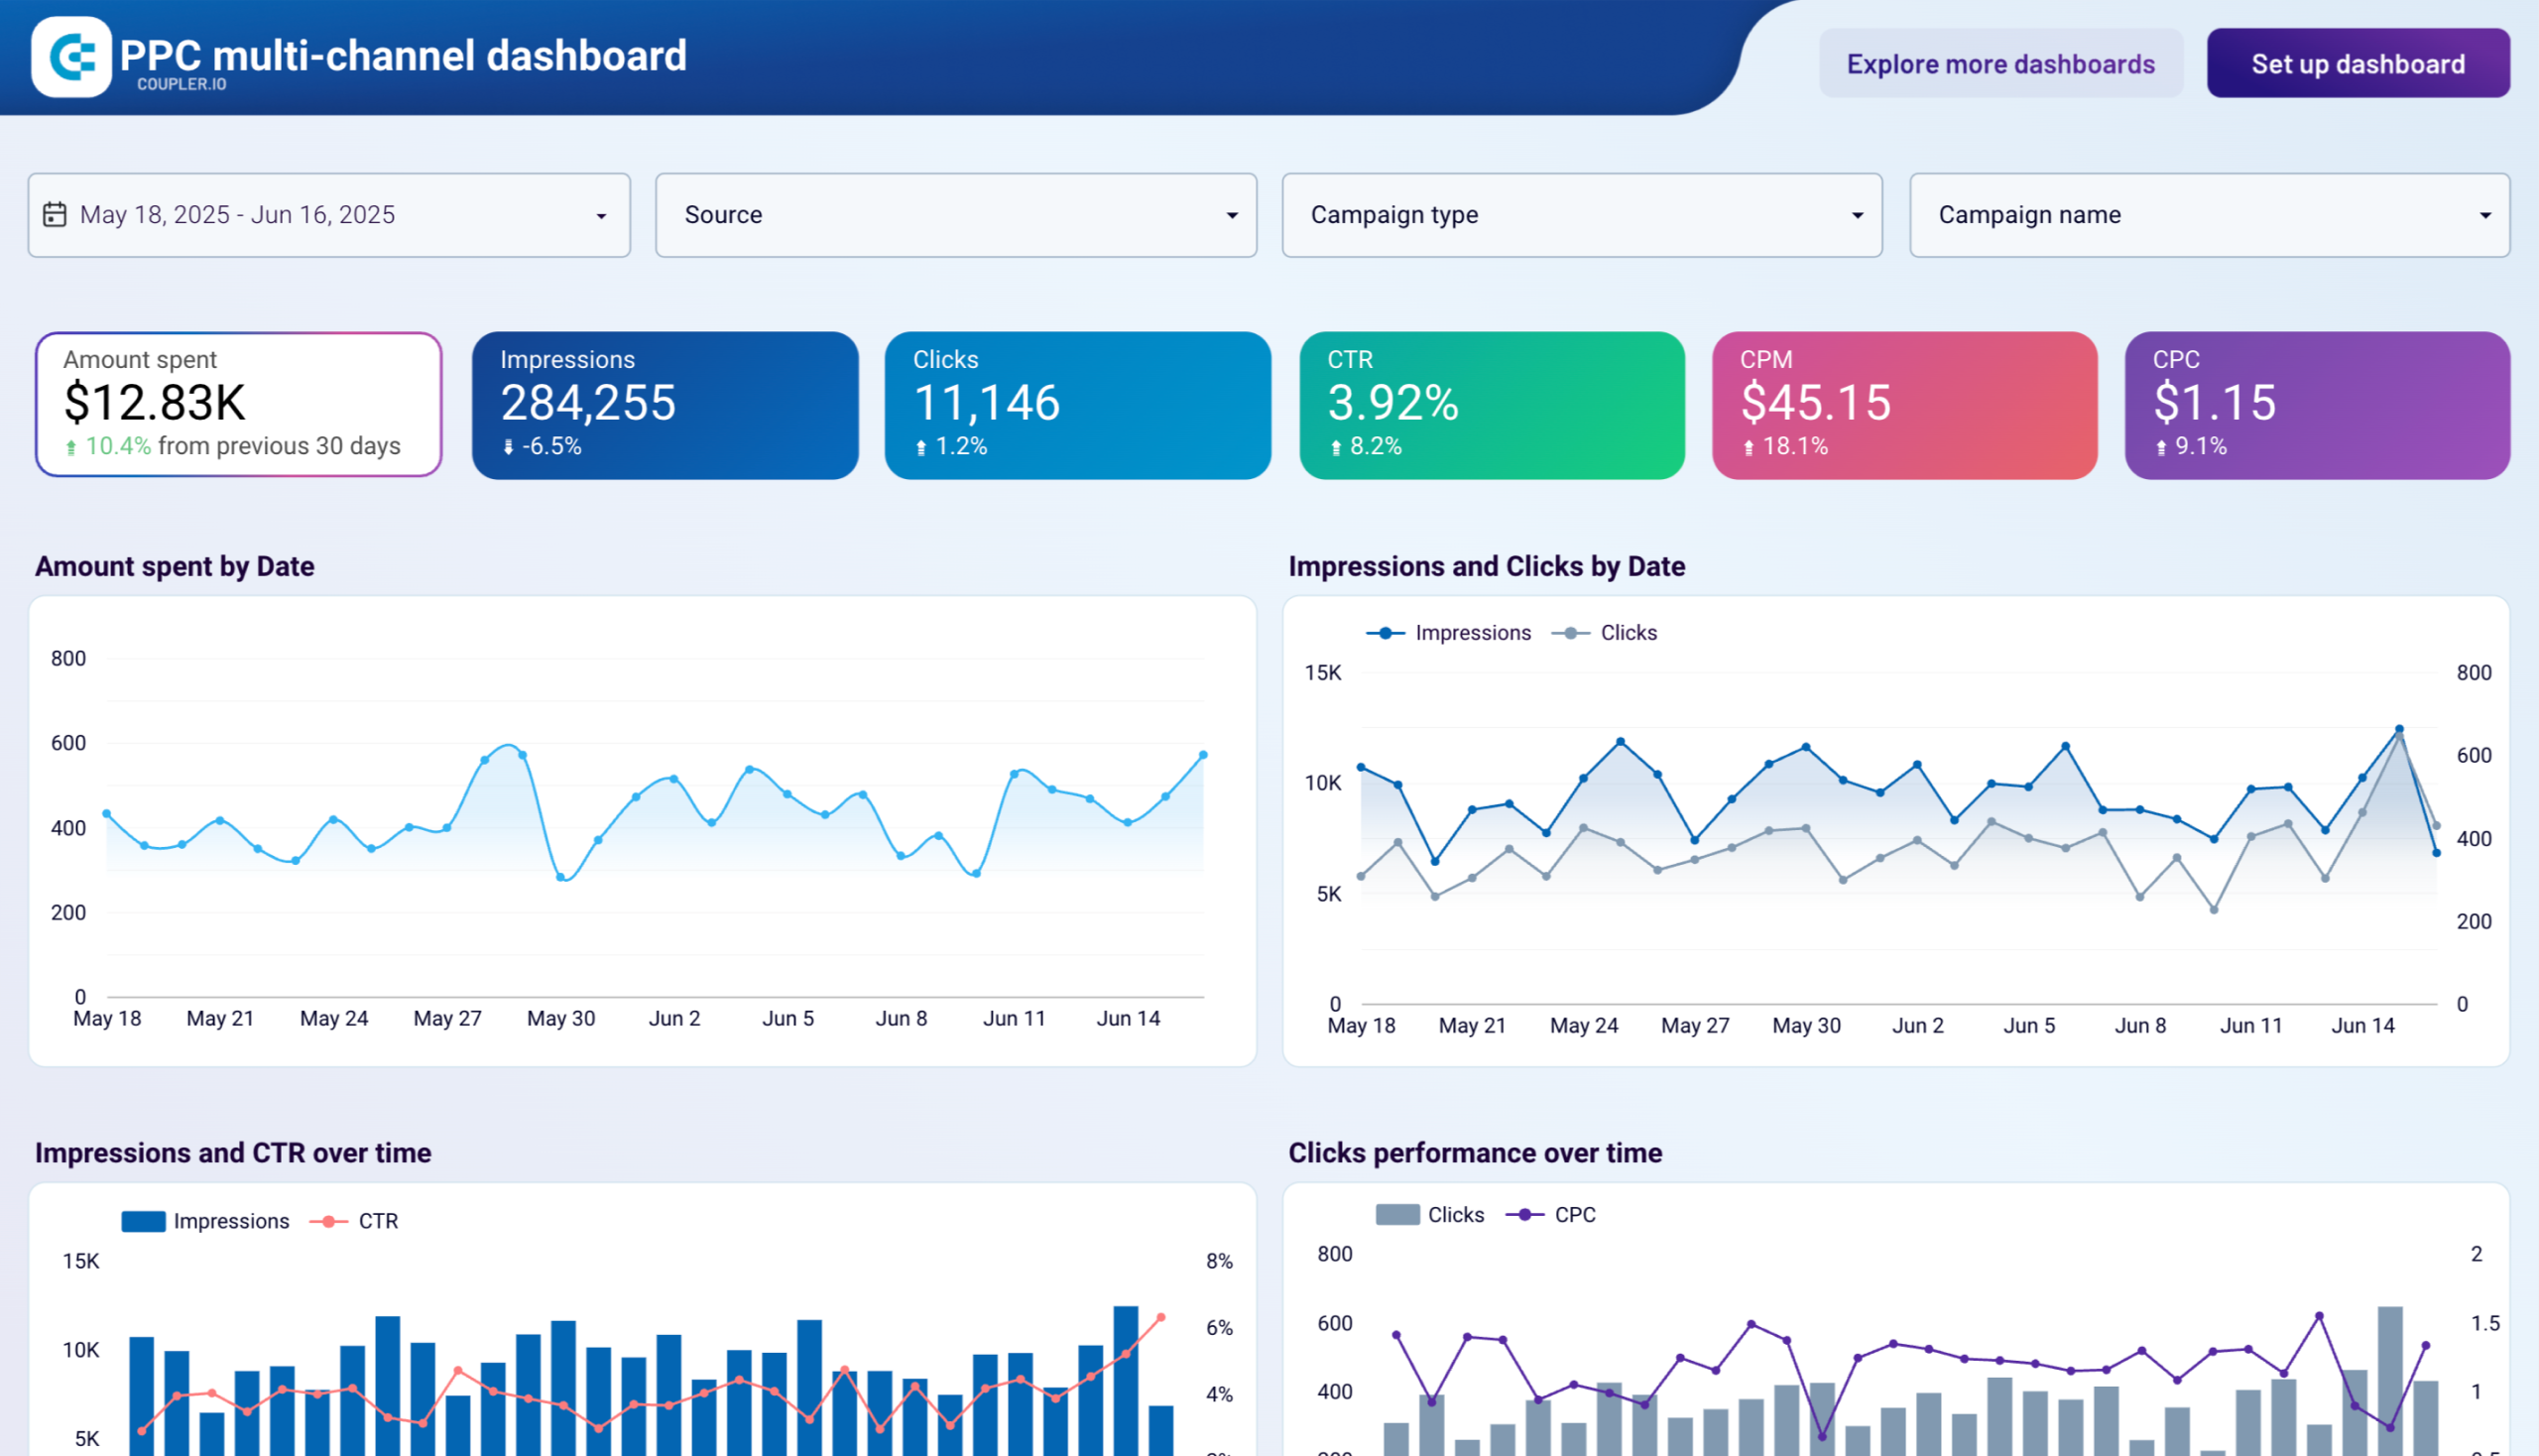
PPC multi-channel dashboard
This PPC dashboard solves the challenge of fragmented advertising data by consolidating performance metrics from multiple platforms into a single, unified interface. It consolidates information from Google Ads, Twitter Ads, LinkedIn Ads, Facebook Ads, Quora Ads, TikTok Ads, Microsoft Ads, and more, eliminating the need to switch between different ad managers.
What makes this possible is Coupler.io’s superior data unification approach. Unlike Looker Studio’s native blending (which would make this dashboard painfully slow or even impossible to build with 8 data sources), Coupler.io pre-processes and transforms all platform data into a single, optimized dataset before visualization. The result is a lightning-fast dashboard that would otherwise crash or time out using traditional methods.
The insights the dashboard provides:
- Filter by date: Examine both daily performance and annual trends to understand how your campaigns evolve over time.
- Control key spend metrics: Track cost per click, cost per impression, cost per action, and other critical metrics across all platforms.
- Monitor performance dynamics: View line charts showing trends for impressions, clicks, and other key metrics to identify patterns.
- Analyze channel performance: Compare the effectiveness of each advertising platform (Facebook Ads, LinkedIn Ads, TikTok Ads, etc.) in a single interface.
- Compare campaign costs and impact: Evaluate campaigns from different channels side by side to determine which deliver the best ROI.
The dashboard is available in Coupler.io and as a template for Looker Studio, Google Sheets, Power BI, and Tableau. To implement it with your data, simply connect your ad platforms following the instructions in the Readme tab.

PPC multichannel dashboard
Consolidate data from multiple advertising platforms including Google, Facebook, LinkedIn, TikTok, and more to track campaign performance, analyze spend efficiency, and optimize your PPC budget allocation across channels.

PPC multichannel dashboard in Google Sheets
Use a PPC dashboard designed for Google Sheets to track the performance of your campaigns across multiple advertising platforms.
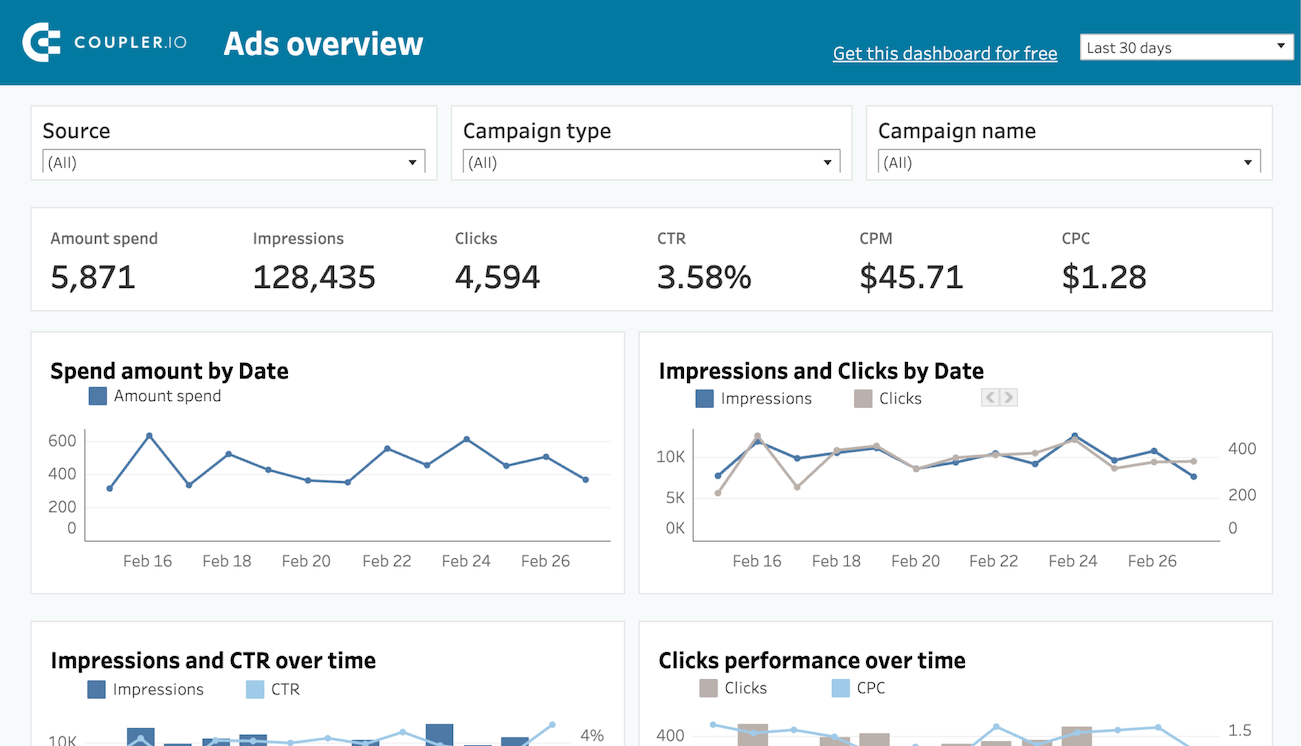
PPC multichannel dashboard in Looker Studio
Get a comprehensive PPC reporting tool to track the performance of your campaigns launched at multiple advertising platforms.

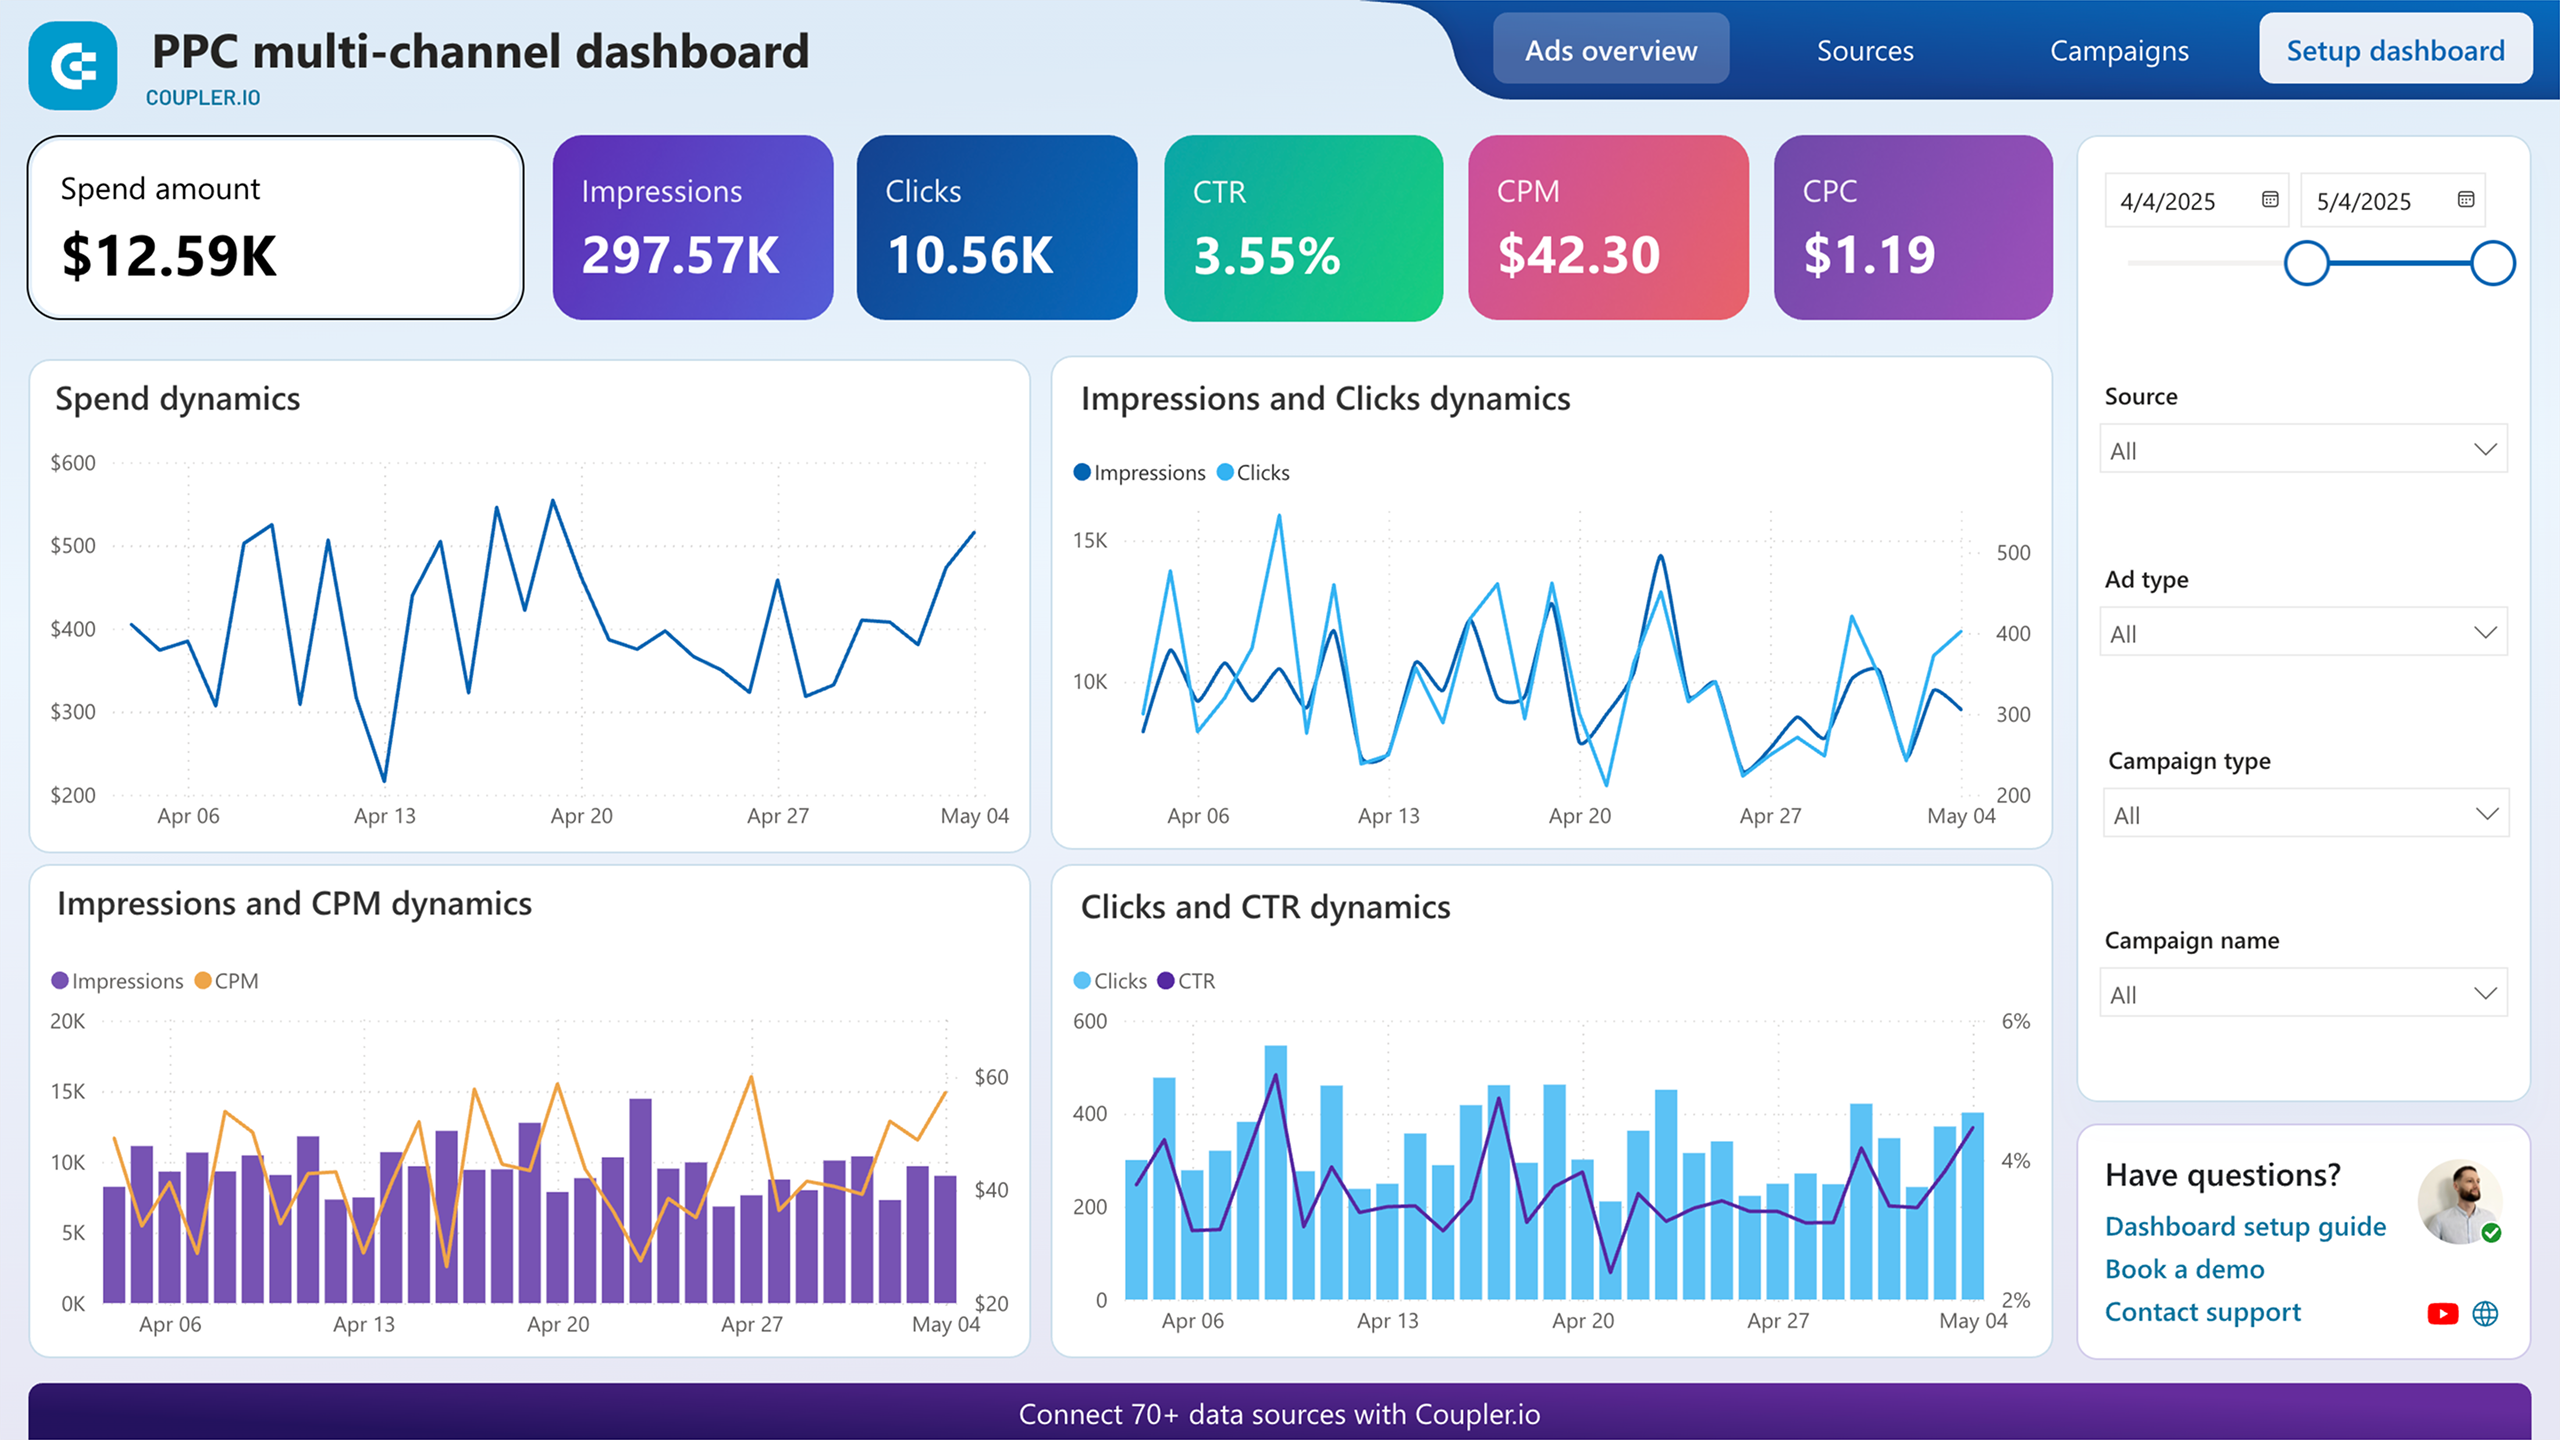
PPC multichannel dashboard in Power BI
Utilize a Power BI PPC dashboard for tracking and analyzing your advertising campaigns across multiple platforms.

PPC multichannel dashboard in Tableau
Track and analyze the performance of your advertising campaigns across various platforms using a one-stop PPC dashboard in Tableau

Multi-channel creatives dashboard template
This specialized dashboard provides clear visibility into creative performance across different advertising platforms. This way, marketing teams understand which ad designs and messaging drive the best results regardless of where they appear.
The dashboard consolidates data from Google Ads, Facebook Ads, LinkedIn Ads, TikTok Ads, and Bing Ads into a cohesive interface using Coupler.io’s transformation capabilities.
The insights the dashboard provides:
- Campaign performance comparison: View detailed breakdowns of campaign metrics across platforms, including spend, impressions, clicks, CTR, and CPC.
- Metrics dynamics visualization: Track how impressions, CPM, clicks, and CPC change over time with clear trend charts.
- Spend analysis: Monitor how your advertising budget is distributed across platforms and campaigns.
- Top-performing creatives identification: Quickly spot which ad creatives generate the highest engagement based on CTR and clicks.
- Ads overview: Access a comprehensive summary of performance metrics with visual correlations between impressions and CTR.
The dashboard template is available for both Looker Studio and Google Sheets, powered by Coupler.io’s automated data integration. To get started with your own data, connect your advertising accounts through Coupler.io by following the setup instructions in the Readme tab.
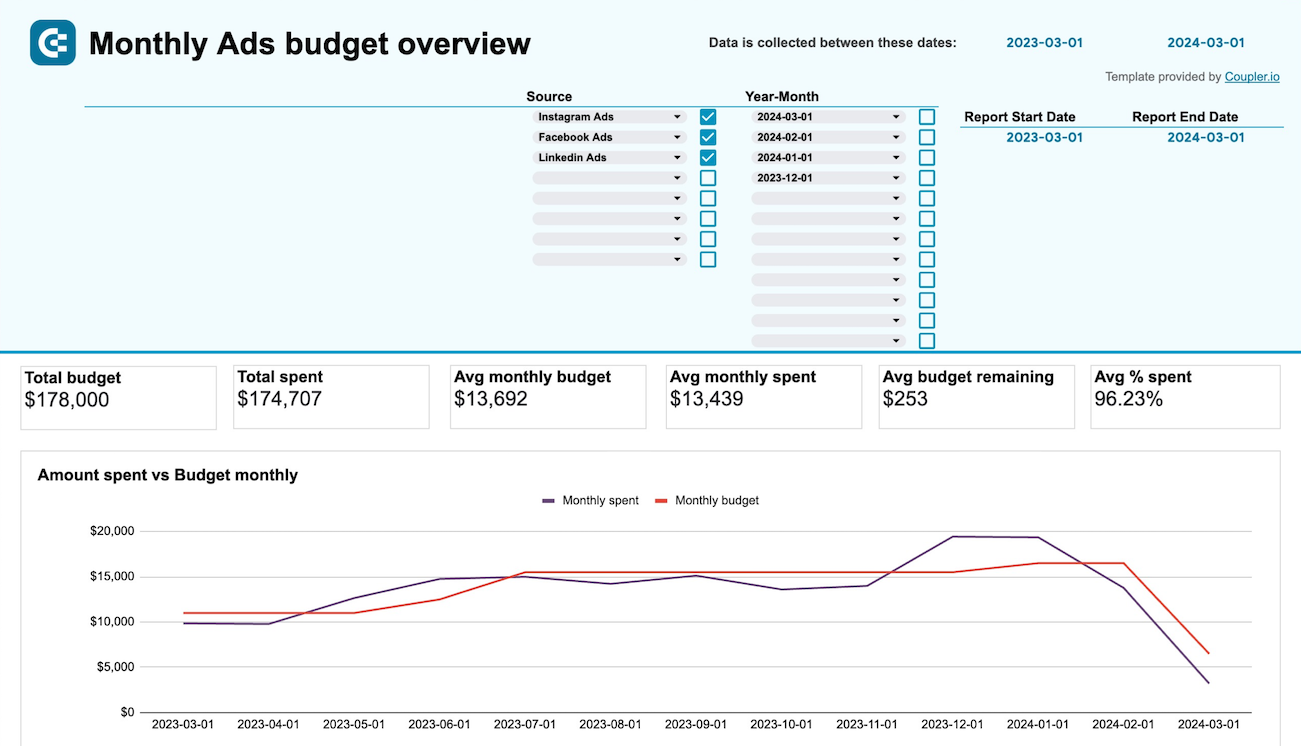
PPC monthly budget dashboard template in Google Sheets
This financial-focused dashboard helps marketing teams maintain tight budget control across multiple advertising platforms, preventing overspending while ensuring optimal resource allocation.

The dashboard tracks expenditure across seven major advertising platforms: Facebook, LinkedIn, Google, TikTok, Microsoft, Quora, and Twitter Ads, creating a unified financial view through Coupler.io’s data transformation capabilities.
The insights the dashboard provides:
- Monthly spending dynamics: Track how your ad expenses compare to budget allocations throughout the year.
- Budget utilization analysis: Understand when you’re under or over budget during the year and monitor average daily costs.
- Platform-specific budget breakdown: Get detailed budget and cost breakdowns by advertising platform.
- Current month predictions: Access a budget overview for the current month with spending forecasts and alerts to avoid overspending.
- Spend vs. budget visualization: See clear charts showing the relationship between planned budgets and actual spending.
This template is designed specifically for Google Sheets, making it accessible to marketing teams without specialized BI expertise. To implement it with your advertising accounts, connect your platforms through Coupler.io by following the instructions in the Readme tab of the template.
All-in-one marketing analytics dashboard
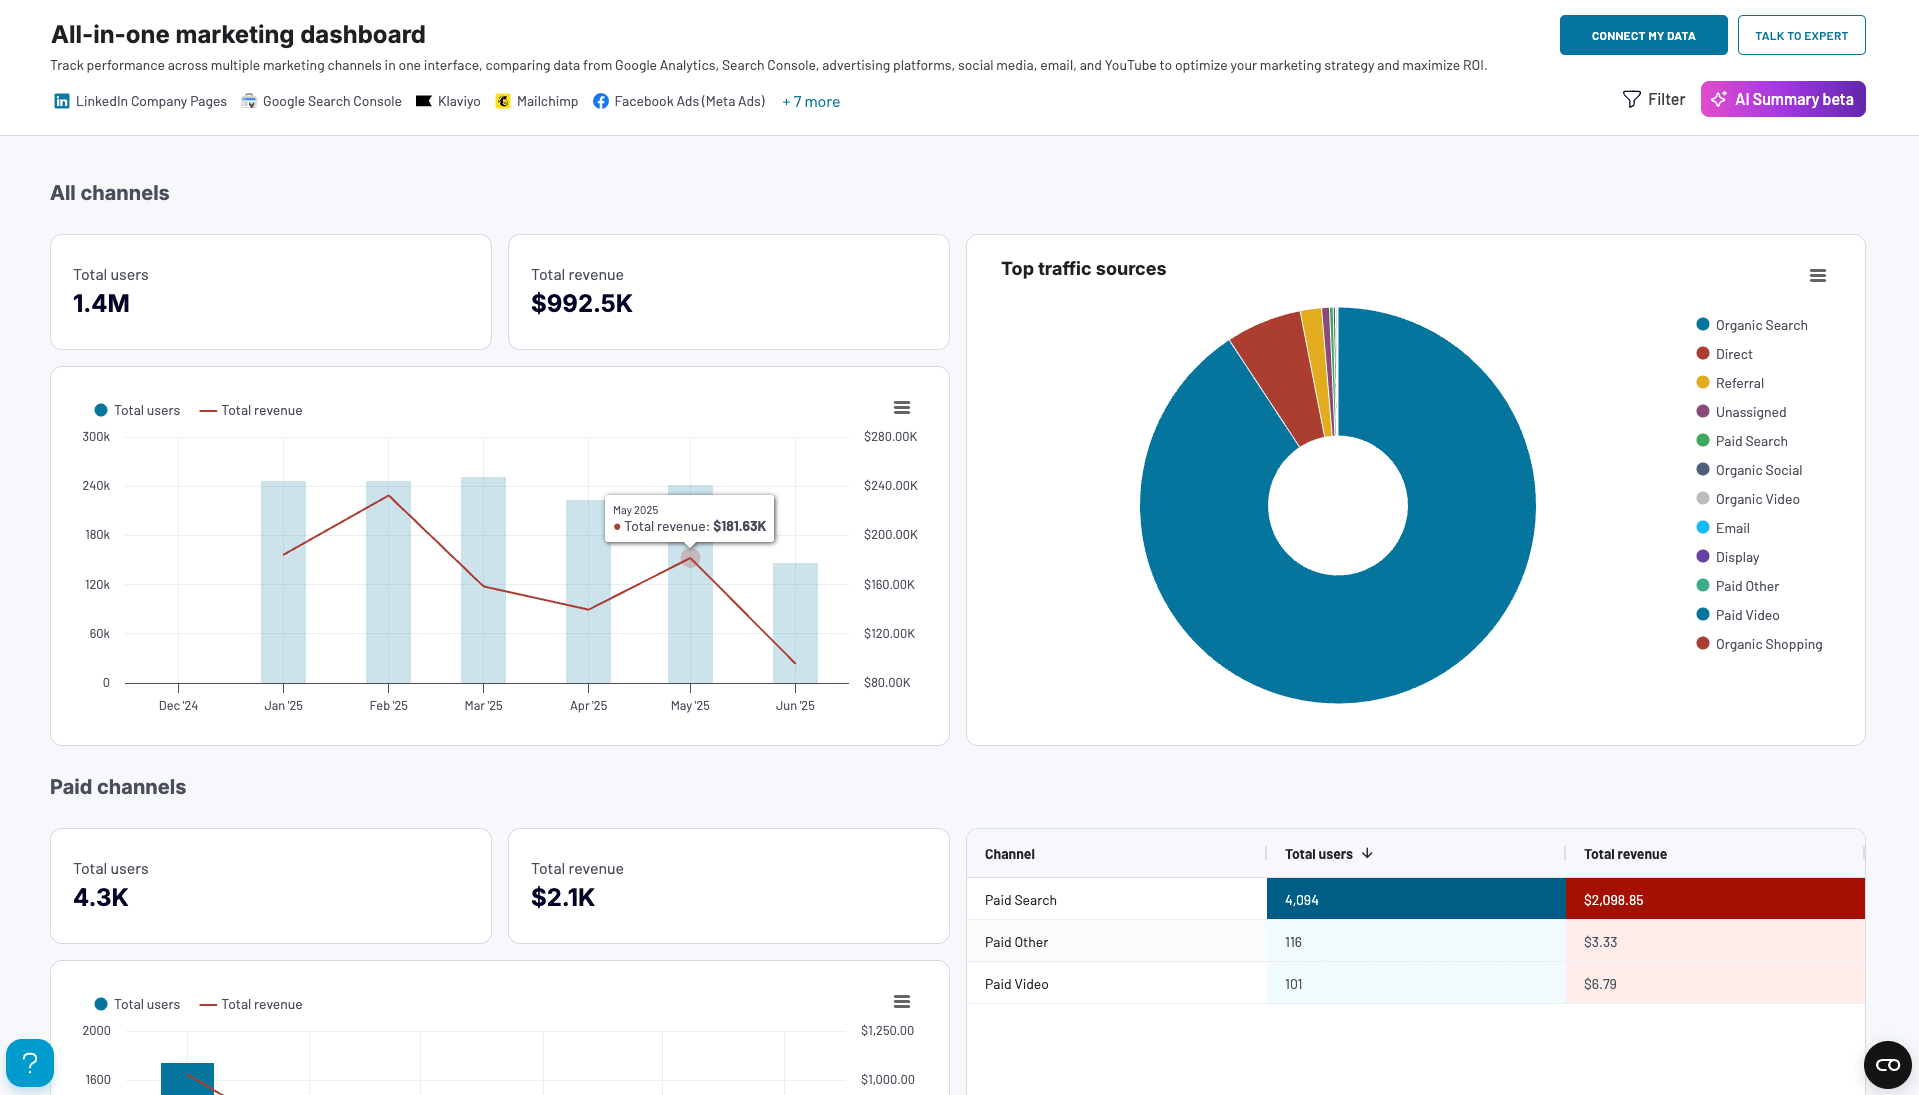
This comprehensive dashboard provides a holistic view of your marketing ecosystem, consolidating metrics from paid advertising, organic search, social media, and email campaigns in a single, central location.
All-in-one marketing analytics dashboard
 Preview dashboard
All-in-one marketing analytics dashboard
Preview dashboardThe dashboard integrates data from Google Analytics 4, multiple ad platforms, Google Search Console, YouTube, and email marketing services using Coupler.io’s data transformation capabilities.
The insights the dashboard provides:
- Channel performance overview: See how each marketing channel contributes to your overall traffic with a clear breakdown visualization.
- Paid channels analysis: Track key PPC metrics like spend, impressions, clicks, and CTR across all advertising platforms.
- Organic search performance: Monitor impressions, clicks, CTR, and average position from Google Search Console.
- Social media engagement: Analyze impressions and page views across social channels to gauge audience interest.
- Email campaign effectiveness: Assess key email marketing metrics, including delivery rates, open rates, bounces, and click-through performance.
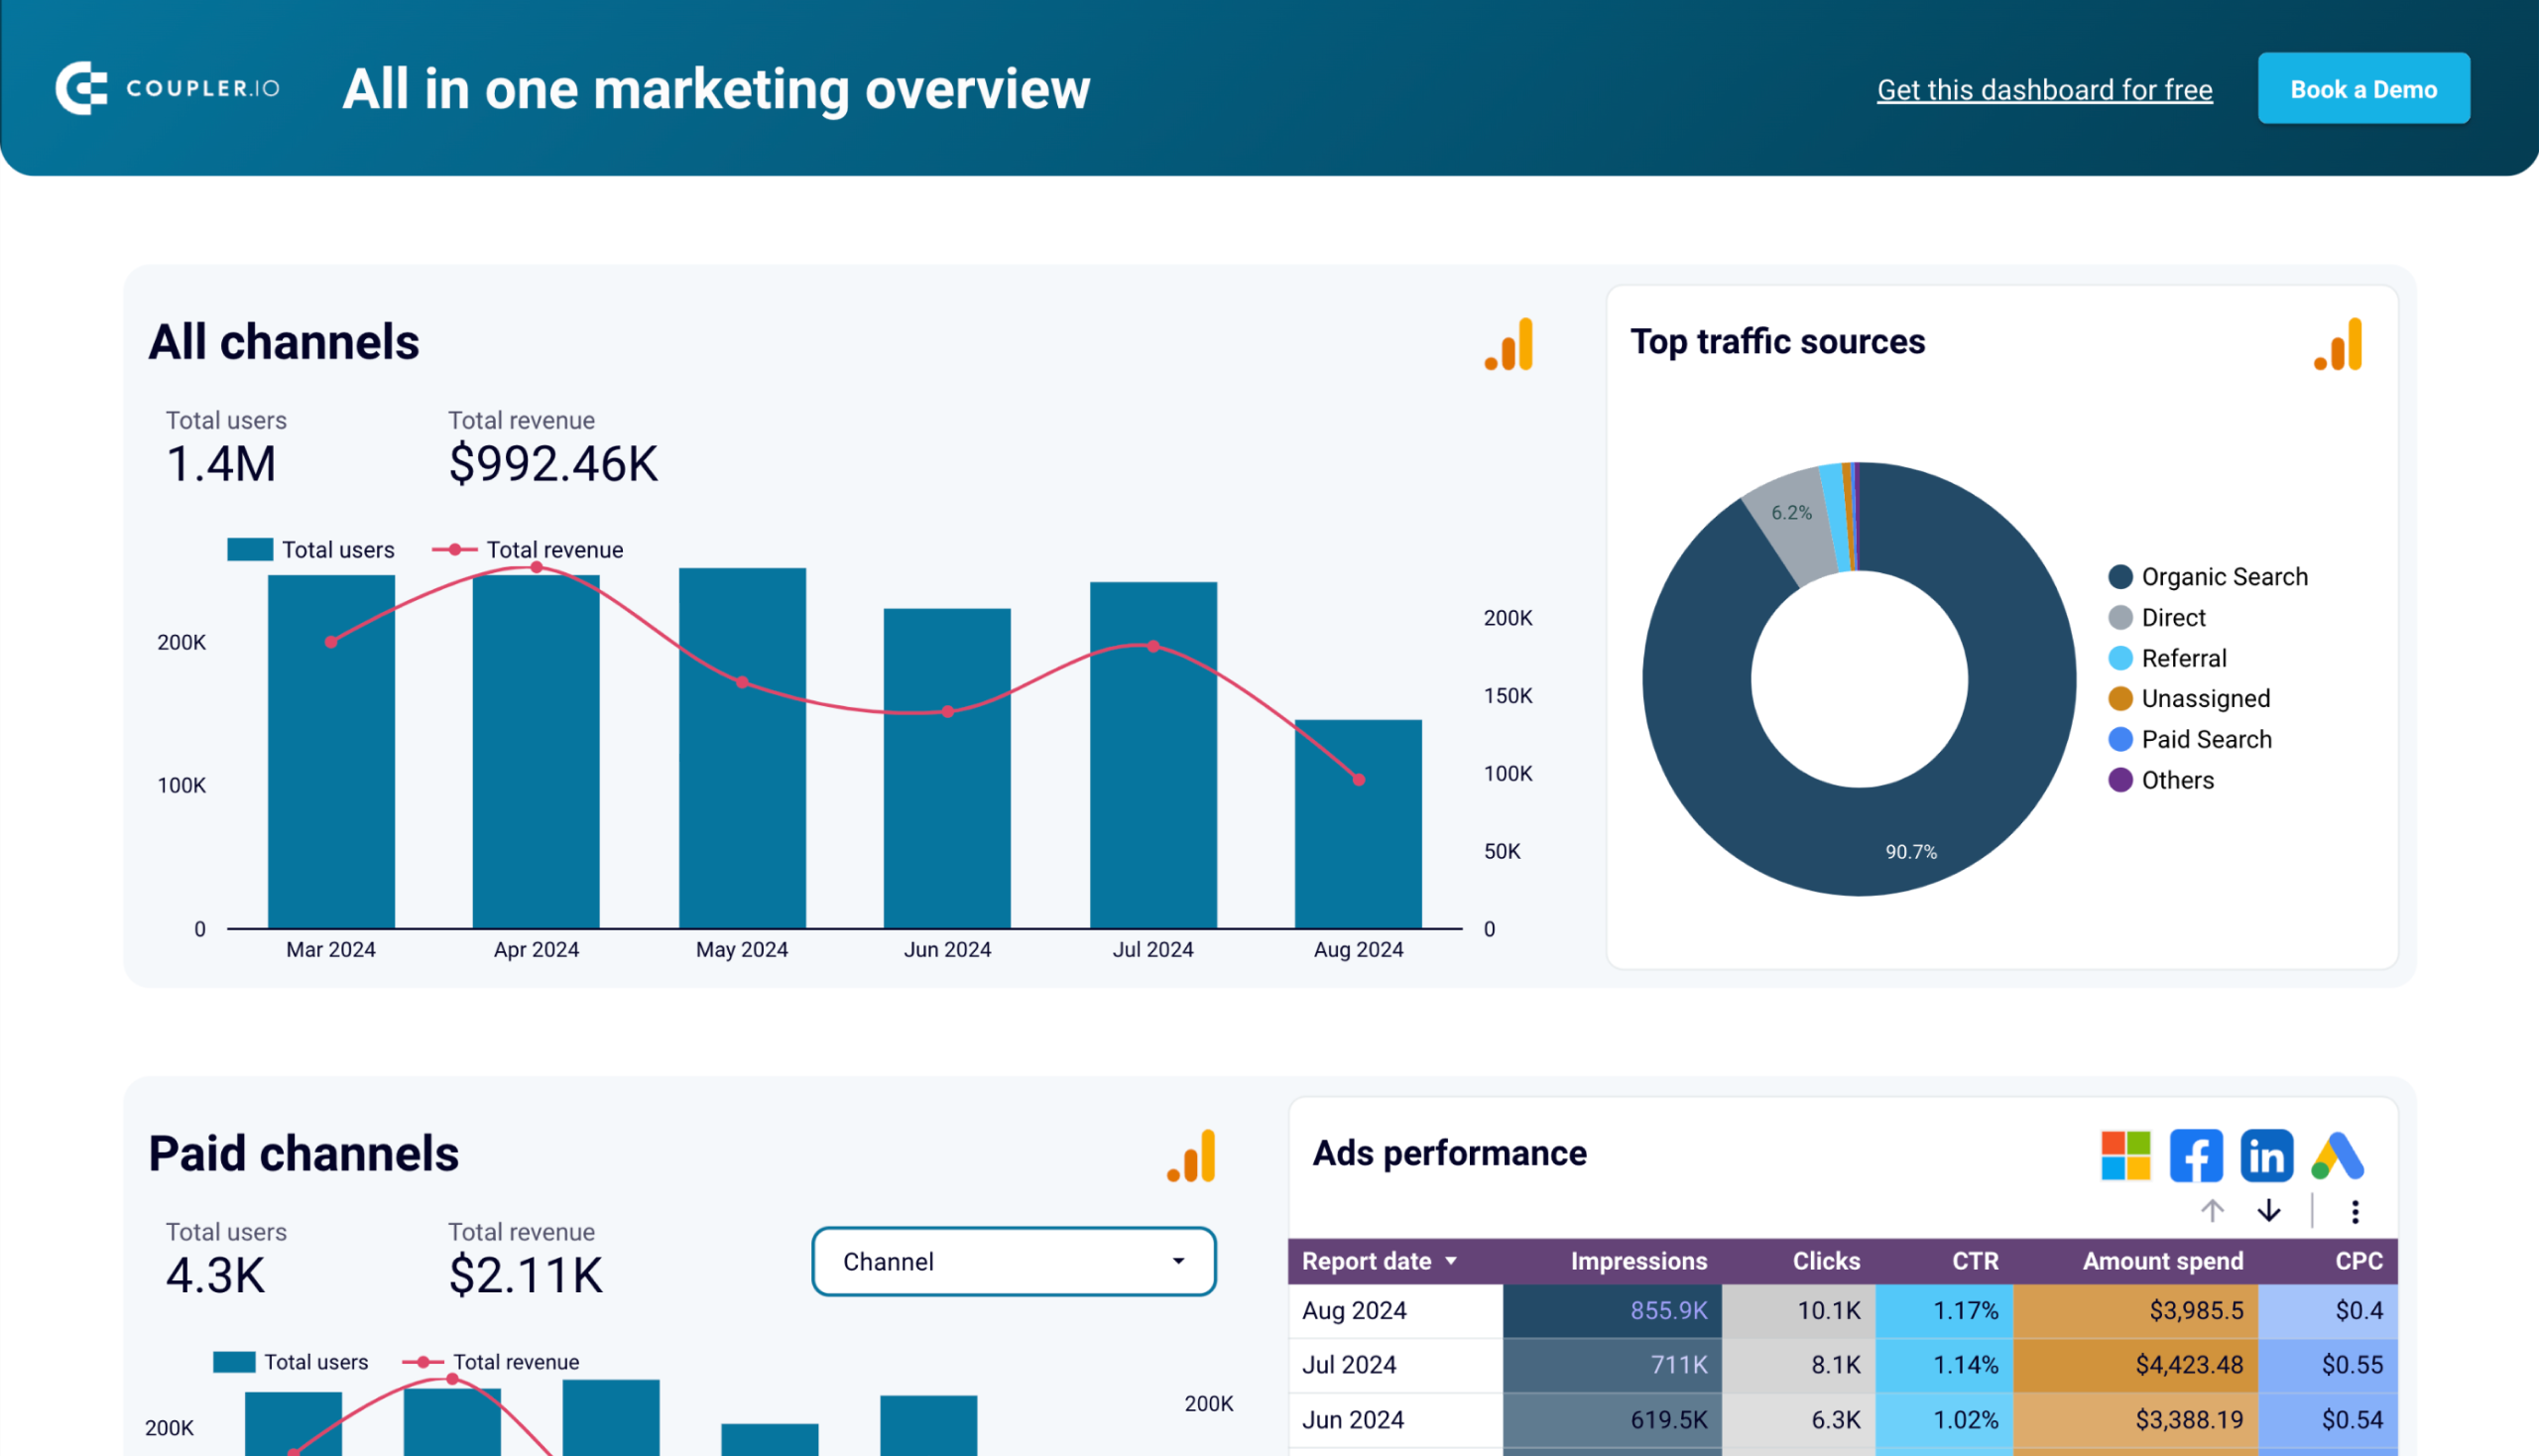
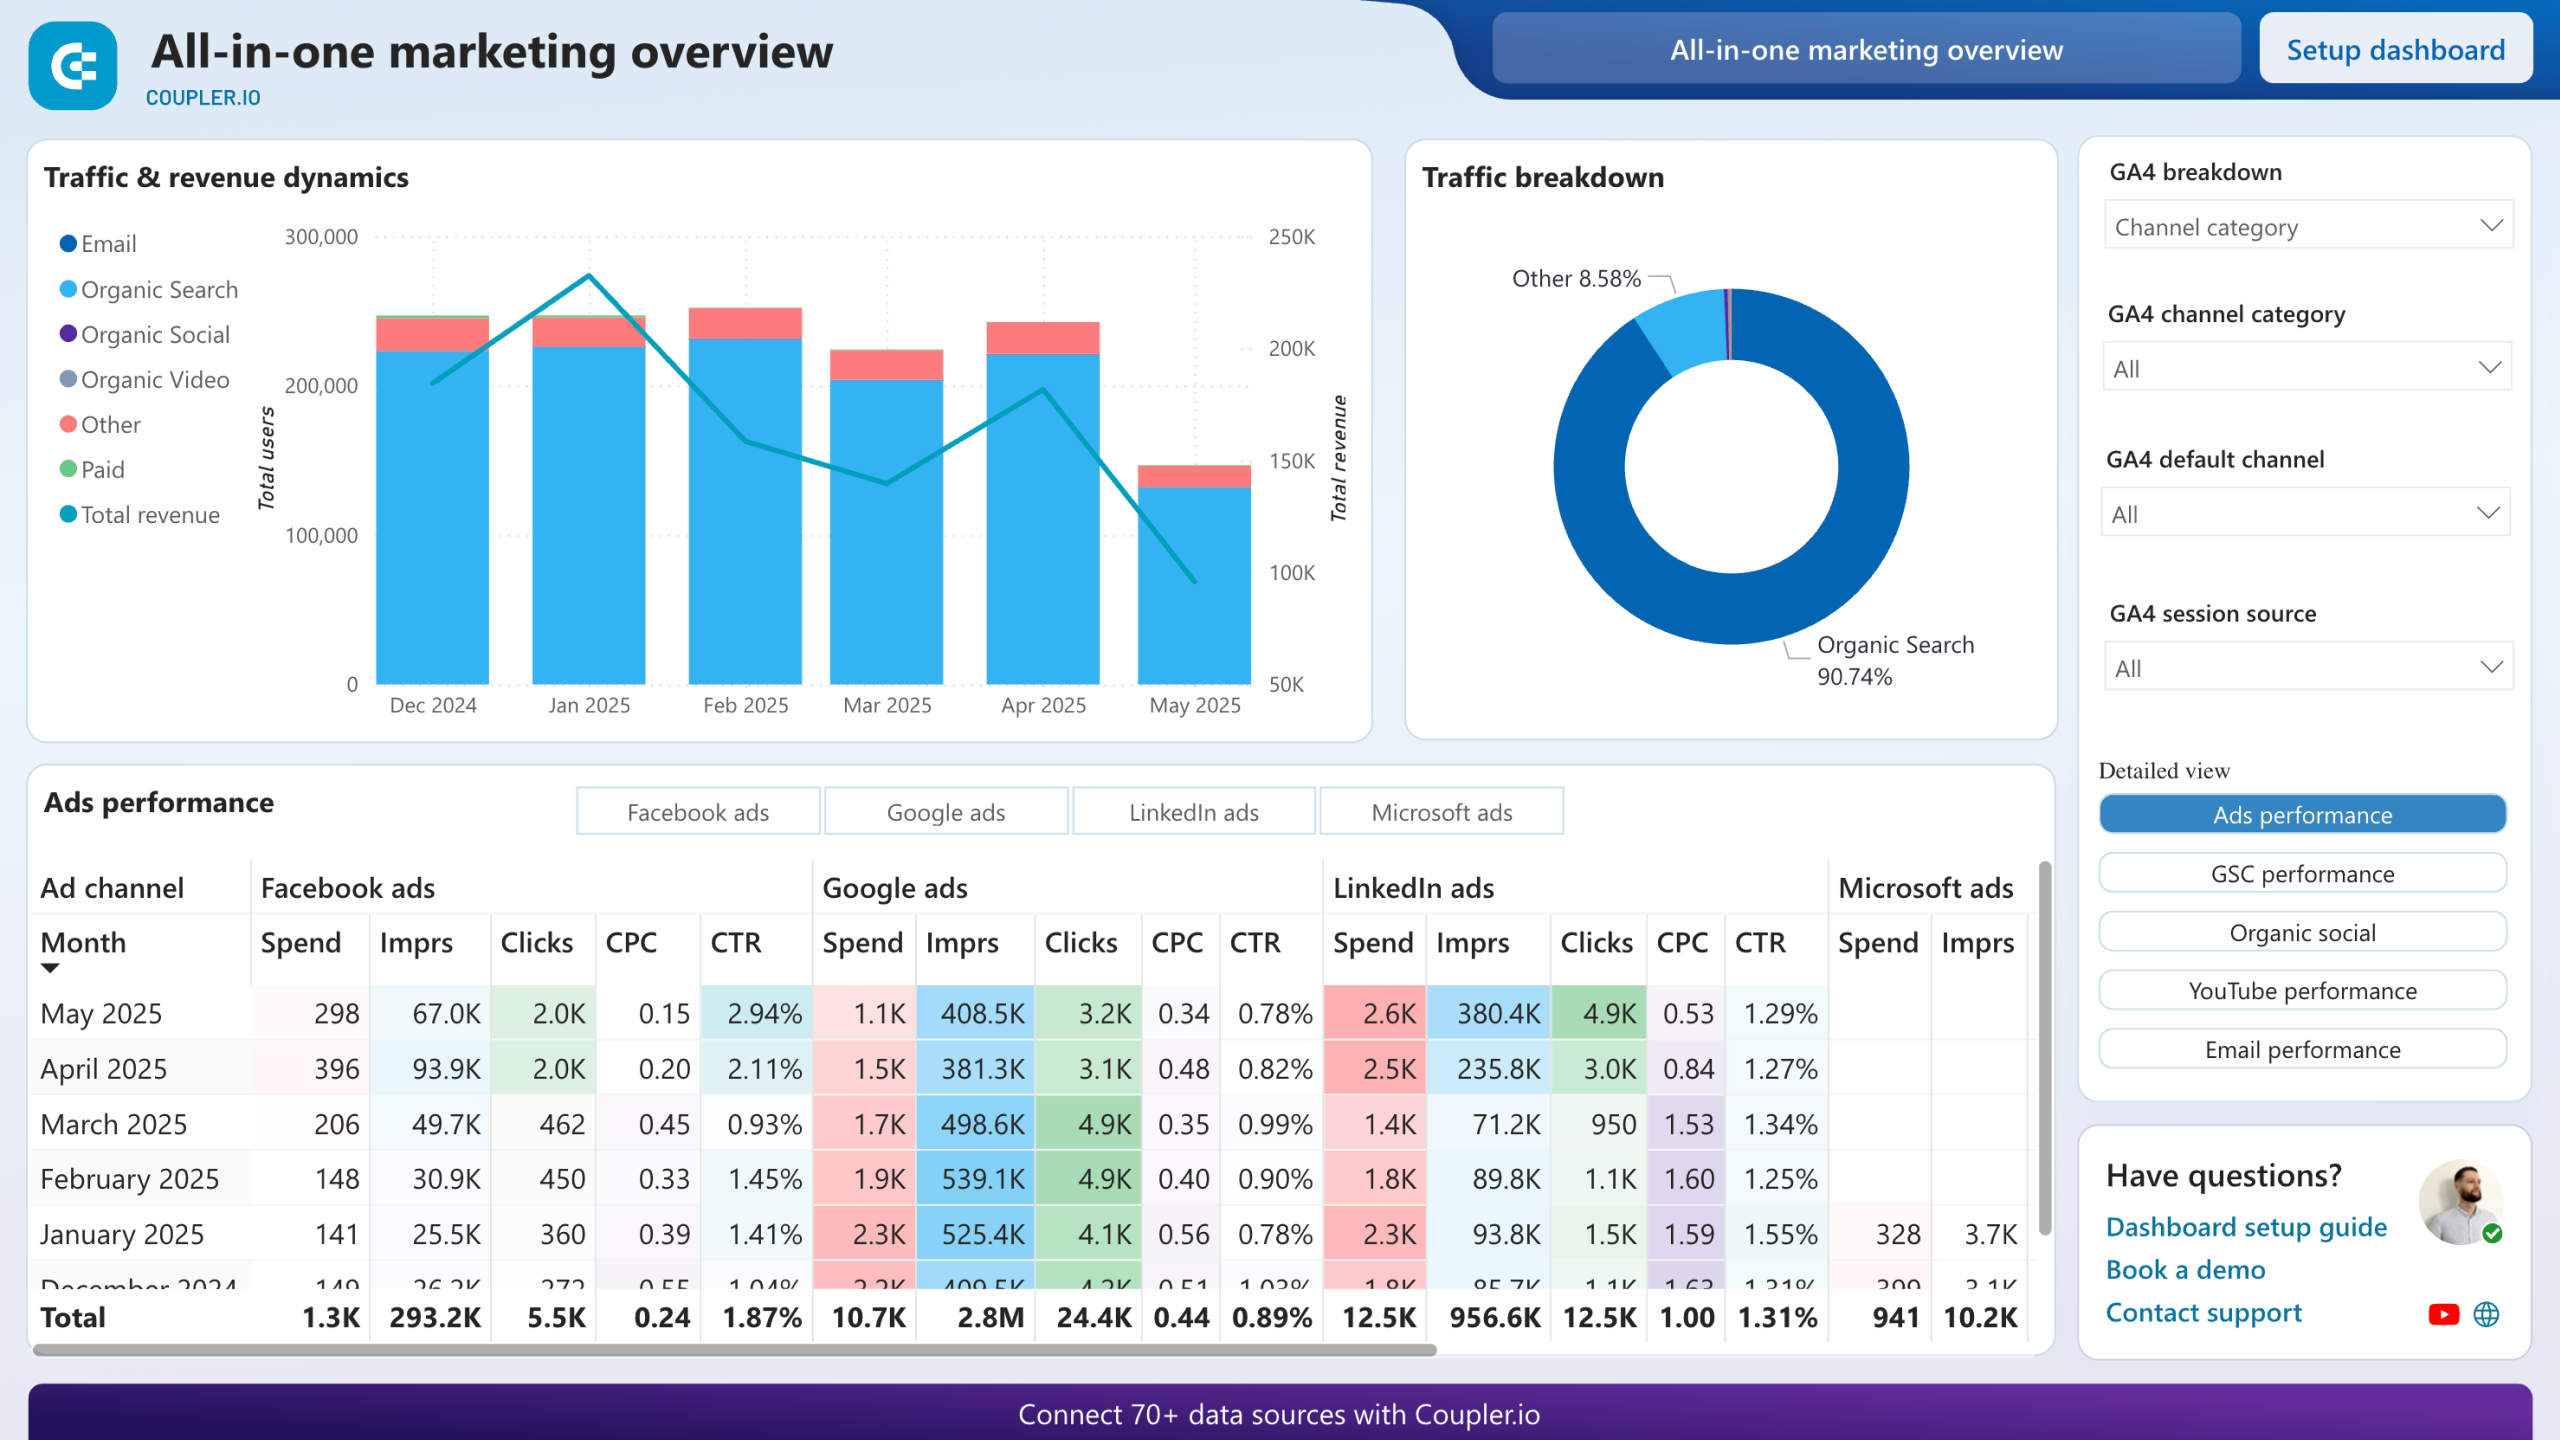
The dashboard is available in Coupler.io and as a template in Looker Studio and Power BI. To implement this marketing overview with your own data, simply follow the connection instructions in the Readme tab to link your various marketing accounts.
All-in-one marketing dashboard
Track performance across multiple marketing channels in one interface, comparing data from Google Analytics, Search Console, advertising platforms, social media, email, and YouTube to optimize your marketing strategy and maximize ROI.


All-in-one marketing dashboard in Looker Studio
Monitor all your marketing channels with an all-in-one dashboard providing performance overviews of web analytics, ad campaigns, SEO, social media, and emails.
All-in-one marketing dashboard in Power BI
Centralize all your marketing channel performance data, including paid ads, organic search, social media, email campaigns, and website analytics for comprehensive strategy oversight.
Coupler.io powers all these dashboard templates, and you can easily connect your ad platforms to start visualizing your blended data right away.
Explore more PPC dashboard templates
Get started for freeUse Coupler.io to blend data from ad sources and more
Blending data from multiple advertising sources is no longer a luxury – it’s a necessity for marketers looking to optimize their campaigns and make data-driven decisions. By consolidating your ad data, you gain a comprehensive view of performance across channels, enabling more efficient budget allocation and better ROI.
Coupler.io simplifies this process by providing an intuitive interface for connecting to over 60 data sources, including all major advertising platforms. With its powerful transformation features, you can join or append data from different sources without writing a single line of code.
The benefits of using Coupler.io for ad data blending include:
- Automation: Schedule regular data refreshes to keep your reports up-to-date.
- Multichannel support: Load data from the most common ad platforms, including Google, Meta (Facebook+Instagram), LinkedIn, Microsoft, TikTok, X (Twitter), Quora, Amazon, Apple Search, Pinterest, and Snapchat.
- Organization: Append data to create multichannel reports or join datasets if you need cross-channel analysis. Clean, reshape, and drill down your data during the integration process.
- Pre-built dashboards: Get started quickly with ready-to-use dashboard templates.
Ready to transform your advertising analytics? Try Coupler.io today and take the first step toward unified, insightful advertising performance reporting.


