HubSpot generates useful reports, but exporting them means downloading one at a time, no scheduled downloads, and no way to combine CRM data with ad spend or web analytics. With Coupler.io, you can automate HubSpot data exports into self-refreshing reports in spreadsheets or even dashboards in Looker Studio or Power BI. Without any manual work required.
In this guide, we cover both options: native HubSpot report exports and custom reporting with Coupler.io.
In this guide, we will cover both options: how to export HubSpot reports and how you can extract HubSpot data to create a custom reporting solution.
How to export HubSpot reports – key options
There are two ways to export HubSpot reports:
- Coupler.io: This data integration platform does not export HubSpot reports directly, but enables you to create analysis-ready HubSpot data sets and load them to over 10 different destinations. Moreover, you can build a report based on multiple types of HubSpot data or enrich information with records from other sources like Google Analytics, QuickBooks, GoHighLevel, etc. Coupler.io will refresh the report on your chosen schedule to reflect the latest changes in the source data.
- Export native HubSpot reports: HubSpot provides built-in methods to export native reports, whether preset or custom-created within the platform. This way, it’s also possible to export list from HubSpot. The process is quite simple, as you can:
- Export reports from the platform itself to a spreadsheet file format: CSV, XLS, or XLSX (except for social media reports)
- Share them via email as a spreadsheet file (comes with restrictions and works for a limited set of reports) or as a visual, which may not include the full report
- Send reports to a Slack channel or individual user in a visual format, which may also be incomplete
The major drawback of this method is that you’ll have to go through the process for each report individually, and there is no way to schedule repeated downloads – only recurring shares via email or Slack.
Both methods are viable options depending on your exporting needs. However, custom reports built with Coupler.io are a more efficient way if you want to export more frequently, and they also allow you to combine data from multiple sources.
Create a custom HubSpot report and export it with Coupler.io
Coupler.io enables you to create custom HubSpot reports by exporting data from the CRM, such as deals, contacts, products, etc. You can load reports into spreadsheets, BI tools, data warehouses, and evel AI tools. The workflow is quite simple, and you can try it for free right away with the form below. Select the destination for your HubSpot report and click Proceed. You’ll be offered to sign up for Coupler.io at no cost without requiring a credit card.
Step 1. Extract HubSpot data
Connect your HubSpot account and choose the data entity you need to fetch. Let’s say you’re going to create a custom report to analyze the deal conversion rate. In that case, leave the preselected Deals data entity as it is. Alternatively, you have 20+ other options, such as quotes, leads, taxes, and more.
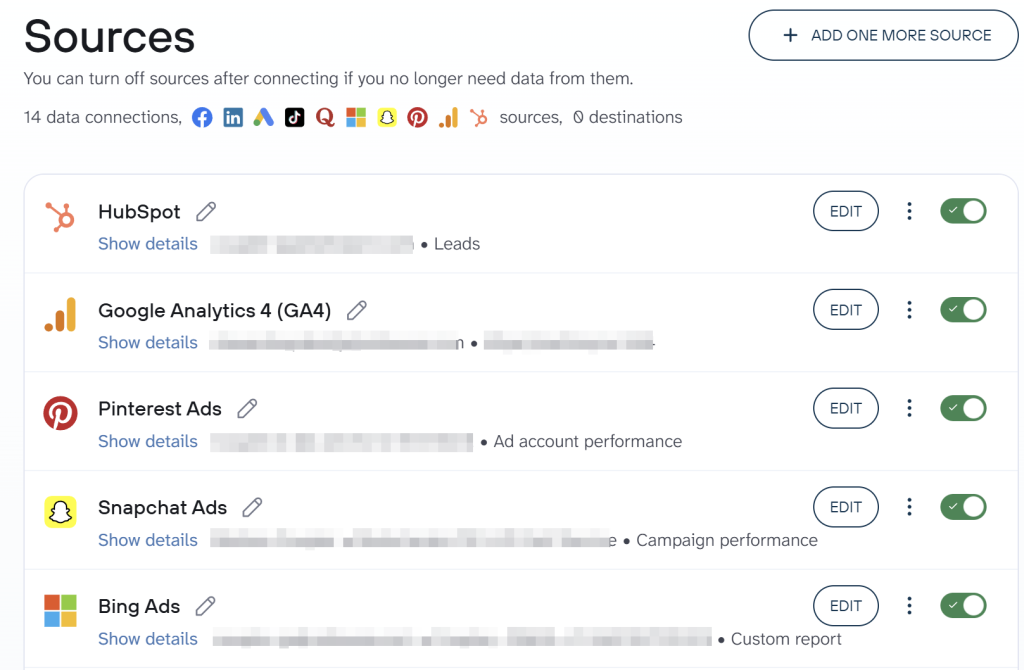
Before moving forward, you can add more sources to the same data flow. This is where Coupler.io goes beyond what native HubSpot reporting can do: add a second HubSpot entity (like contacts alongside deals), or bring in data from Google Ads, Facebook Ads, GA4, or any of 400+ other sources to build a cross-platform report.
Step 2. Organize and adjust the data
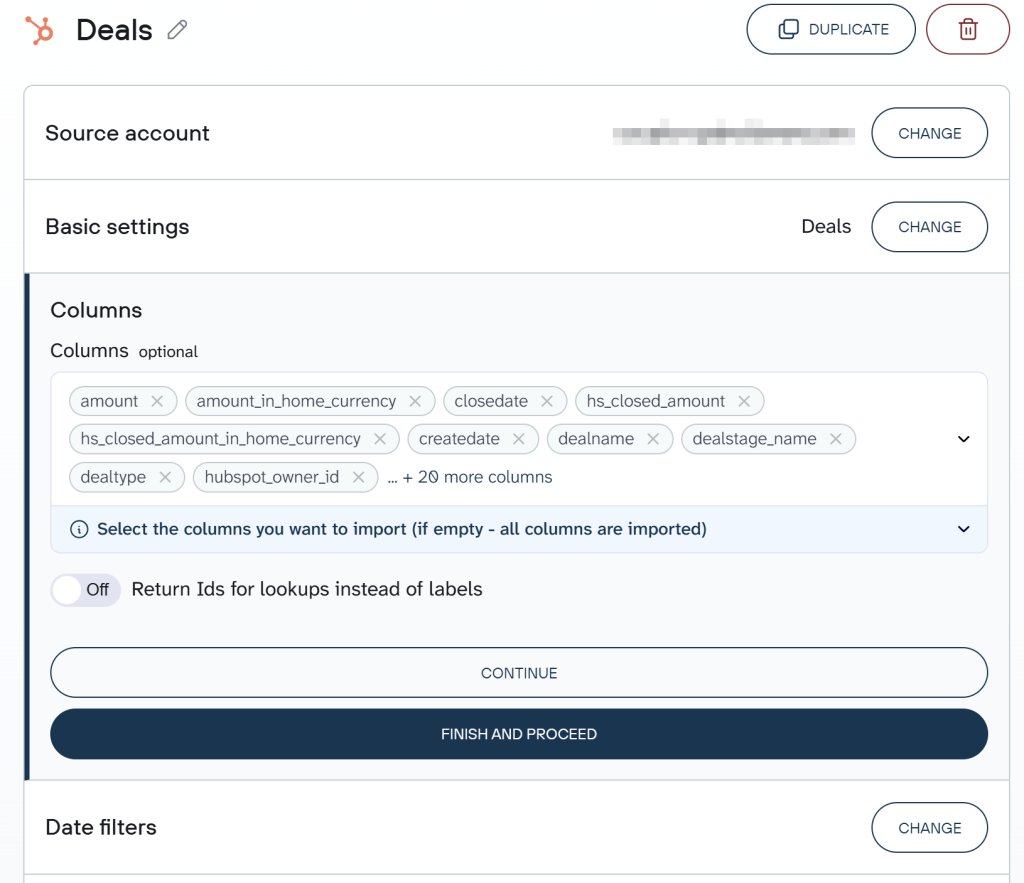
Raw HubSpot data often includes dozens of system properties and internal fields that clutter your report. Preview your data and adjust it as needed:
- Rename, rearrange, or hide columns — drop fields like
hs_object_idorhs_lastmodifieddatethat add noise, renamedealnameto “Deal Name” for readability, and move key columns like “Deal Stage” and “Close Date” to the front. - Sort data in ascending or descending order — for example, sort by deal amount descending to prioritize high-value opportunities.
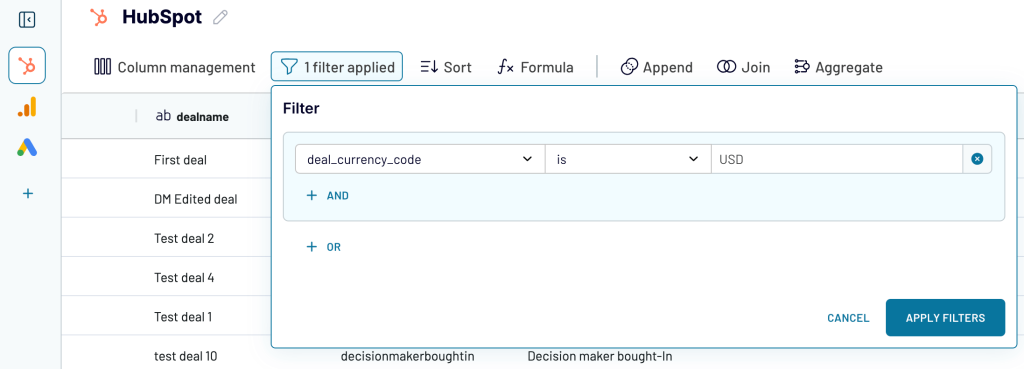
- Filter data to extract only what you need. For instance, filter to show only deals in “Closed Won” stage, or exclude deals with $0 value.
- Aggregate data using sum, avg, count, min, or max. For example, sum deal amounts by owner to see revenue per rep, or count deals per pipeline stage to identify bottlenecks.
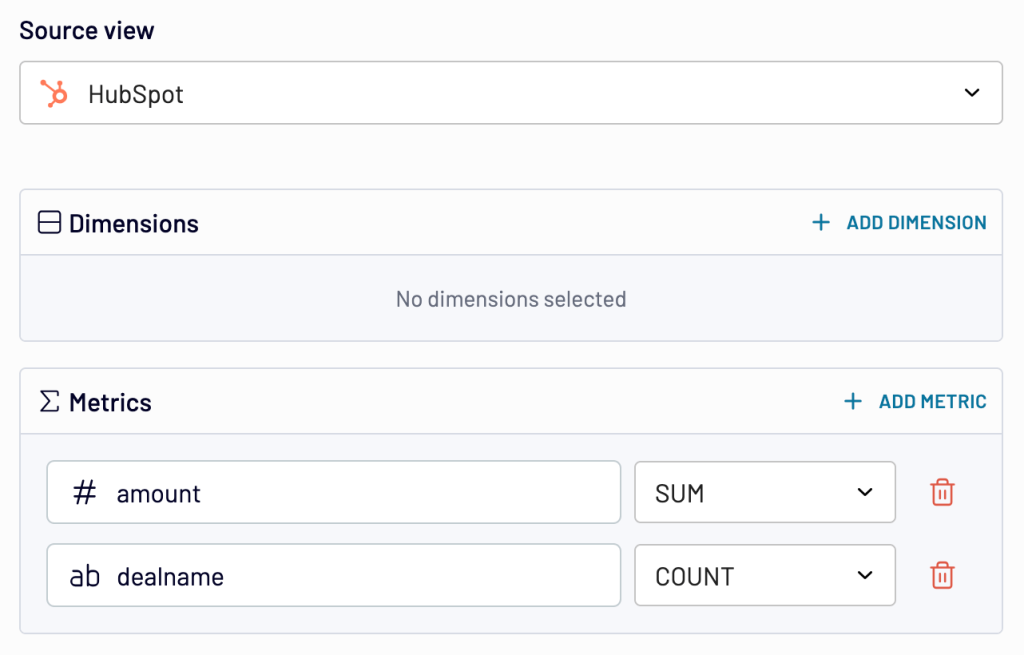
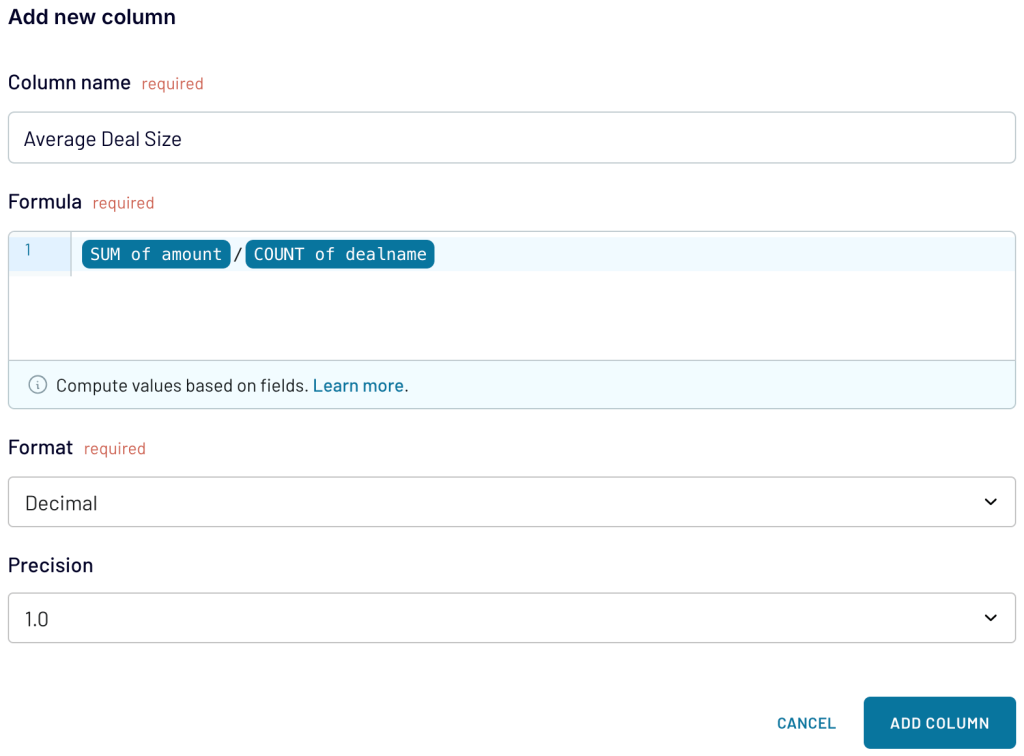
- Create calculated columns with formulas. For instance, calculate the average deal size by dividing the Sum of amounts by the count of deals.
- Blend data from multiple sources if you’ve connected more than one:
- Append – merge datasets with similar structures and columns matched by name.
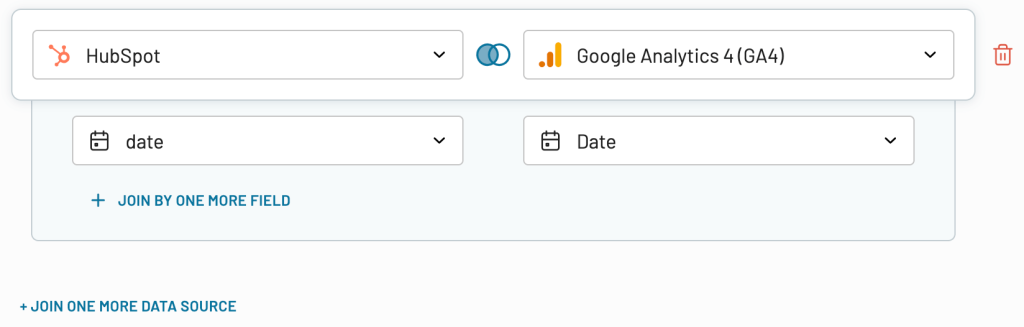
- Join – combine datasets with different structures and at least one matched column.
Once the report is ready, proceed to load it into the destination.
Step 3. Load the data and schedule a refresh
Connect your destination app and follow Coupler.io’s instructions to load the data into spreadsheets, BI tools, data warehouses, or AI assistants.
Coupler.io allows you to:
- Connect HubSpot to Looker Studio
- Export HubSpot to Google Sheets
- Load HubSpot to Excel, and more.
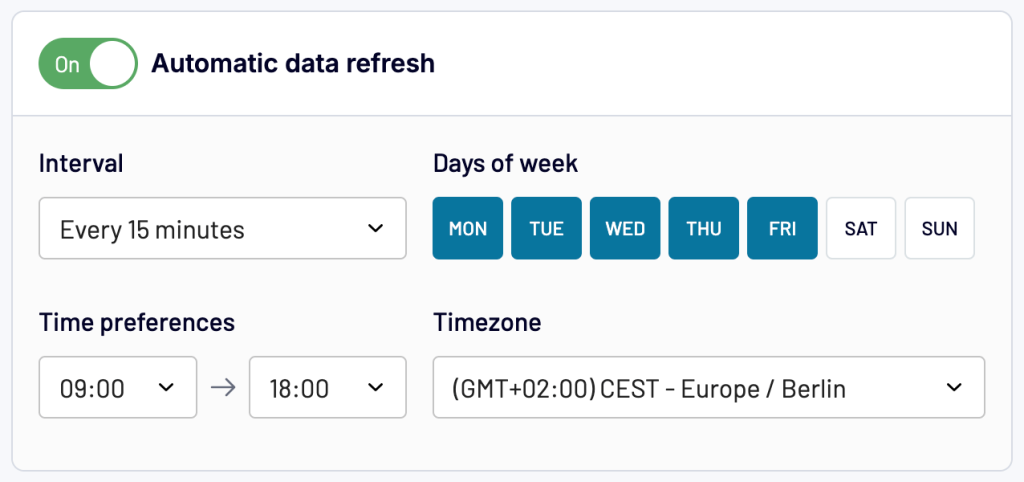
Next, turn on automatic data refresh. Specify your preferred interval along with the days, hours, and time zone. Make sure to click Save and Run — only then will your automated HubSpot report be enabled.
Your custom HubSpot report will now be delivered to your destination on schedule, always reflecting the latest data.
What data can you export from HubSpot with Coupler.io?
The following data types are available for export from HubSpot :
- Contacts — all contact records with properties like email, lifecycle stage, lead status, and custom fields
- Companies — company records including industry, size, revenue, and associated contacts
- Deals — full deal pipeline data with stages, amounts, close dates, and deal owners
- Products — your product catalog with names, descriptions, prices, and SKUs
- Line Items — individual product entries tied to deals, including quantity and pricing
- Tickets — support ticket records with status, priority, and resolution details
- Quotes — quote records linked to deals with pricing and approval status
- Communications — logged communications across your CRM
- Feedback Submissions — customer feedback and survey responses
- Taxes — tax configuration data
- Goals — sales goals and targets
- Owners — HubSpot users and their ownership assignments
- Calls — logged call activities with duration and outcomes
- Emails — email activity records
- Meetings — scheduled and completed meeting records
- Notes — CRM notes attached to contacts, deals, or companies
- Tasks — task records with status, due dates, and assignees
- Marketing Emails — marketing email campaign data
- Workflows — automation workflow records
- Broadcast Messages — social media broadcast data
- Report: Email Statistics by Period — aggregated email performance metrics
- Performance Report — HubSpot performance data by channel, country, page, or campaign
- Custom Data Entities — any custom objects you’ve created in HubSpot
Get analysis-ready HubSpot reports in a few clicks
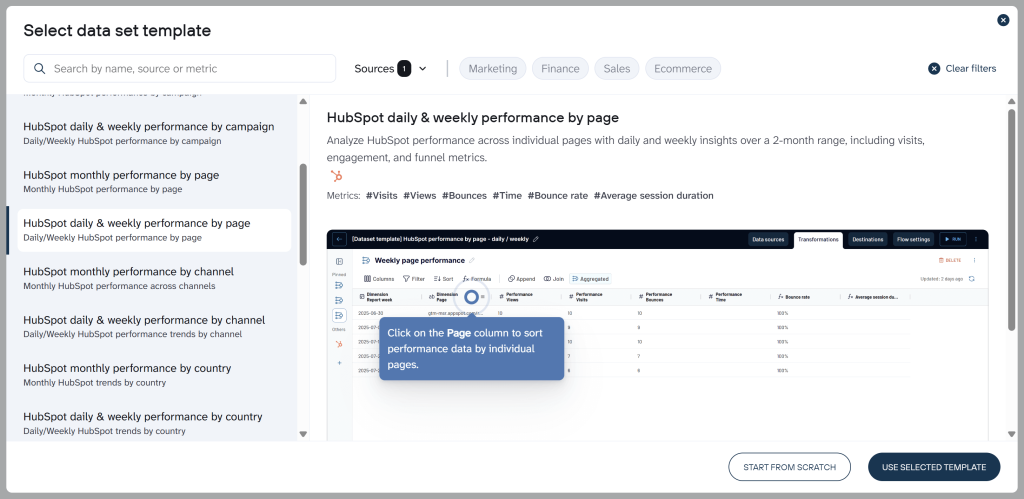
To skip building reports from scratch, Coupler.io provides pre-built data set templates for HubSpot. These templates come with your HubSpot data already structured, combined where relevant (e.g., joining deals with contact details, company information, or line items), and organized for immediate analysis.
Examples from the available templates:
- HubSpot Deals with Contacts and Companies — a complete view of your sales relationships and pipeline health, combining deal data with linked contacts and companies. Includes amount, stage probability, sales cycle length, and contacts with buying roles.
- HubSpot Deals with Line Items — deal-level data paired with associated line items to understand product-level contributions, including unit price, quantity, and total contract value.
- HubSpot Tasks with Deals — tasks surfaced alongside related deal details for optimizing follow-ups. Includes probability to complete, missed due date count, and deal amounts.
- HubSpot Emails — email engagement tracking with open rate, click rate, reply rate, and sent/open/click counts.
- HubSpot Deals Performance by Channel — deal performance across channels over 12 months, with closed amount, win rate, and close rate.
- Customer Acquisition for HubSpot — a cross-platform template that integrates ad data (Google Ads, Facebook Ads, LinkedIn Ads, and more), GA4, and HubSpot to monitor the full acquisition funnel. Covers impressions, clicks, amount spent, CPC, CPM, CTR, and cost per lead.
To use a template, create a new data flow in Coupler.io and select Start with template, then search for “HubSpot.”
Blend HubSpot data with other sources
One of the key limitations of native HubSpot reporting is that you can’t mix HubSpot data with information from other platforms. Coupler.io removes that limitation by letting you add multiple sources to the same data flow and join or append the data.
Here’s how teams are using this in practice:
- HubSpot + Google Analytics — the most common combination. Connect deal and contact data with GA4 sessions, traffic sources, and conversion events to understand which website activity drives actual pipeline. Teams use this to build ROAS reports and attribute revenue to marketing channels.
- HubSpot + QuickBooks — merge CRM deal data with financial records for payment reconciliation, revenue recognition, and tracking which closed deals have been invoiced and paid.
- HubSpot + Google Ads + Facebook Ads + Microsoft Advertising — build complete cross-channel paid media reporting tied to CRM outcomes. Compare CPL across platforms and allocate budget to the channels producing the best leads.
- HubSpot + LinkedIn Ads + Google Ads + Google Analytics — a common B2B setup for customer acquisition dashboards. Track the full funnel from ad impression through website visit to HubSpot lead creation and deal close.
- HubSpot + Airtable — combine CRM data with project management or property tracking data for account-level reporting that spans sales and operations.
These reflect actual data flows Coupler.io users have built. You can add any combination of 400+ sources to a single data flow and join or append the data as needed.
Automate HubSpot reporting with Coupler.io
Get started for freeFree HubSpot reporting templates
To analyze your data from HubSpot and beyond without building reports yourself, use white-label templates designed in BI tools. Coupler.io offers a gallery of free HubSpot reporting dashboards. Each has a Coupler.io connector to automatically load data into the self-updating dashboard.
Sales KPI dashboard for HubSpot
The sales KPI dashboard lets you visualize key sales performance indicators. Use it to turn raw sales figures from HubSpot into meaningful metrics so you can make data-driven decisions and contribute to business growth.
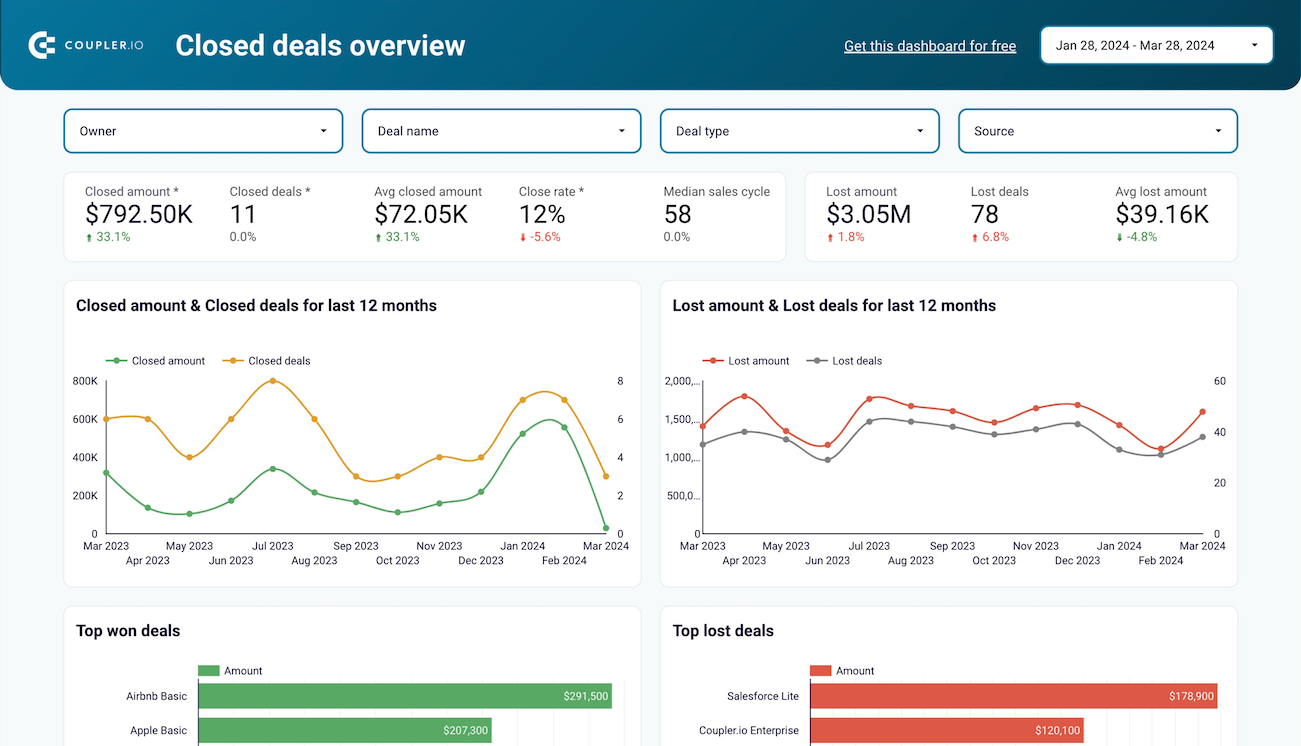
You’ll be able to refer to this dashboard for the following insights:
- Overview closed deals, deal amounts, lost revenue, close rate, top won/lost deals, etc.
- Monitor your sales pipeline to identify bottlenecks and optimize deal progression.
- Compare team performance to uncover best practices and coaching opportunities.
- Track deal and revenue trends to identify seasonal patterns and external influences.
- Analyze reasons for lost deals to improve conversion rates and sales processes.
The dashboard is available in the Looker Studio. To set it up, go to the template’s Readme tab and follow the instructions.
HubSpot CRM dashboard
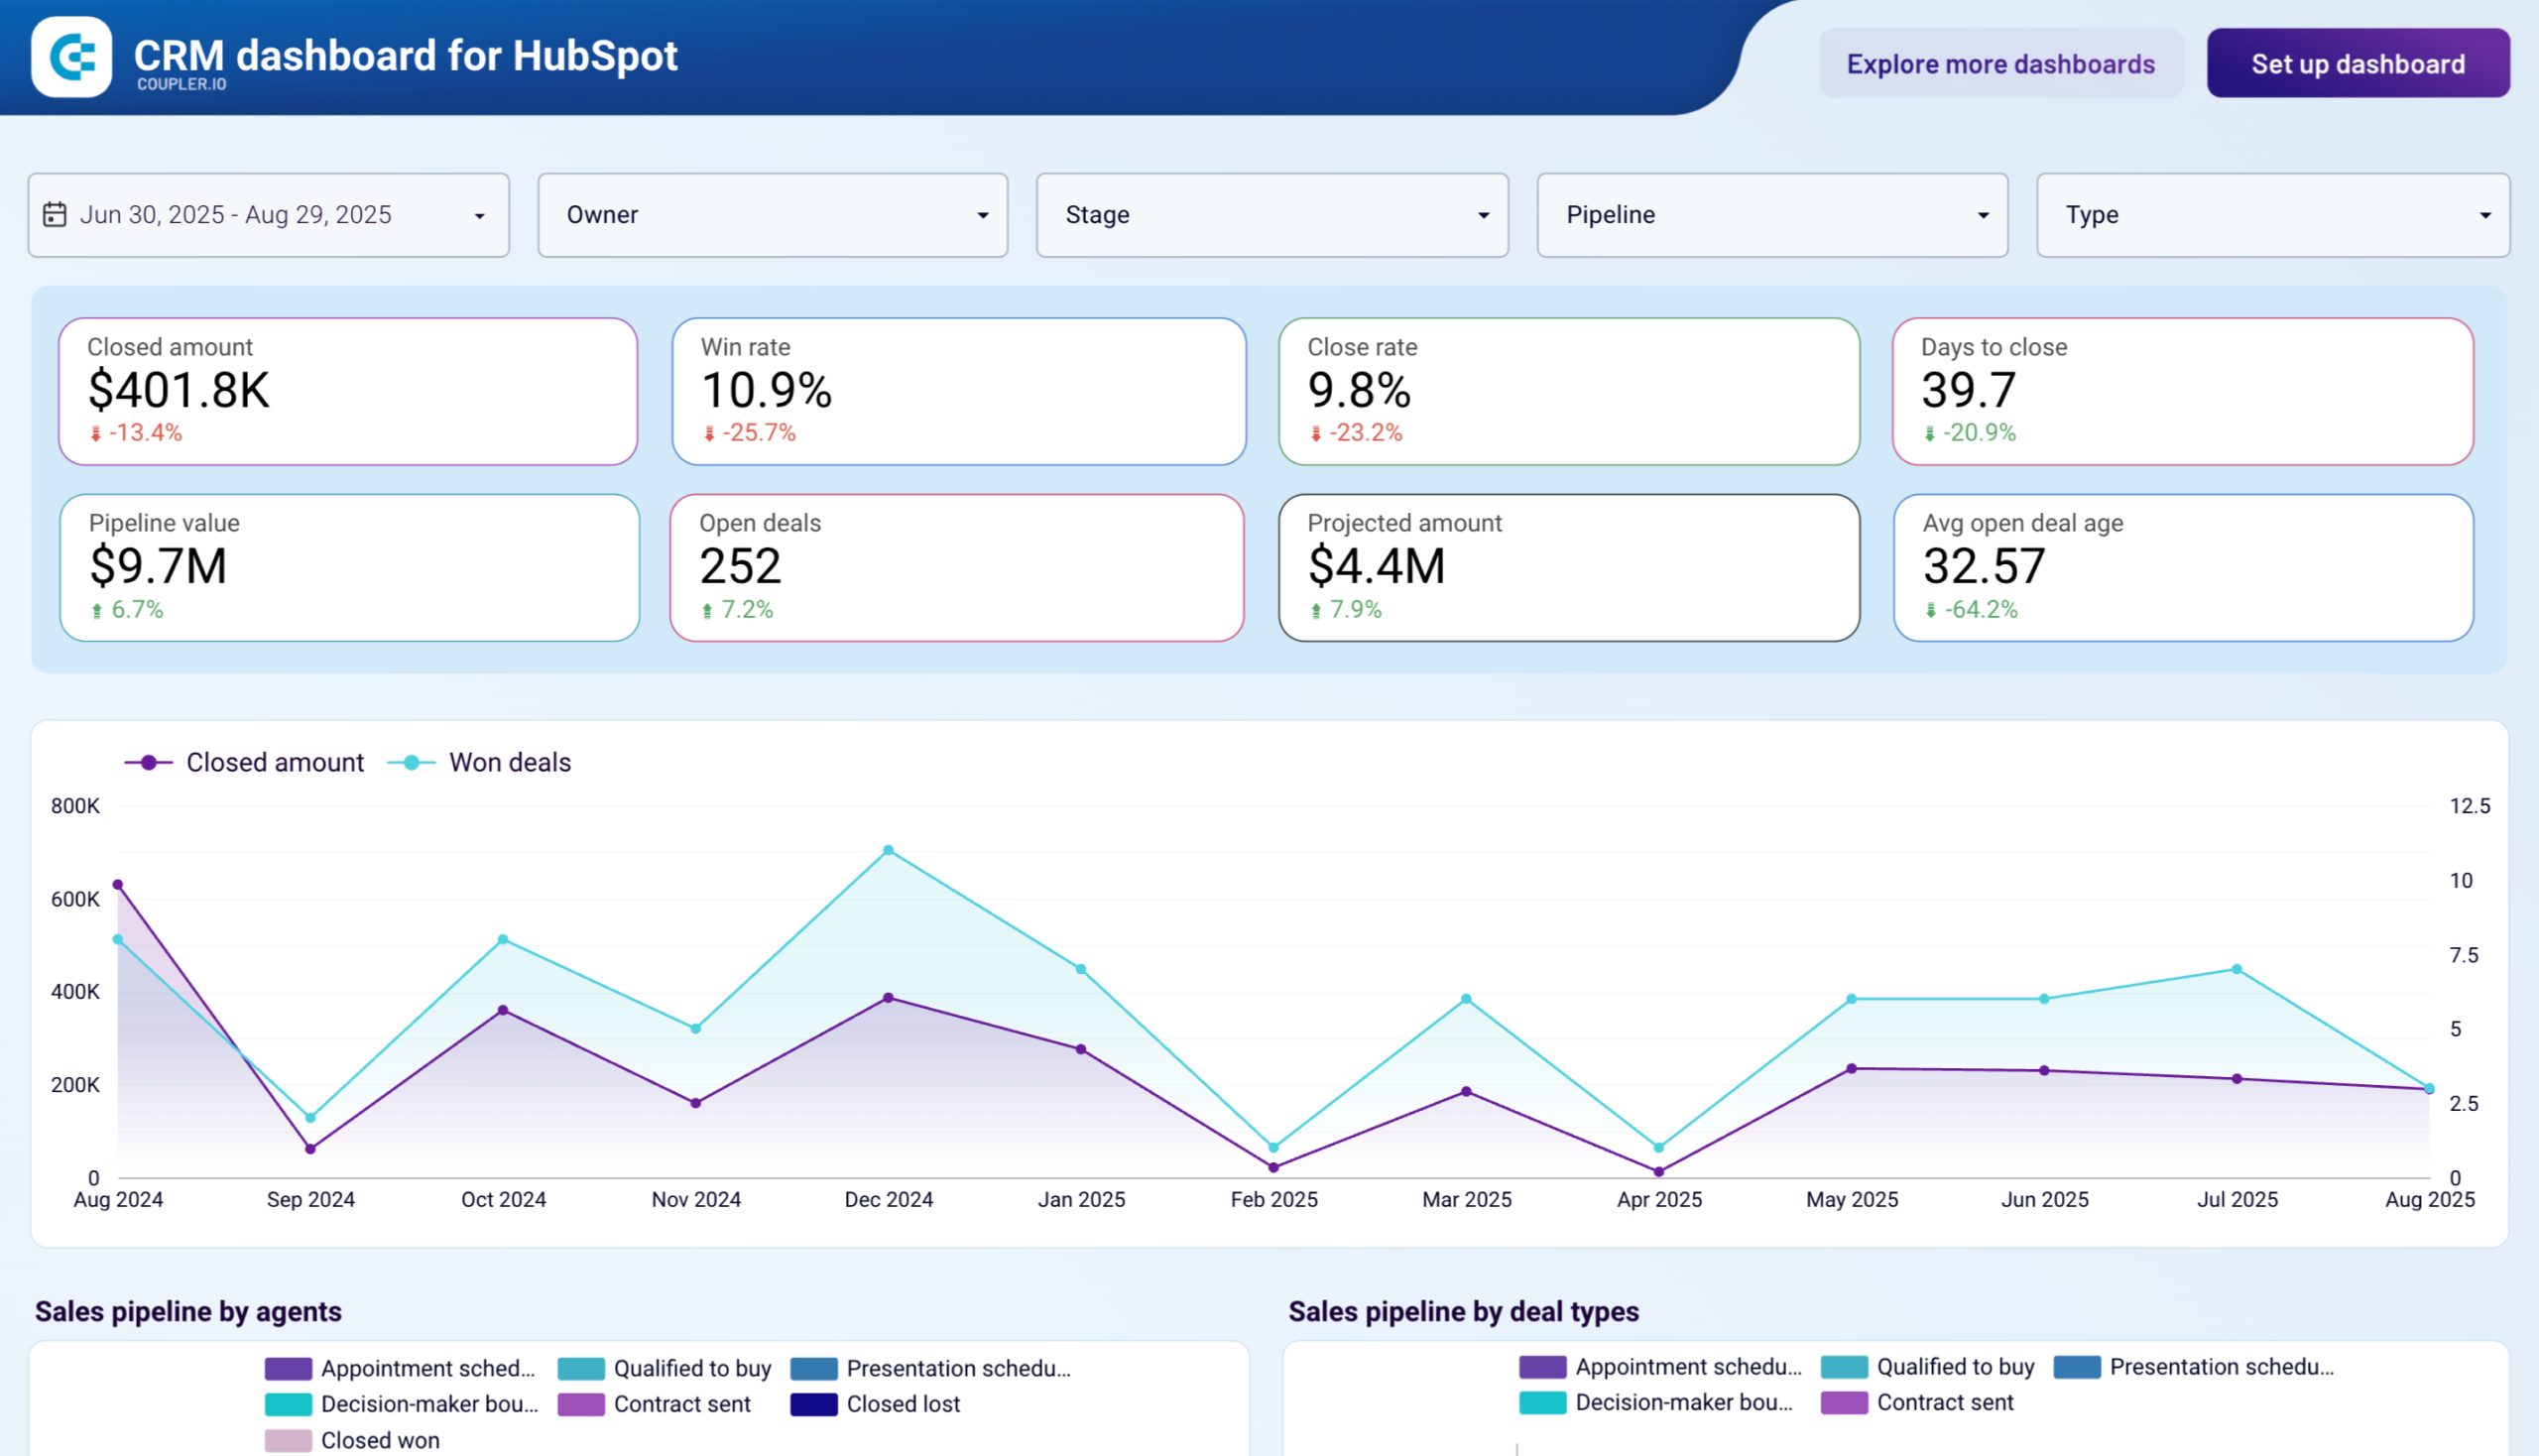
The CRM dashboard provides a complete view of your sales pipeline. This allows you to track performance, analyze deal progress, and uncover growth opportunities. You can also use it to extract and visualize key sales data, spot successful patterns, detect roadblocks, and more.
Browse through this dashboard anytime you need to:
- Monitor sales pipeline metrics with near real-time visibility into deals by stage.
- Track individual and team performance with comparative analytics.
- Analyze win/loss patterns to determine opportunity characteristics that lead to success.
- Check out revenue forecasts based on the current pipeline and historical close rates.
- Identify bottlenecks in your sales process where deals commonly stall.
You can set up this dashboard in Looker Studio or Power BI. Follow the instructions inside the template to connect your HubSpot account to the dashboard.
CRM dashboard for HubSpot in Looker Studio
Use our CRM dashboard for HubSpot to track key metrics, check how your sales team performs, and understand what drives your revenues.


CRM dashboard for HubSpot in Power BI
Evaluate sales team effectiveness and pipeline health with detailed HubSpot CRM analytics. Track closed amounts, monitor deal stages, analyze win and loss reasons, and compare agent performance to identify best practices and bottlenecks in your sales funnel.

Customer acquisition dashboard for HubSpot
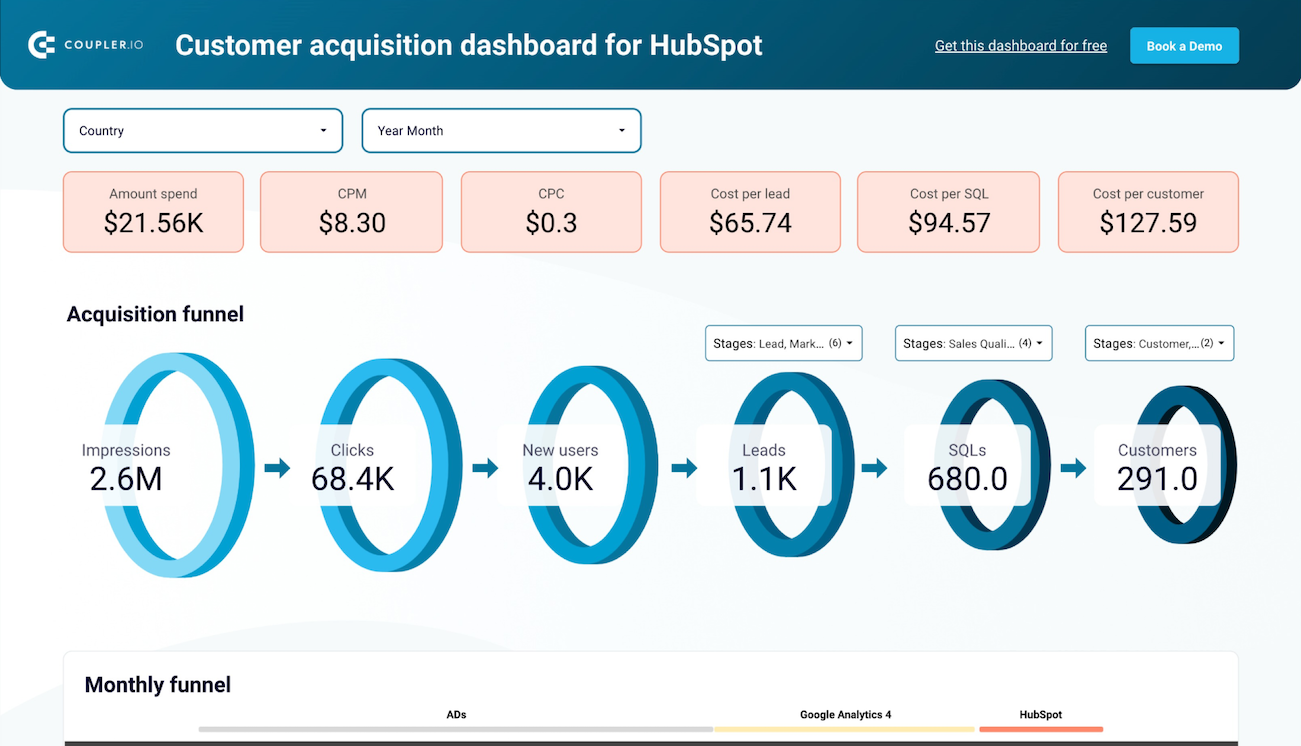
This dashboard illustrates how leads progress through the funnel – from ad impressions to CRM conversions. It combines HubSpot records with data from GA4 and ad platforms like Google, Meta, LinkedIn Ads, etc. With this information, you can identify funnel inefficiencies, optimize ad spend, and refine lead-generation strategies to maximize revenue.
Customer acquisition dashboard for HubSpot
 Preview dashboard
Customer acquisition dashboard for HubSpot
Preview dashboardWhat you can do with this dashboard:
- View your entire customer journey – from ad impressions to closed deals.
- Compare conversion rates between funnel stages against industry benchmarks.
- Identify performance trends and correlate them with specific marketing activities.
- Analyze ad spend efficiency across platforms to optimize budget allocation.
- Use historical data patterns to forecast sales based on current marketing investments.
The dashboard is designed in Looker Studio. To set it up, go to the template’s Readme tab and follow the provided instructions.
HubSpot marketing performance dashboard
It’s a general dashboard that covers all channels and funnel performance based on HubSpot’s CRM and marketing software. It combines website visitor reports with sales funnel overviews. This way, you can analyze visitor and lead geography, page performance, and the results of paid and email campaigns all in one place.
Note: You need a website created using HubSpot’s builder to populate all the reports in this dashboard.
HubSpot marketing performance dashboard
 Preview dashboard
HubSpot marketing performance dashboard
Preview dashboardBy using this dashboard, you’ll be able to view marketing performance from the following aspects:
- Track email campaign performance metrics, such as open rates, click-through rates, and conversion statistics.
- Monitor landing page effectiveness with visitor-to-lead conversion rates and form submission analytics.
- Analyze blog performance by traffic sources, engagement metrics, and lead generation potential.
- Measure social media campaign reach and engagement across connected platforms.
- Evaluate overall marketing ROI through pipeline attribution and deal creation metrics.
This template was created in Looker Studio. Click Readme for step-by-step instructions, and start using it for your reporting needs.
Marketing and sales dashboard for HubSpot
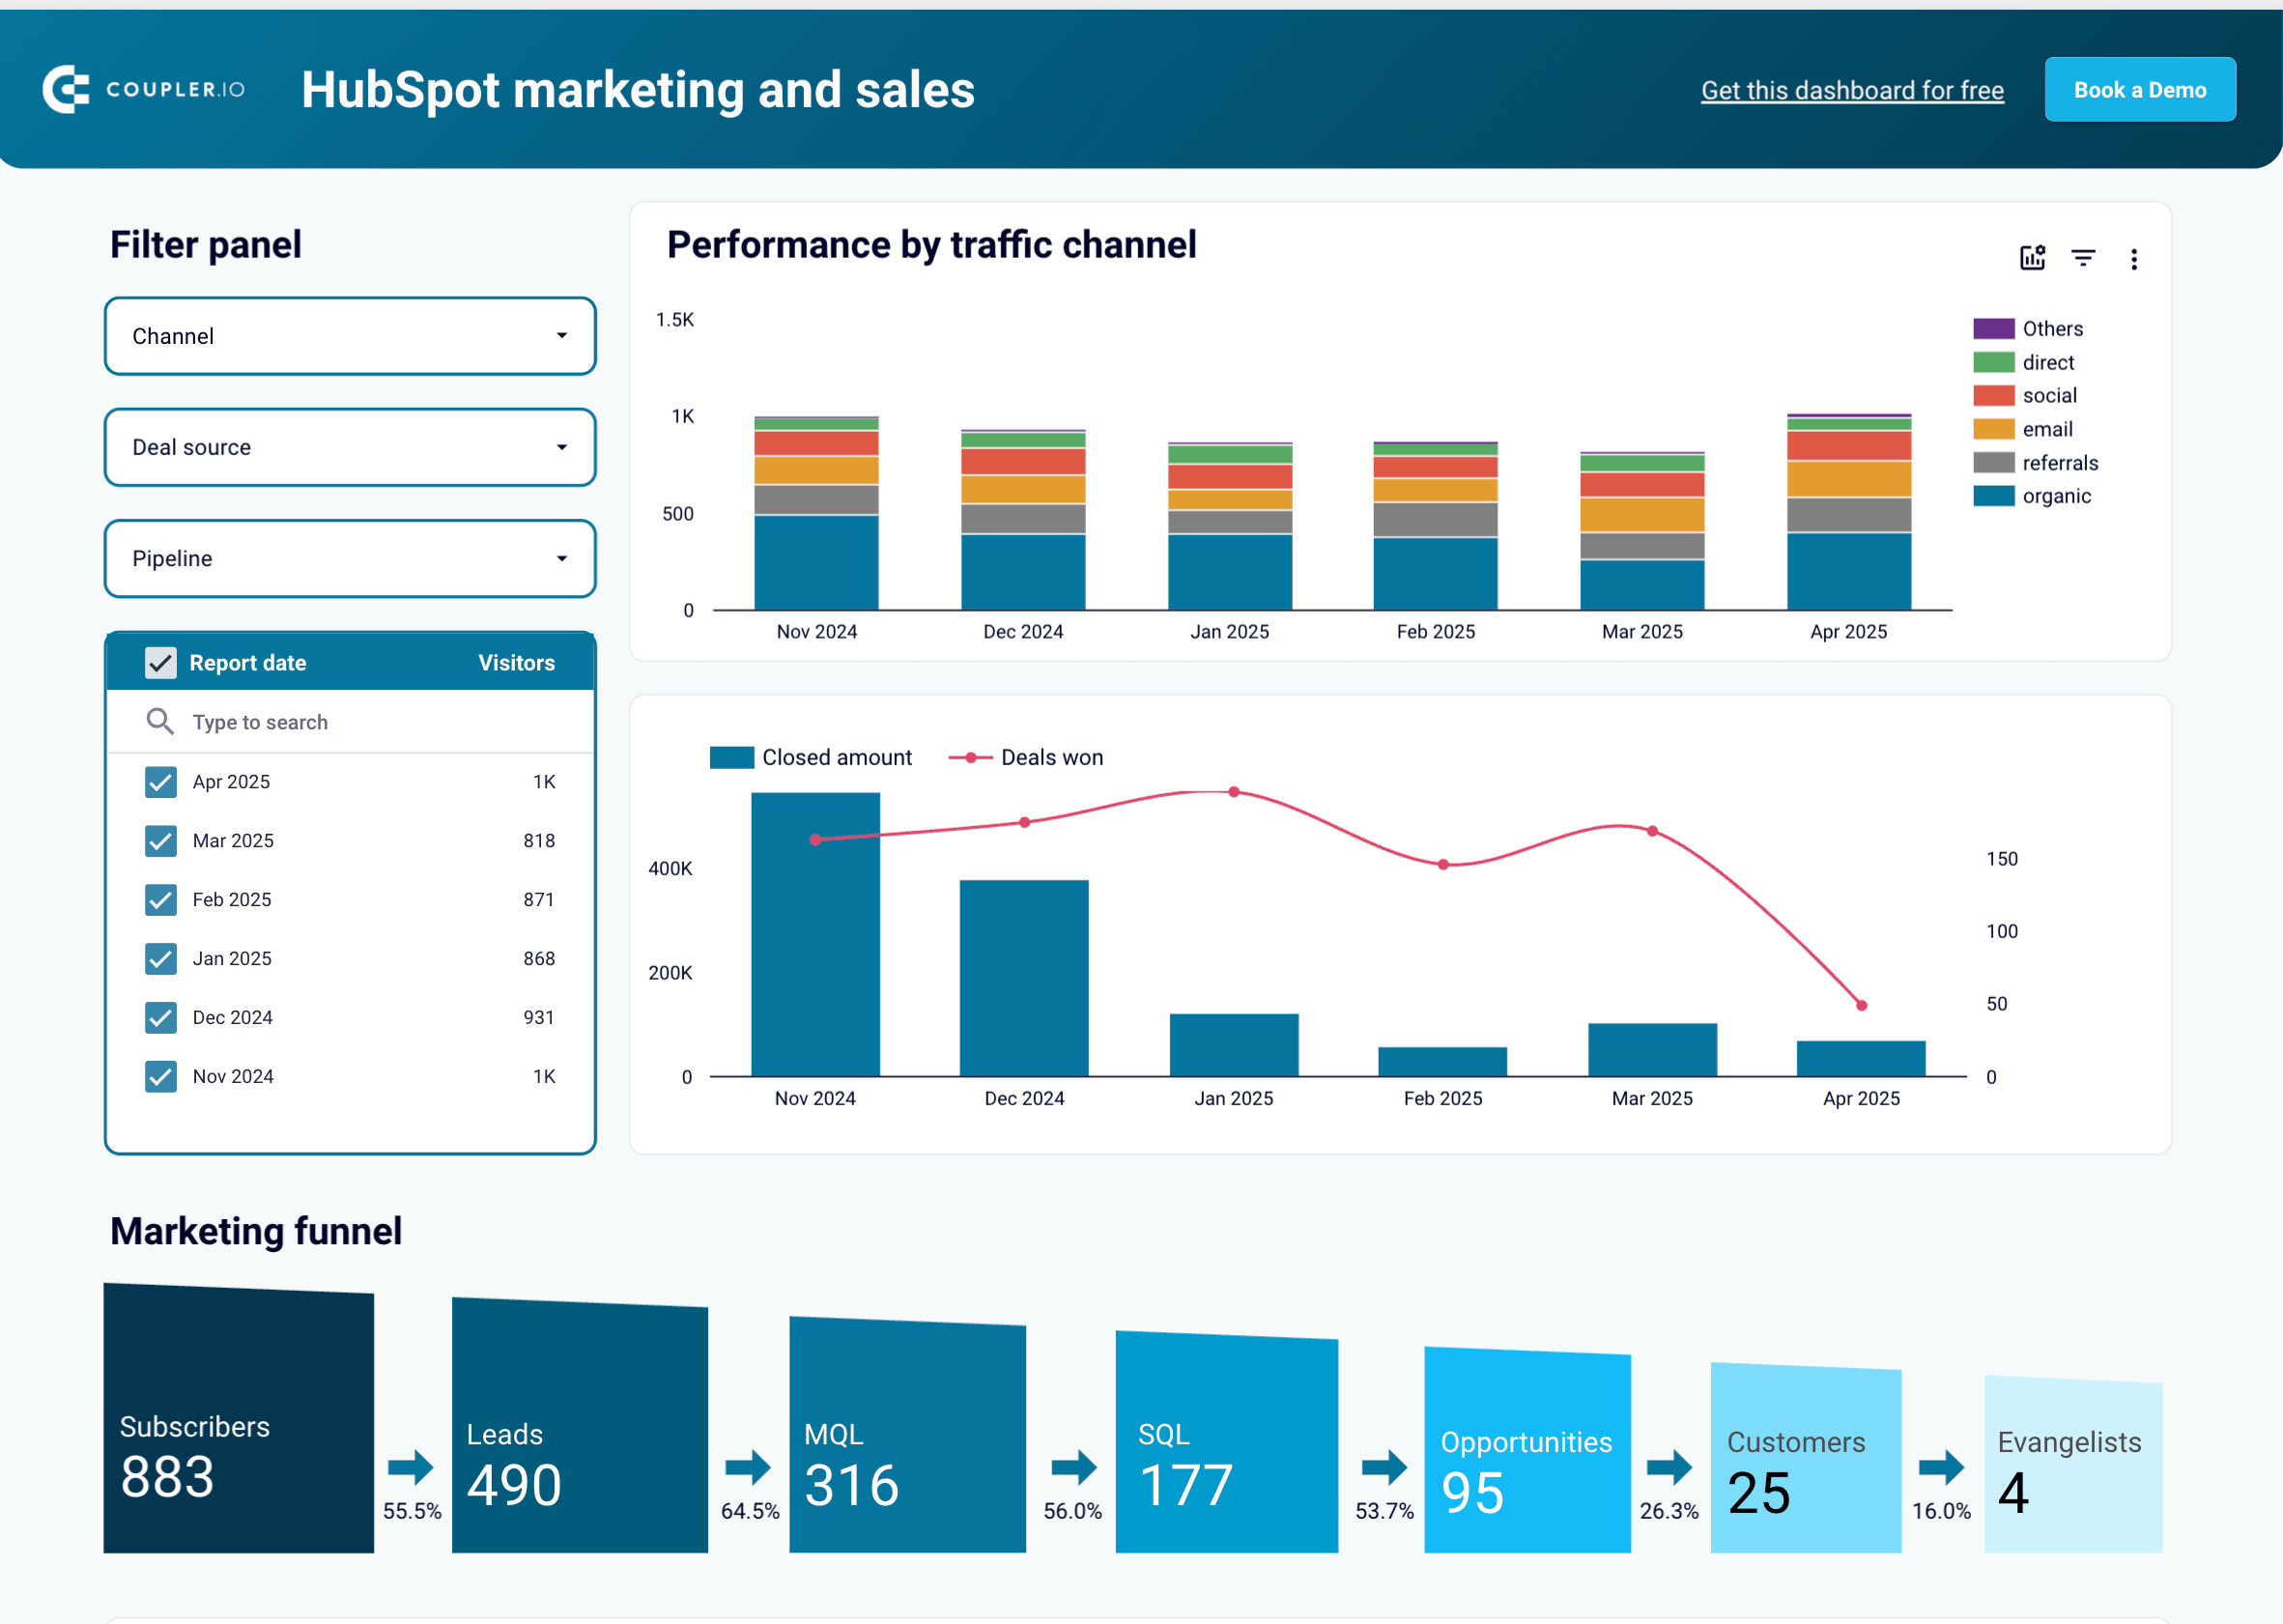
This dashboard provides a combined view of your marketing and sales efforts based on HubSpot data. It lets you see how your marketing channels impact sales outcomes, recognize the top-performing ones, and identify areas for improvement.
Marketing and sales performance dashboard for Hubspot
 Preview dashboard
Marketing and sales performance dashboard for Hubspot
Preview dashboardWith this dashboard, you’ll reveal the following:
- Track sales performance trends per marketing channel over time.
- Explore the sales funnel per channel – including the number of visitors, contacts, subscribers, leads, etc.
- Review detailed, channel-specific sales metrics such as closed amount, won and lost deals, close rate, and win rate.
- Look at deal stages, win reasons, and loss reasons – all by channel.
The dashboard is accessible through Looker Studio. To start using it, click the template’s Readme tab and follow the straightforward setup guide.
What native types of reports can you export from HubSpot?
Let’s move on to the native option for exporting HubSpot reports. As a marketing and sales reporting tool, HubSpot provides you with in-depth knowledge of your pipeline so you can properly estimate performance and mentor your team to success. To reflect your sales & marketing process and provide insight into the performance of your pipeline, HubSpot reporting uses the data in your CRM and generates the following reports:
- Social media reports
- Attribution reports
- Funnel reports
- Sales reports
- Marketing reports
- Email reports
Additionally, HubSpot allows you to create custom reports within the platform.
Guide to exporting native HubSpot reports
Now, learn what the different native HubSpot reports represent and how to export them using built-in methods: downloading spreadsheet files and sharing via email and Slack.
A HubSpot social media report is a detailed data overview used to analyze the efficacy and performance of your social media accounts and evaluate how your total performance stacks up across different platforms.
HubSpot social media reports can’t be exported directly in spreadsheet format. You’re only allowed to share them via email, and only the recipient has access to the reports, or send them to a Slack channel or an individual user.
Here is how you can share your HubSpot social media report using these methods.?
How to share a HubSpot social media report via email
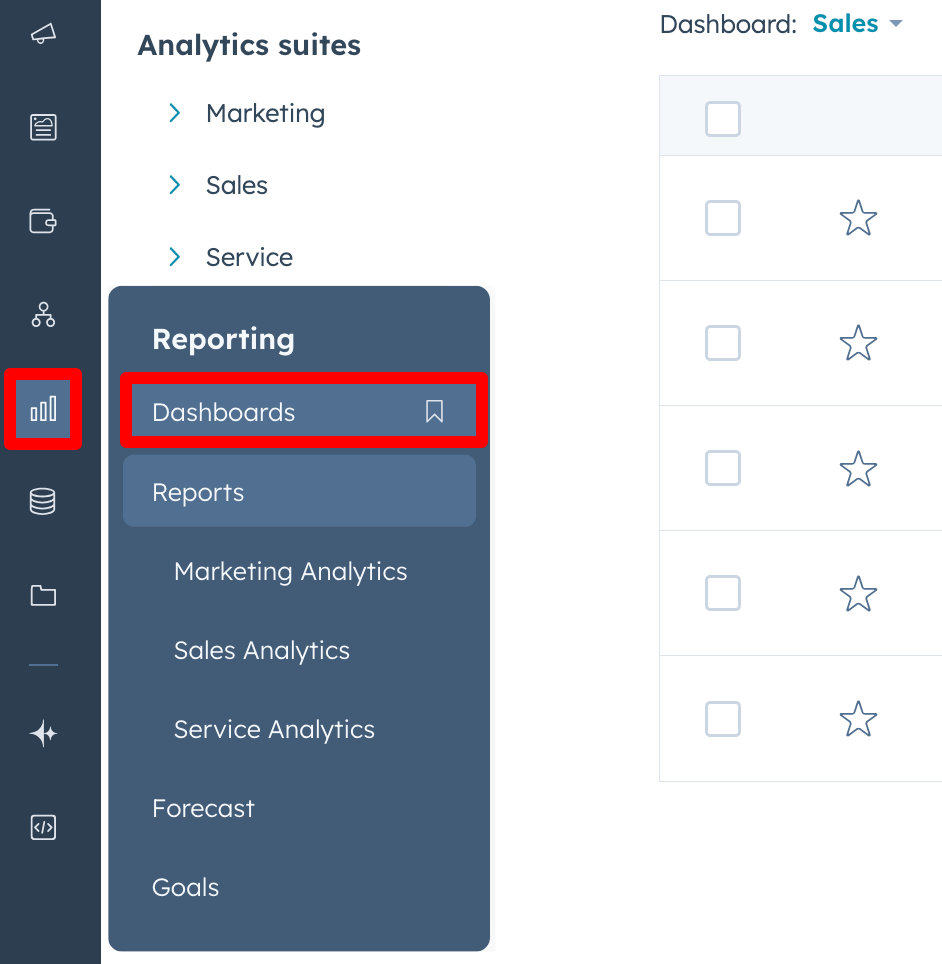
Navigate to Reporting in the taskbar on the left of your HubSpot platform. A dropdown menu will open, and then select Reports. This will take you to the reports section.
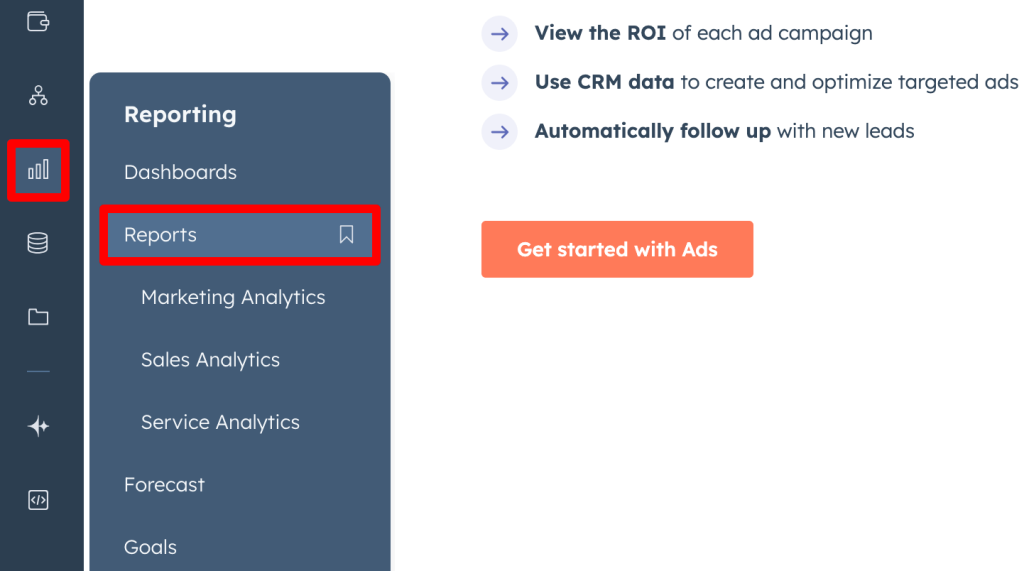
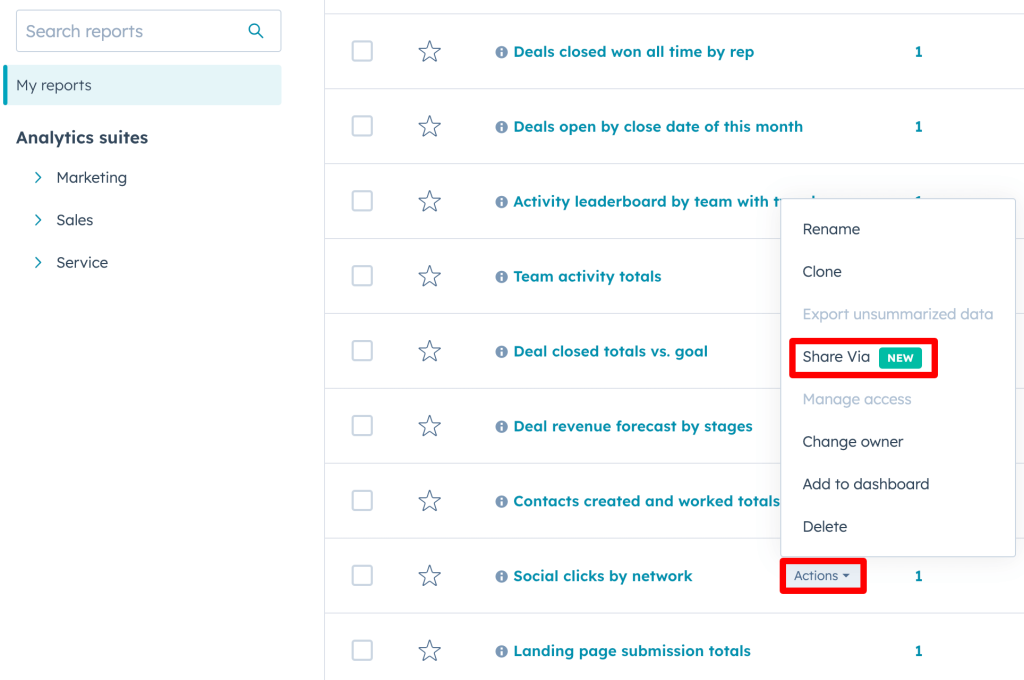
In the reports section, you’ll see all the reports created so far. Hover over the social media report you want to export and click on the Actions button. You’ll see a list of actions you can perform, select Share Via.
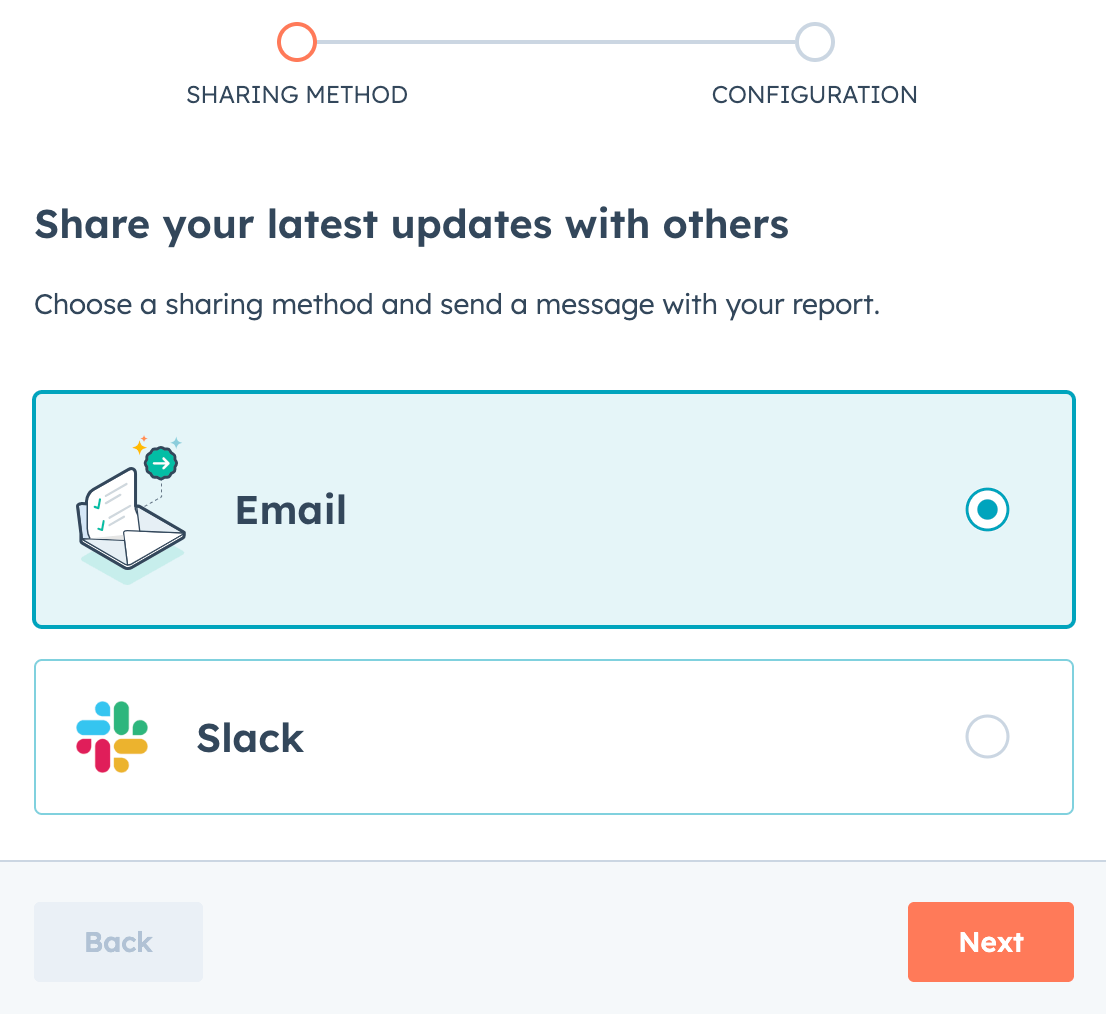
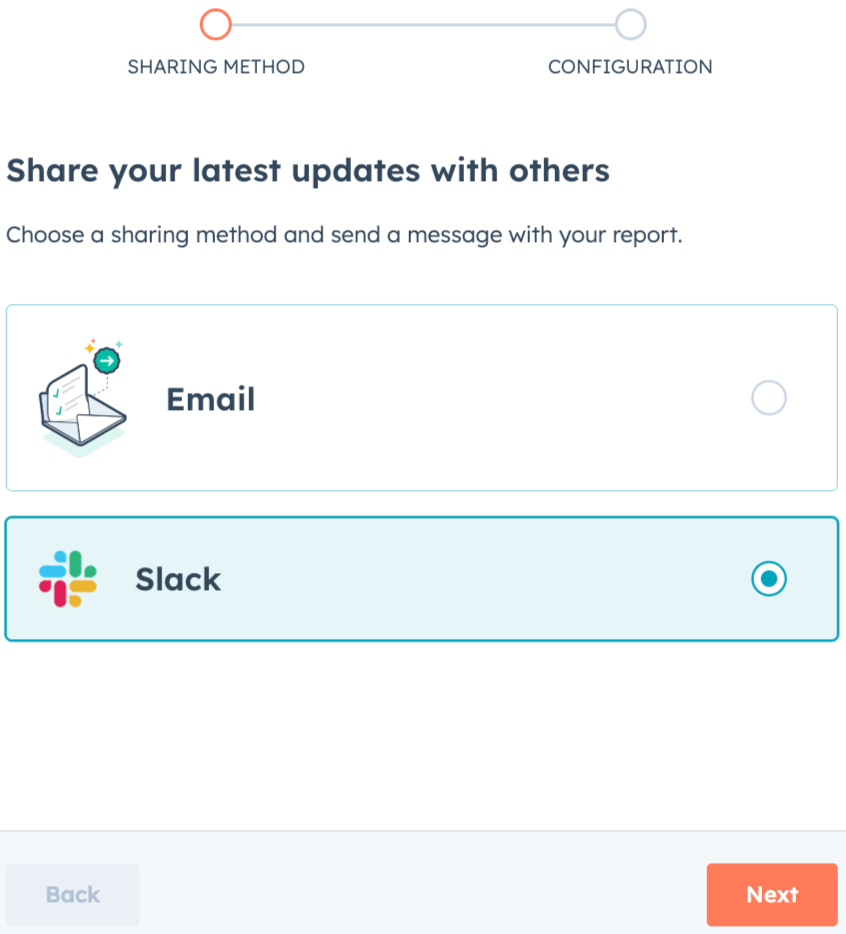
A new window will pop up. In it, you must choose Email as a sharing method and click Next.
Next, you’ll need to specify:
- Whether you need a one-time or recurring email
- Recipients’ email addresses
- Optionally, the email subject and the message to be included
If you’ve chosen a recurring email at the beginning, you’ll also need to provide an email nickname and preferred schedule (daily, weekly, or monthly), along with the time of day.
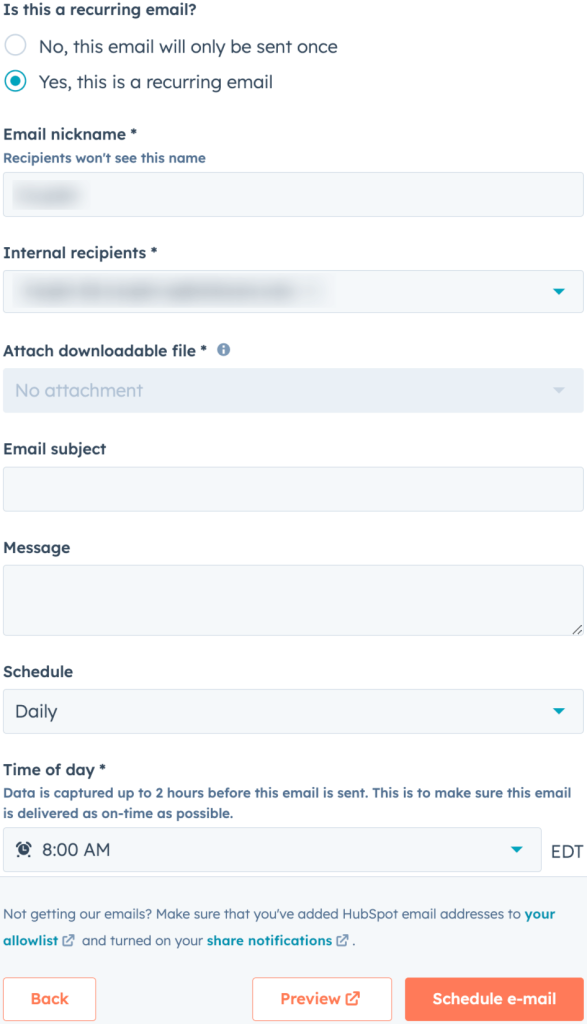
After making your selections, click Send now (for one-time emails) or Schedule e-mail (for recurring shares), and your report will be sent to the addresses provided.
Sending a HubSpot social media report to Slack
To share your report via Slack, follow the same steps outlined in the email method above until the pop-up window appears. In that window, select Slack and click Next.
Specify the following:
- Whether you need a one-time or recurring Slack message
- The destination of your message in Slack: channel or user
- Optionally, the text to be included in the message
If you’ve chosen a recurring message at the beginning, you’ll also need to provide a nickname and preferred schedule (daily, weekly, or monthly), along with the time of day.
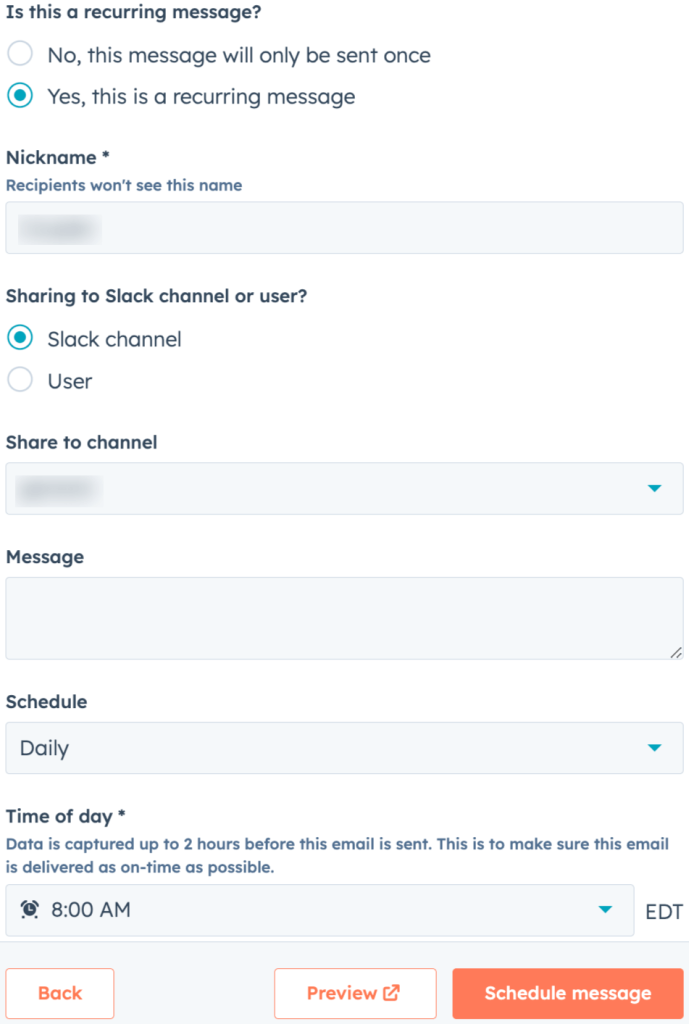
Lastly, click Send now (for one-time messages) or Schedule message (for recurring shares) and have your report sent to Slack.
How to export email reports from Hubspot
HubSpot email reports are a great way to monitor how well your email campaigns are doing. You can also examine the rates of delivery and interaction for each email that was sent by looking at the data in the reports.
Unlike social media reports, you can export an email HubSpot report in a spreadsheet format. However, you’ll have to export each report separately. This can be a time-consuming task. Follow these steps to export the HubSpot email report:
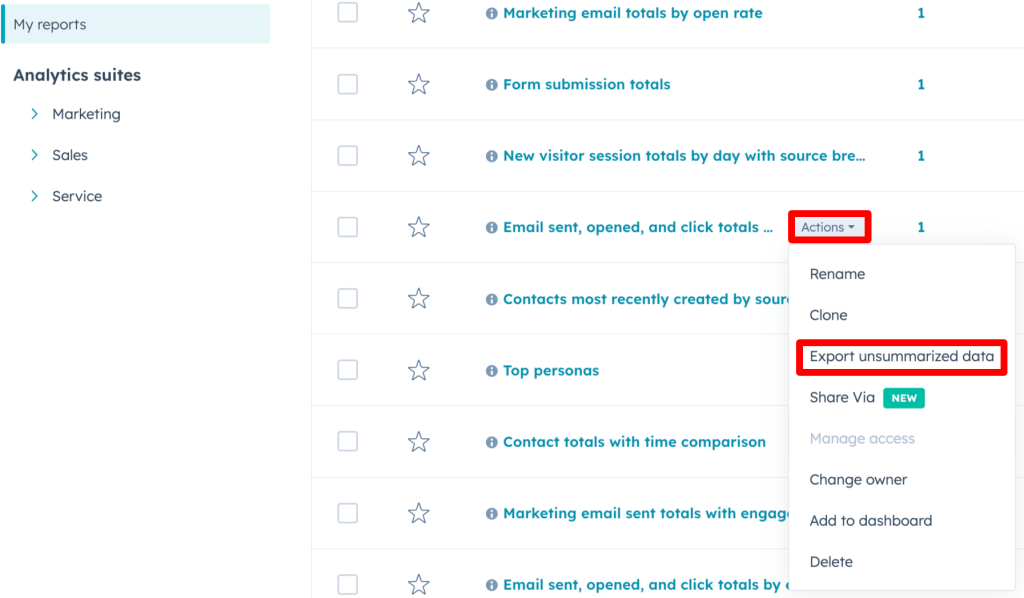
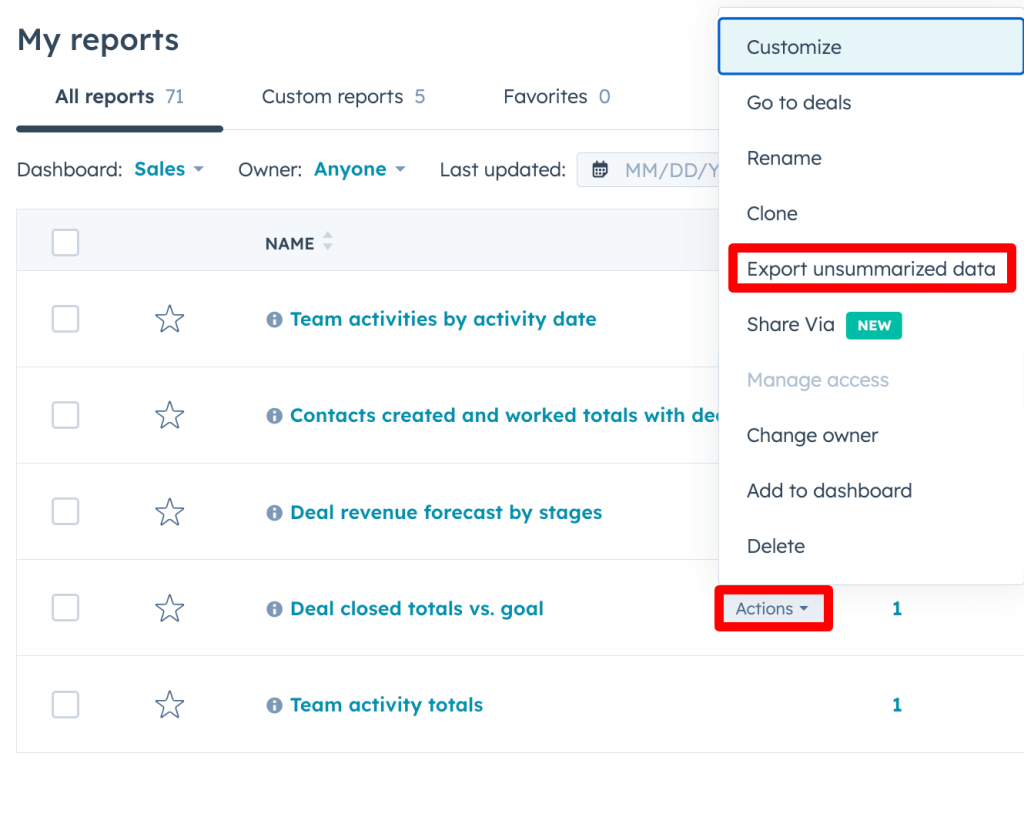
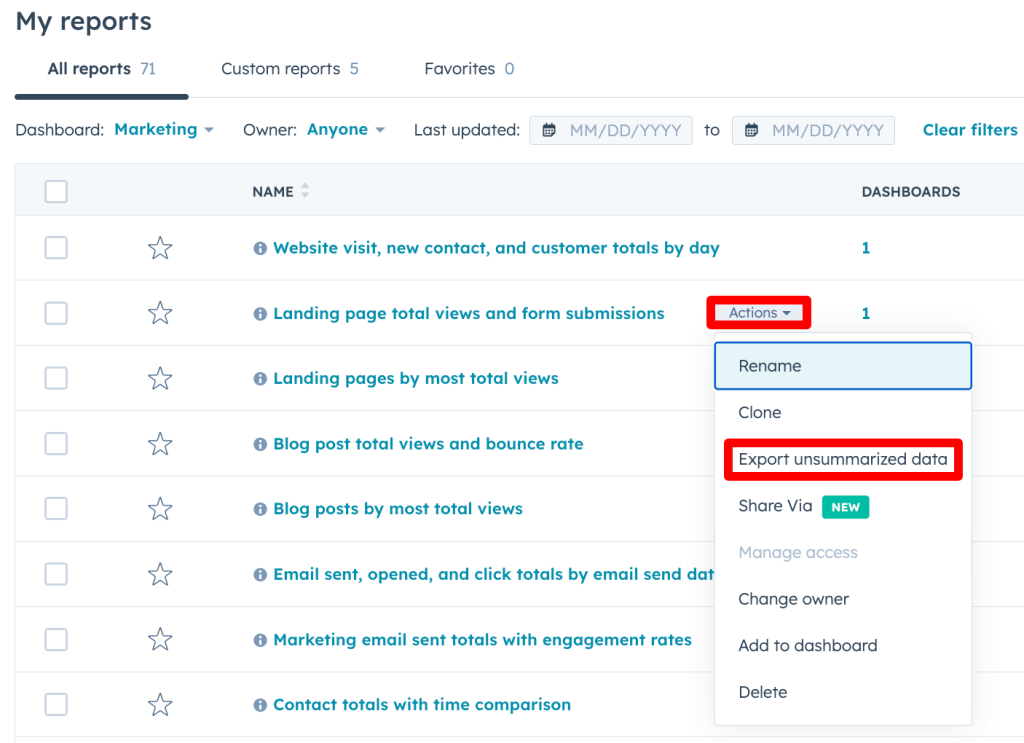
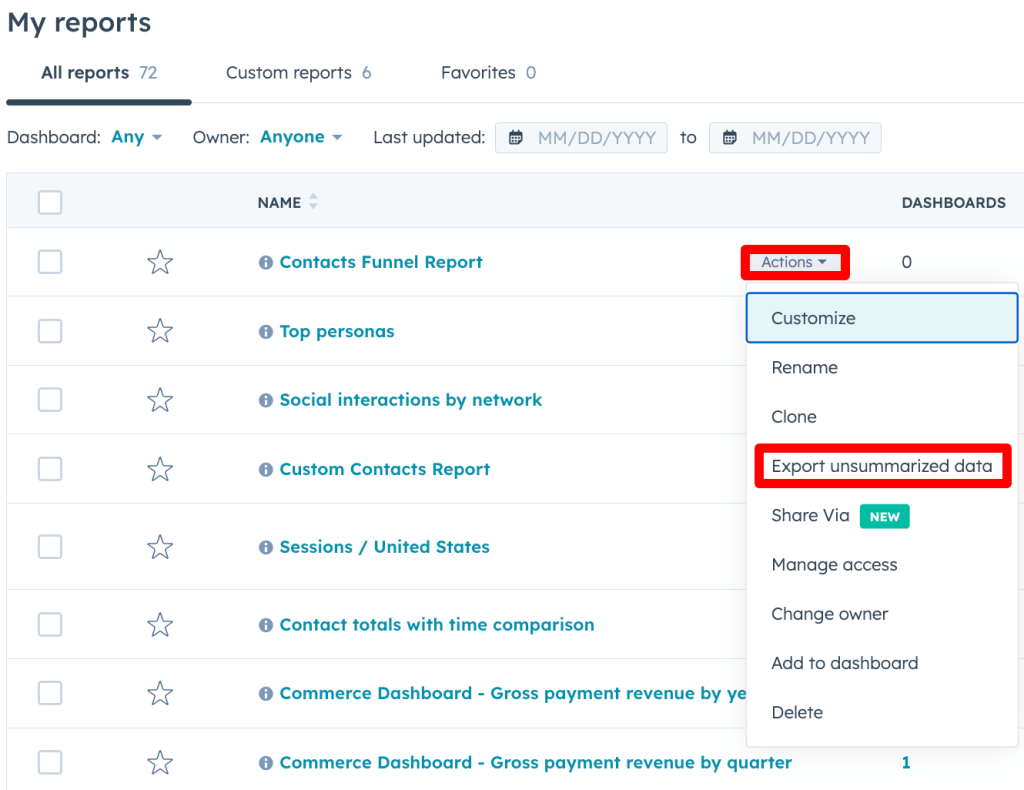
- Go to the reports section, as explained earlier, and click on the Actions button next to the report you want to export. From the drop-down menu, select Export unsummarized data.
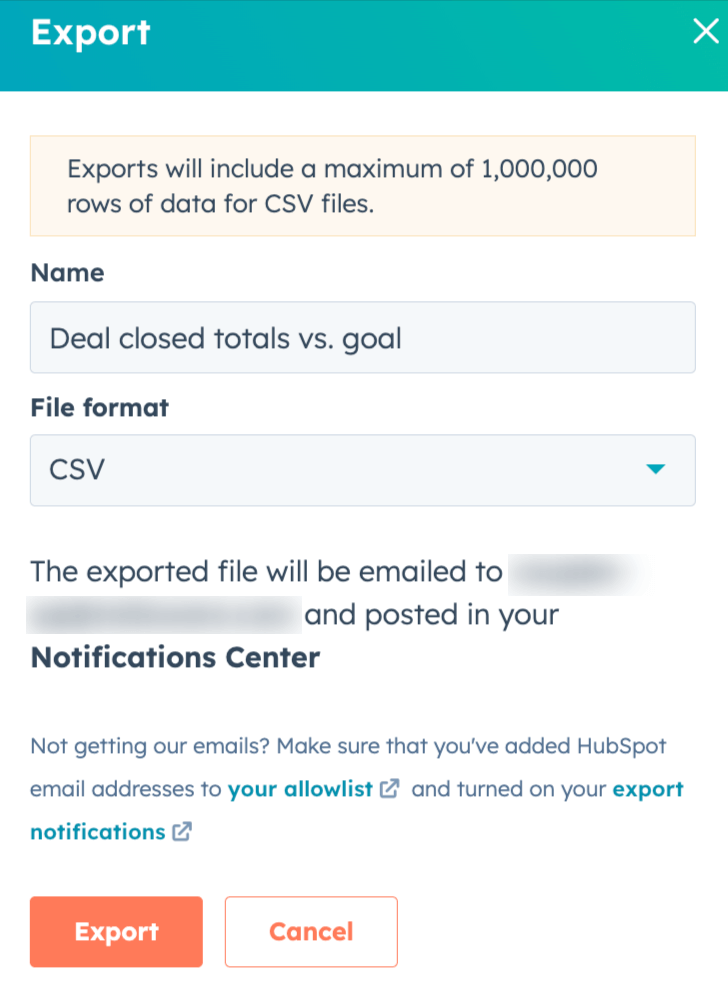
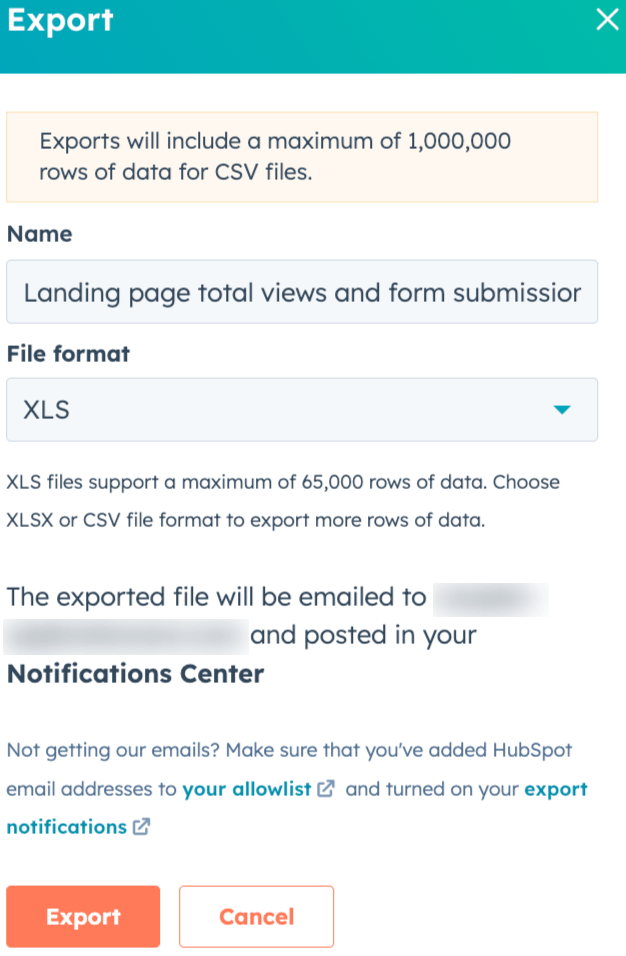
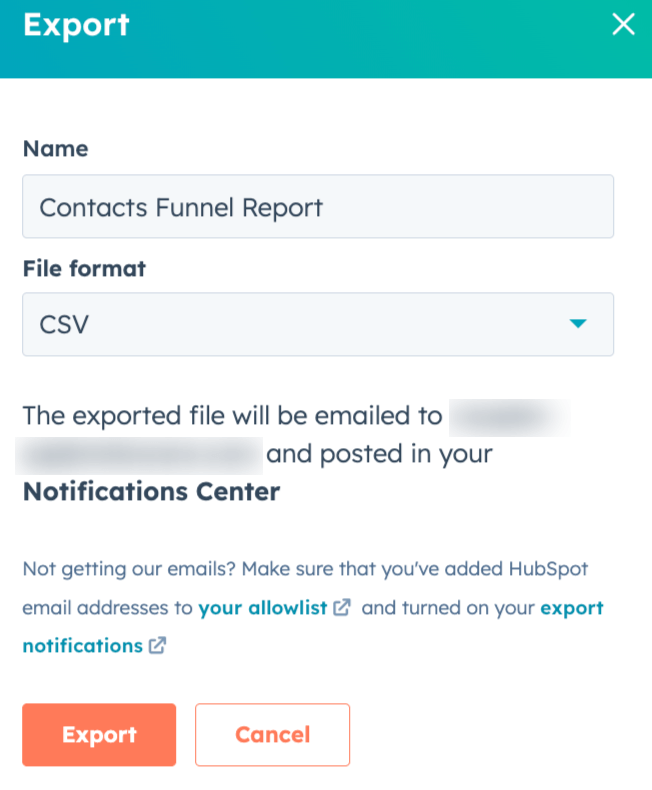
A new export window will open. In it, you can name the report and choose the spreadsheet format for your export file. You can choose between CSV, XLS, and XLSX formats. Next, click Export.
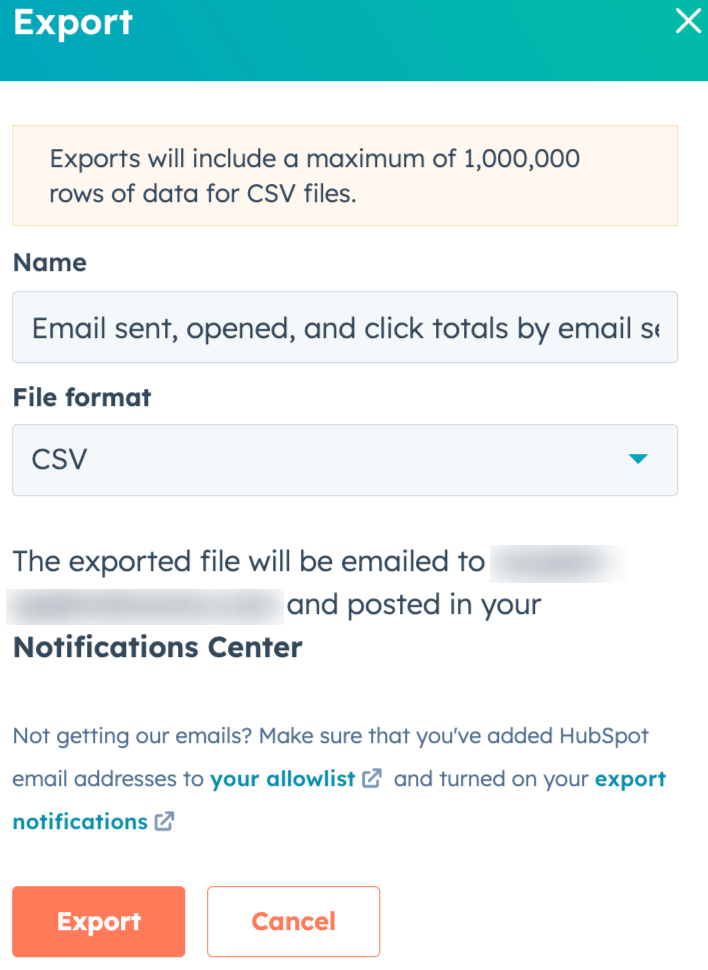
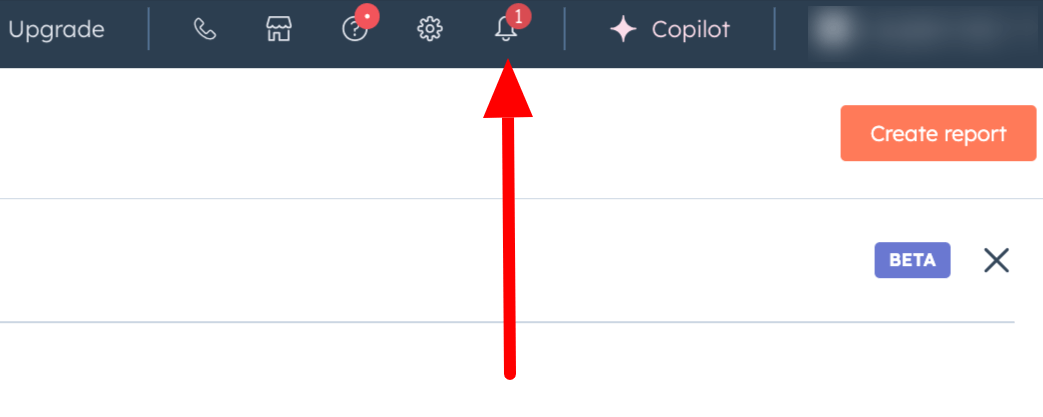
Navigate to the notifications icon in the top bar, click the latest notification, and save the report to your device. A download link will also be sent to your email.
HubSpot sales reports help you monitor your sales team’s performance. It gives you a deep insight into your sales activity, which you can use to guide your team to reach their desired goals.
HubSpot provides two native ways to export sales reports. The first one is to download each HubSpot report individually, which is ideal if you want to export a specific report. The second method is emailing the dashboard, which will include all the sales reports you added when making it, and you also get the option to exclude reports from it if you want to. There is also a non-export option: sharing links to the sales dashboard reports on HubSpot via Slack. Let’s see how to export and share a HubSpot sales report using each method.
Exporting a HubSpot sales report individually
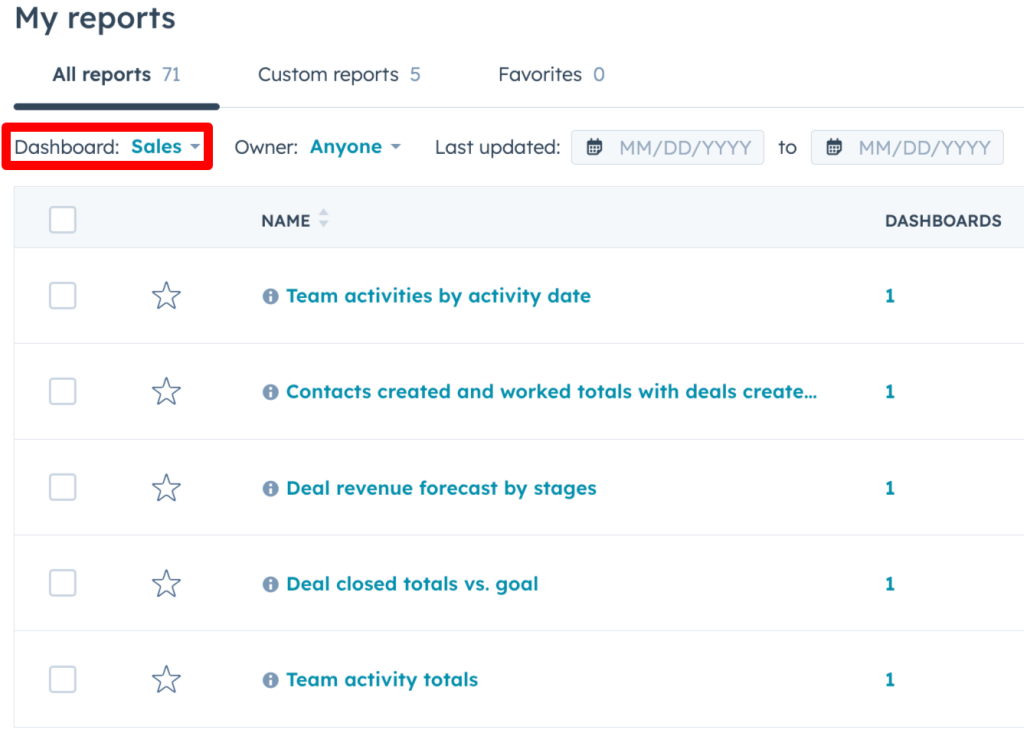
Proceed to the reports section on your HubSpot account. Filter your reports by the sales dashboard. Now, only your sales reports will be shown, which makes it easy to find the one you want to export.
Click on the Actions button next to the report you want to export and select Export unsummarized data. Remember, not all reports will have this option.
In the Export window, select the file format for your export.
Then click Export and download the report from the notifications. You’ll also receive a download link via email.
Since you can only export a single report at any given moment, you’ll have to download each one individually and then combine it in a data visualization tool to get the most out of it. What if you don’t want anything complex and just want to share your sales reports to provide an overall picture? Check out how you can share HubSpot sales reports from the dashboard to achieve that.
Sharing a HubSpot sales dashboard via email
Navigate to the Reporting section in the left menu bar and select Dashboards.
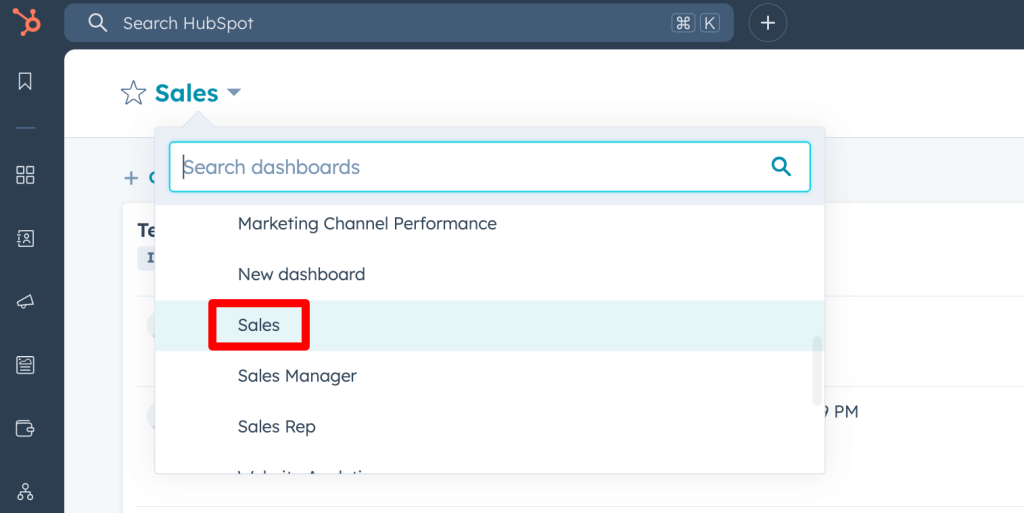
In the dashboard section, select the sales report dashboard from the top left side.
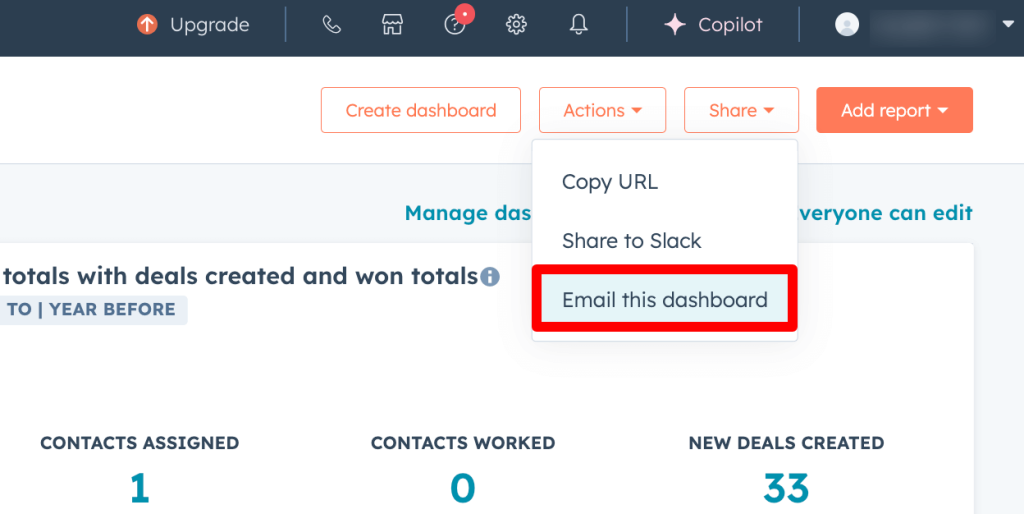
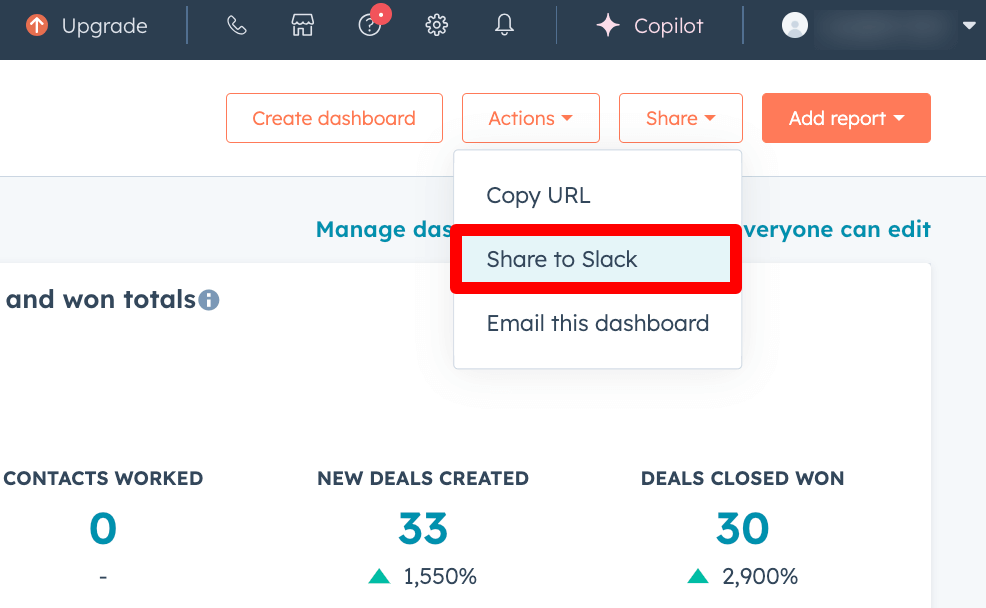
After your sales report dashboard opens up, click on the Share button on the top right side and select Email this dashboard.
A new sidebar window will open up, where you’ll have several things to specify:
- Will the email be a one-time thing or recurring?
- Recipients’ email addresses
- Optionally, the email subject and the message to be included
- Whether to attach a report as a file (CSV, XLS, XLSX, PDF, PPTX, or ZIP of PNGs)
- Do you want to include all the reports in the dashboard or exclude some?
- Would you prefer to apply dashboard filters on the export or not?
If you’ve chosen a recurring email at the beginning, you’ll also need to specify an email nickname and schedule (daily, weekly, or monthly), along with the time of day.
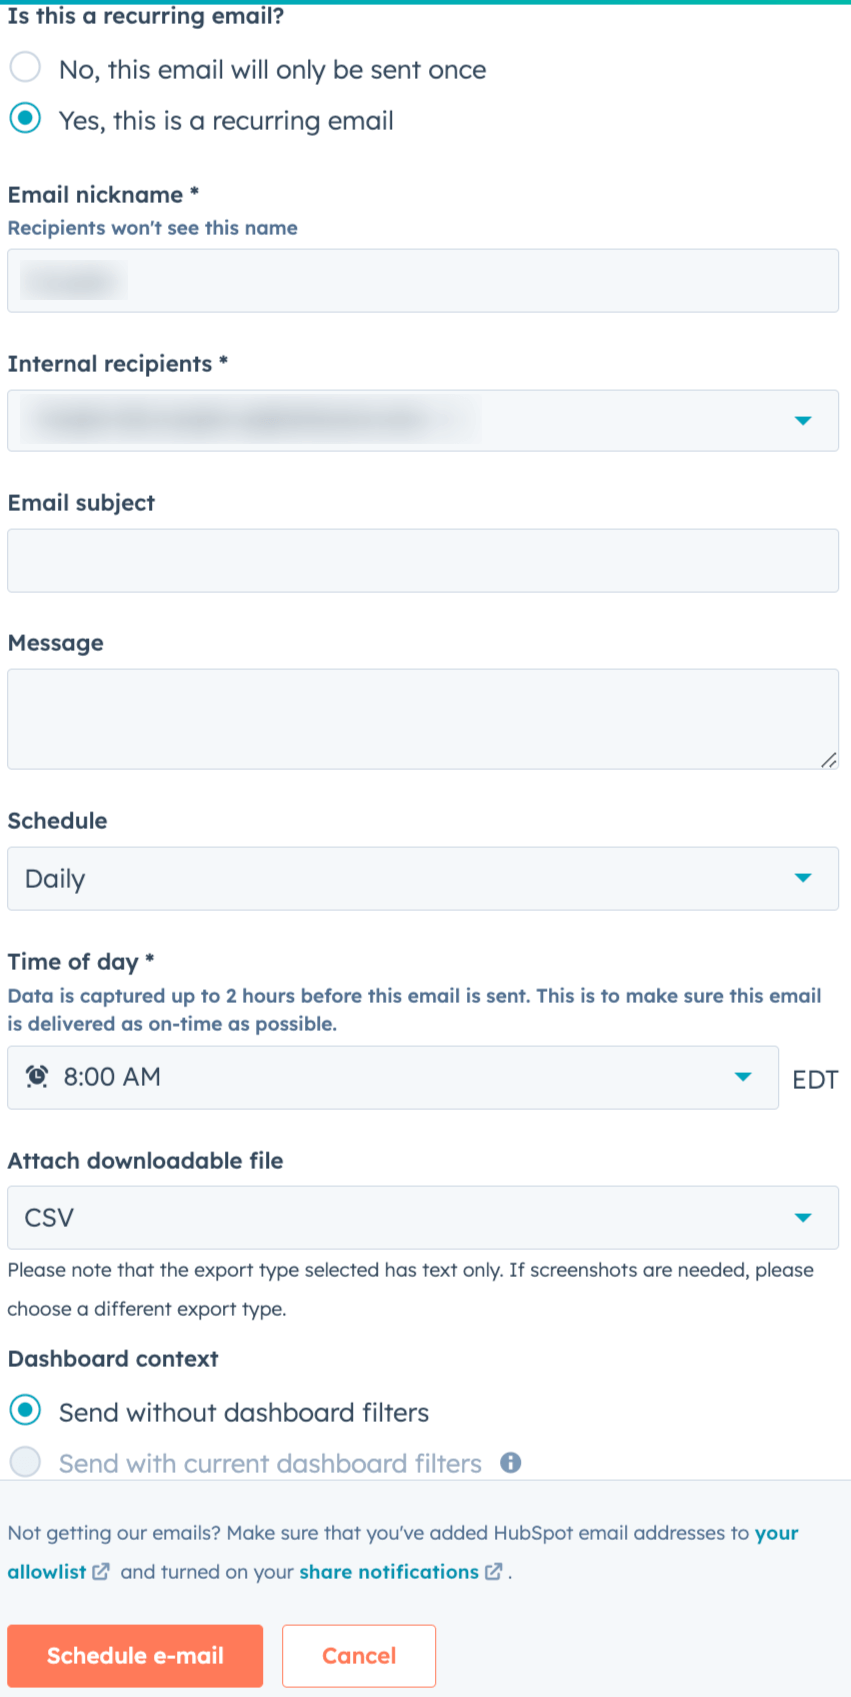
Click Send now (for one-time emails) or Schedule e-mail (for recurring shares), and the dashboard will be sent to the recipient’s address.
How to share a HubSpot sales dashboard to Slack
When your sales dashboard is open and you click the Share button in the top-right corner, select Share to Slack.
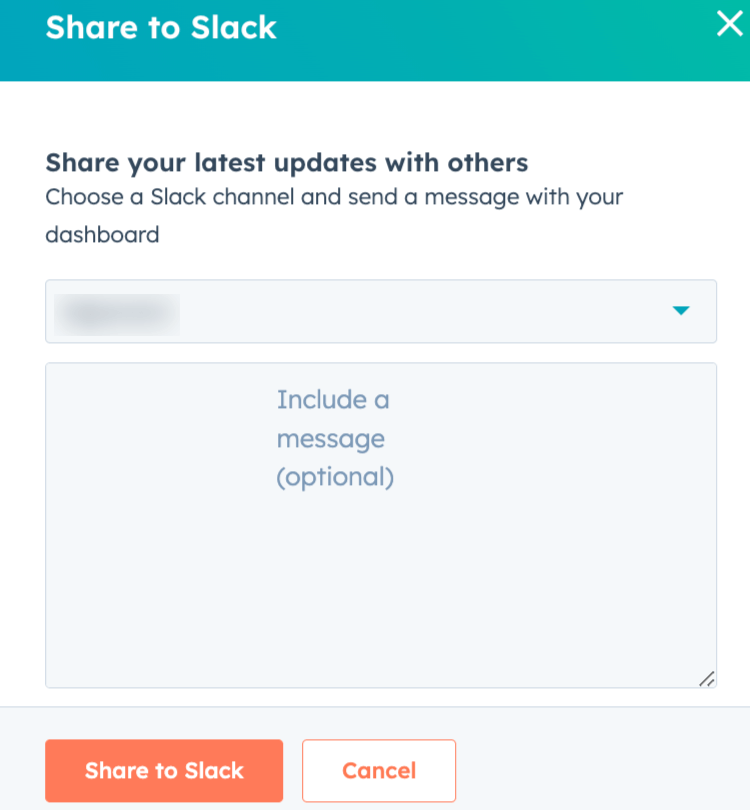
Next, select the Slack channel where you want to share links to all reports from your dashboard and optionally type a message to include. Lastly, click Share to Slack, and the links will be sent to the specified channel.
Solution to export HubSpot marketing reports
HubSpot marketing reports provide you with the knowledge of the sources of your traffic and leads, the types of content they engaged with before, during, and after conversion, as well as the total time it took for them to become paying customers.
The report summarizes the success of your advertising campaign using data from all the sources. You can use the marketing report to determine if your present marketing efforts are productive and find new ways to enhance them.
Let’s see how you can export your marketing reports from HubSpot.
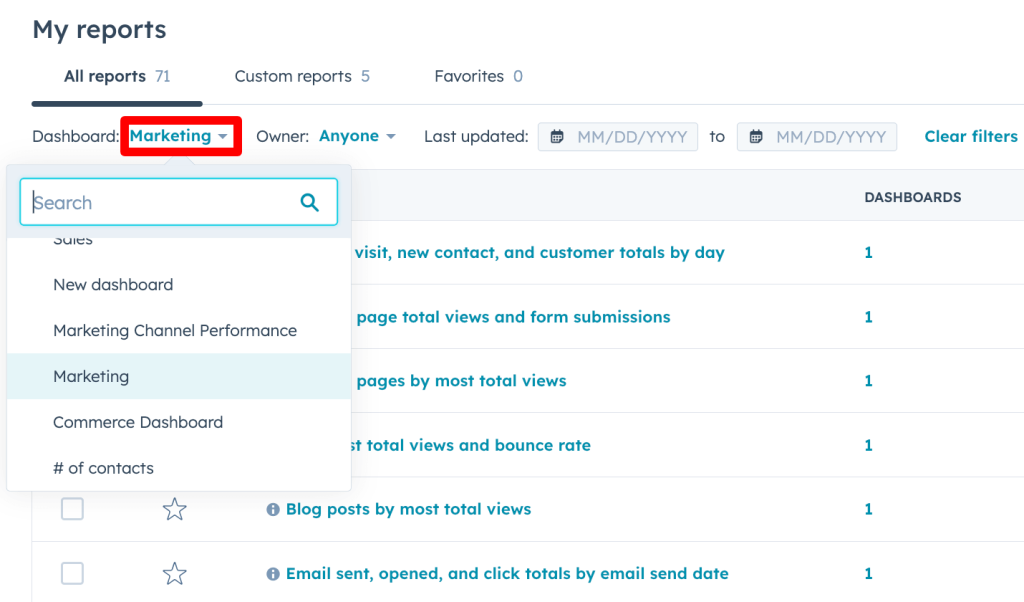
Go to the reports section, and filter your reports by marketing dashboard. Now, you’ll see a list of your HubSpot marketing reports.
You can only export one report at a time, so pick one and click the Actions button. Next, select Export unsummarized data from the drop-down menu.
A new Export window will pop up, select the file format for your export. And then click Export.
You’ll receive the download link for the spreadsheet file in your notifications and via email.
Since you can only export one file at a time, continue the same process for the other HubSpot marketing reports you want to export.
Export funnel reports from HubSpot
HubSpot funnel reports help you monitor the progress of your contacts or deals moving through different pipeline stages. By generating multiple types of funnel reports and comparing them, you can better understand your sales team’s progress.
You can export the funnel report at the time of creation or after.
To export it upon creation, go to the reports section and click on the Actions button next to your funnel report. From the drop-down menu, select Export unsummarized data.
A new export window will open where you’ll select the file format.
Click Export and download the report from your notifications. Additionally, the download link will be emailed to you.
Can you export attribution reports from HubSpot?
Giving recognition to each of your numerous marketing initiatives is the goal of attribution reporting.
You may determine which particular actions, channels, and/or campaigns are producing the best outcomes with the help of attribution reporting. Additionally, you gain knowledge about what is currently generating revenue and the pipeline.
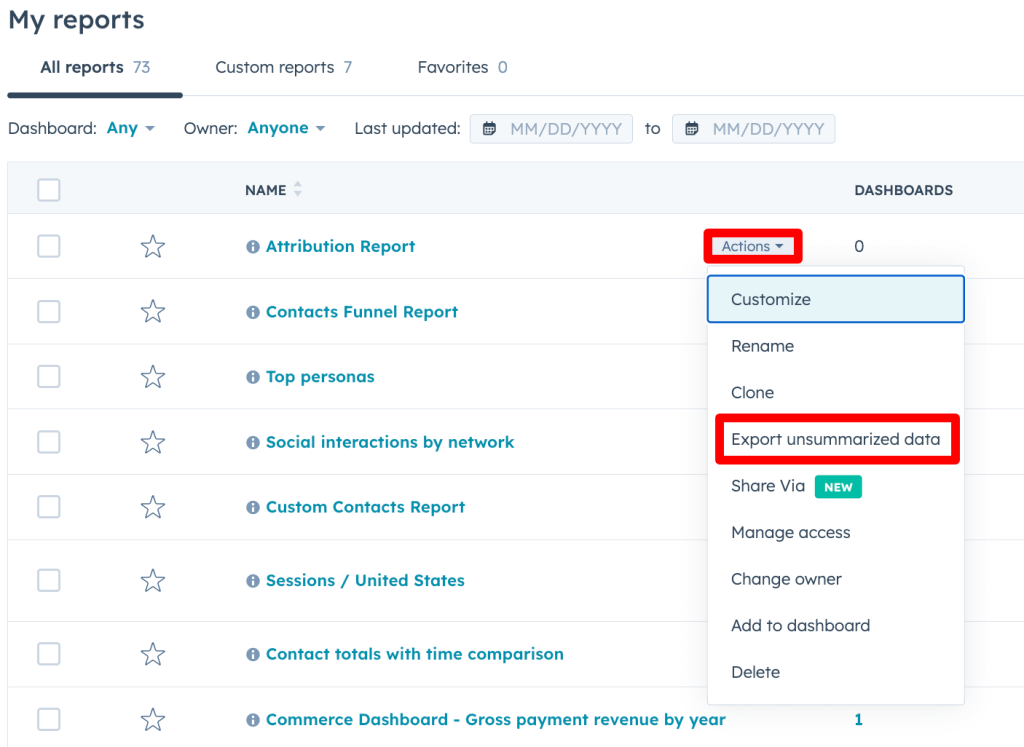
Like the previous type of report, this one is also exportable both at the time of creation and after saving. To download it after saving, head over to the reports section, find the attribution report you want to export, and click on the Actions button right next to it. From the drop-down menu, select Export unsummarized data.
A new export window will open where you’ll select the file format.
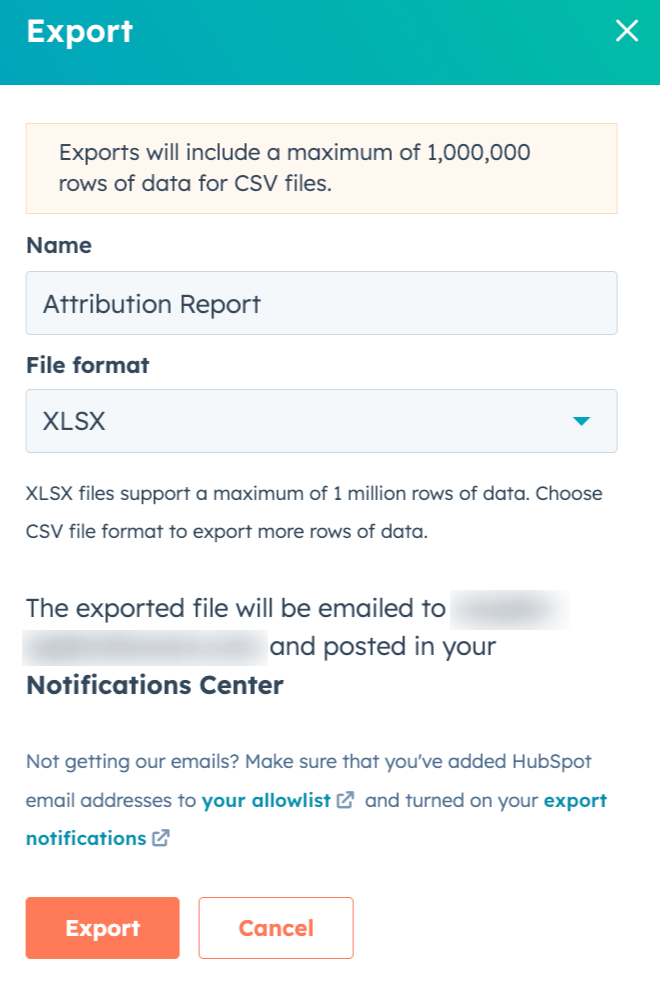
Click the Export button, and download the report by following the link from your notifications. The link will also be shared via email.
Options for how to export data from a custom HubSpot report
HubSpot offers you the option to create custom reports from the data available on the platform. They follow the same export procedure as the previous reports.
You can export a custom report both when creating it and after. To do this afterward, head over to the Reports section, find the desired custom report, select the export properties, and fetch it on your device (or set it to be automatically sent via email or Slack at a chosen frequency).
Why should you export HubSpot reports with Coupler.io?
Reporting plays an important role in decision-making, highlighting problems, performance analysis, activities planning, and more. Reports should contain all of the information you need and be tailored to your specific business requirements. HubSpot reports will provide you with all the information about your operations. However, you can only combine a limited number of reports on the HubSpot dashboard, which might be enough if you want to analyze the performance of a specific department. Still, the better option is to export HubSpot reports with Coupler.io and create a custom one on the go if you want to run advanced analytics by combining data from different sources.
Here are some more reasons why it’s beneficial:
- It’s challenging to develop comprehensive reports that cover every HubSpot site using built-in reporting because you can’t mix data from different sites. Instead, use Coupler.io to extract records from multiple HubSpot sites and merge them into a unified report.
- Since you can only have a limited number of reports on the HubSpot dashboard, it can be difficult to analyze all the information in these reports thoroughly. To make it easier, extract and blend the data into a single view with Coupler.io and load it into a spreadsheet or BI tool for dashboard creation.
- The user interface within HubSpot is somewhat limited and only supports a few different report visualization options. Luckily, Coupler.io lets you pull your HubSpot data into BI tools – Looker Studio, Tableau, Power BI, and Qlik – where you can build detailed, dynamic, and interactive dashboards.
Blending data from different sources has become increasingly important for businesses to make informed decisions. For example, when analyzing marketing data, you need to bring together data from multiple sources such as social media platforms, HubSpot, customer surveys, etc. Since HubSpot does not allow for the direct export of data from other sources, the only way to combine such data is outside of HubSpot using Coupler.io.
Automate HubSpot data export with Coupler.io
Get started for free