How to Measure Business Performance: KPIs, Tools & Strategies
Business performance measurement involves tracking the metrics that accurately reflect your company’s performance—financially, operationally, and strategically.
And it matters. According to the U.S. Bureau of Labor Statistics (BLS), nearly 50% of small businesses don’t survive beyond five years. One major reason? They fail to monitor and act on the right performance signals.
Revenue and sales numbers only scratch the surface. To truly understand whether your company’s performance is on track, you need to look beyond revenue and into the metrics that drive business success. When you measure with purpose, you gain the clarity needed to make informed decisions that support both short-term wins and long-term success.
In this article, we’ll walk you through how to measure performance across all areas of your business, from finance to customer success, and turn data into decisions that drive sustainable business growth.
Business performance measurement: the foundation of strategic growth
At its core, business performance measurement is the practice of tracking key indicators that reflect how well your company is achieving its goals. These indicators can encompass financial metrics, such as revenue and profit margins, as well as operational KPIs, including efficiency and turnaround times. Additionally, they may include customer-focused signals, such as satisfaction scores and churn rates. Performance measurement isn’t just about collecting data; it’s about turning that data into actionable insights.
You can’t improve what you don’t measure. Without a clear view of how each part of your business is performing, you’re essentially steering without a compass. Performance metrics provide the clarity leaders need to make strategic decisions, allocate resources wisely, and stay aligned with long-term objectives. They highlight what’s working, flag potential issues early, and empower teams to optimize their efforts.
Common challenges when performance isn’t tracked
When businesses skip or poorly implement performance tracking, several things can go wrong:
- A lack of direction: Teams work hard, but may not be working toward the right goals.
- Inefficiency: Resources get wasted on strategies that don’t move the needle.
- Slow response time: Without early indicators, problems are often spotted too late.
- Disengagement: Employees struggle to connect their work with company success when outcomes aren’t visible.
The cost of flying blind
Failing to measure performance comes at a price, often a steep one. Here’s how it plays out in real businesses:
- ? Missed opportunities: Without data, you’re likely to overlook shifts in customer behavior or emerging growth trends.
- ? Delayed reactions: Problems are spotted too late, increasing the cost of recovery.
- ? Reactive culture: Decisions are made by gut feel, not evidence, leading to repeated trial-and-error.
- ? Financial losses: U.S. companies lose around $75 billion each year due to poor customer service, often stemming from untracked performance gaps.
On the flip side, data-driven companies outperform their competitors by 6% in profitability and 5% in productivity.
Building a metrics-driven culture
Creating a culture where metrics matter isn’t just about dashboards and reports; it’s about mindset. A metrics-driven organization:
- Aligns teams around shared goals and measurable outcomes.
- Encourages accountability and ownership.
- Celebrates data-informed wins and learns from measurable failures.
- Invests in tools and training to make performance data accessible and actionable.
When performance measurement becomes part of your company’s DNA, it drives smarter decisions, sharper execution, and sustainable growth.
Ways to measure business performance
There’s no one-size-fits-all approach to measuring performance. What matters most depends on your business model, industry, and strategic goals. However, the most effective performance measurement systems strike a balance between quantitative and qualitative methods, combining hard data with human insights to create a complete picture of business health.
Quantitative methods: The numbers that tell the story
Quantitative performance metrics are objective, data-driven, and often financial in nature. These are the KPIs most commonly used by leadership teams, investors, and boards to gauge success.
Some key quantitative methods include:
- Financial analysis encompasses revenue growth, profit margins, operating costs, return on investment (ROI), cash flow, and balance sheet health. These numbers show whether your business is financially viable and scaling in the right direction.
- Productivity metrics: Measure how efficiently resources, particularly time and labor, are used. Examples include output per employee, cycle time, and inventory turnover.
- Sales and marketing performance: Track metrics like customer acquisition cost (CAC), conversion rates, lifetime value (LTV), and lead-to-close ratios.
- Operational efficiency: Use indicators such as downtime, error rates, and average resolution times to assess how well processes are running.
Take, for example, United Way Northwest Indiana (NWI). As a nonprofit, their performance measurement priorities centered around donor engagement and campaign effectiveness. By automating marketing performance tracking with Coupler.io, they eliminated roughly 80 hours of manual data collection and reporting each month. This shift not only improved accuracy and efficiency but also freed up the team to focus on strategic initiatives. As a result, they saved approximately $20,000 per year in manual labor costs, which boosted both the donation impact and team productivity.
Quantitative data is essential for tracking trends over time, comparing performance against goals or benchmarks, and making informed financial decisions.
Qualitative methods: The insights behind the numbers
While numbers tell you what’s happening, qualitative methods help you understand why.
These approaches tap into human perspectives, both from customers and employees, to provide context that data alone can’t capture:
- Customer feedback: Gathered through surveys (NPS, CSAT), interviews, or reviews, this reveals how customers perceive your brand, product, or service. Trends in satisfaction or dissatisfaction can be leading indicators of future growth or churn.
- Employee engagement: Metrics such as eNPS, pulse surveys, and 1:1 feedback sessions give insight into morale, motivation, and organizational culture.
- Stakeholder input: Feedback from partners, vendors, or board members can uncover strategic blind spots or emerging opportunities.
Project Alfred, a client service agency, needed better insight into client satisfaction and operational clarity. With Coupler.io, they consolidated data from HubSpot and other tools into a centralized dashboard. This allowed them to track client engagement, team activity, and campaign progress—all in one place. The result? Faster communication, improved service quality, and more proactive client support, all driven by qualitative cues they previously missed. Not to mention 40 hours saved monthly on reporting!
Qualitative data adds nuance and meaning to quantitative trends, and often sparks deeper innovation and improvement.
Tailored approaches: Matching metrics to business types
Different types of businesses require different approaches to performance measurement. Here are a few examples:
SaaS companies focus heavily on recurring revenue (MRR/ARR), churn rate, customer lifetime value, and product engagement metrics. Customer success metrics and in-app behavior also play a significant role.
Tradezella, a platform that helps traders build better habits through data, needed more visibility into user behavior. Initially relying on Stripe, they couldn’t differentiate between active and churned users until it was too late. With Coupler.io, they automated data flows into BigQuery and Google Sheets, defined funnel stages, and monitored user activity daily..
The results were immediate: in just one month, Tradezella reactivated 2.5x more users than in any previous month that year. Activation rates after signup jumped from 28% to 65%, and the team now uses a live dashboard to track conversions, identify bottlenecks, and optimize campaigns with confidence.
Retail businesses prioritize inventory turnover, sales per square foot, average transaction value, and customer retention. Foot traffic data and in-store customer experience feedback are also key.
Service-based firms may track billable hours, client satisfaction scores, and project delivery timelines. Employee utilization rates and repeat business are critical indicators.
Manufacturing companies often emphasize production output, quality control (defect rates), equipment efficiency (OEE), and supply chain performance.
Nonprofits and mission-driven organizations track impact metrics rather than profit. These can include growth in donations, program reach, volunteer hours, and engagement rates across campaigns.
The right mix of metrics depends on your strategic priorities and the stage of maturity your business has reached. A startup might prioritize growth and activation, while a mature company might focus on optimization and cost efficiency.
Business performance metrics to track
Tracking the right business metrics provides a clear, data-driven picture of how well your organization is performing across key areas. Below is a breakdown of essential metrics, grouped by category, to help you build a comprehensive performance measurement framework.
Financial metrics
Metrics such as operating cash flow, gross profit margin, and liquidity are essential for understanding financial health. They directly impact your ability to invest, scale, and sustain your bottom line.
| Metric | How to Measure | Typical Benchmark |
| Gross Profit Margin | (Revenue – COGS) / Revenue | 20–60% (varies by industry) |
| Net Profit Margin | Net Profit / Revenue | 5–20% (higher in services, lower in retail) |
| Operating Cash Flow | Cash from core operations | Positive and growing over time |
| Return on Investment | (Net Return – Investment Cost) / Investment Cost | 10–30% for successful initiatives |
| Revenue per Employee | Total Revenue / Number of Employees | $100k–$300k (SMBs), $400k+ (tech firms) |
Gross Profit Margin: Indicates the percentage of revenue that exceeds the cost of goods sold. A healthy margin shows efficient production and pricing strategies.
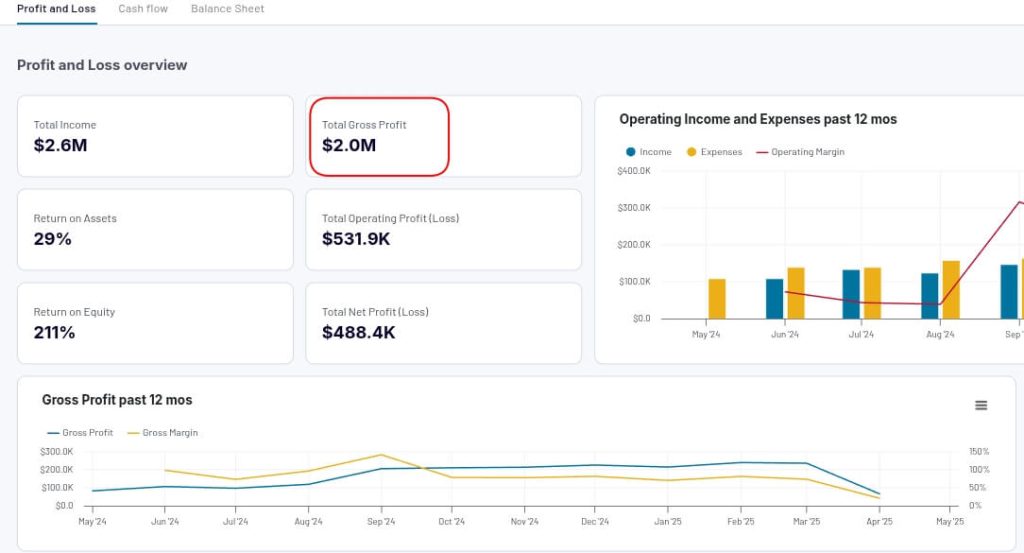
Net Profit Margin: Measures how much of your revenue becomes actual profit after all expenses. It’s a key indicator of overall profitability.
Operating Cash Flow: Tracks the amount of cash generated by regular business operations, revealing how well your company can sustain itself without external funding.
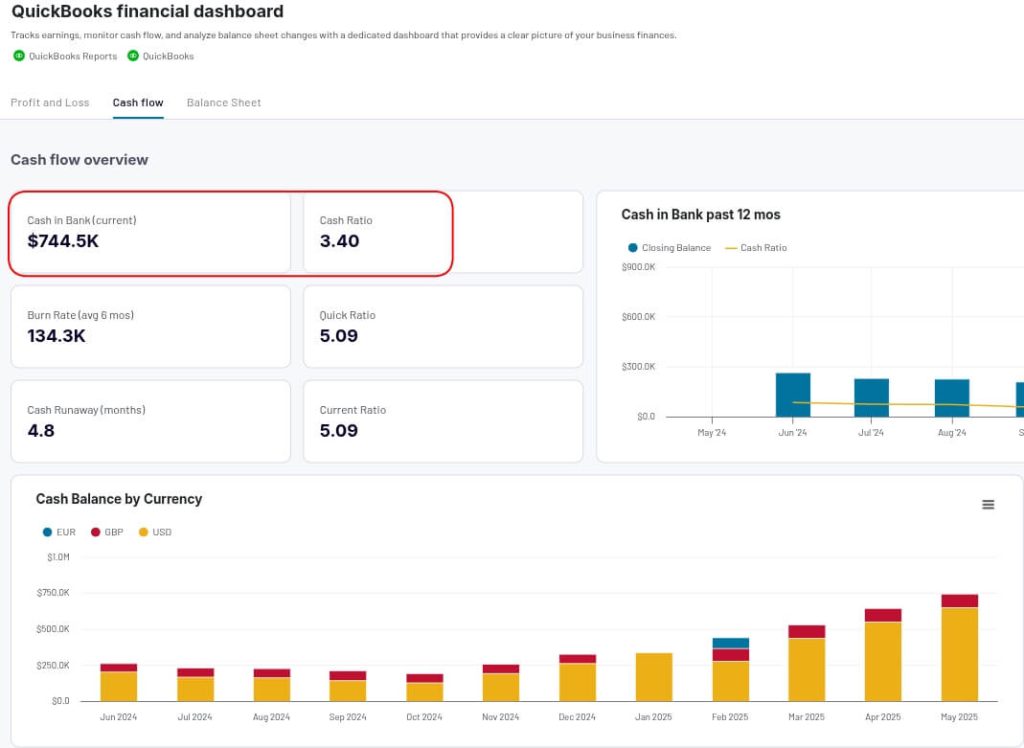
Return on Investment (ROI): Evaluates the profitability of an investment or initiative, helping you understand what activities deliver the best return.
Tracking and analyzing financial metrics is crucial for business performance. To gain a comprehensive overview of your financial performance analysis, consider using a ready-made template. Dashboard templates by Coupler.io are easy to implement – you only need a few minutes to integrate your accounting tool, such as QuickBooks, and extract the necessary data. Additionally, your data is automatically updated every 15 minutes, allowing you to analyze it as needed.
These metrics help gauge how satisfied, loyal, and valuable your customers are over time.
| Metric | How to Measure | Typical Benchmark |
| Customer Satisfaction (CSAT) | Avg. score from customer surveys | 75–85% is considered strong |
| Net Promoter Score (NPS) | %Promoters – %Detractors | 30+ is good; 50+ is excellent |
| Customer Retention Rate | ((End – New) ÷ Start Customers) × 100 | 85–90%+ in SaaS; 60–70% in retail |
| Customer Churn Rate | (Lost ÷ Start Customers) × 100 | <5% for SaaS; <10% for most industries |
| Customer Lifetime Value (CLTV) | Avg. Purchase × Frequency × Lifespan | 3× CAC is a common target |
Net Promoter Score (NPS): Measures customer loyalty and likelihood of them recommending your business. High NPS is often associated with growth and a strong brand perception.
Customer Satisfaction Score (CSAT): Measures the level of satisfaction customers have with a product, service, or interaction, typically through post-interaction surveys.
Customer Retention Rate: This metric indicates the percentage of customers retained over a specified period, reflecting your ability to maintain long-term relationships.
Customer Lifetime Value (CLV): A high CLV is a strong indicator of brand loyalty and a good fit in the market. Tracking CLV over a period of time helps you understand the return on your marketing campaigns and customer retention efforts.
Customer Churn Rate: Tracks how many customers stop doing business with you over a specific period. A rising churn rate often signals deeper issues in a product, service, or experience.
Marketing metrics
Effective marketing strategies depend on clear metrics. Whether you’re running short-term promotions or long-term marketing campaigns, understanding your conversion rates, CPL, and CLV helps inform data-driven decisions and optimize your spend.
| Metric | How to Measure | Typical Benchmark |
| Customer Acquisition Cost (CAC) | Sales + Marketing Spend / New Customers | Should be < CLTV ÷ 3 |
| Conversion Rate | (Conversions ÷ Visitors) × 100 | 2–5% (e-commerce), 10–25% (B2B) |
| Cost Per Lead (CPL) | Marketing Spend ÷ Number of Leads | $20–$100 (varies by industry) |
| Return on Ad Spend (ROAS) | Revenue ÷ Ad Spend | 400%+ is strong for e-commerce |
| Traffic Sources | Breakdown of where visitors come from | Varies by campaign and goal |
Learn more about how to measure digital marketing performance.
Conversion Rate: The percentage of users who complete a desired action (sign-up, purchase). It reflects the effectiveness of your funnel and messaging.
Cost Per Lead (CPL): Measures how much you spend to acquire each lead. It helps evaluate the efficiency of your lead generation strategy.
Customer Acquisition Cost (CAC): Tracks the total cost of acquiring a new customer, including marketing and sales expenses.
Return on Ad Spend (ROAS): Calculates how much revenue you earn for every dollar spent on advertising.
For further analysis of your paid ads campaign, the PPC multi-channel dashboard is a great option. It gathers data from all of your paid ad platforms and highlights the most important KPIs you need to monitor.
Traffic Sources: Breaks down where your website or app visitors come from (organic, paid, referral, direct), helping you optimize your acquisition strategy.

If you are implementing campaigns on various channels (paid ads, social media, email), then you’ll end up spending hours checking each channel and analyzing the data. To have a complete overview of your marketing performance, you can use the All-in-one Marketing Dashboard.
Depending on your focus and the tools you use, numerous marketing dashboard examples are available to help you gain an overview of your performance.
Sales metrics
These metrics evaluate the performance of your sales team and the efficiency of your sales process.
| Metric | How to Measure | Typical Benchmark |
| Sales Growth | ((Current – Previous Sales) ÷ Previous) × 100 | 10–20% YoY for growing companies |
| Lead-to-Customer Conversion | (New Customers ÷ Leads) × 100 | 5–10% in B2B; higher with inbound marketing |
| Sales Cycle Length | Avg. time from first contact to closed deal | 30–90 days (B2B), <7 days (B2C) |
| Average Deal Size | Total Revenue ÷ Number of Closed Deals | Varies by business model |
| Sales Target Achievement | % of sales goal reached | 100%+ desirable; monitor monthly |
Sales Growth: Measures the increase in revenue over a period. It’s a primary indicator of market traction and expansion.
Sales Target Achievement: Tracks whether your team is meeting its predefined sales goals. Useful for performance reviews and forecasting.
If you want a granular view into the performance of your sales agents, you can analyze your data from Salesforce in the Sales Team Performance Dashboard.
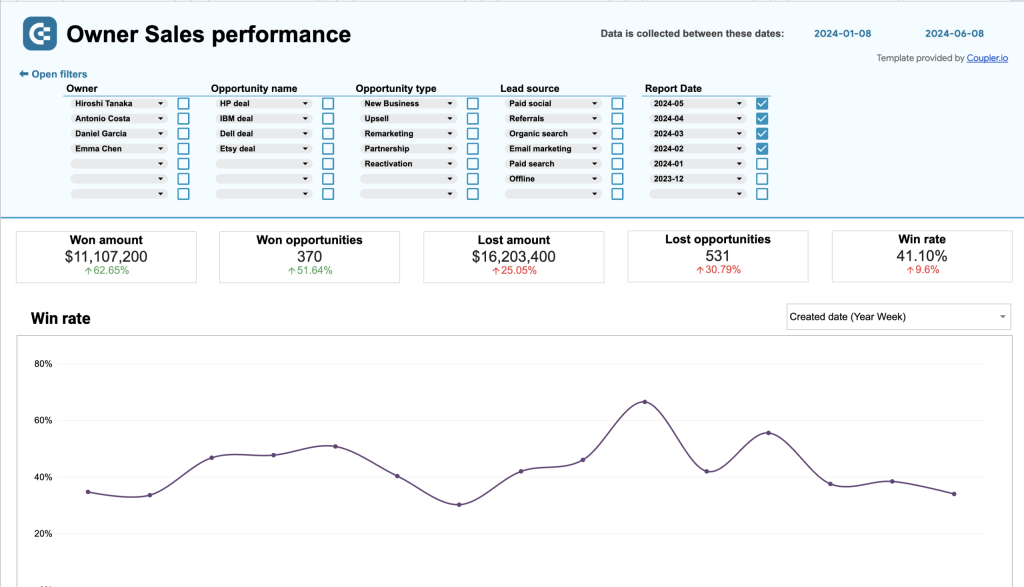
Average Deal Size: Reveals the typical value of a closed sale, helping to forecast revenue and allocate resources effectively.
Lead-to-Customer Conversion Rate: Measures the efficiency of your funnel from lead generation to closed deal.
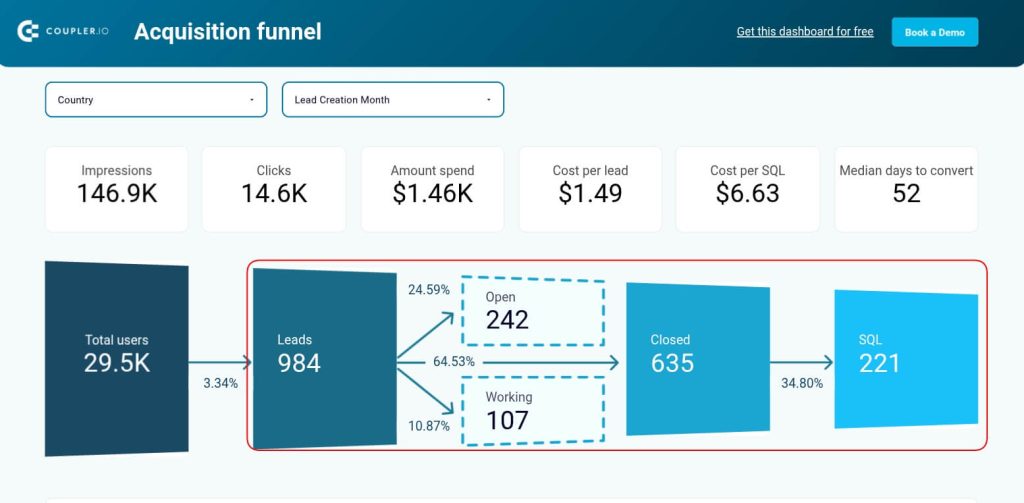
To gain a clear overview of your sales performance, consider using a ready-made dashboard, such as Sales KPIs for Pipedrive.
Sales Cycle Length: The average time it takes to convert a lead into a paying customer. Shorter cycles often mean greater sales efficiency.
Depending on your needs and the CRM you are using, there are various free-to-use sales analytics dashboards to choose from:
Operational metrics
Operational KPIs highlight how efficiently your company runs its core processes, especially in production and delivery.
| Metric | How to Measure | Typical Benchmark |
| Inventory Turnover Rate | COGS ÷ Avg. Inventory | 5–10× annually (retail); varies by product |
| Production Cycle Time | Avg. time to produce one unit | Shorter is better; varies by industry |
| Order Fulfillment Rate | % of customer orders fulfilled on time & in full | 95–99% for e-commerce/logistics |
| Capacity Utilization | Actual output ÷ Max capacity | 70–85% is efficient in manufacturing |
| Defect Rate | Defective Units ÷ Total Units Produced | As low as possible |
| On-Time Delivery Rate | Orders delivered on or before the promised date | 95%+ is considered excellent |
Inventory Turnover Rate: Indicates how frequently inventory is sold and replaced within a specified period. A high turnover suggests strong demand and efficient inventory management.
There are various metrics you can track to check the inventory turnover rate:
- Average daily units sold
- Stock value
- Available quantity
These indicators show how quickly inventory is being sold and can help approximate the turnover rate when combined.
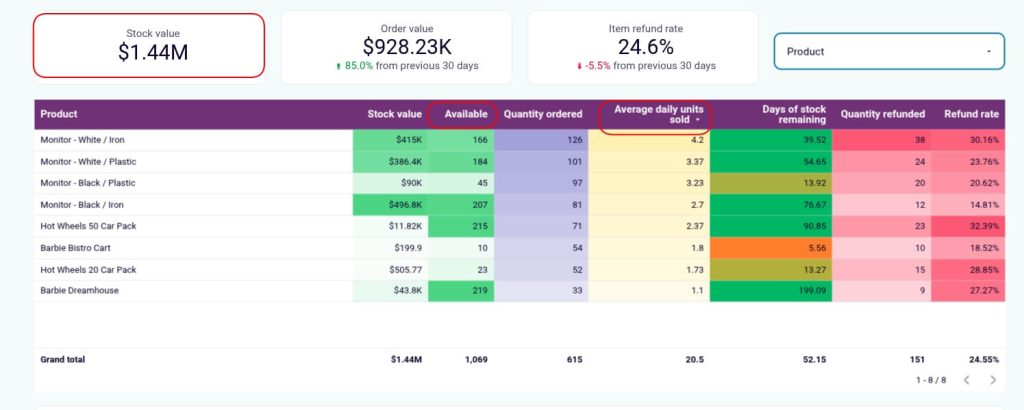
The Inventory dashboard for Shopify tracks average daily units sold and available inventory, allowing you to estimate inventory turnover and gauge how efficiently stock is moving. It provides instant visibility into key operational metrics, including stock levels, order volume, and refund rates. It helps track inventory turnover, spot fulfillment issues, and optimize stock decisions, all in one place. It’s a smart way to boost efficiency and keep your business running smoothly.
Production Cycle Time: Measures the time it takes to produce a product from start to finish. Shorter cycles can result in faster delivery and lower costs.
Capacity Utilization: Assesses how fully your production capacity is being used. Helps identify underused or overextended resources.
Order Fulfillment Rate: The percentage of customer orders completed accurately and on time. A direct reflection of logistics and operational efficiency.
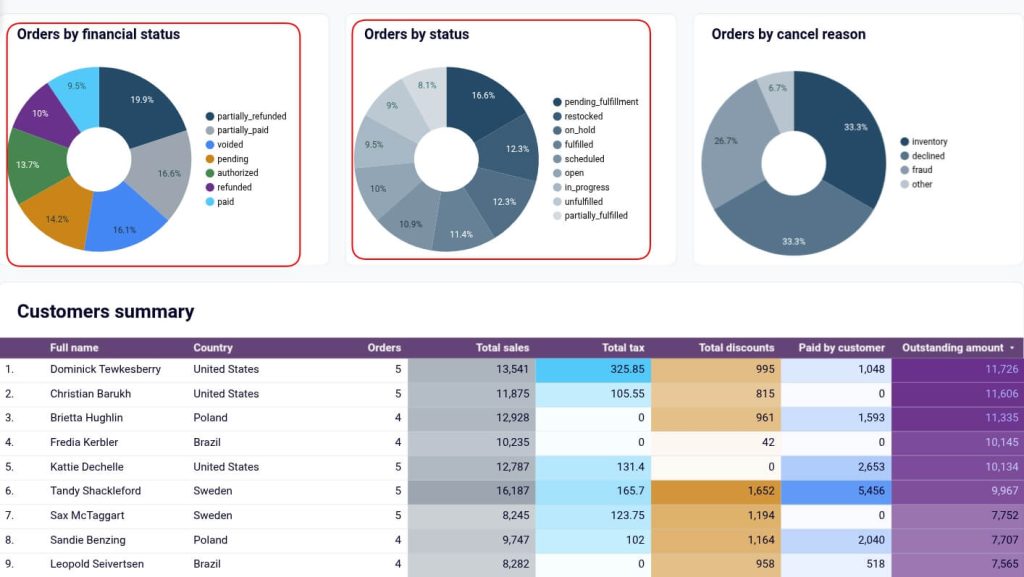
This Shopify Order Dashboard provides a clear, visual breakdown of order statuses, financial states, and cancellation reasons, which helps you boost Order Fulfillment Rates by identifying bottlenecks, such as high rates of pending or unfulfilled orders. By tracking fulfillment trends over time, teams can proactively address delays and streamline operations.
Additionally, cancellation reasons such as fraud, inventory issues, and declined transactions are visualized for quick root cause analysis, which helps reduce the Defect Rate and improve overall quality control.
Defect Rate: Tracks the number of defective units produced. Lower rates indicate better quality control and fewer returns.
On-Time Delivery Rate: Measures how reliably you meet delivery deadlines, impacting customer satisfaction and supply chain performance.
Employee-focused metrics
Don’t overlook human resources data. Metrics such as employee turnover, satisfaction scores, and business productivity rates significantly impact your culture and your ability to sustain long-term success. Keeping track of these can help business owners make more informed decisions about hiring, training, and engagement.
| Metric | How to Measure | Typical Benchmark |
| Employee Productivity | Revenue or output per employee | Varies by industry and role |
| Employee Turnover Rate | Employees Left ÷ Avg. Total Employees × 100 | <10% annually is ideal |
| Employee Satisfaction (eNPS) | %Promoters – %Detractors from internal survey | 10+ is okay; 30+ is healthy |
Employee Productivity Rate: Evaluates output per employee, often measured in terms of revenue generated or tasks completed.
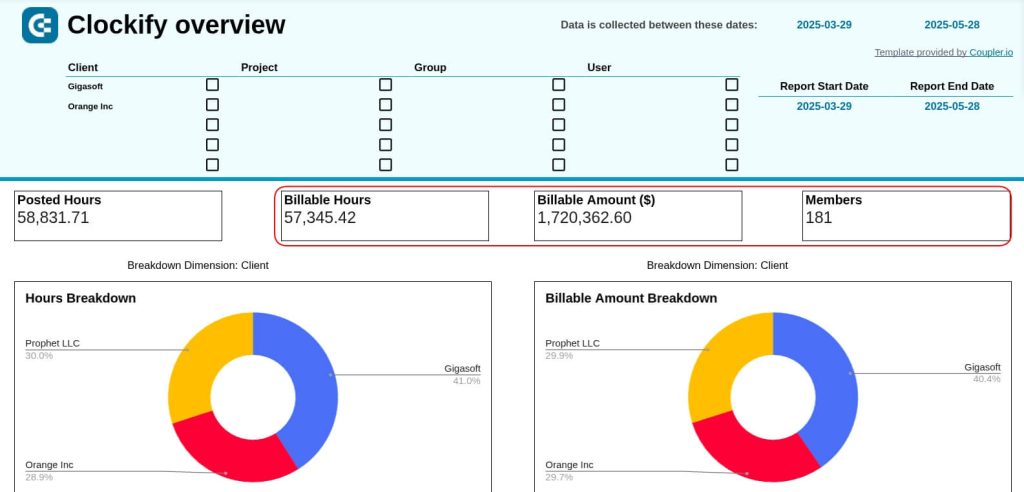
You can use a time tracking dashboard to calculate your productivity rate and monitor the performance of your employees. The Clockify dashboard displays Posted Hours, Billable Hours, and Billable Amount for all team members and clients. With the number of members contributing billable hours, you can easily calculate productivity at both the individual and team levels.
Employee Turnover Rate: The percentage of employees leaving your company in a given time frame. High turnover can signal issues in culture, compensation, or management.
Employee Satisfaction Score (eNPS): Similar to NPS, this measures how likely employees are to recommend your organization as a place to work.
Revenue Per Employee: Calculates how much revenue each employee generates on average, indicating both workforce efficiency and overall business scalability.
Tools to measure business performance
Selecting the right tools to track and analyze performance is crucial for transforming data into actionable insights. The best tools not only collect metrics but also help visualize trends, identify bottlenecks, and guide more intelligent decision-making.
| Goal | Tool Type | Example Tools |
| Automate reporting and analytics | Data integration & reporting | Coupler.io |
| Track financial health | Accounting | QuickBooks, Xero |
| Analyze marketing ROI | Analytics | Google Analytics, Meta Ads |
| Monitor customer retention | CRM | HubSpot, Salesforce |
| Improve team productivity | Time tracking | Clockify, Asana |
| Build KPI dashboards | BI tools | Looker Studio, Power BI |
Coupler.io: All-in-one data hub and reporting platform
While other tools specialize in specific functions, Coupler.io brings everything together. It’s a data automation and integration platform that unifies data across finance, marketing, sales, and operations.
- Automatically pulls data from accounting platforms like QuickBooks, CRMs like HubSpot and Salesforce, or marketing tools like Google Analytics 4
- Eliminates manual reporting by syncing real-time data into dashboards (Looker Studio, Power BI, Excel, etc.)
- Organizes data into reports
- Provides instant insights into raw data through over 100 dashboard templates
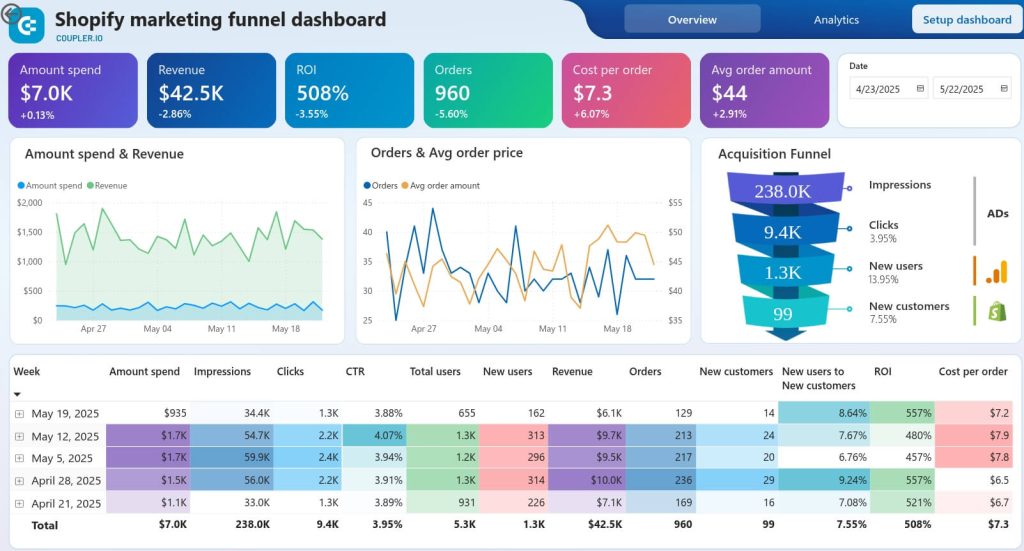
For example, an e-commerce company that has a website on Shopify and uses Google Analytics 4 for reporting, as well as Facebook Ads and TikTok Ads for marketing, can connect all four platforms with Coupler.io.
Instead of checking separate reports, leadership views unified KPIs in a single, real-time report created from scratch in their preferred data visualization tools. To save time, they can use a free template, like the Shopify Marketing Funnel Dashboard.
Financial tracking tools
Financial performance is the bedrock of business health, and these tools help manage everything from budgeting to reporting.
- QuickBooks: A popular accounting software for small to medium-sized businesses. It offers features for invoicing, expense tracking, payroll, and financial reporting.
- Xero: One of the leading cloud-based accounting software solutions. It excels in real-time collaboration, bank reconciliation, and integration with third-party apps.
- FreshBooks: Tailored for freelancers and service-based businesses, it simplifies time tracking, invoicing, and expense management.
These tools enable easier monitoring of financial KPIs, such as cash flow, profit margins, and ROI, in real-time.
Project and time tracking tools
Keeping operations efficient requires visibility into how projects progress and how time is spent across teams.
- Clockify: A popular time tracking and productivity tool that works well for small teams, freelancers, and even larger organizations. It tracks billable hours, generates detailed time reports, and integrates with project management tools like Asana, Trello, and Jira. Great for calculating team productivity, employee utilization, and project costs.
- Asana: A flexible project management tool that helps teams track tasks, deadlines, and workflows. It’s great for aligning team performance with business goals.
These platforms are essential for measuring productivity, project cycle times, and team efficiency.
CRM and customer success platforms
Understanding customer behavior, tracking interactions, and maintaining relationships is critical for growth and retention.
- HubSpot: A comprehensive CRM platform with tools for sales, marketing, customer service, and reporting, all under one roof. Ideal for small to midsize businesses.
- Custify: Designed specifically for customer success teams in SaaS companies, Custify offers automated health scores, lifecycle tracking, and proactive engagement tools to reduce churn and maximize CLTV.
- Salesforce: A leading enterprise CRM solution with robust customization, reporting, and integration capabilities for large organizations.
These tools enable the deep tracking of customer-related metrics, such as NPS, retention, and churn.
Marketing analytics tools
Marketing success depends on your ability to measure impact across channels. These tools help marketers connect performance to outcomes.
- Google Analytics: Essential for tracking website performance, user behavior, traffic sources, and conversions.
- PPC platforms (Google Ads, Meta Ads Manager): Provide detailed campaign metrics like CPC, CTR, ROAS, and conversion tracking.
- Social media platforms (LinkedIn, Facebook, Instagram Insights): Offer native analytics to assess reach, engagement, follower growth, and audience demographics.
Together, these tools give a complete view of how marketing drives awareness, leads, and revenue.
Sales tracking tools
Sales performance tools enable you to monitor pipeline health, deal progress, and rep productivity in real-time.
- Pipedrive: A user-friendly CRM focused on sales pipeline management, with visual dashboards and automation features for closing deals faster.
- Zoho CRM: Offers a full-featured CRM suite with sales forecasting, workflow automation, and advanced analytics.
These platforms enable easy measurement of key metrics, such as deal size, sales cycle length, and conversion rates, which are crucial indicators of growth potential.
How to improve business performance
Turning data into action: Using insights from tools and metrics
Collecting performance data is only half the battle. The real value lies in what you do with it. This requires a disciplined approach to goal-setting, a toolkit of improvement strategies, and a commitment to continuous measurement.
The first thing you need to do is set clear objectives. Once clear goals are in place, decision-making models such as the OODA Loop (Observe, Orient, Decide, Act), PDCA Cycle (Plan-Do-Check-Act), or DMAIC (Define, Measure, Analyze, Improve, Control) can guide teams through a systematic evaluation and execution. These frameworks provide a repeatable path from data observation to measurable improvement.
However, having the proper framework is only part of the equation. The next challenge is execution at scale, and that’s where technology plays a crucial role.
While traditional dashboards offer valuable overviews, AI-powered solutions are changing the game. Coupler.io equips its dashboards with the AI insights feature. It’s an AI Assistant to analyze trends, flag anomalies, and even suggest performance improvements. This automates much of the heavy lifting that would otherwise require hours of manual analysis.
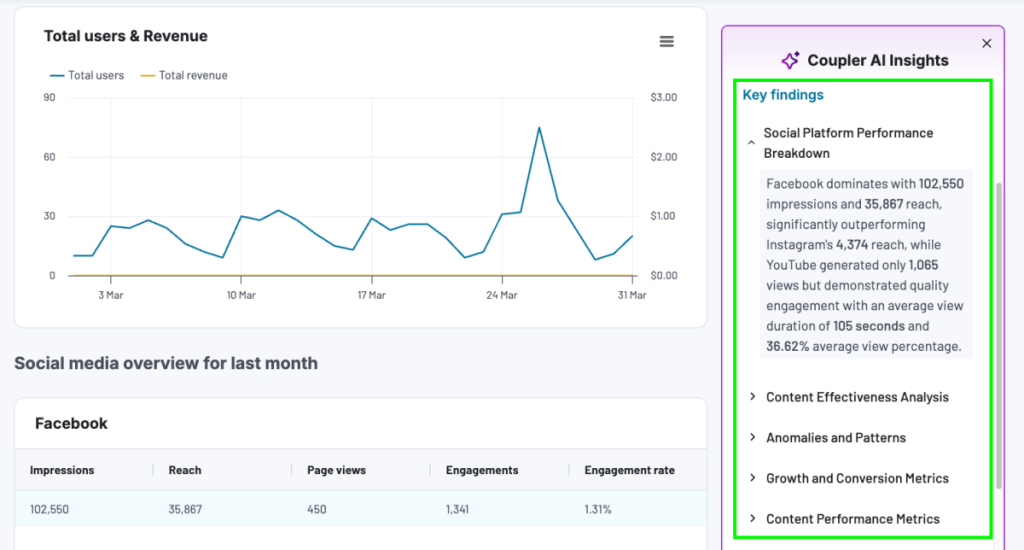
For example, instead of manually analyzing data to understand why campaign ROI dropped, Coupler.io can surface insights like “Email campaigns underperformed by 24% week-over-week due to lower open rates in your APAC segment.” This level of granularity allows you to take targeted action quickly.
AI also enhances scenario modeling and forecasting. Want to know how a 10% increase in return rates might affect your quarterly profit? AI tools can simulate that in real-time, helping leaders make proactive, data-backed decisions rather than reactive ones.
Setting performance improvement goals
To move from data collection to meaningful change, you need a clear framework for setting and tracking goals. Two popular approaches are:
OKRs (Objectives and Key Results): Set ambitious, qualitative goals (objectives) supported by specific, measurable outcomes (key results).
Example: Improve customer onboarding experience (objective); Reduce average time to value from 14 days to 7 (key result).
KPIs (Key Performance Indicators): These are individual metrics tied directly to business outcomes. They’re ideal for tracking ongoing performance in specific areas, such as revenue growth or churn rate.
When used together, OKRs and KPIs help align teams, clarify priorities, and create accountability for progress.
Explore also about small business data analytics.
Strategies for improvement
Once you’ve identified areas that need attention through your metrics, here are actionable strategies to drive performance:
Streamline operations
Use data to identify inefficiencies, long cycle times, high defect rates, or poor utilization, and redesign workflows accordingly. Automation, lean practices, or process reengineering can reduce waste and increase speed.
Invest in training
Low employee productivity or customer satisfaction may point to skill gaps. Use performance data to identify where targeted training, coaching, or upskilling can make the most significant impact.
Improve customer experience
Metrics like CSAT, NPS, and churn rate reveal what your customers think and feel. Dig deeper into feedback and behavior data to identify friction points and take action through better onboarding, support, or product updates.
Leverage automation and technology
When performance tracking reveals repetitive manual tasks, fragmented data, or reporting delays, it’s time to look at smarter systems. Workflow automation, AI-powered tools, and integration platforms can drastically reduce the time spent on low-value tasks while also increasing accuracy.
Platforms like Coupler.io connect your tools and automate data collection, freeing your team from time-consuming exports and inconsistent reports. For example, PlumbBooks, a financial services firm, used Coupler.io to automate its financial reporting by syncing real-time data from QuickBooks. This shift not only eliminated manual reporting tasks but also provided the team with sharper visibility into profit margins and operational cash flow.
The result? A 40% increase in revenue and clearer decision-making across the board.
Continuous measurement and adaptation as a long-term strategy
Business performance is not a one-time evaluation; it’s a cycle of measure ? learn ? improve ? repeat. High-performing organizations:
- Regularly review dashboards and reports across departments.
- Compare performance against benchmarks, competitors, and past performance.
- Treat underperformance as a signal, not a failure, and iterate on strategy.
- Foster a culture where teams proactively use data to inform decisions, not just report on them.
By integrating continuous measurement into daily operations, companies remain agile and aligned with changing market conditions and evolving customer needs.
Common pitfalls and troubleshooting
Even with the right tools and data, it’s easy to fall into traps that prevent meaningful action. Here’s what to watch out for, and how to address them:
1. Measuring too many metrics at once
Tracking everything can dilute focus and overwhelm teams.
The fix: Prioritize 3–5 core KPIs per team or department. Choose metrics that are directly tied to strategic goals.
2. Analysis paralysis: When data doesn’t lead to action
Teams collect insights but hesitate to act due to fear of risk or lack of clarity.
The fix: Assign ownership to each metric. Combine insights with clear action plans, deadlines, and responsibilities.
3. Misaligned incentives creating unintended consequences
Teams often optimize for their own KPIs (supporting speed over quality), which can hinder broader goals.
The fix: Align incentives with shared objectives and cross-functional metrics. Encourage collaboration across silos.
4. Poor data quality undermining trust in metrics
Inconsistent, inaccurate, or outdated data leads to skepticism and inaction.
The fix: Invest in data hygiene, automated syncing, validation rules, and periodic audits. Tools like Coupler.io can help centralize and clean data from multiple sources.
5. Lack of context in interpretation leading to misguided decisions
Metrics are viewed in isolation, leading to false conclusions.
The fix: Always analyze metrics in context, time trends, benchmarks, or qualitative feedback. Encourage teams to ask why, not just what.
By turning raw data into insights and insights into action, your business can transition from reactive firefighting to proactive performance management.
Measure and monitor business performance
Measuring business performance goes far beyond tracking numbers. It’s about understanding what those numbers mean and what they reveal about your operations, customers, and team. Each metric provides a signal, helping you identify strengths, uncover issues, and focus your energy where it matters most.
Effective performance measurement starts with clarity. Define the metrics that align with your goals, and make it a habit to regularly review and reflect on them. Don’t wait for a flawless system to begin. Small steps, such as automating reports, setting clear KPIs, or holding consistent check-ins, can create powerful momentum over time.
The real impact of performance measurement doesn’t come from the tools alone but from how consistently you use them. Businesses that succeed are the ones that build habits around data. They reflect, adapt, and use insights to guide their decisions, not just support them.
Approach measurement with intention, stay flexible as you grow, and focus on learning as much as optimizing. Over time, this mindset will drive continuous improvement and lasting results. The most effective measurement systems don’t start perfectly—they start small, stay intentional, and grow with your business.
Want a fast way to start tracking what matters?
Try a Coupler.io startup dashboard template to get a live view of your KPIs in just minutes—no technical setup needed.
Measure your business performance with Coupler.io
Get started for free


