The difference between profitable LinkedIn campaigns and budget drain often comes down to one thing: how quickly you can spot performance patterns and act on them.
These free LinkedIn Ads report templates cut your reporting time from days to minutes while giving you deeper insights than LinkedIn’s native analytics. From daily performance tracking to monthly strategic analysis, each template is designed to help B2B marketers make faster, smarter optimization decisions.
1. LinkedIn Ads performance dashboard
This free template covers the most important metrics and organizes your LinkedIn Ads data in an analysis-ready manner. It can be a useful instrument both for performance tracking and for analyzing data. With this dashboard offered by Coupler.io, you can visualize your data in less than two minutes and get a live, customizable dashboard.
Here is what this LinkedIn Ads performance template provides:
- Overview of the key metrics
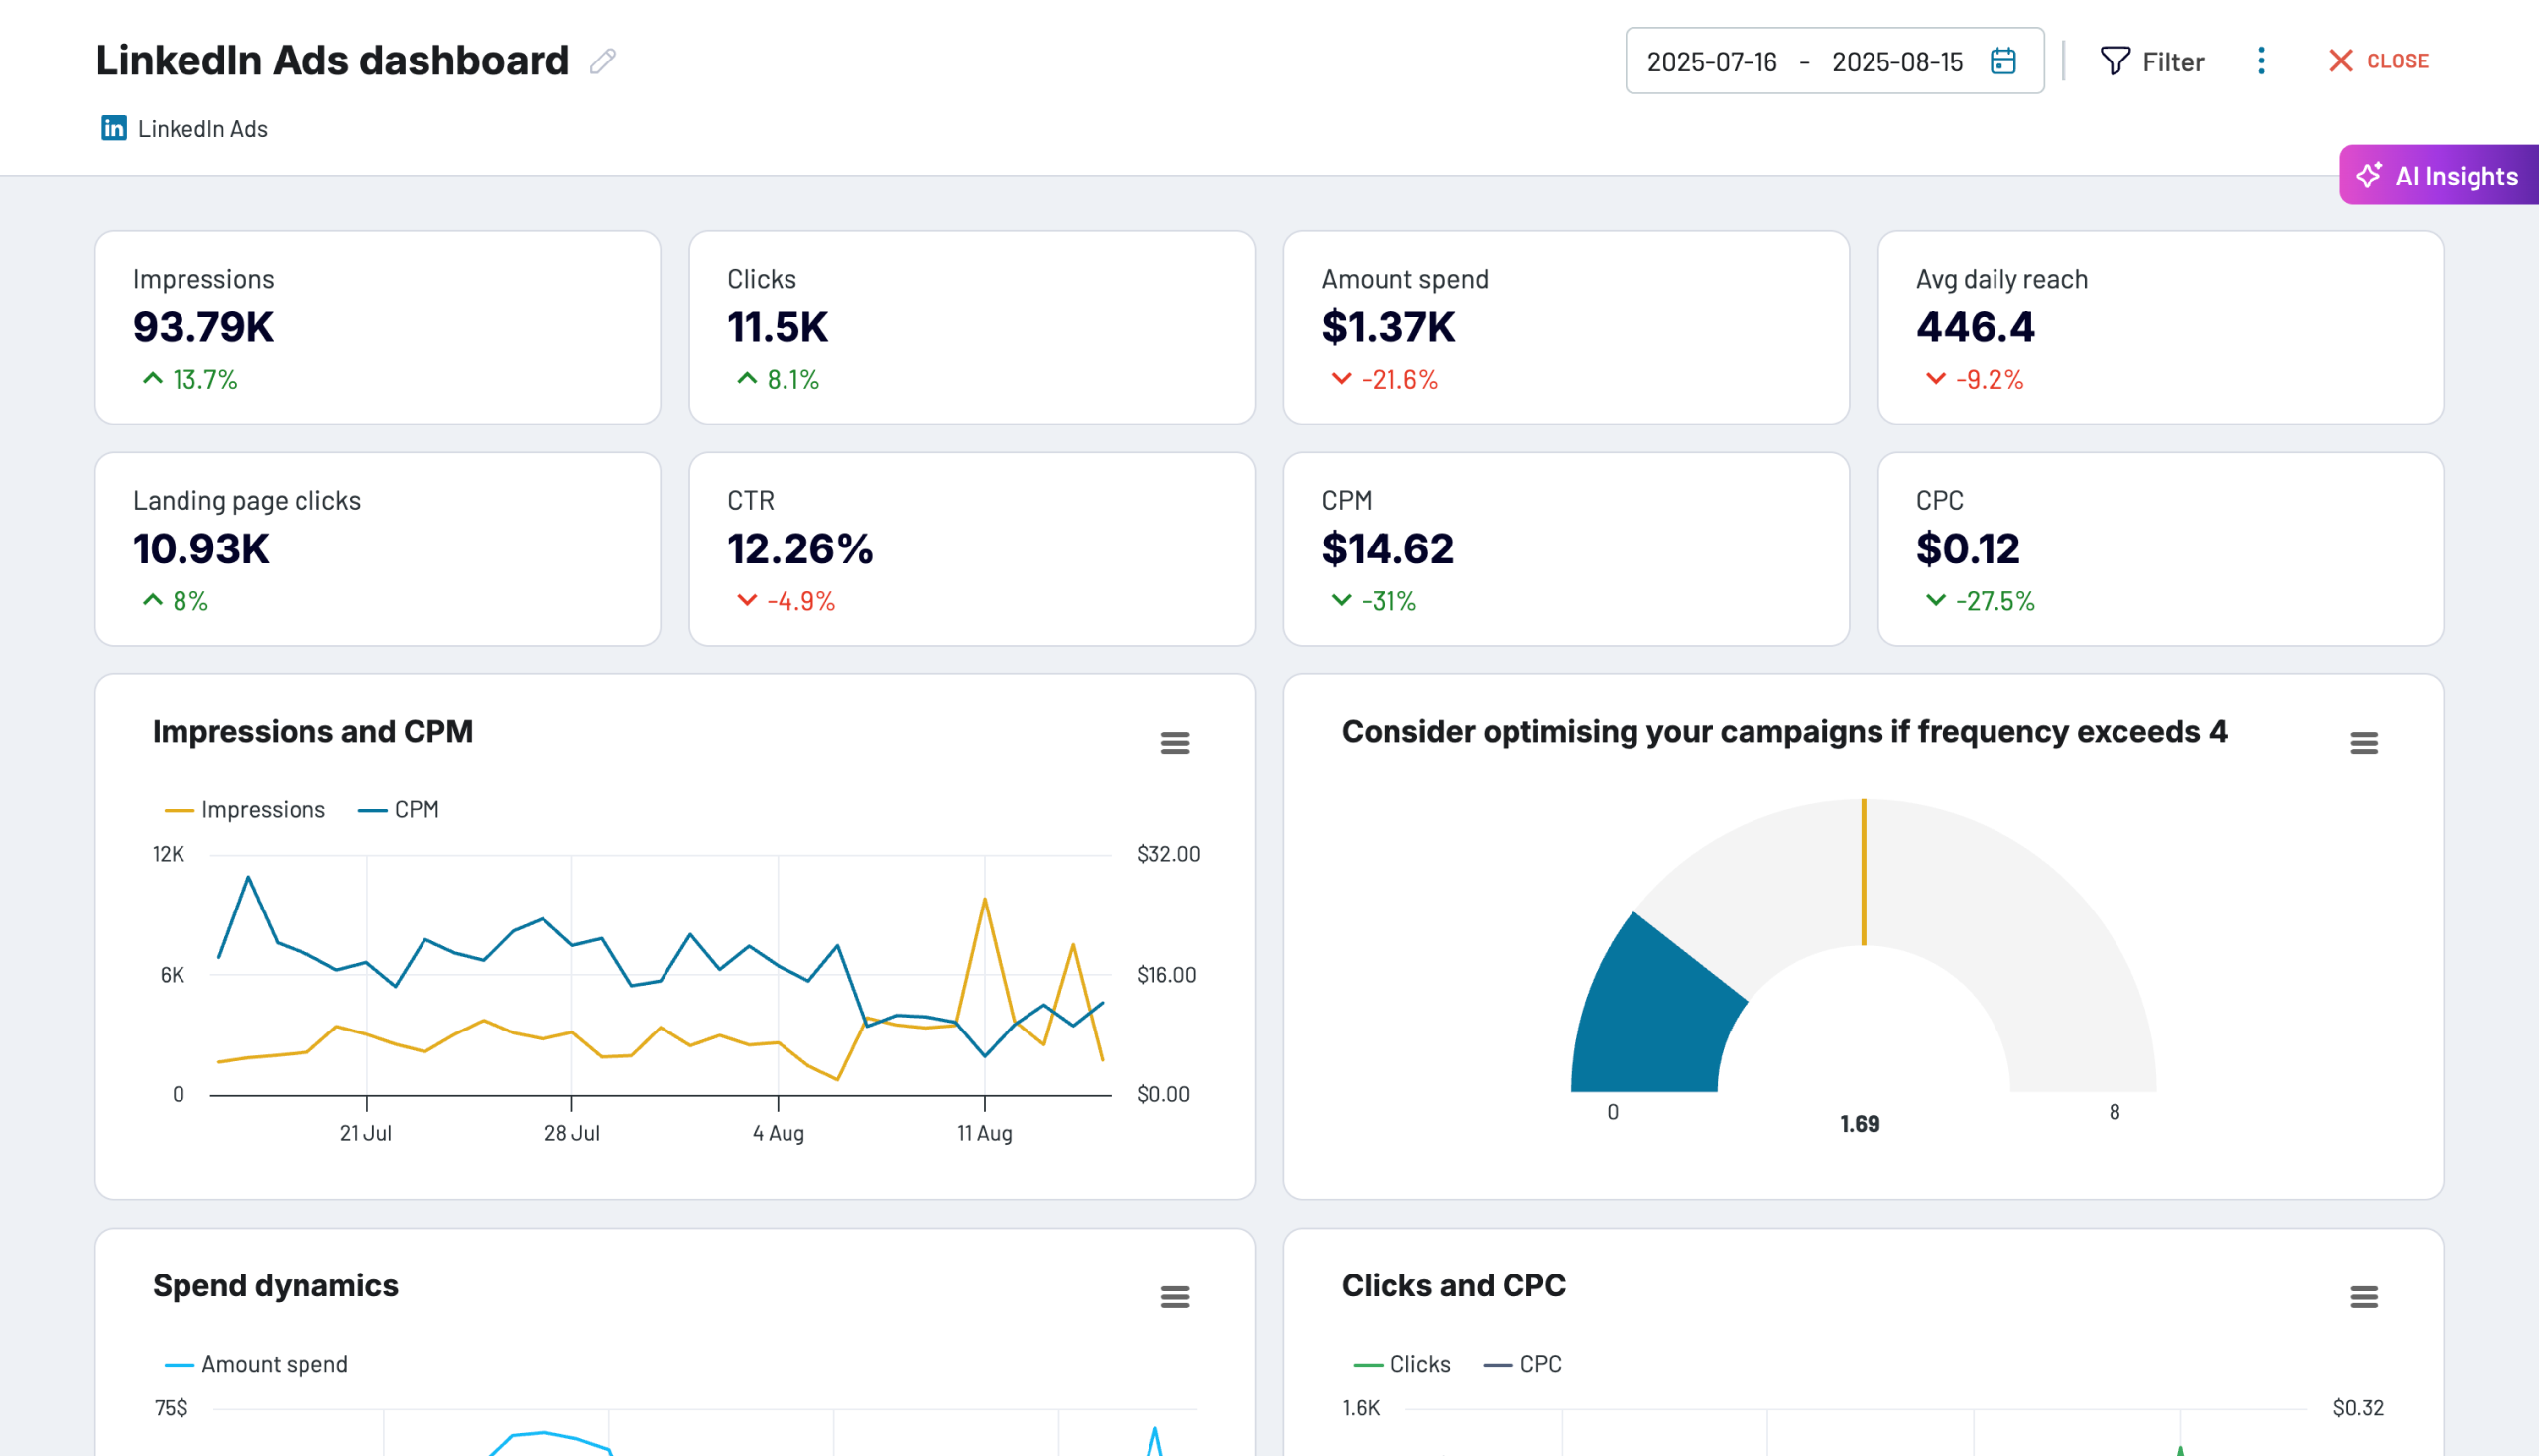
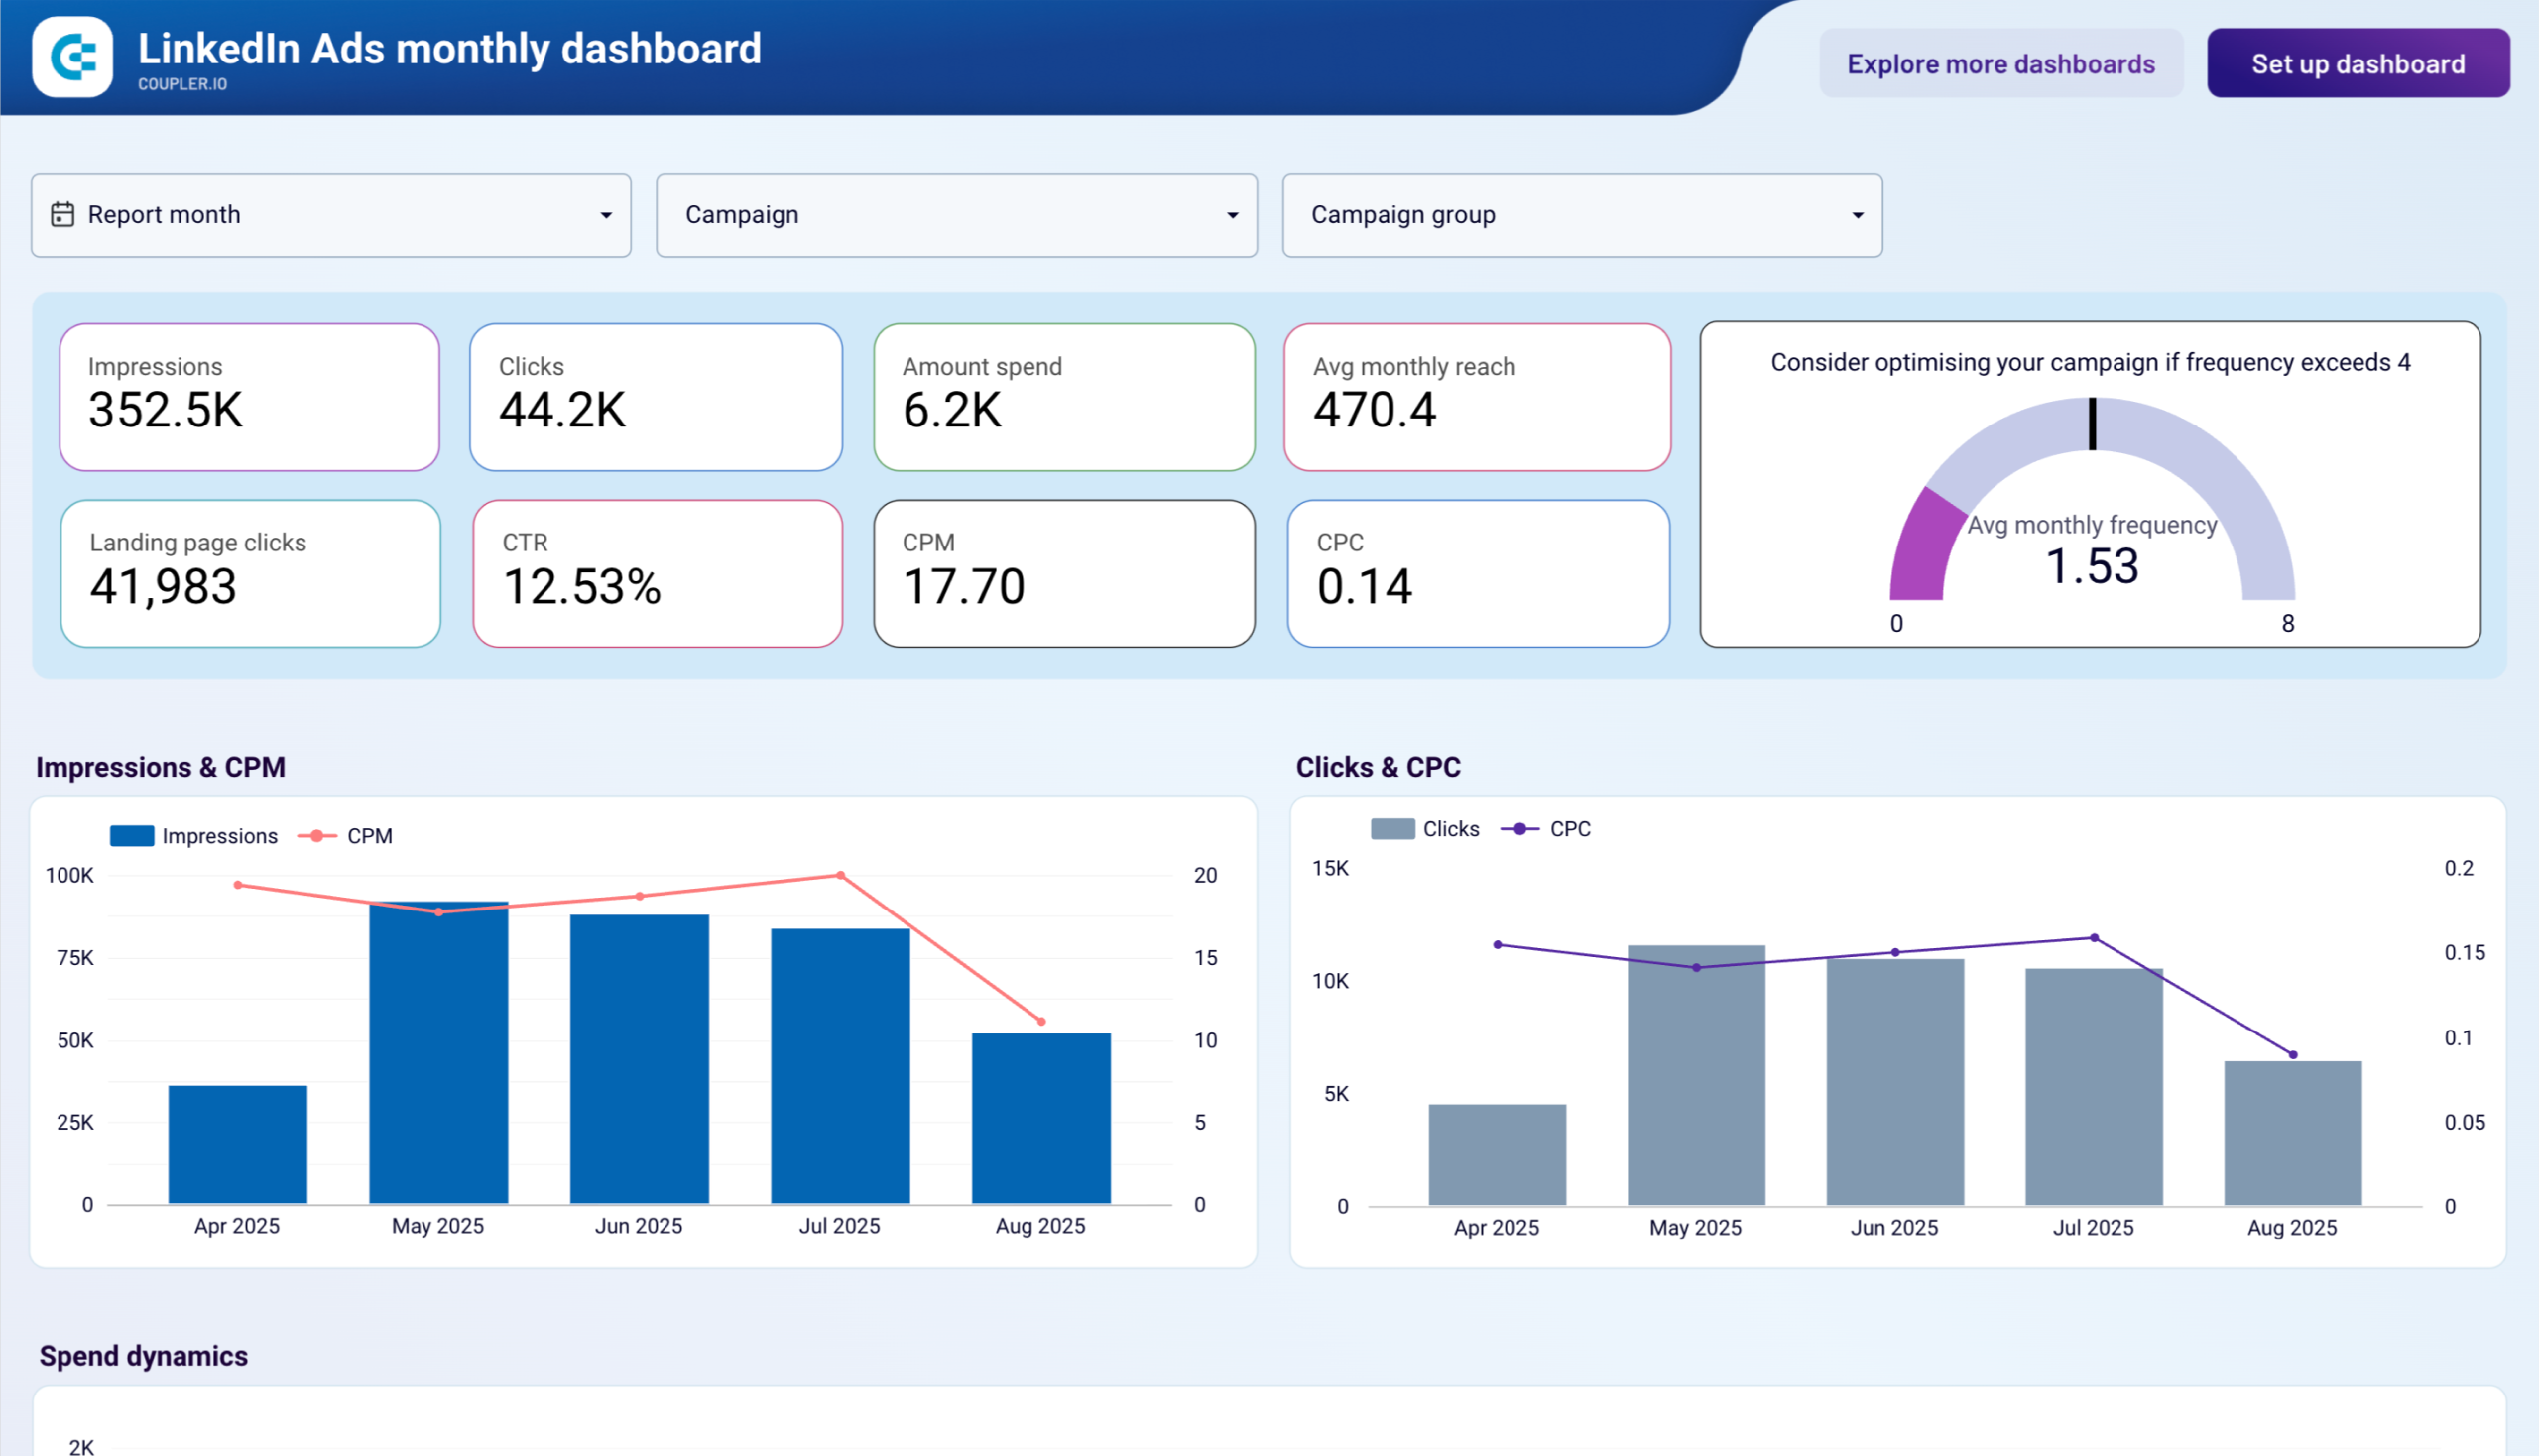
The dashboard features a clean, modern layout with key performance indicators displayed as prominent cards at the top. Each metric card shows the current value along with percentage changes from the previous period, making it easy to spot trends at a glance.
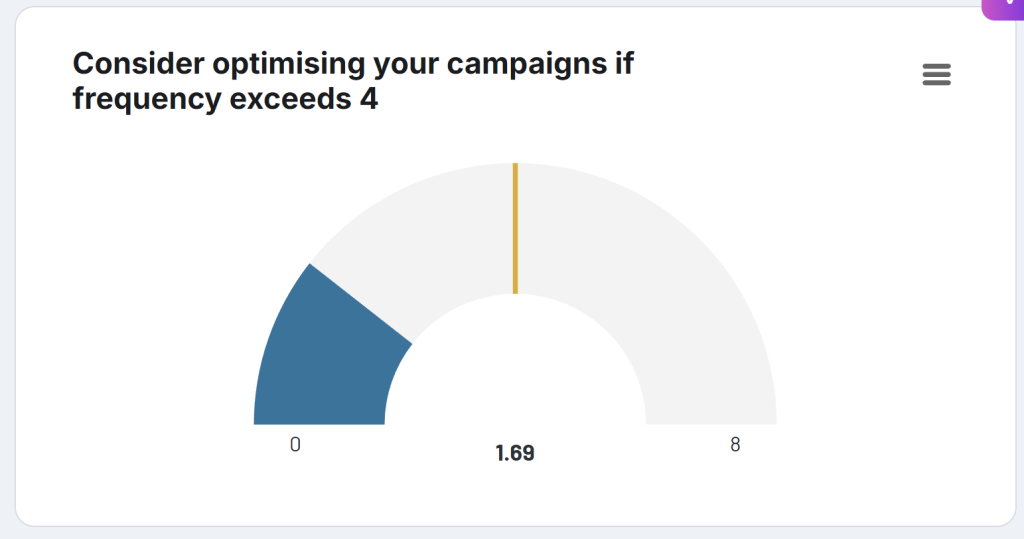
- Frequency meter
Ideally, you need to show your ads to users often enough to get their attention, but not so often that they develop ad fatigue. This is where the Frequency meter comes in handy. It allows you to monitor how many times, on average, the same user sees your ad. If the frequency goes above 3-4, it’s best to change settings.
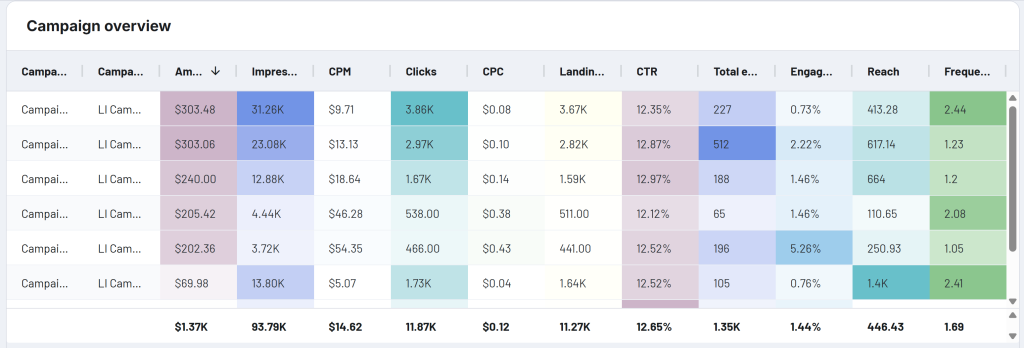
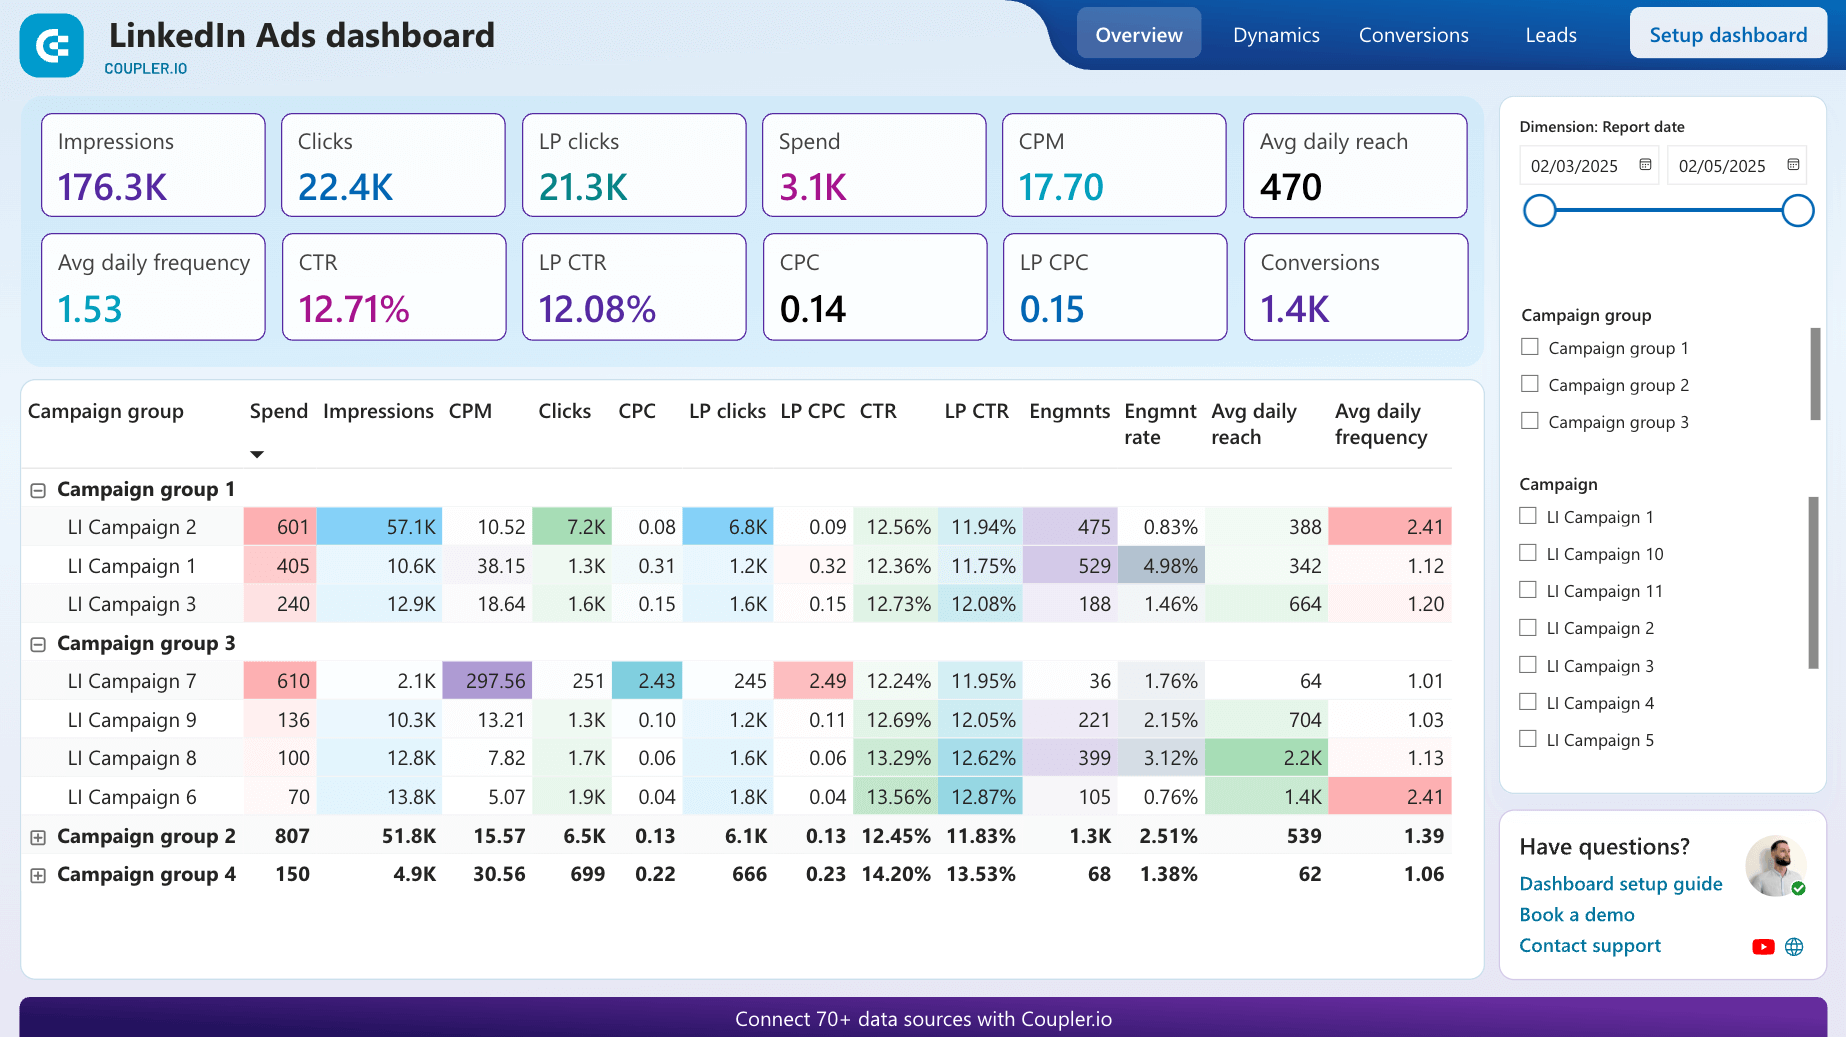
- Campaign results breakdown
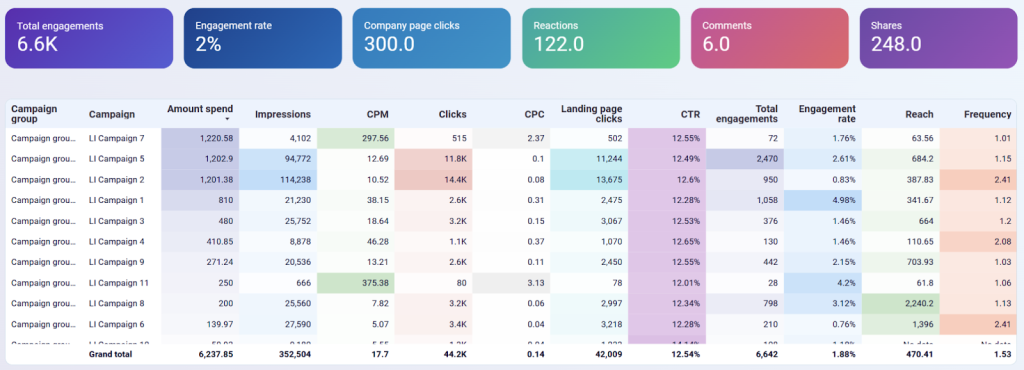
The campaign breakdown table provides a performance overview with extensive metrics. This includes:
- Campaign identification with campaign groups, financial metrics like amount spent, CPM, and CPC with color-coded performance indicators
- Engagement data such as impressions, clicks, CTR, and landing page clicks
- Lead performance, including total events, engagement rate, reach, and frequency.
Visual performance indicators through color-coded cells help identify top and bottom performers quickly.
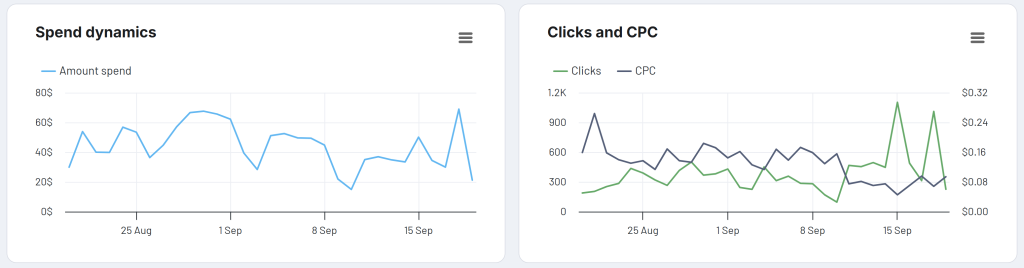
- Spend dynamics
The dashboard includes dynamic time-series visualizations that allow you to correlate spending patterns with engagement metrics, and monitor the effectiveness of campaign optimizations over time.
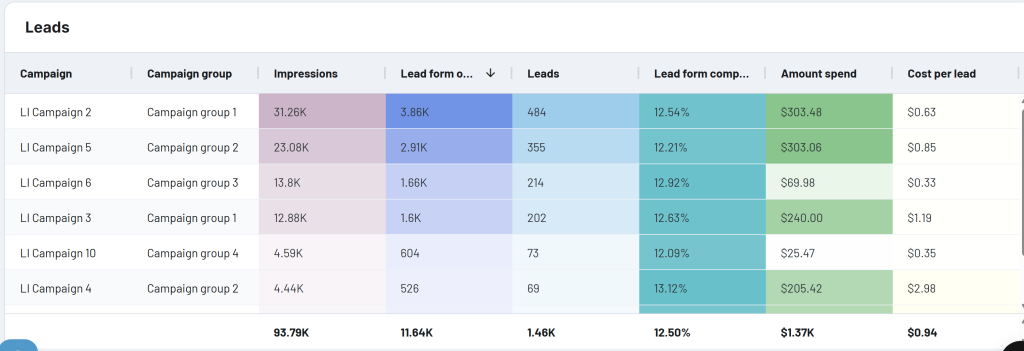
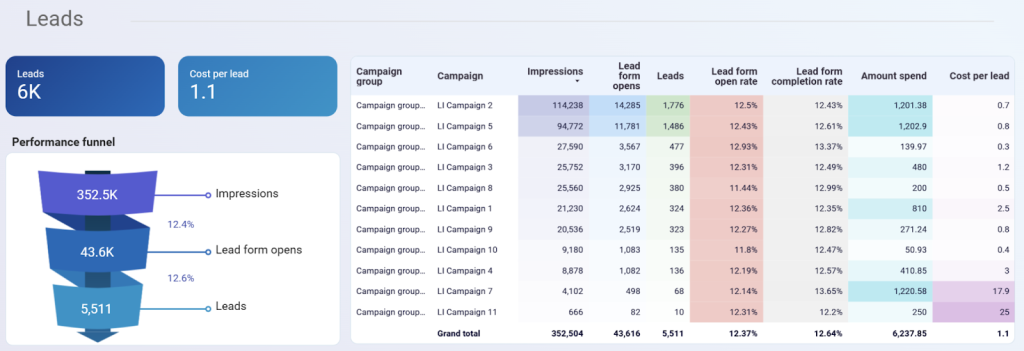
- Leads breakdown
A dedicated leads table is useful for easy identification of which campaigns generate leads most cost-effectively. It shows lead form metrics, including lead form opens and completions with conversion rates, campaign-level lead breakdown with cost per lead, lead volume, and completion rates by campaign, and performance comparison.
Dashboard metrics
- Impressions
- Clicks
- Amount spent
- Reach
- Frequency
- CTR
- CPC
- CPM
- Engagement rate
- Conversion rate
- Other performance metrics
The dashboard can be used right in Coupler.io – this version also has the AI insights panel to reveal key findings, trends, and recommendations. At the same time, you can use the report as a template in Looker Studio, Power BI, and Google Sheets:
LinkedIn Ads performance dashboard in Coupler.io
Track LinkedIn advertising campaign effectiveness with detailed performance metrics, leads acquisition analysis, and frequency optimization insights.


LinkedIn Ads performance dashboard in Power BI
Analyze LinkedIn Ads campaign metrics, monitor emerging trends, and track your leads funnel all in one place.

LinkedIn Ads performance dashboard in Looker Studio
Get complete visibility into your LinkedIn Ads performance with this dashboard to track campaign dynamics, conversions, and leads.

LinkedIn Ads performance dashboard in Google Sheets
Track your LinkedIn Ads success with this easy-to-use dashboard. Monitor campaign success and measure leads and conversions.

2. LinkedIn Ads monthly performance dashboard
This LinkedIn Ads template focuses on long-term campaign analysis and monthly trend tracking for LinkedIn advertising campaigns. It’s designed for marketers who need to understand seasonal patterns, optimize budget allocation across months, and track professional audience engagement over extended periods.
LinkedIn Ads monthly performance dashboard
 Preview dashboard
LinkedIn Ads monthly performance dashboard
Preview dashboardMonthly performance trends
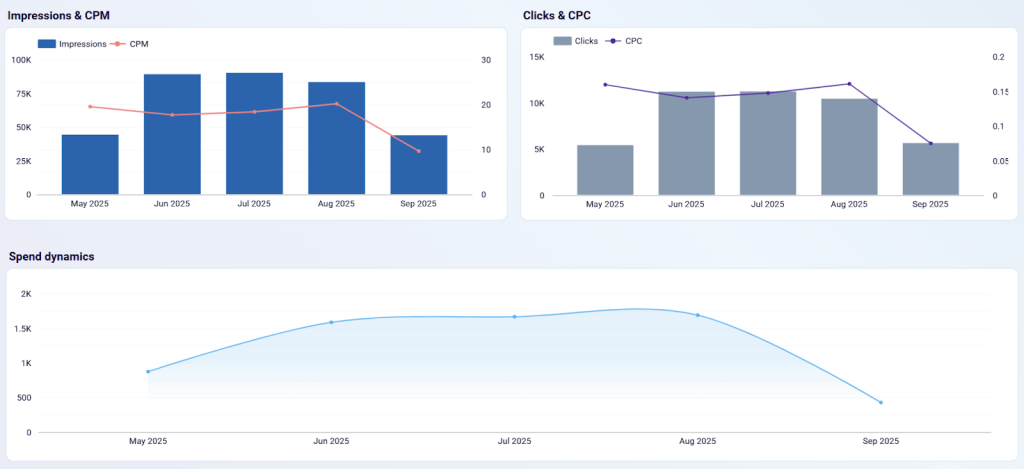
The dashboard displays key metrics with month-over-month comparisons, showing how impressions, clicks, spend, and conversions change over time. This helps identify seasonal patterns in your B2B audience behavior and reveals which months typically drive the best performance.
Campaign performance comparison
A detailed table breaks down performance by campaign group and individual campaigns, showing monthly metrics including spend, impressions, clicks, CTR, and lead generation. This allows you to compare which campaigns maintain consistent performance and which show seasonal variations.
Lead form performance analysis
The leads section specifically tracks LinkedIn’s native lead forms with monthly breakdowns, showing how many people saw your ads, opened lead forms, and actually completed them. It includes metrics like leads generated, form open rate, completion rate, and cost per lead tracked over monthly periods.
Dashboard metrics:
- Monthly impressions and reach
- Lead form completion rates
- Campaign group performance
- Cost per lead and conversion tracking
- Professional audience engagement metrics
This dashboard is built in Looker Studio and powered by Coupler.io. Your LinkedIn data can be automatically loaded into the dashboard template by following the instructions in the Readme tab.
3. LinkedIn Ads leads dashboard
For businesses focused specifically on lead generation through LinkedIn advertising, Coupler.io offers the LinkedIn Ads leads dashboard. It consolidates lead performance data, cost metrics, and campaign effectiveness indicators to help you optimize your B2B advertising strategy and maximize ROI from your lead generation efforts.
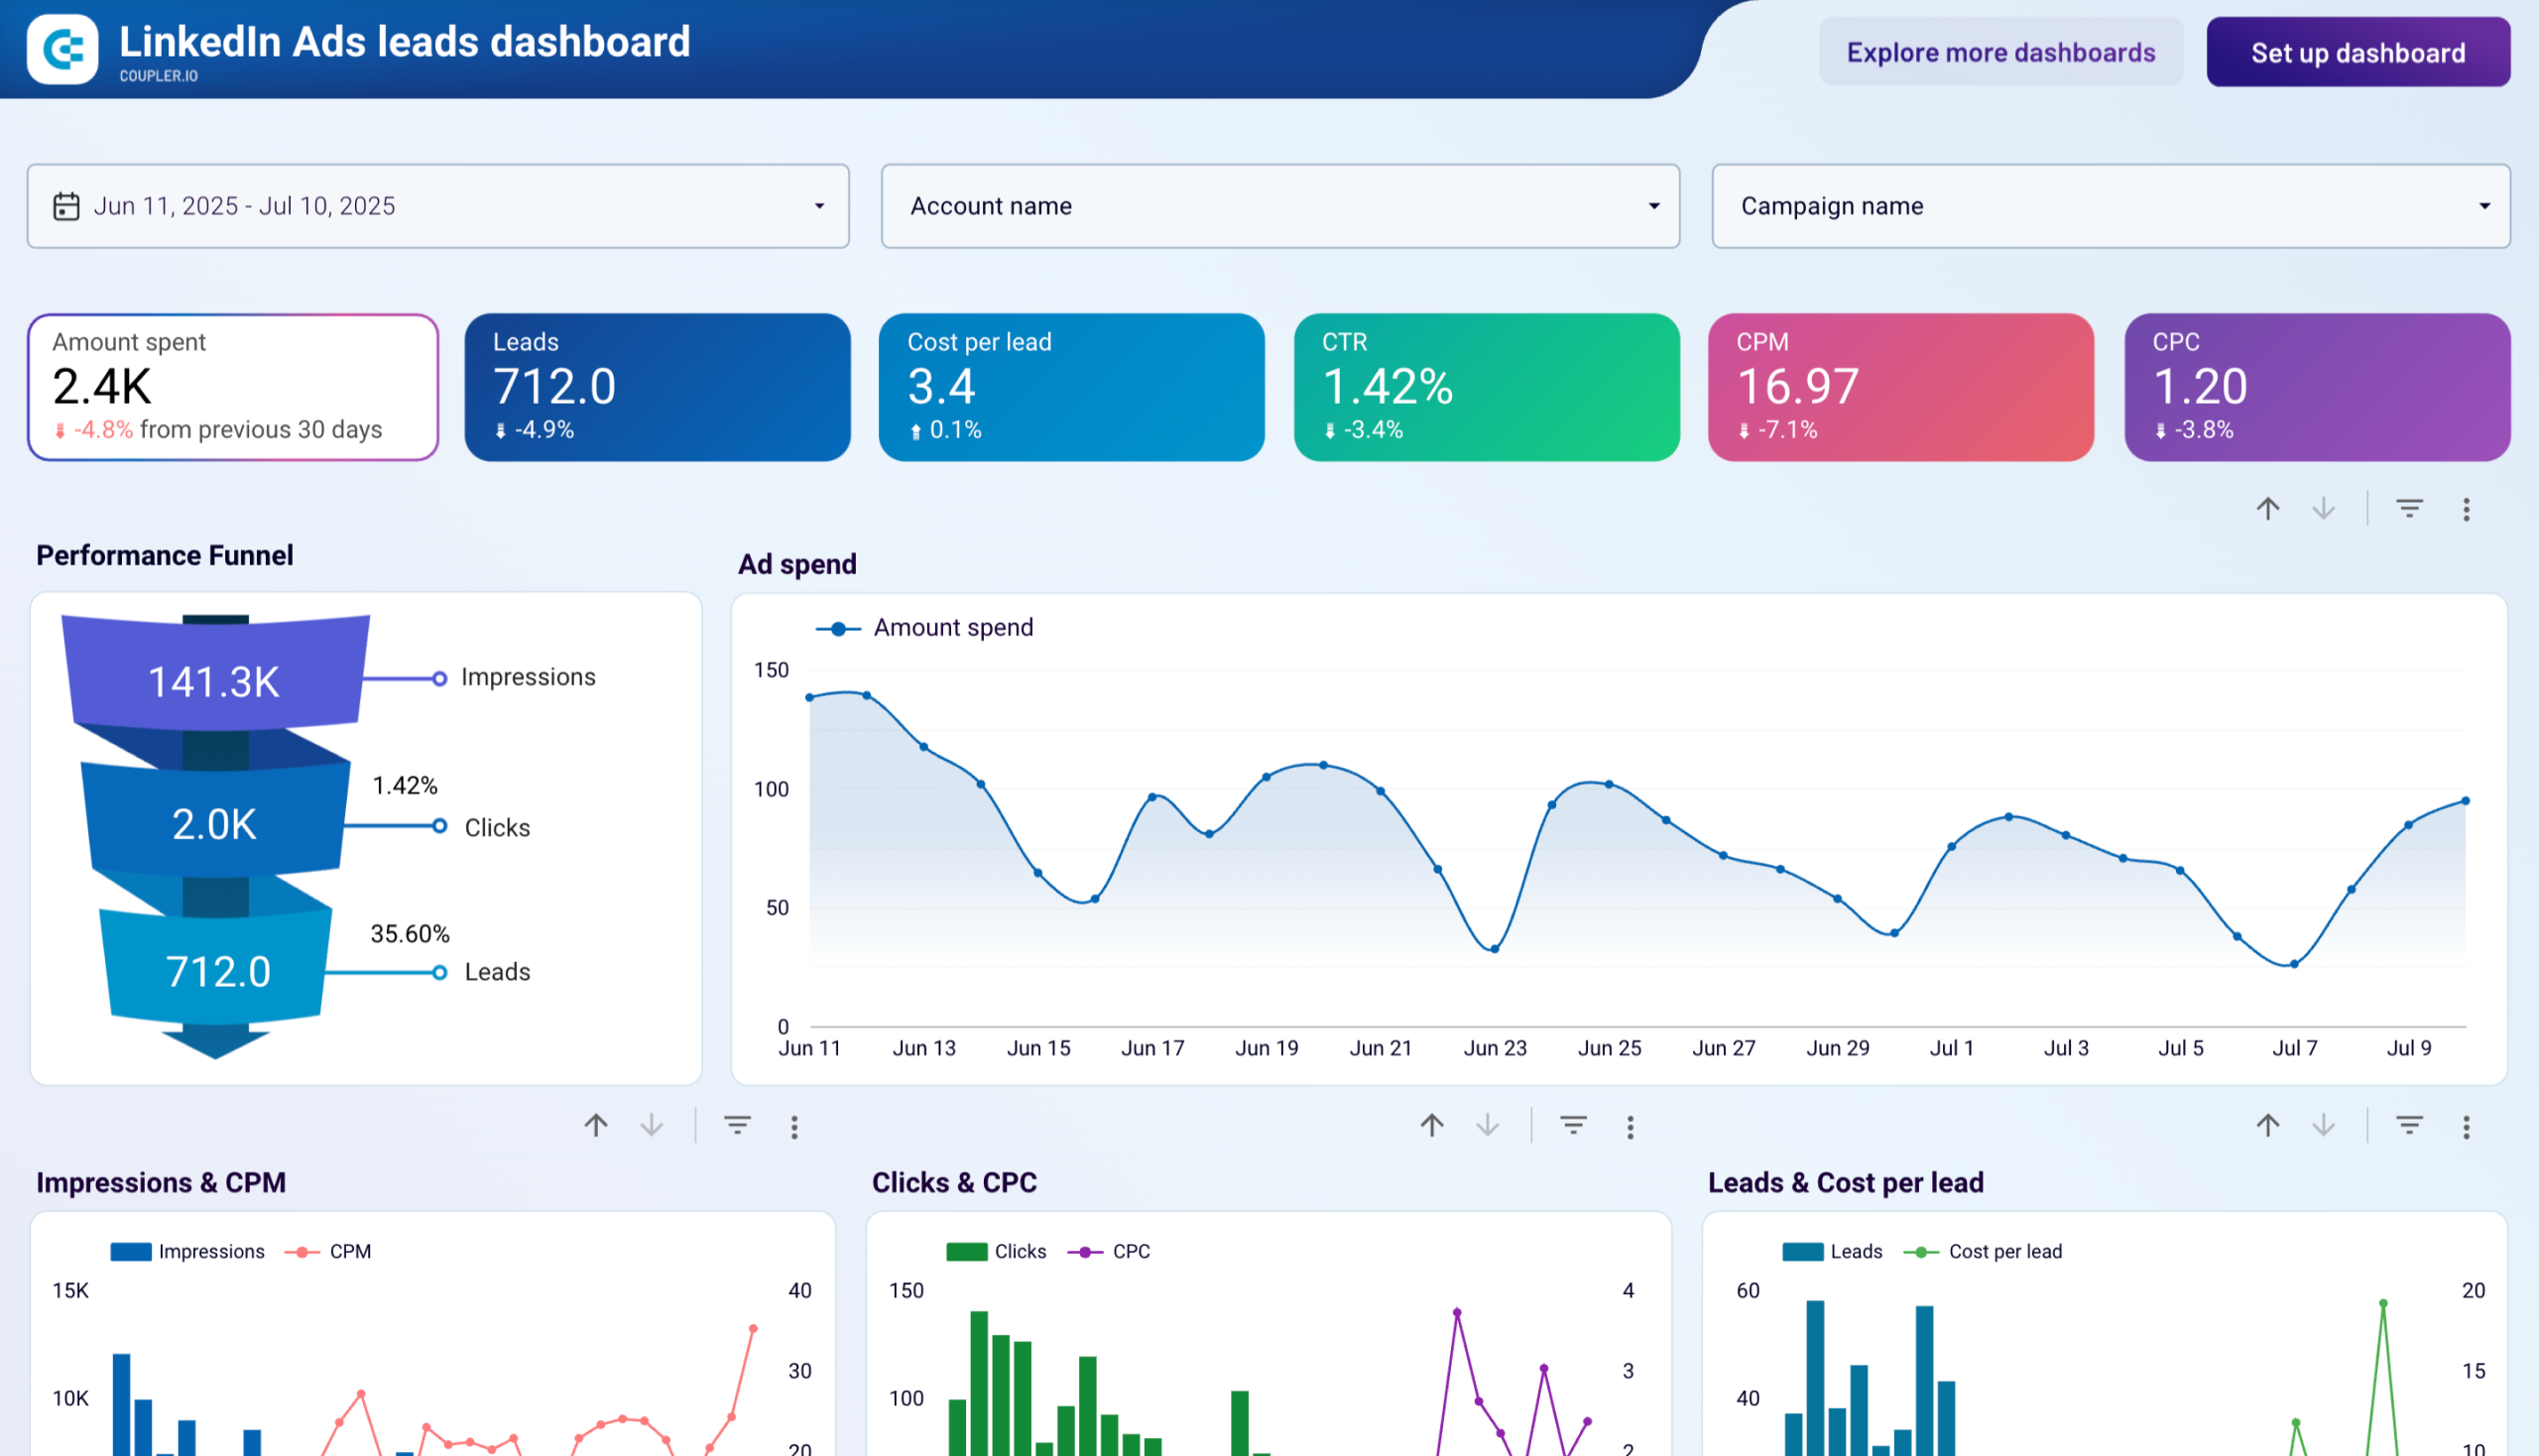
Here are the insights the dashboard can provide to you:
- Performance funnel visualization for optimization
The performance funnel clearly illustrates the conversion path from impressions to leads, showing the progression through clicks to final lead conversions. This visualization helps identify conversion bottlenecks and optimization opportunities. If you notice a high impression-to-click rate but poor click-to-lead conversion, it suggests your ad creative is compelling, but your landing page or lead form needs improvement.
- Daily spend and lead generation trends
The ad spend timeline chart tracks daily spending patterns over the campaign period to reveal budget distribution and spending consistency. This insight is helpful to identify optimal spending patterns and budget allocation strategies. If you notice lead generation spikes correlating with specific spending levels, you can adjust budget allocation to capitalize on these high-performing periods.
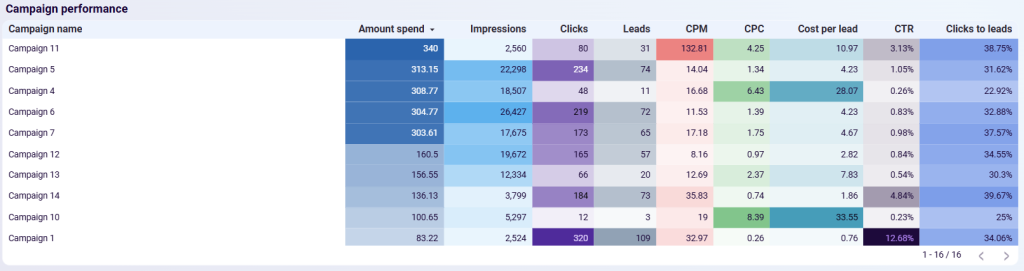
- Campaign-level performance comparison
The campaign performance table provides detailed breakdowns of each campaign’s effectiveness, including amount spent, impressions, clicks, leads generated, and conversion rates. This comprehensive view enables direct campaign comparison and helps identify top-performing initiatives.
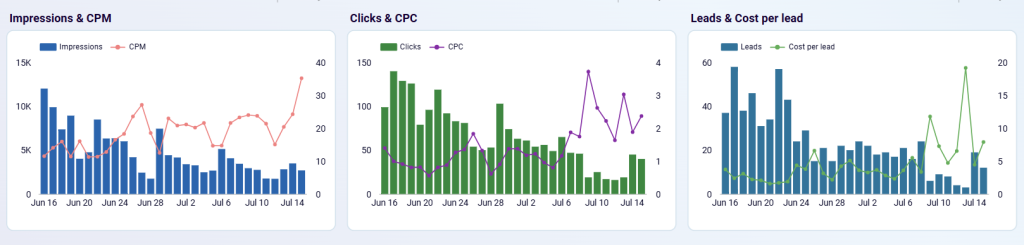
- Multi-metric trend analysis
The dashboard includes three separate trend charts tracking impressions and CPM, clicks and CPC, and leads with cost per lead over time. These visualizations help identify correlations between different metrics and optimize bidding strategies.
Dashboard metrics:
- Amount spent
- Total leads generated
- Cost per lead
- CTR (Click-through rate)
- CPM (Cost per mille)
- CPC (Cost per click)
- Impressions
- Clicks
- Lead conversion rate
- Campaign performance comparison
- Daily spend patterns
This specialized leads dashboard is built in Looker Studio and powered by Coupler.io. Try it right away and optimize your LinkedIn lead generation campaigns effectively.
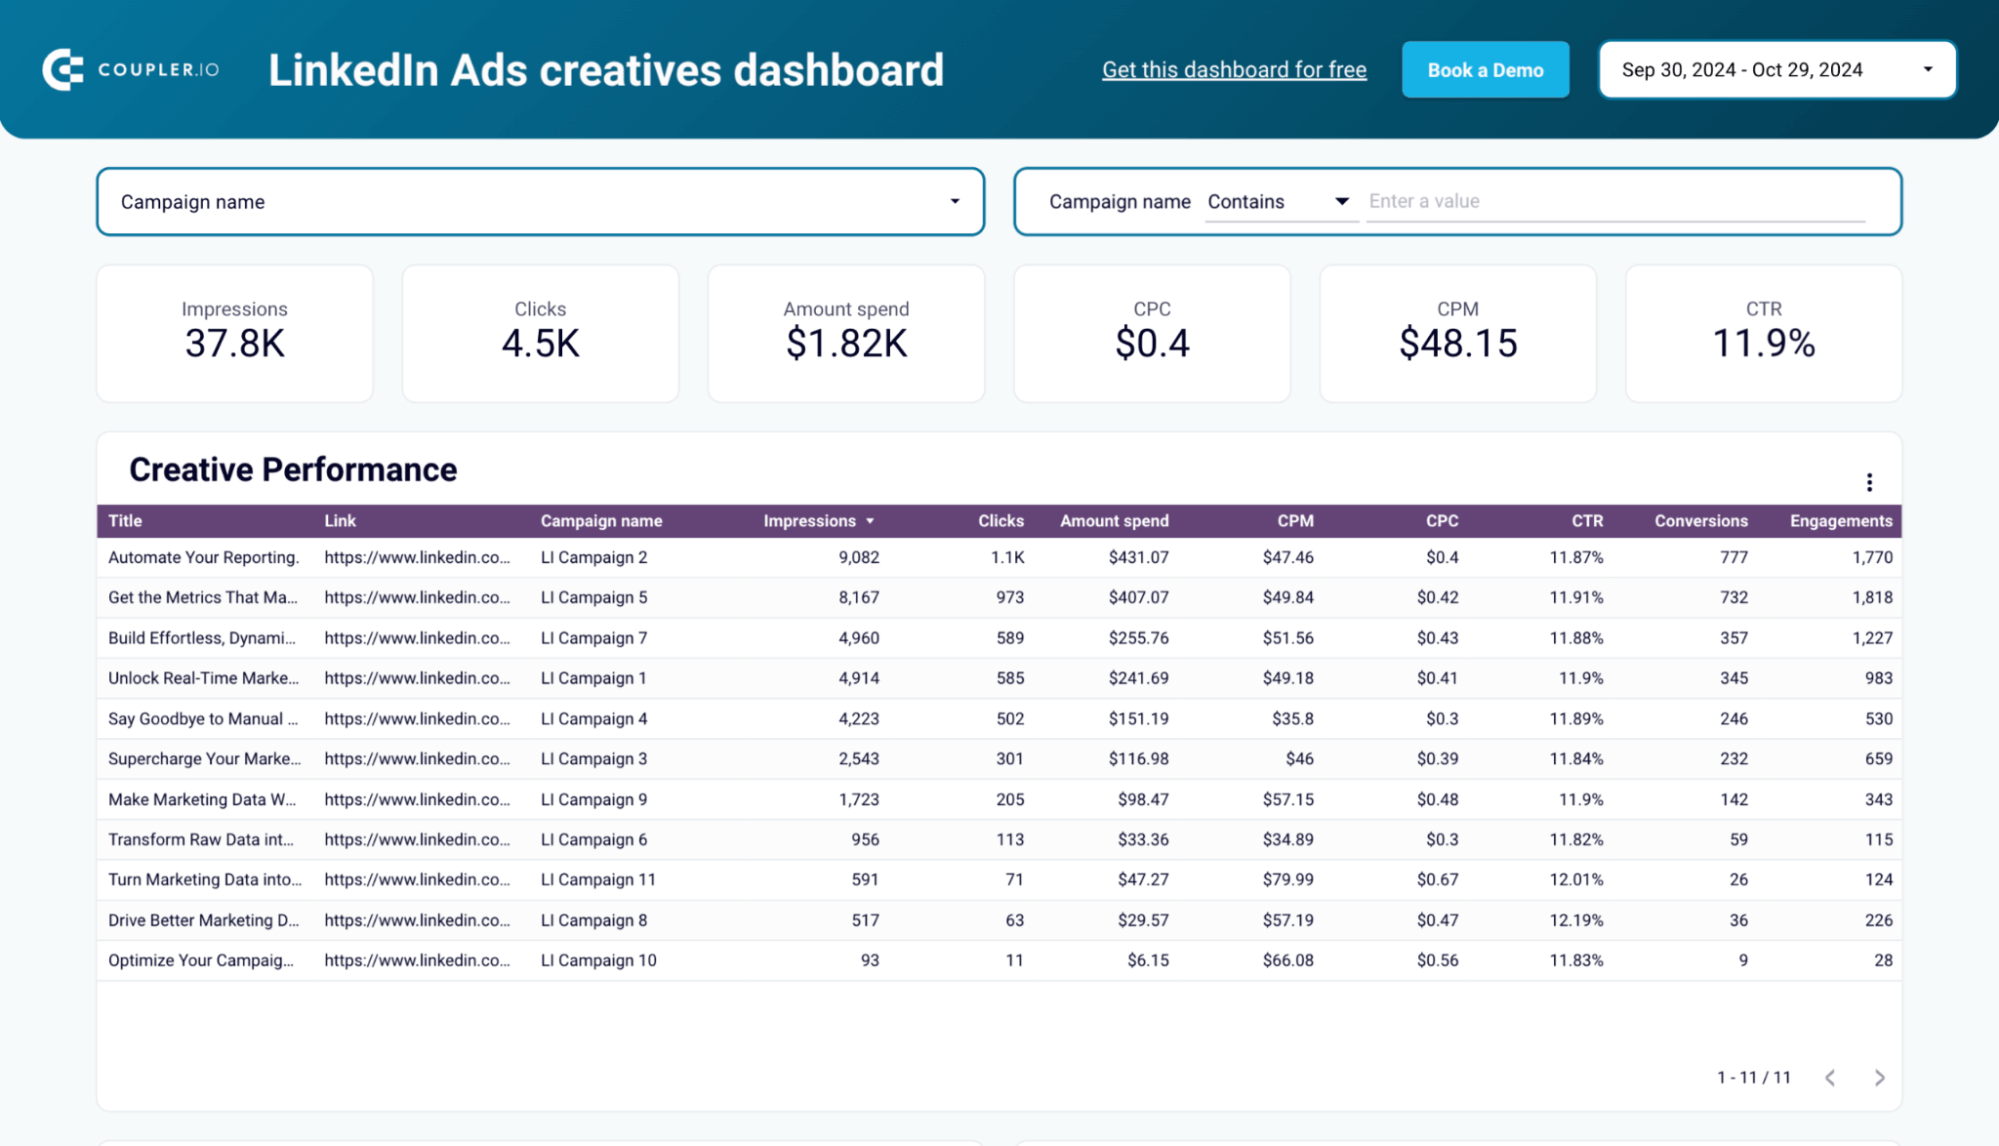
4. LinkedIn Ads creatives dashboard
This dashboard provides a comprehensive view of your LinkedIn ad creatives’ performance. It tracks metrics like impressions, clicks, CPC, CPM, CTR, and engagements to identify top-performing creatives. You can make data-driven decisions to maximize ROAS.
LinkedIn Ads creatives dashboard
 Preview dashboard
LinkedIn Ads creatives dashboard
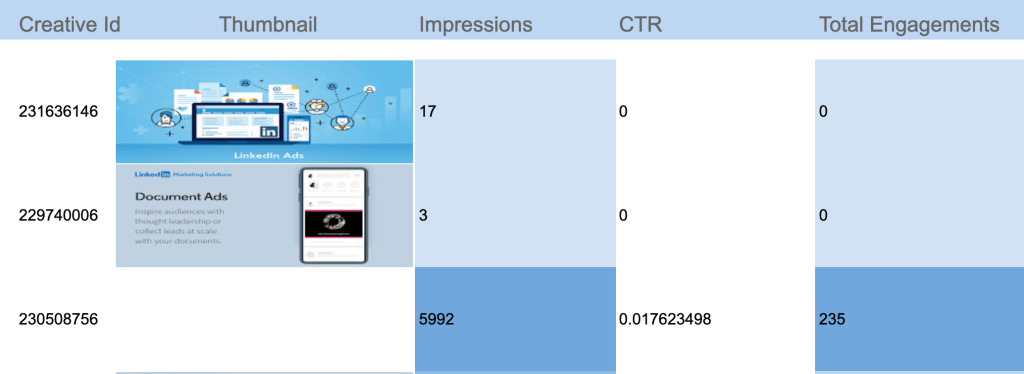
Preview dashboard- Creative Performance table
It displays detailed metrics for each creative like clicks, spend, conversions, and engagements, all in one place. You can sort them based on impressions to see the best-performing creatives.
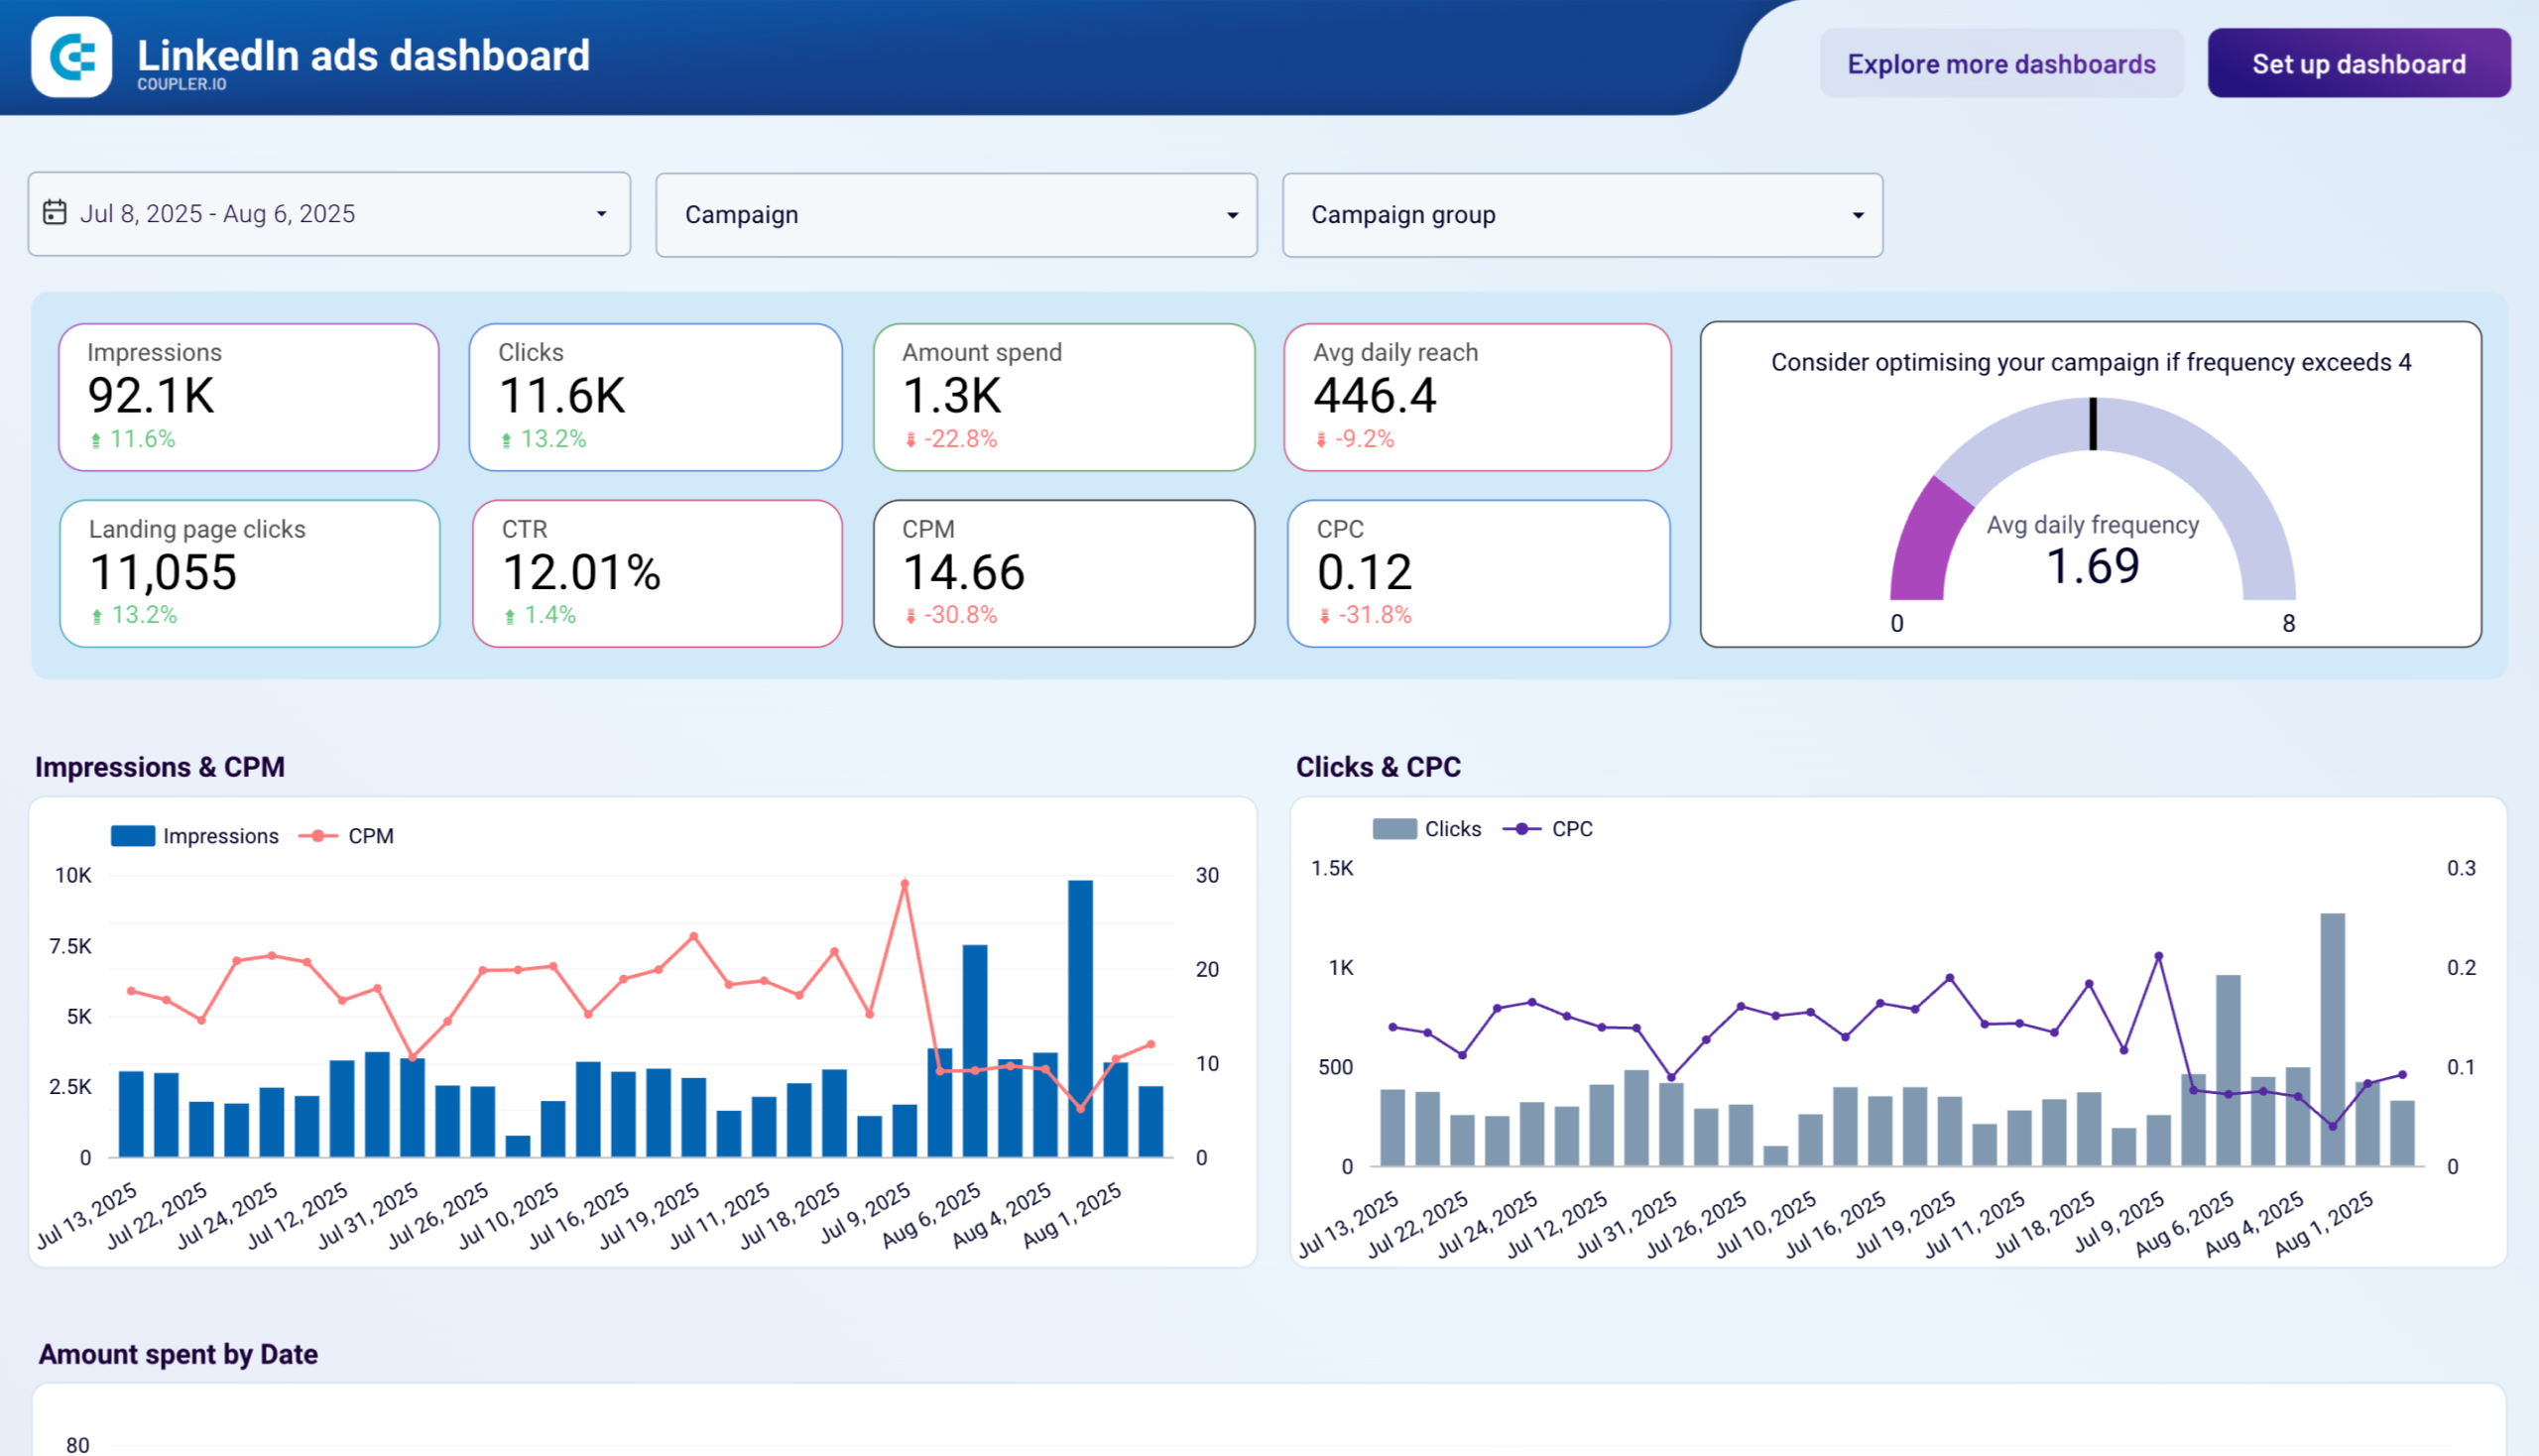
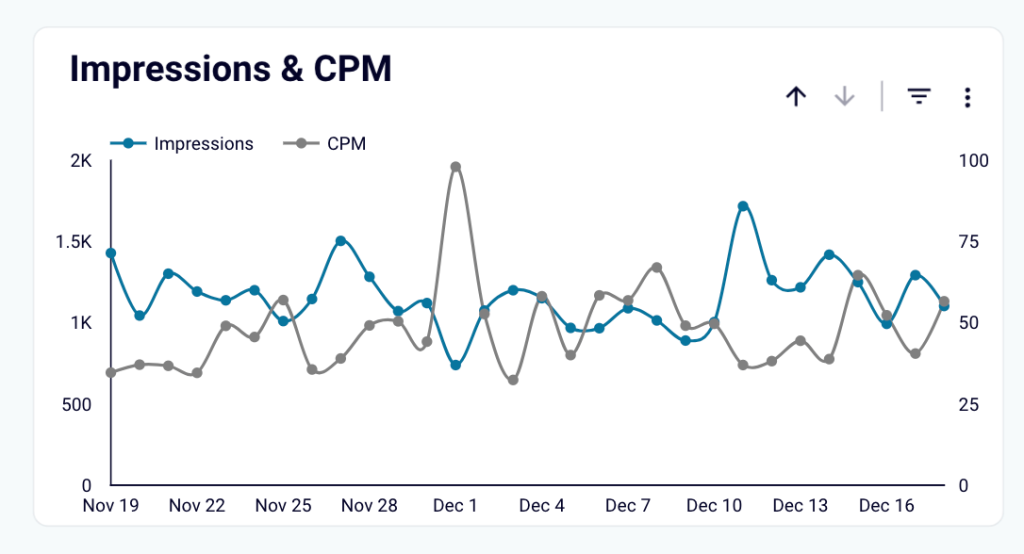
- Impressions & CPM Chart
The line chart compares impressions to CPM and helps you assess campaign reach and cost efficiency over time.
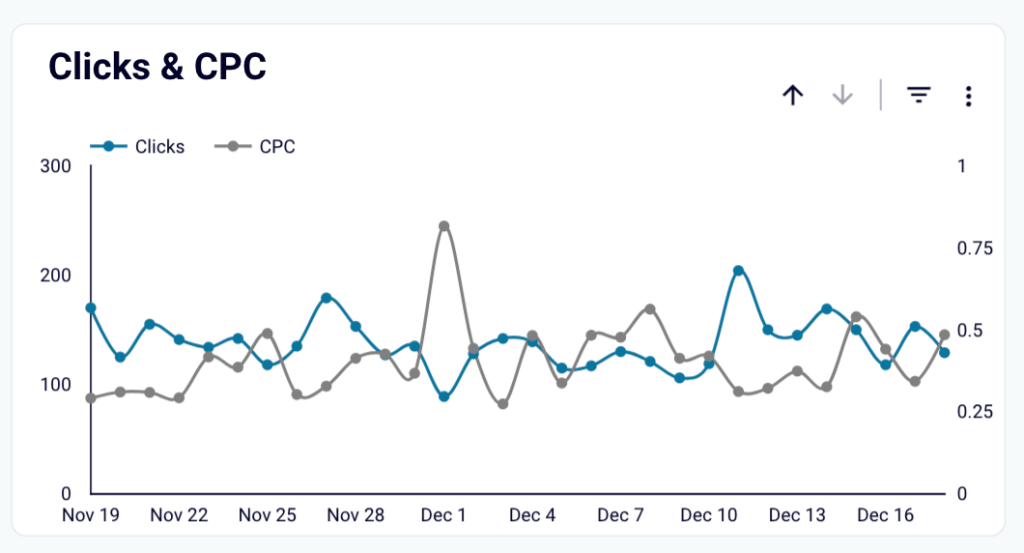
- Clicks & CPC chart
This visualization tracks clicks and cost-per-click (CPC) over time. It enables users to spot unusual spikes or dips in performance and adjust bids as needed.
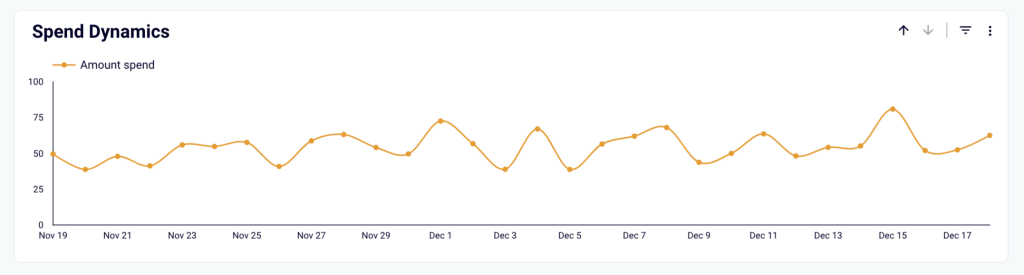
- Spend dynamics
This chart visualizes ad spend trends over time, allowing better control of campaign budgets. It highlights daily fluctuations and makes it easy to align your spending with advertising strategy.
Dashboard metrics:
- Impressions
- Clicks
- Amount spent
- CPM
- CPC
- CTR
- Conversions
- Engagements
The LinkedIn Ads creatives dashboard is built in Looker Studio and powered by Coupler.io. This template comes with a data connector that can update data automatically on a schedule. You can set it up with your data in just a few minutes by following the instructions in the Readme tab.
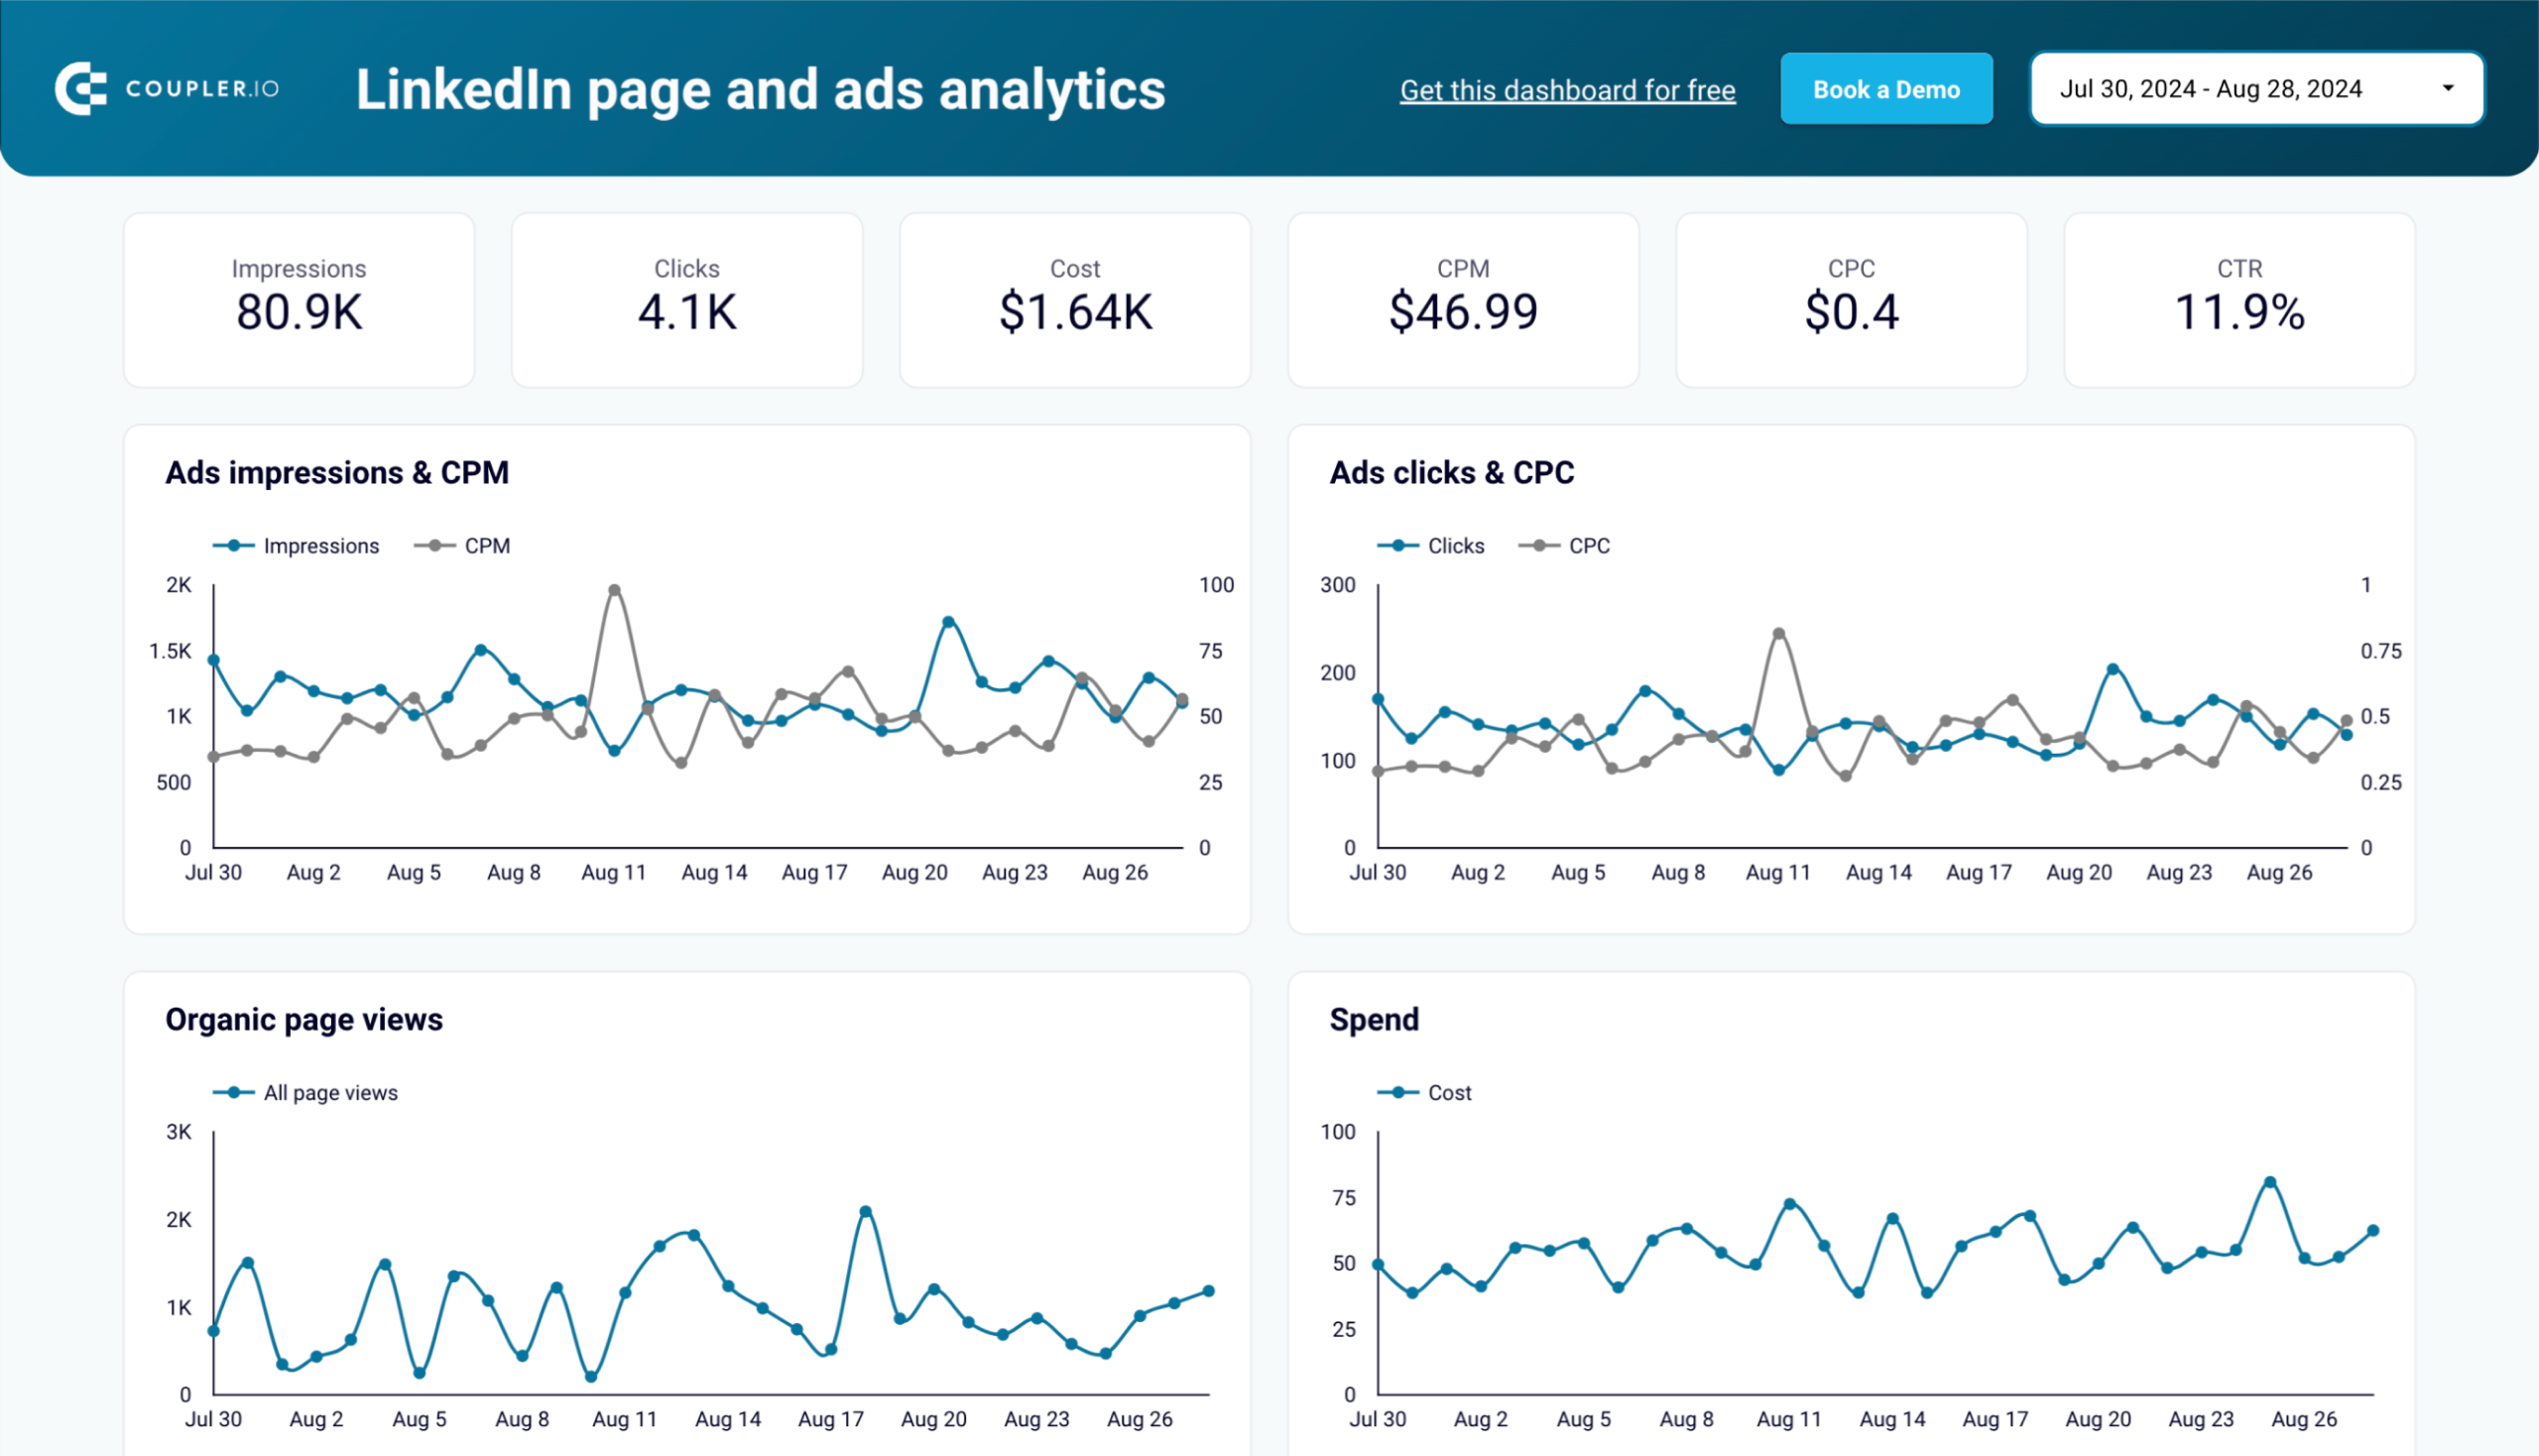
5. LinkedIn page and ads analytics dashboard
This dashboard merges data from LinkedIn Ads and LinkedIn Company Pages, giving a unified view of both organic and paid performance. It enables users to track audience behavior, measure content impact, and refine LinkedIn marketing strategies.
LinkedIn page and ads analytics dashboard
 Preview dashboard
LinkedIn page and ads analytics dashboard
Preview dashboardMetrics comparison charts
The Ads Impressions & CPM chart tracks changes in impressions and cost per thousand impressions (CPM) over time, to get an overview of ad visibility and cost efficiency. The Ads Clicks & CPC chart highlights fluctuations in clicks and cost-per-click (CPC), to compare audience engagement and click costs.
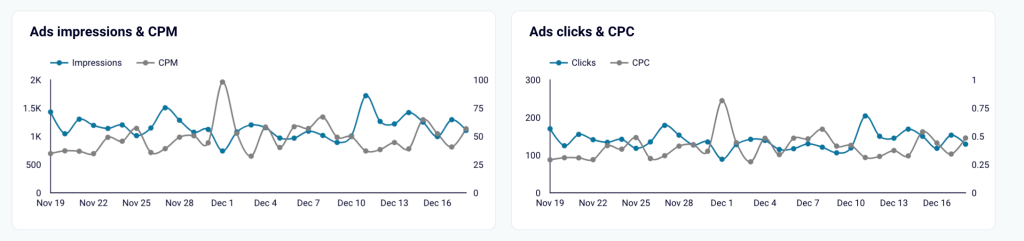
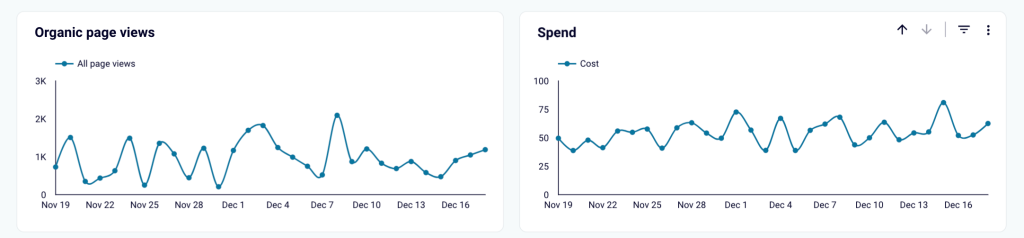
- Organic Page Views & Spend chart
These line charts chart visualize page views for your company’s organic content over time and track daily fluctuations in ad spending. With this, you can manage your budget better and get insights into organic reach trends.
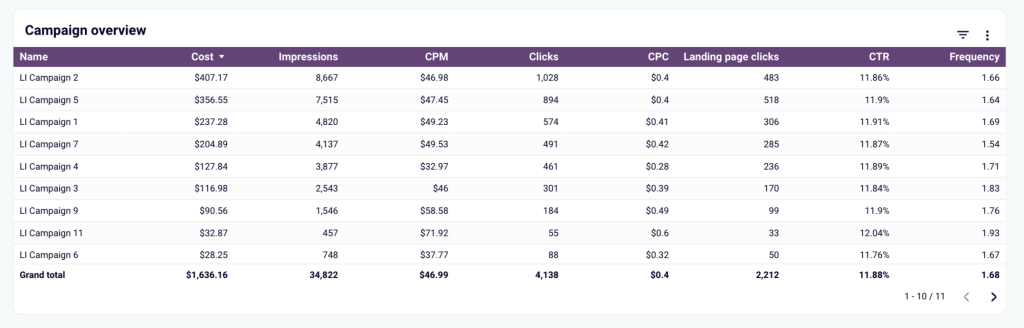
- Campaign Overview table
It gives a comprehensive summary of campaign-level metrics—impressions, clicks, CPM, CPC, CTR, and frequency. This view allows you to compare multiple campaigns side-by-side for better decision-making.
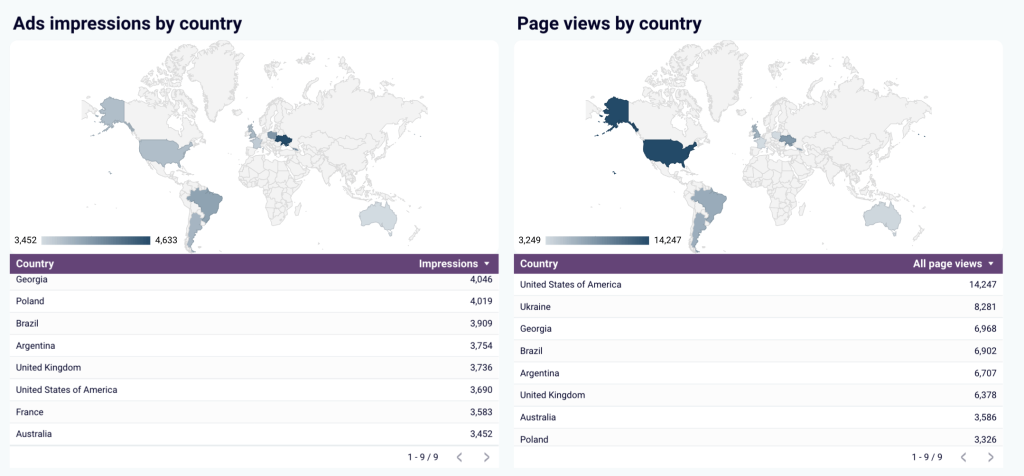
- Impressions & Page Views by Country
These maps present geographical engagement data, showing where your ads and page views are most concentrated. With this insight, you can identify high-impact regions and fine-tune your targeting strategy.
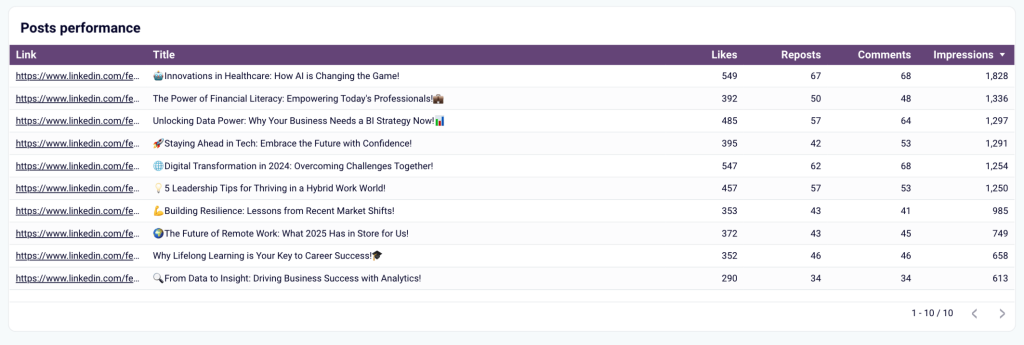
- Post Performance table
This table analyzes post-level performance by showing impressions, likes, reposts, and comments for each post. It allows you to identify which types of posts drive the most engagement and inform future content strategy.
Dashboard metrics:
- Impressions
- Clicks
- Cost
- CPM
- CPC
- CTR
- Frequency
- Page views
- Likes
- Comments
- Reposts
This dashboard is built in Looker Studio and powered by Coupler.io. Your LinkedIn data can be automatically loaded into the dashboard template by following the instructions in the Readme tab.
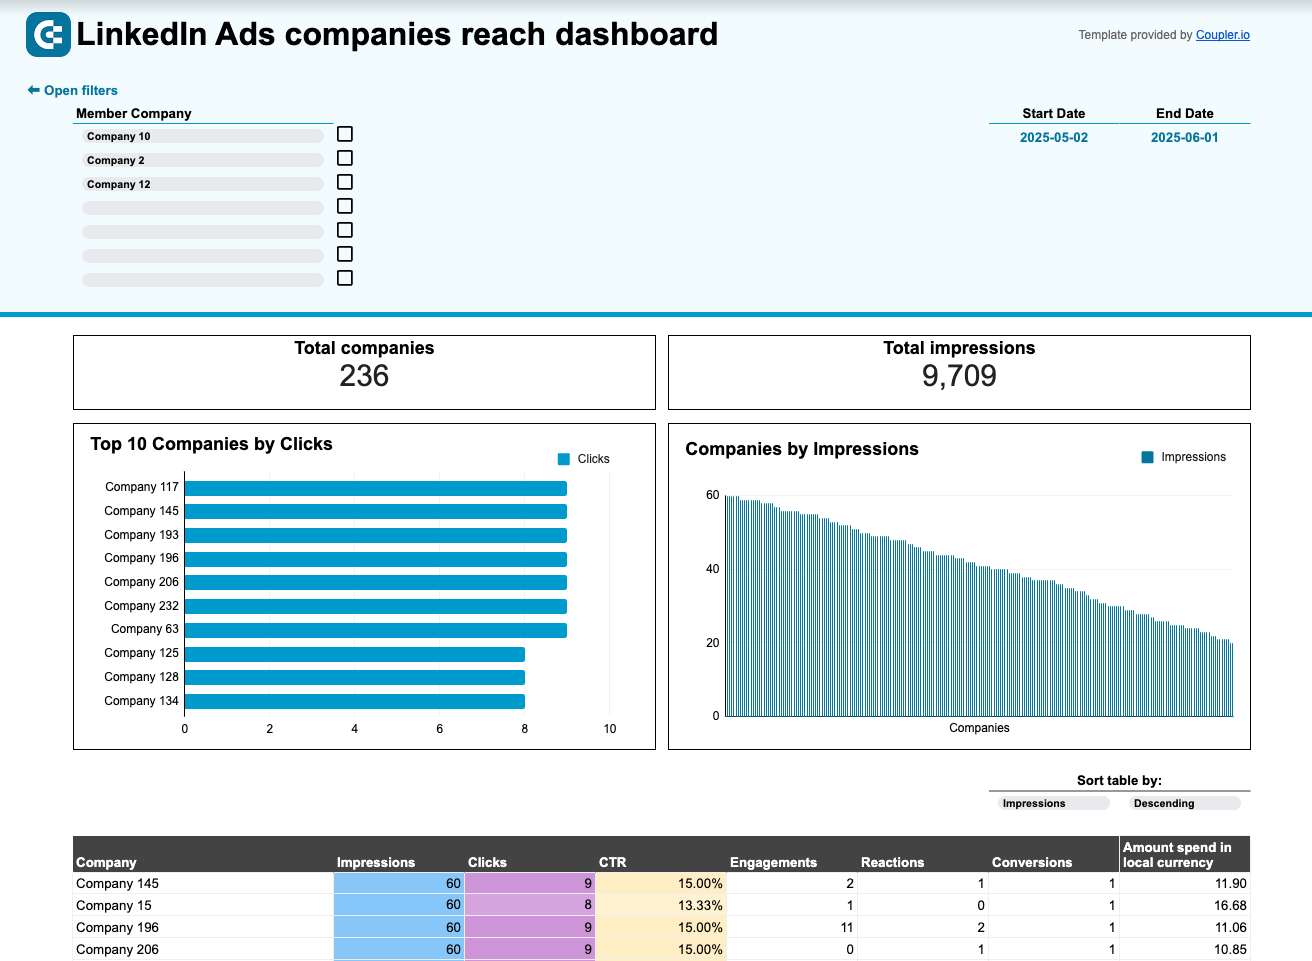
6. LinkedIn Ads companies reach dashboard
This dashboard provides a detailed view of all the companies that saw your LinkedIn Ads. While LinkedIn’s native reports only display the first 50 companies, the LinkedIn ads companies reach dashboard removes that limitation by pulling data directly from LinkedIn’s API. It helps marketers understand which companies engage with their ads and how they interact with them.
LinkedIn Ads companies reach dashboard in Google Sheets
 Preview dashboard
LinkedIn Ads companies reach dashboard in Google Sheets
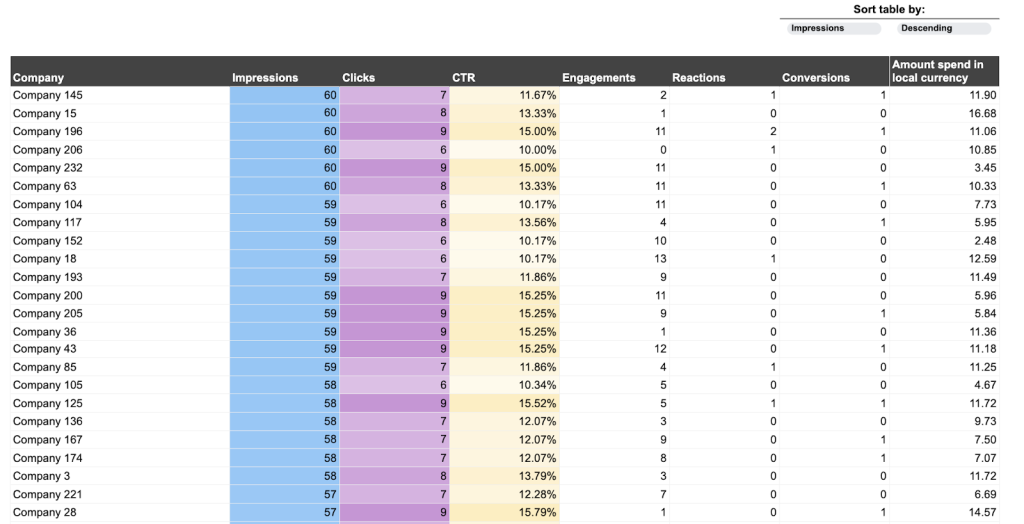
Preview dashboardCompany reach table
A complete list of companies that have seen your ads, along with impressions, clicks, CTR, engagements, and conversions. You can sort and filter this data to find the most engaged companies.
This performance table also allows you to compare click-through rate (CTR), engagement, and conversions against the amount spent on ads for each company. This ensures smarter budget allocation.
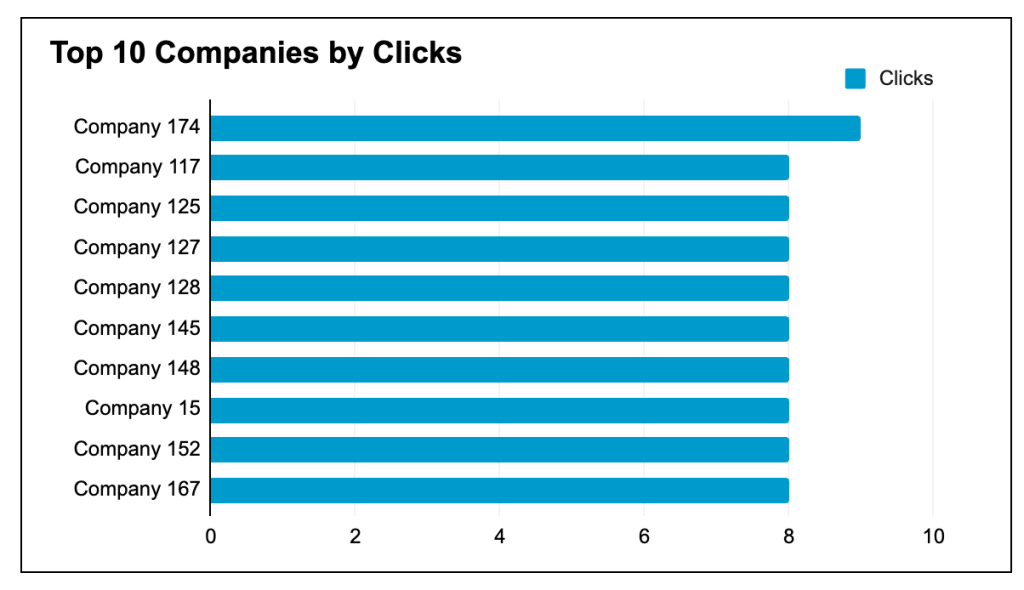
Top 10 companies by clicks
This visualization ranks the companies that clicked on your ads the most, helping you focus on high-interest prospects.
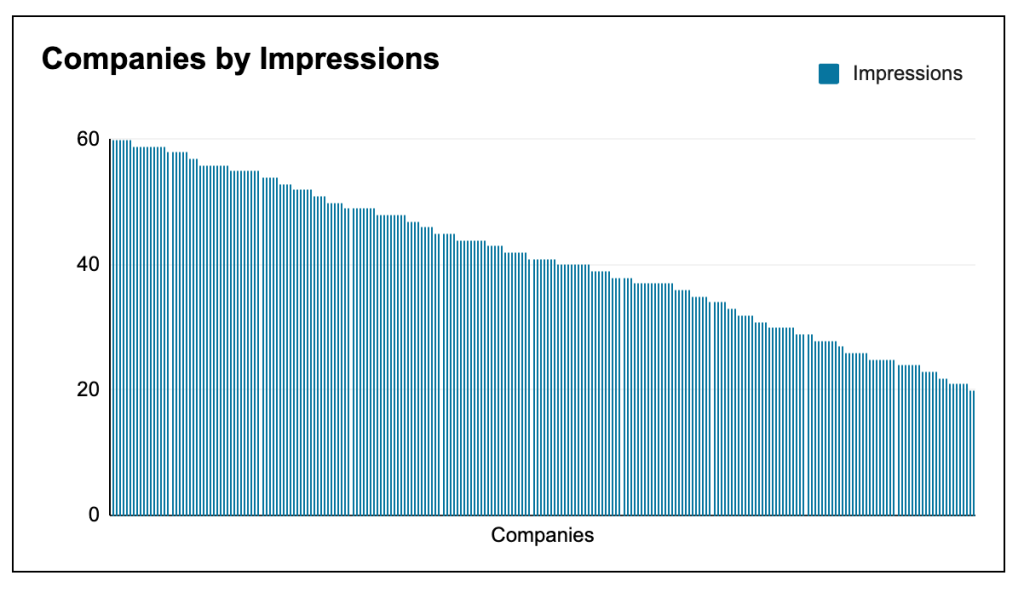
Impressions distribution chart
A breakdown of how many times different companies saw your ads. This helps identify companies that view ads frequently but don’t engage, signaling the need for adjustments in ad messaging.
Dashboard metrics:
- Total Companies Reached
- Total Impressions
- Clicks
- CTR (Click-Through Rate)
- Engagements
- Conversions
- Ad Spend per Company
This dashboard is powered by Coupler.io and is available in Google Sheets. To use this template with your data, follow the instructions in the Readme tab.
7. Budget tracking template for LinkedIn Ads
Apart from keeping track of the key PPC metrics, it’s also important to maintain control of the financial side of your LinkedIn Ads campaigns. This can be especially tricky if you run several projects for different clients in parallel.
Budget tracking template for LinkedIn Ads in Google Sheets
Budget tracking template for LinkedIn Ads in Google Sheets
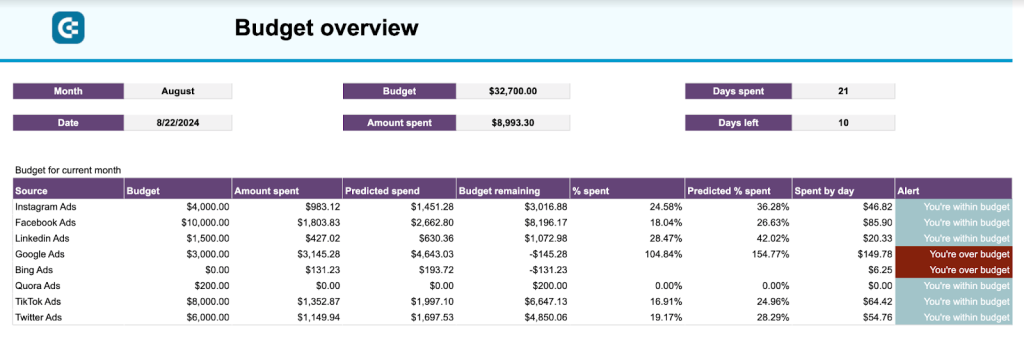
Preview dashboardThis budget tracking template for LinkedIn Ads helps you stay within the planned budget and even alerts you if the allocated amount is being used up too fast.
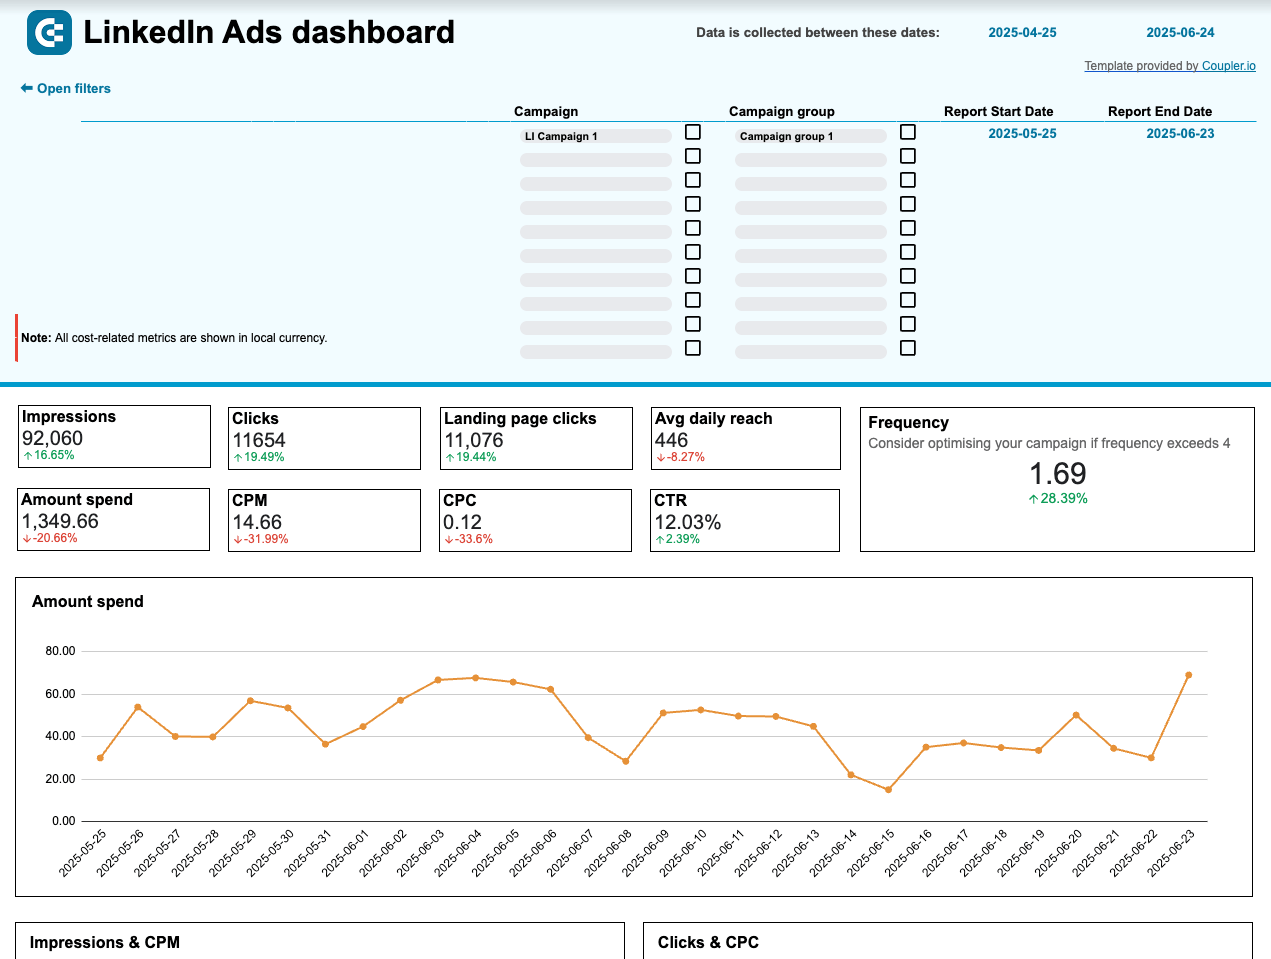
- Spend dynamics over the year
The dashboard displays your actual ad spend compared to the planned budget over the year, allowing you to easily see when you’ve exceeded or fallen below the planned budget. In addition, the template includes a separate chart for tracking average daily spend. All this allows you to more effectively manage your LinkedIn Ads budget.
- Alerts on overspending
Once you specify the amount you are planning to allocate for the current month, the template will automatically calculate projections for the future based on your usage pace. It will show you an alert message when you approach the limit or if the planned sum is being spent too quickly. This gives you more control and helps you prevent overspending.
- Cross-channel connectivity
This dashboard stands out from other LinkedIn Ads reporting templates on our list due to its multi-platform integrability. The template can be connected to 7 other PPC platforms, allowing for cross-channel analysis and optimization. This includes Facebook Ads, Google Ads, TikTok Ads, and other ad and social media platforms. For example, this enables you to find out which platform yields the best results for a specific campaign. If this is not needed, you can use this template for LinkedIn Ads only.
Dashboard metrics:
- Total budget
- Total spend
- Predicted spend
- Avg monthly budget
- Avg budget remaining
- Avg daily spend
8. LinkedIn Ads report template for different ad types
This marketing report allows you to monitorkey metrics and analyze performance from various perspectives. You can explore the overall results of your LinkedIn ads, zoom into individual campaign performance, and examine the metrics for specific creatives and posts. Apart from this, the dashboard features detailed information on user demographics. The template was developed By Two Minutes Reports and is available for free.

- KPIs and insights
The dashboard includes an overview of the main performance indicators important in digital marketing, such as impressions, clicks, conversions, cost, and reach. The distinctive feature of this report is that it covers different ad types, including sponsored content and videos.
- Performance funnel
For the general performance overview, the metrics are grouped by funnel stage, from awareness to consideration and conversion. This helps you see how each metric correlates with the others and contributes to the final result. The funnel charts are also available for sponsored content performance.
- 5 worst and best creatives and campaigns
A separate section is dedicated to individual ad creatives. It shows you the 5 best-performing and 5 worst-performing posts along with their metrics. This helps you determine what types of content are the most popular with your audience and refine your content strategy.
Additionally, there are two data tables presenting summarized information on the 5 campaigns with the best and worst CTR. However, the template doesn’t provide you with the overview of your other campaigns, which may be inconvenient. Also, there are no filters or data sorting options to analyze the campaigns by other performance indicators.
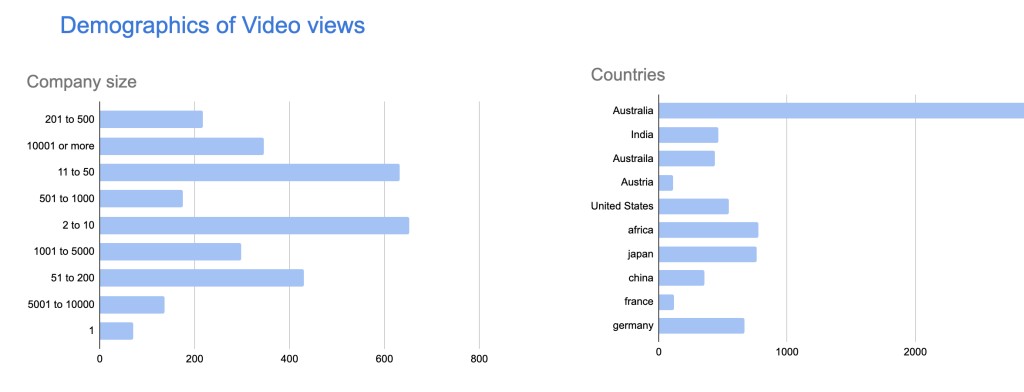
- Video demographics
The dashboard focuses heavily on demographics insights. This part closely resembles the default report in LinkedIn Campaign Manager, which is often the case with free LinkedIn Ads reporting templates. Demographic data is organized into several blocks, presenting insights for video views, impressions, clicks, conversions, and more. Each block includes information on company size, country, industry, job function, and job title.
Dashboard metrics
- Impressions
- Clicks
- Reach
- Video views
- CPC
- CTR
- Conversions
- Conversion rate
- Engagement rate
9. LinkedIn Ads report in Google Sheets
This is a simple one-page report that primarily focuses on two aspects of LinkedIn ads performance: reach and clicks. In addition, it allows you to monitor the key financial metrics. This template was created by Coefficient and is free of charge, but you will be required to provide your work email to access it.
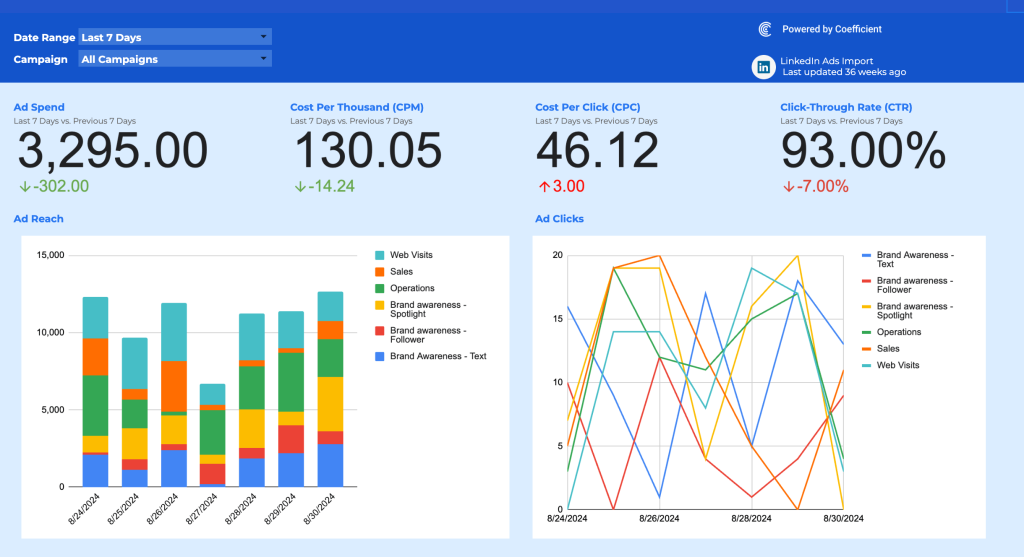
- A set of financial metrics
The dashboard helps you track financial performance of your LinkedIn Ads campaigns. It features a set of scorecards covering metrics such as Total ad spend, CPM, CPC, and CTR. You can utilize this information to monitor performance and calculate ROAS.
- Click dynamics
One of the charts included in this report displays click dynamics over time,split by campaign, with each line representing a separate campaign.
- Reach overview
The stacked bar chart, which you can see in the screenshot above, displays the daily dynamics for ad reach. Each bar demonstrates the total reach, as well as the share of each campaign in the general result.
- Filters for date and campaign
This LinkedIn Ads report template allows you to filter data by campaign and date range, so you can zoom in and estimate the impact of each individual project. However, there’s a limitation – you can select either one or all campaigns, so it’s not possible to compare the performance of two campaigns, for example.
Dashboard metrics
- Ad spend
- CPM
- CPC
- CTR
- Clicks
- Reach
10. LinkedIn ad campaign analysis report
This dashboard is designed primarily for campaign analysis. It can also be used to monitor performance and make adjustments to your strategy on the go. This dashboard was created by Smartsheet for Excel and Google Sheets, and is available for free download.
To use this template, you will need to make a copy in spreadsheets and fill out the table with campaign data at the bottom of the report.
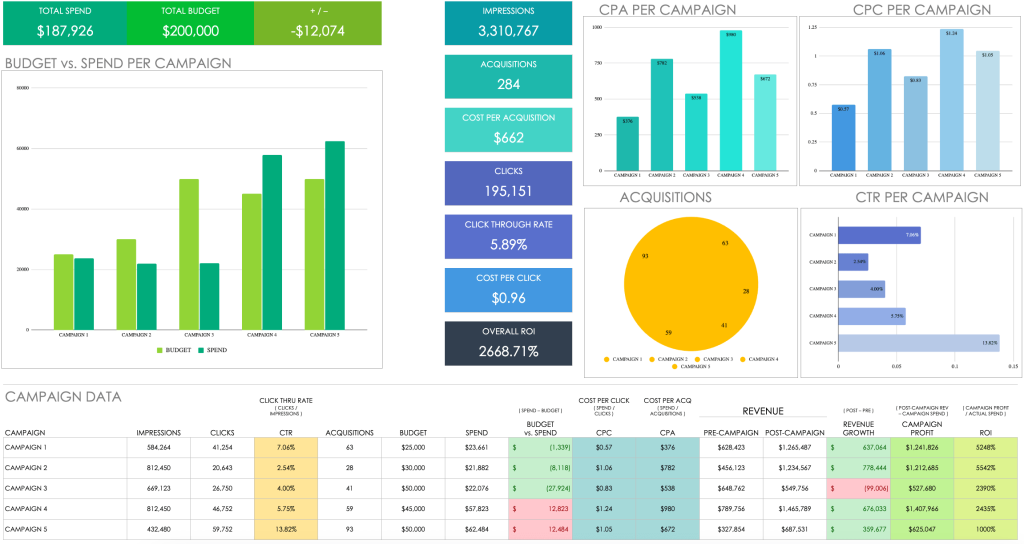
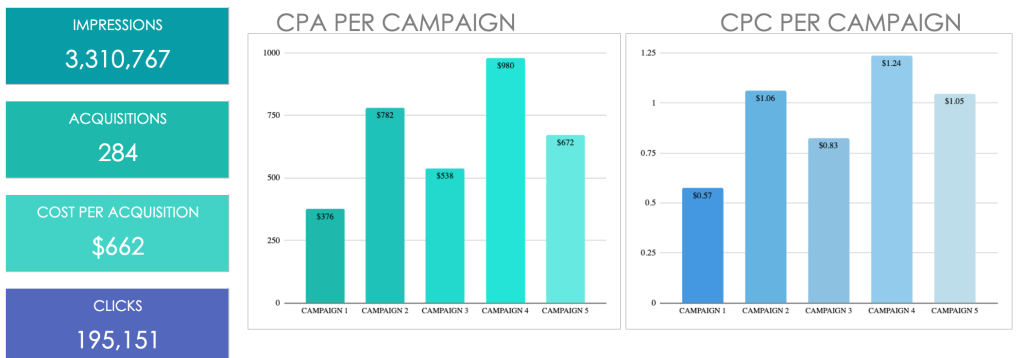
- Key metrics grouped by campaign
As is typical for most LinkedIn Ads report templates, the dashboard features scorecards with the main KPIs. There are also several charts, which present data grouped by campaign. This lets you understand which campaigns bring in more customers at lower costs.
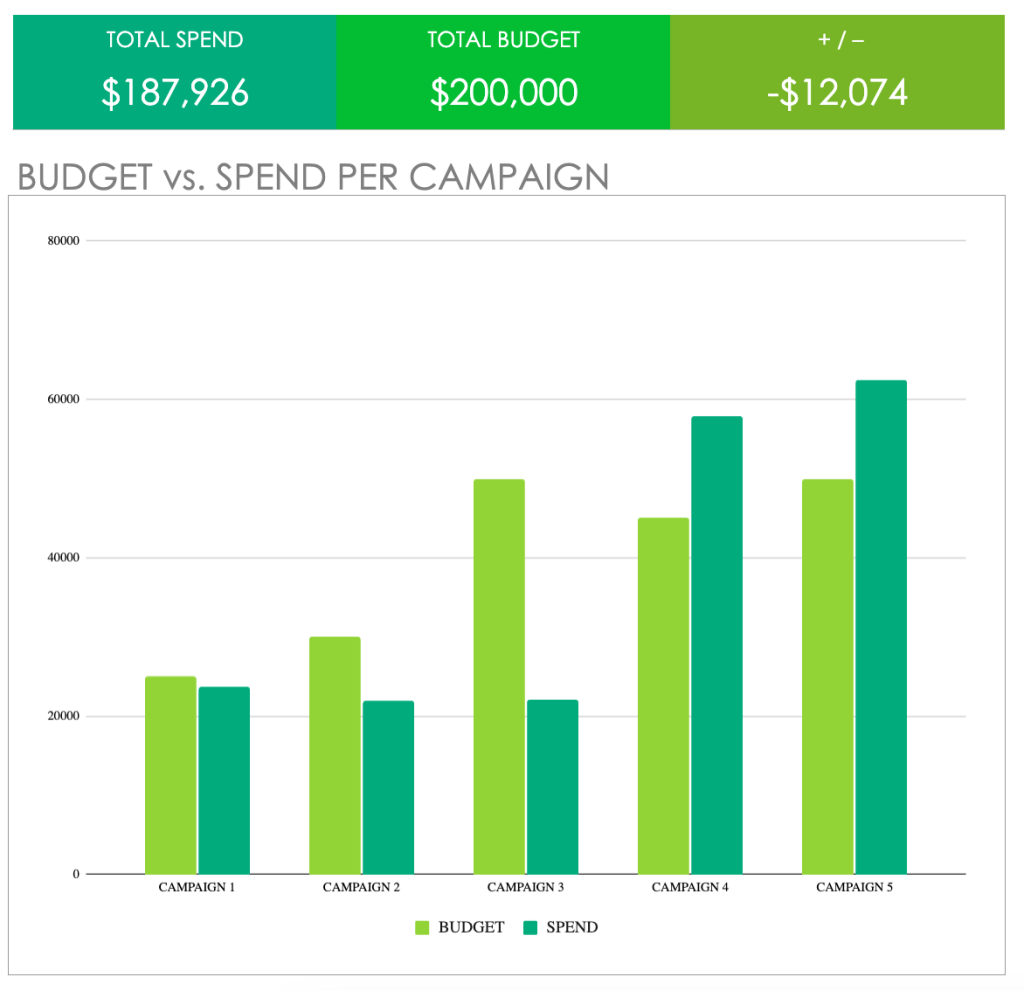
- Budget and ad spend chart
To further analyze the financial aspect of campaign performance, you can use a bar graph summarizing the information on the ad budget. It displays the allocation for each campaign and the proportion of the budget spent.
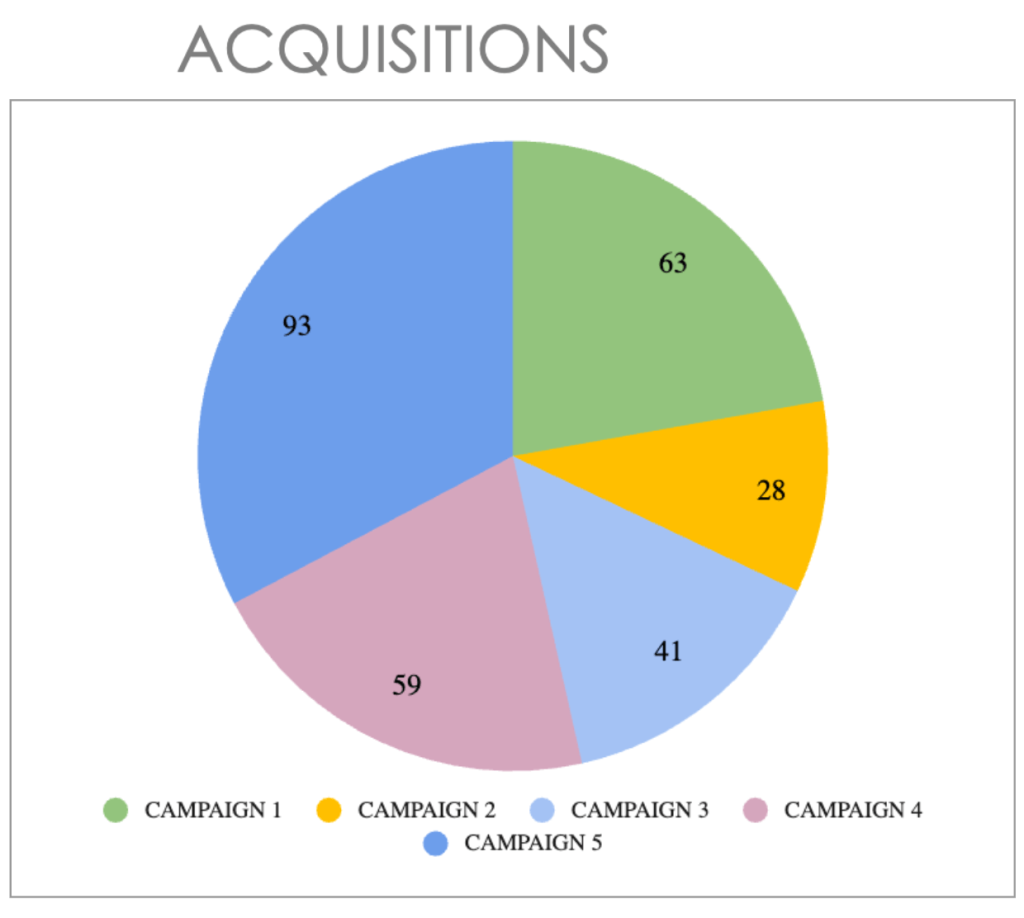
- Acquisition by campaign
The dashboard enables you to monitor how many new customers you have acquired from your LinkedIn ads. This information is split by campaign, which helps you identify the best-performing campaigns. You can analyze the factors behind their success and use your findings to enhance the results of other campaigns.
Dashboard metrics
- Impressions
- Clicks
- Acquisitions
- CPA (cost per acquisition)
- CPC (cost per click)
- CTR (click-through rate)
- ROI (return on investment)
- Total spend
- Total budget
How to build a dashboard using LinkedIn Ads report templates
The setup process will vary depending on the template you choose and the data visualization application used. In some cases, you will be required to manually fill out a data table, and the provided information will be visualized automatically. Other times, you may need to load raw data to a separate sheet or plug your LinkedIn Ads account directly into the template.
Let’s see how to build a live LinkedIn Ads dashboard using the first template on our list.
Step 1. Export your LinkedIn Ads data
- Open the LinkedIn Ads performance template and navigate to its Readme tab.
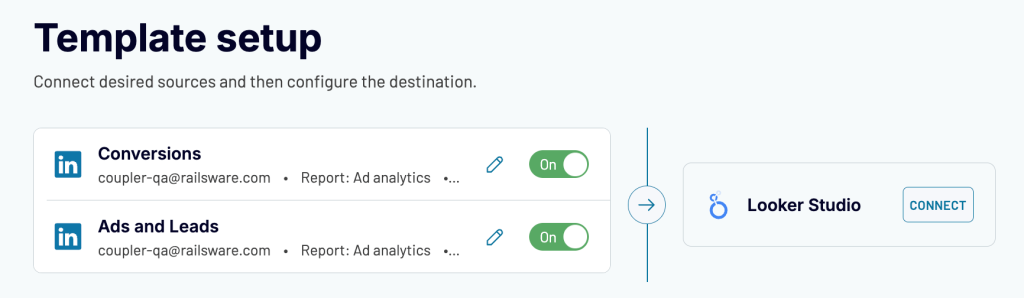
- Follow the instructions to install the Coupler.io connector in Looker Studio and authorize it. You will also need to create a Coupler.io account to use the platform – it’s free, and no card details are required.
- Connect your LinkedIn account to extract data from, and then proceed to plug in your Looker Studio account.
Step 2. Load your data into Looker Studio
- Follow the wizard’s prompts to create a data source in Looker Studio and authorize it. Then, click Connect.
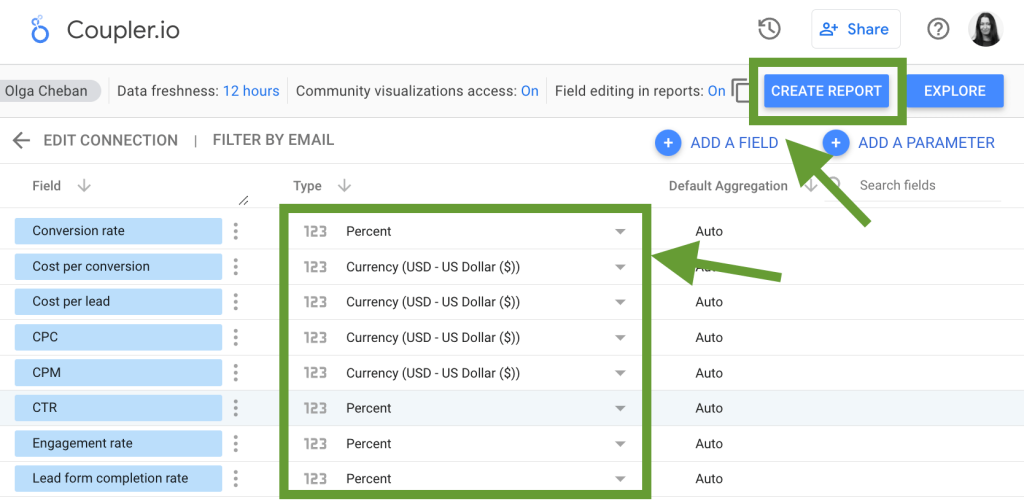
- Review the data fields for your report and set data types as follows:
- For Cost per Lead, Cost per conversion, CPC, and CPM, select Currency ? USD-US Dollar
- For CTR, Conversion rate, Engagement rate, Lead form open rate, and Lead form completion rate select Numeric ? Percent
- Once this is ready, press Create report.
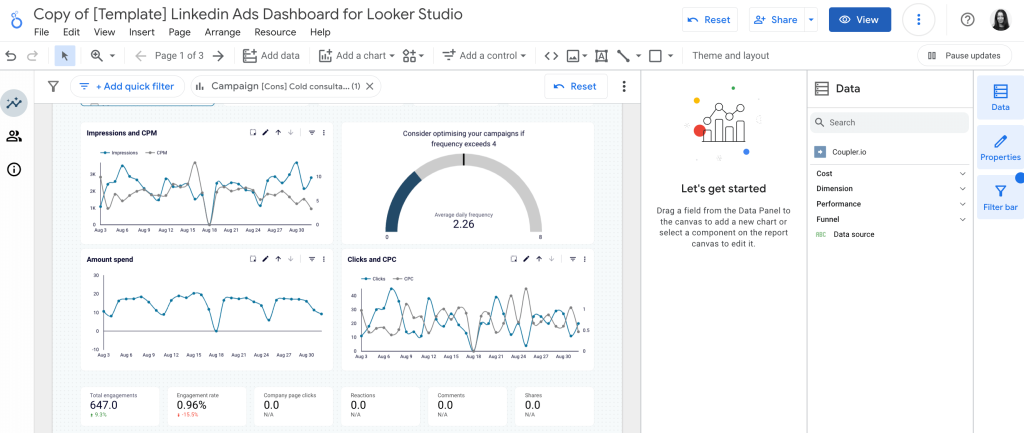
- You will get a copy of this dashboard populated with your LinkedIn Ads data. Now, you can use Looker Studio’s functionality to customize it. For example, change colors, add your logo, include more graphs, and so on.
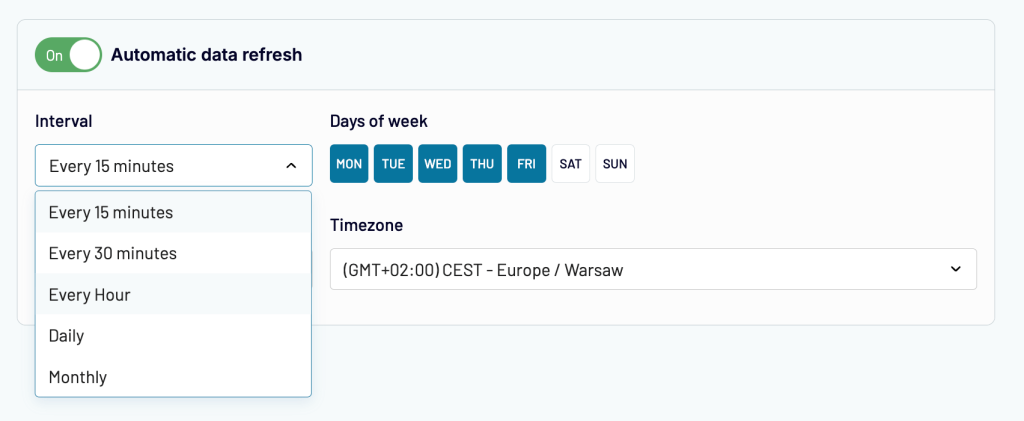
Step 3. Schedule updates
- The default setting for data refreshing in this LinkedIn Ads reporting template is every 12 hours. If you need more frequent updates, you can return to your Coupler.io importer and establish a custom schedule. With Coupler.io, you can pull fresh data from your LinkedIn Ads account and send it to Looker Studio as frequently as every 15 minutes, allowing for near real-time monitoring and analysis
- To see the latest metrics in your dashboard, click the three dots in the upper right corner and select Refresh data.
That’s it! As you can see, this dashboard template allows you to automate data collection and access fresh analysis-ready data within minutes. Now you can start analyzing your LinkedIn Ads data to boost the efficiency of your campaigns.
Speed up LinkedIn Ads reporting with templates
Converting marketing data into easy-to-understand insights and action points can be challenging. However, with the appropriate reporting tool, automated integrations, and useful templates, this task can become easier. These resources enable you to automate data collection, visualize metrics, and generate an insightful analytics report in minutes.
We hope the LinkedIn Ads report templates shared in this article will help you enhance your campaign efficiency and make the most of this social media marketing platform.
Automate reporting with Coupler.io
Get started for free


