Ultimate Guide to What Net Promoter Score Is and How to Calculate NPS for Your Project

Are your customers happy enough to recommend your product/service to their friends, colleagues and business partners?
This is a question that any business owner should occasionally ask themselves. After all, if consumers are not happy with the service they received, or if they simply don’t like the goods you sell, the chances of them becoming returning customers are very low. So it is certainly in your best interest to consider the views of your customers and quickly fix any holes that cause frustration.
The Net Promoter Score is meant to help you do this and give you a summary of first-hand customer experience.
Net Promoter, Net Promoter Score, and NPS are trademarks of Satmetrix Systems, Inc., Bain & Company, Inc., and Fred Reichheld.
What is Net Promoter Score?
Net Promoter Score (NPS) is a snapshot of the customer satisfaction level and their loyalty to a business. This metric can help you identify areas that need urgent attention and eventually enhance your market offering.
Back in 2003, Fred Reichheld, the creator of NPS, introduced this easy way to get a view of customer sentiment. His approach was as simple as this – companies address their customers with a single question:
How likely are you to recommend our company/services/product to a friend/colleague?
The answer is evaluated on an 11-point rating scale, ranging from 0 (not likely) to 10 (extremely likely).
In this way, Net Promoter Score provides an insight into the degree to which the respondent will recommend a product, business, or service to their colleagues, friends, or business partners. The idea is simple: if a user is satisfied with a business/service/product, they are likely to share the experience with others.
Since then, major corporations, including but not limited to Siemens, American Express, Australia Post, and Vanguard, have integrated NPS into their operation because the score motivated their teams to concentrate more on product and service enhancement.
In addition, NPS is also considered to have a direct correlation with a company’s growth. The longer a client continues to purchase from a given company, the bigger the Customer Lifetime Value is, and the greater the sum of accumulated revenue.
When should you send a Net Promoter Score survey?
Unfortunately, there is no rule of thumb to apply when creating a schedule for NPS survey emailing. The timings and frequency of it largely depends on:
- Your industry: Whether you represent an Offline Retail, Ecommerce, SaaS or consultancy services business, the customer journey and the points of contact you establish with them along it are different.
- Tracking of client interaction with your brand: Whether you are able or not to monitor their activity, and collect insights about what product they’ve reviewed on your site, how many purchases they complete per month, what their average bill value is or how actively they are using your SaaS product.
- The type of relationship you are building with your customers: Is it more conservative and business-like, mentoring, or informal?
In his article, Chad Keck, a Promoter.io founder, provides a rough NPS emailing plan for the representatives of these industries:
- SaaS business model
- Depending on your product’s level of complexity, and the accompanying process of user onboarding, Chad suggests sending the first survey 15-45 days after a person has subscribed to your software.
- Depending on whether your clients use your product on a daily basis (like automating some processes that have to run 24 hours a day), or from time to time, for the sake of completion of a one-time task, send the second survey 90-180 days after the initial one.
- After that, your ongoing survey should be regularly sent once per time frame identified in step (b) of this list until the customer cancels their subscription.
- Ecommerce and retail
- Send the first survey 15-45 days after a person has purchased your product, adding time for delivery and proper installation (if we are talking about a washing machine, or a bed that needs to be assembled).
- The second email should go out 90 days after the first survey was sent.
- An ongoing survey should be sent on a yearly basis, 365 days after the second email.
- Service business
- Send the first survey as soon as possible 5-10 days after the personal contact was completed and the service was provided.
- Since the outcome of your consultancy or any other service may take time to show real results, the second email should be sent 180 days after the first one to see whether the results of the first and second one will coincide.
How to calculate Net Promoter Score ?
To calculate Net Promoter Score calculation, you need raw data that is derived from an online survey with the typical NPS question to be rated on a scale of 0 to 10. As a result, you get responses from your customers. Their scores given to the NPS question identify the category of the customer:
- Promoter (9-10)
- Passive (7-8)
- Detractor (0-6)
Who is a promoter in NPS?
Anybody who replied with a score of 9 or 10 to the question “How likely are you to recommend this product/company to a friend or colleague?” is an NPS promoter.
Promoters are loyal customers who are likely to act as ambassadors for your brand. Reach out to them for testimonials or good reviews in exchange for discounts/credits/vouchers. You can also invite them to participate in an affiliate program that can help you discover a new sales channel and boost your revenues.
Who is a detractor in NPS?
Anybody who scored 0 to 6 is classified as an NPS detractor. Apparently they are not the biggest fans of your brand. But it’s even worse than that: not only are they unlikely to recommend you to anyone?—?they may actively discourage other people from even trying your product. However, Bill Gates, co-founder of Microsoft, once said:
Your most unhappy customers are your greatest source of learning.
Therefore, don’t be afraid to establish communication with your detractors. Reach out to them with follow-up questions, engage them into collaboration, invite them to calls, etc. While doing so, don’t forget to refer to the latest NPS survey they participated in. Your task is to collect as much information as possible to identify areas that have to be improved. At some point, you will notice that these conversations bring your business more value than measuring the NPS score itself.
Automating the follow-up process is an important aspect as well, so make sure you use software like MailerLite, MailChimp or HubSpot to set up the activity and keep it running.
In addition to getting feedback from your clients and identifying areas for improvement, you can also aim at changing customer perception and converting detractors to promoters.
And what about passives?
The passives, who answered the NPS question with a score of 7 or 8, sit right between the detractors and promoters. Technically, those customers are “passively happy” with a product or service but are not supremely committed to it, which makes them an easy target for the competitors in a given industry.
Net Promoter Score Calculation Formula
The formula for calculating Net Promoter Score is:
NPS % = ((Promoters ?—? Detractors) ÷ Respondents) x 100Promotersis the number of respondents classified as promotersDetractorsis the number of respondents classified as detractorsRespondentsis the total number of people who answered the NPS question
Net Promoter Score calculation example
Let’s review the following NPS calculation example based on a survey of 100 people.
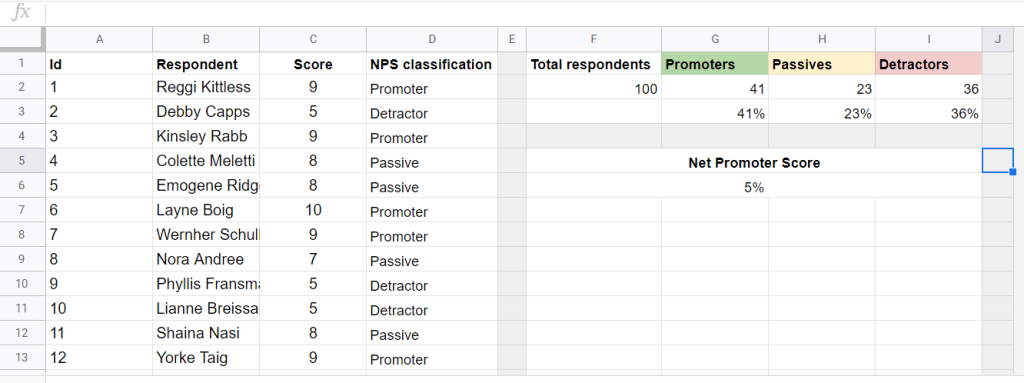
- Column A contains the id numbers of respondents
- Column B contains the respondents’ names
- Column C contains the respondents’ score they set
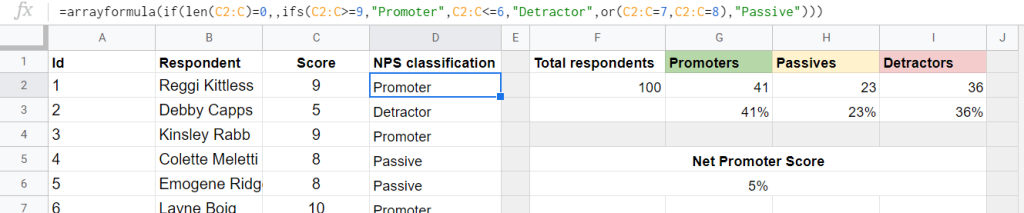
- Column D shows the respondents’ NPS classification. Here is the formula we used to do this:
=arrayformula(if(len(C2:C)=0,,ifs(C2:C>=9,"Promoter",C2:C<=6,"Detractor",or(C2:C=7,C2:C=8),"Passive")))
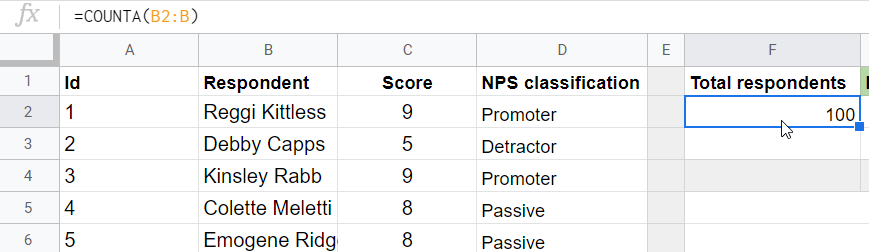
- Column F shows the total number of respondents. We used the COUNTA function for this:
=COUNTA(B2:B)
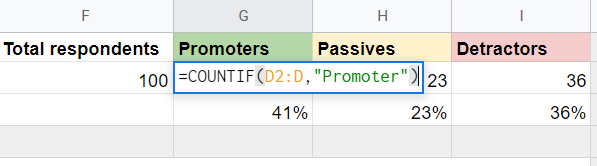
- In columns G, H, and I, we calculated the number of each category of respondents using the COUNTIF function:
=COUNTIF(D2:D,"Promoter")
=COUNTIF(D2:D,"Passive")
=COUNTIF(D2:D,"Detractor")
Now, we can apply the NPS calculation formula:
=(G2-I2)/F2
G2– the number of promotersI2– the number of detractorsF2– the total number of respondents
In our case, the Net Promoter Score is 0.05, or 5%.
How to establish communication with detractors?
Collecting feedback from detractors can be performed through different communication channels and by using various tools – a telephone call, email follow-up, or in the form of a survey. We’ve chosen Typeform online survey software to showcase this example.
Questions you can use to follow up with detractors:
- What was the core reason that you were not satisfied with our product?
- What features does it lack?
- What don’t you like about our company the most?
- What would you like us to improve?
TIP: Use open questions to collect more valuable insights. Mix them with multiple choice questions to make the experience more seamless for users.
Once the survey is made, responses will start pouring in. The next step is to analyze the collected data and calculate the NPS. This can be done right in the app you use for survey automation. However, if you need to perform a more sophisticated analysis, visualize the results and share them with stakeholders, you’d better import the survey data into Google Sheets or another spreadsheet app.
How to import the results of a survey into a spreadsheet?
With Typeform, for example, you can download all your data to a spreadsheet in Excel (XLS) or CSV file formats. Then you can manually import this file into Google Sheets. However, you can also export Typeform data directly into Google Sheets using Typeform API without code required. For this, you’ll need Coupler.io – a multiple-source solution for importing data.
Coupler.io provides a JSON Client importer, which lets you easily import JSON data from apps via their REST API and convert it into Google Sheets format.
For our case, with Typeform, you’ll basically need to complete the following steps:
- Install Coupler.io from the Google Workspace Marketplace.
- Add a JSON Client importer.
- Create the JSON URL and insert it into the respective field of the importer to get the data you want to export to Google Sheets. For example, to import all responses from a particular form, you need to use the following JSON URL:
https://api.typeform.com/forms/{form_id}/responses{form_id}-? is an ID of your form. You can find it right in the URL of your form. For example, inhttps://railsware.typeform.com/to/BfDhNZ, the form ID isBfDhNZ.
Read our blog post to learn more about connecting Typeform with Google Sheets.
How do you interpret calculated Net Promoter Score?
There are many factors that can influence the NPS value. It usually differs by industry, geographical location, customer segment, etc.
To get an idea of what a good NPS is, start by checking what the average NPS in your industry is. Then compare it against the NPS of your competitors. It is believed that companies with higher scores show better results in terms of business growth.
Sometimes it is also wise to check out NPS scores of the leading companies in your industry and market niche. This knowledge will help you set up clear and measurable goals for your NPS.
Another option is to compare the tendency of your NPS score on a half-yearly or yearly basis, reviewing whether your post-NPS activities brought any results or not.
But, as we discussed earlier, whatever approach to assessing the NPS results you choose, the main outcome of the activity will be formed as a list of detractors who you can approach and work with. Establish contact with them, collect stories about their poor experience, and change the perception they have of your company and brand.
How to improve Net Promoter Score
There is a lot to do for brands who want to re-engineer themselves and improve their Net Promoter Score.
- Educate your employees:
Increase awareness among people inside the company of what the Net Promoter Score is and how it impacts your business, so that they understand that each and every customer matters. Develop a “focus on the customer” strategy and share it with the client-facing teams to inspire them to follow the guidelines when running business communication. Encourage them to be eager to accept feedback and promptly transmit it to the department responsible for customer happiness.
- Perfect welcome & closure
Any communication that you have with a customer can contribute to either a general positive or negative experience of your brand. Make sure your calls begin on the right note – keep the greeting friendly, lead with some short small talk, then move on to business, ask questions to understand their problem and try to suggest a solution. Show how valuable they as a client are for your business. Make sure the conversation ends on a positive note – that’s the impression the customers will leave with.
- Encourage customer feedback
Open up to customer feedback. Don’t ignore it; instead, study and learn from it. Suggest your clients to submit product or feature requests, involve them in conversations about the general roadmap, and let them schedule onboarding and support calls. Show that you hear them and are ready to lead a fruitful collaboration with them.
- Accept follow-ups
After feedback is delivered, follow up with the customer to thank them for being open and sharing their ideas with you. Let them know how their feedback will be processed. Once you have a deliverable to be shared with a client, such as a product feature to release, email them personally to notify them about the achievement and tell them they were a part of it.
- Turn NPS detractors into NPS promoters:
Develop a separate communication strategy focused on detractors. Follow up on them, invite them to collaborate, and listen to their problems. As they speak, be honest with them and acknowledge the imperfections your business has. Try to fix their core issues and switch their customer experience into a positive tone, turning them into promoters.
- Don’t forget passives
Don’t forget your passives. Although they don’t inherently affect your score, it’s worth figuring out what could make them swing to becoming a company’s ambassador.
Often price-sensitive, it takes time and patience to earn their loyalty. However, if you involve them in conversations and show that you offer more than just a product or service, their general experience might change to your advantage.
Is NPS indeed a key performance indicator to rely on?
Since NPS was first introduced to the public, scientists and market research specialists explored the topic in more detail. All in all, their findings suggested that:
- NPS doesn’t take into account passives, which means that part of your audience is not being taken into account at all, while still influencing the total shares of both promoters and detractors.
- The single question proposed by Reichheld can’t claim to be the best one to help businesses forecast their growth. Academics think that you can replace this with alternatives like “How likely are you to perform purchases from us in the future?” focused on customer loyalty and satisfaction, without any loss in data accuracy or predictions.
- Researchers found no reason why an 11-point scale is better than other options. Based on testing of several scale versions, scientists came to a conclusion that a 7-point scale is the most suitable for this purpose.
Therefore, though integrating NPS into your workflow seems very straightforward, offering many benefits in return, it is better not to fully rely on it as a single source or truth, nor to be afraid to experiment by tweaking the approach to better meet your business’ needs.