Tableau vs. Looker Studio (Google Data Studio): A Detailed Comparative Analysis of Two Dataviz Tools

“A picture is worth a thousand words” is a popular saying that summarizes the concept of data visualization or Dataviz. Every data has a story and data visualization is the process of using visuals to interpret data. Looker Studio and Tableau are visualization tools used to extract useful information from a dataset.
Both Dataviz tools are easy-to-use, and they’re suitable for newbies and knowbies data analysts. Looker Studio is suitable for digital marketers that require seamless connections to Google products. Tableau, on the other hand, is best suited for large enterprises that conduct complex business intelligence (BI) reports.
This article provides a detailed Looker Studio vs Tableau analysis to help you understand the functionalities of both analytics tools.
Looker Studio versus Tableau: The basic features
Looker Studio is a free cloud-based data reporting tool. It has a user-friendly design that makes it easy to create customized reports and dashboards. Data dashboards, much like a car dashboard, organize and display all of the essential information at a glance. Learn the step-by-step process of creating dashboards in our Looker Studio Tutorial.
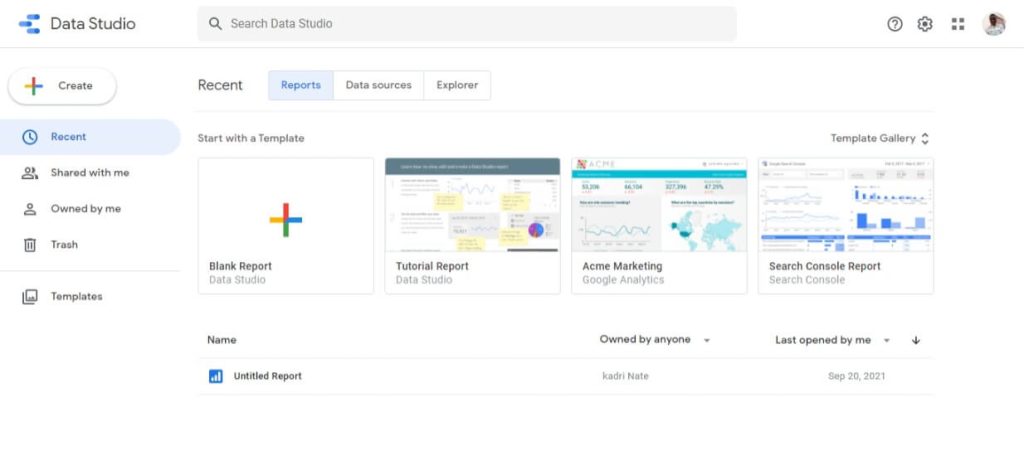
Tableau is a desktop and cloud-focused BI tool. With Tableau, you can connect with multiple data sources to create a comprehensive data dashboard. The tool supports data blending and data joining. This means that you can create reports from data collected from multiple sources (data blending) or a single source (data joining).
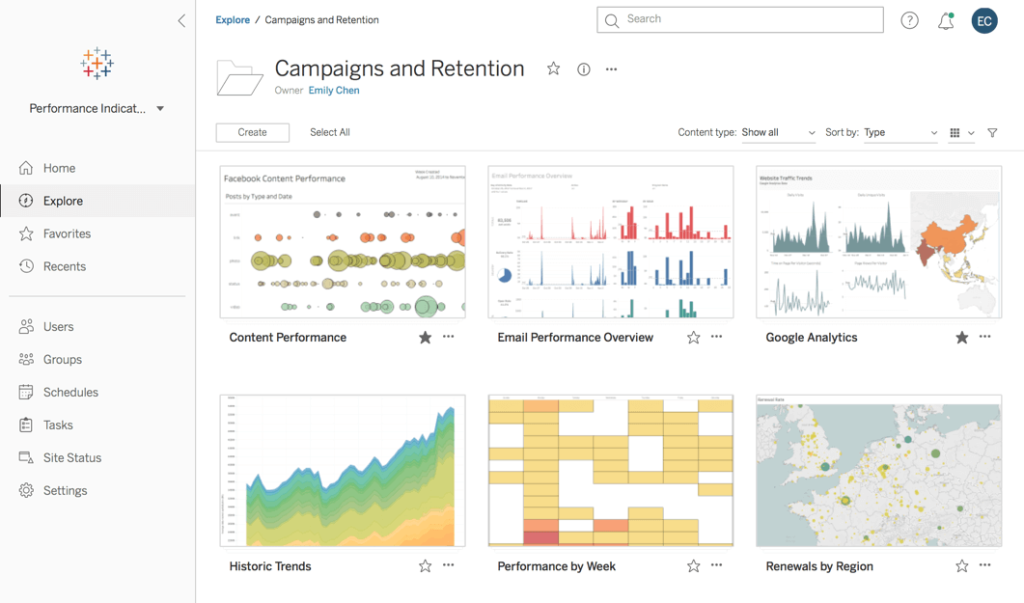
Tableau vs. Looker Studio: Full comparison
Integration capabilities: Looker Studio
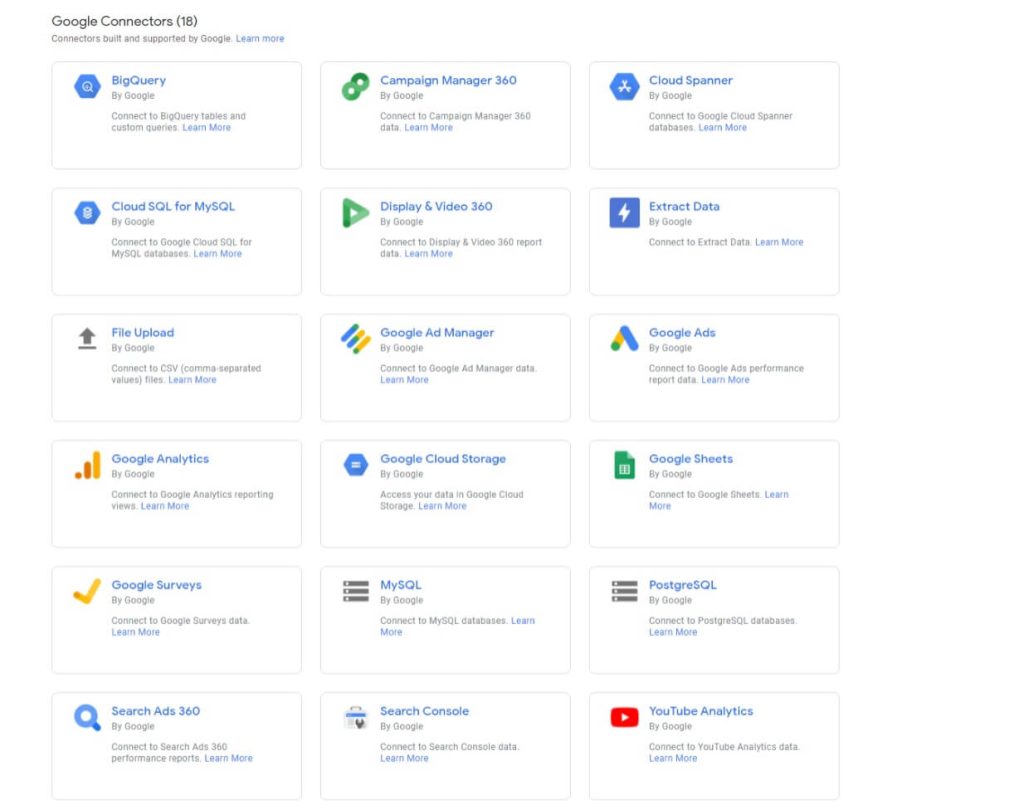
Accessing data from multiple applications and data sources is essential to deriving insights from datasets. Data connectors are used to import data from applications and services. Looker Studio offers a comprehensive hub of data connectors.
Currently, Looker Studio syncs directly with 18 Google products like Google Analytics, Google AdWords, and Google Sheets. Additionally, it offers 454 connections to external databases such as MySQL and PostgreSQL.
However, Looker Studio has limited connections to external apps. This is where Coupler.io has got you covered. Coupler.io is a data analytics and data integration platform that allows you to significantly expand the set of integrations offered by Looker Studio natively. With this solution, you can automatically connect 60+ business apps to Looker Studio via direct integration and schedule automated updates.
Try it yourself: select the needed source app from the drop-down and click Proceed. You’ll need to sign up with your Google account for free and configure the connection according to the in-app instructions. It will take up to 3 minutes to get your data to Looker Studio.
Integration ?apabilities: Tableau
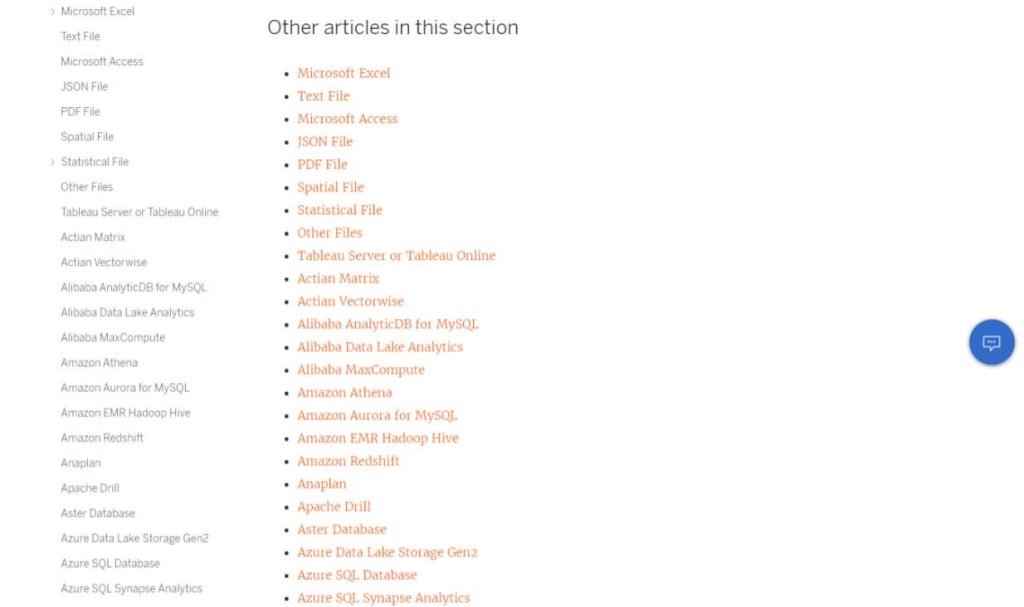
Tableau as one of the key Looker Studio alternatives provides an extensive connection to data connectors and databases. It supports file-based connections (e.g., text and PDF documents). Besides, you can integrate with SQL and NoSQL databases through Tableau. Check out the full list of Tableau data connectors here.
Unlike Looker Studio, Tableau integration with Google products is limited. It supports Google products such as Google Ads, Google Analytics, and Google BigQuery. However, third-party tools are required to access Google products such as AdWords, Attribution, and YouTube Analytics.
Tableau’s extensive data connection continues through its web data connector (WDC). With WDC, Tableau users can export data from web-based HTML and Java sources. Tableau’s Extension Gallery also provides additional data connectors. Users can access customized data connectors built by Tableau partners through the Extension Gallery.
Differences between Looker Studio and Tableau in a comparison table
| Feature | Looker Studio | Tableau |
|---|---|---|
| Security | It offers password-enabled shared access to secure data reports. | It offers additional security, such as multi-factor authentication through its cloud-based service. It offers Row Level Security that grants additional data visualization security. |
| Dashboard Updates | It provides automated real-time dashboard updates. But with large datasets, real-time updates get slower unless you use a third-party browser extension. | It can manage complex data. It supports real-time dashboard updates. Moreover, it’s mobile-friendly. |
| Price | It’s free. Although third-party apps like Coupler.io require payment. | Tableau Public is free. But it has limited functionalities. Generally, the Tableau subscription package ranges between $12 to $70/user per month with up to 14 days of free trial. |
| Data Export | You can export your reports to Google Sheets or download them as a PDF document. But it doesn’t connect directly to Excel files. Excel files have to be exported to a comma-separated value (CSV) file. | It natively connects to several databases, file-based and cloud-based data resources, and Excel files. |
| Integration Capabilities | It offers direct connections to Google platforms and databases. | It offers easy connections to databases, customer relationship management systems (e.g., Salesforce), and files. But it offers a limited direct connection to Google products. |
| Shareability and Collaboration | Uses Google’s simplified data sharing and collaboration capabilities. Besides, it permits granular access controls. | Has more collaboration options. You can share Tableau dashboards and reports within your organization, with your stakeholders, and publicly. |
| Functionalities | Offers drill-down analysis that helps users explore reports in detail. It also supports data blending. | Offers advanced data visualization options such as Tableau Story and Tableau Shelf. Unlike Looker Studio, it supports data cleaning. |
| Learning Curve | It’s easy to register and navigate. Suitable for rookie and expert data analysts. | It requires expert knowledge to understand its full functionalities. Best suited for experienced data analysts. |
Looker Studio or Tableau: Functionalities
Looker Studio offers built-in templates and interaction filters to create interactive reports. It provides several widgets to customize a dashboard. Other distinctive functionalities include:
- Data Blending: You can blend data from up to four different sources as long as they share at least one common data point known as the “join key”. This feature is used to compare and contrast data from different sources. However, the downside is that using this functionality can make Looker Studio slow, especially if the datasets are large. You can overcome this if you use a third-party tool to connect your data sources to Looker Studio. For example, Coupler.io allows you to blend data from multiple sources on its side thanks to its ETL functionality.
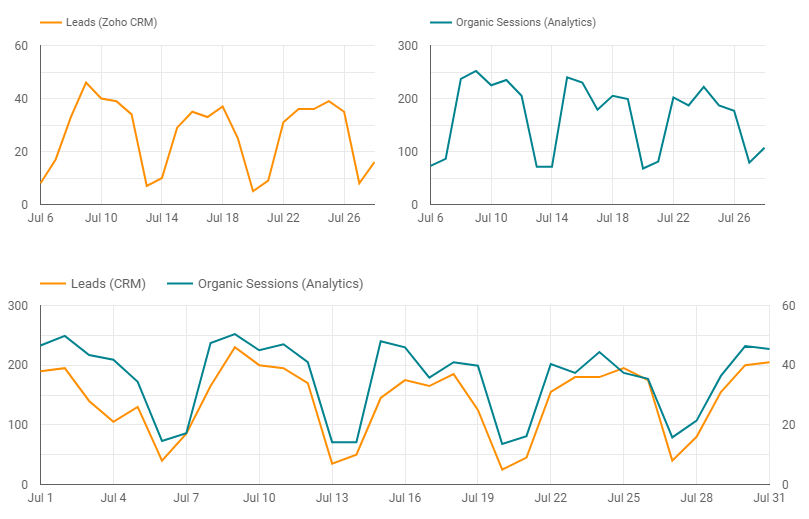
- Expanded Visualization functions: You can customize reports using charts, tables, and graphs. Other functionalities include date range controls, geographic heat maps, and scorecards.
- Calculated Fields: This feature allows you to create new metrics using functions and calculations. In other words, it’s used for data manipulation.
Tableau has a simple drag-and-drop interface. It provides a wide range of visualization tools, such as histogram, Gantt chart, motion chart, treemap, and boxplot, for robust data analysis.
Like Looker Studio, you can blend data on Tableau. The Dataviz tool provides a user-oriented dashboard with pre-installed filtering tools for data analysis. Other capabilities of Tableau are listed below:
- Tableau Story: It’s a collection of worksheets and visualizations sequentially arranged to convey information. It’s used to add contexts and specific narratives to data reporting.

- Pages Shelf: It allows users to analyze data based on the individual values within a field. It’s used to measure performance over a given period.
- Tableau Prep: It’s used to perform cleaning operations — such as filtering, adding, renaming, splitting, and grouping — on data before conducting in-depth data analysis.
Tableau vs Looker Studio: Pricing
Looker Studio is completely free. All you need to access the tool is a functional Google account.
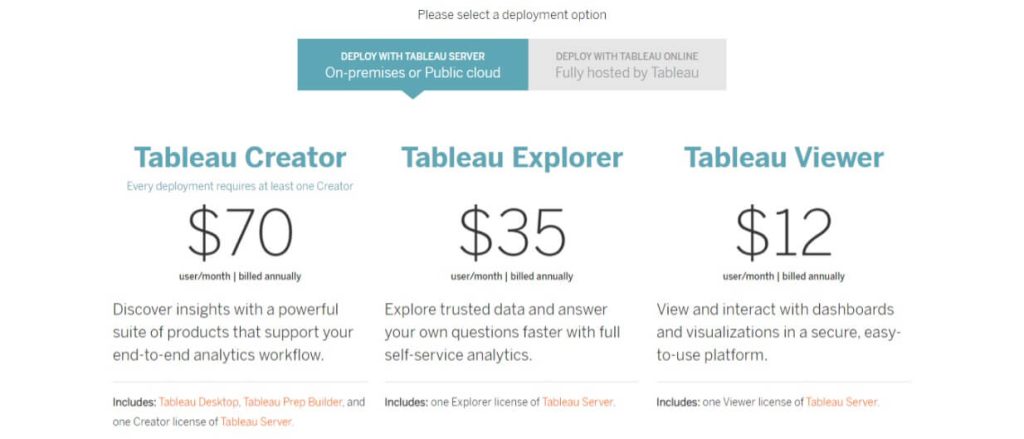
Unlike Looker Studio, Tableau is a paid service with a flexible pricing system. For starters, Tableau Public is free, but it has limited storage and privacy options. Tableau Creator offers the full functionality of Tableau. It’s billed annually at $70/month whether deployed on-premise or in the cloud.
Tableau Explorer, when deployed on-premise, is billed annually at $35 per month with a Tableau Server license. When deployed on the cloud, it costs $42/month annually plus Tableau Online license.
Tableau Viewer is suitable for viewing reports and dashboards only. When used as an on-premise solution, it costs $12/month per year with a Tableau Server license. When deployed on the cloud, it costs $15/month per year with a license to Tableau Online.
As a fully cloud-based tool, Looker Studio offers straightforward data accessibility. For real-time collaboration, you can invite people to edit and view your reports. You can send reports in a PDF format to relevant parties through the Schedule email delivery option.
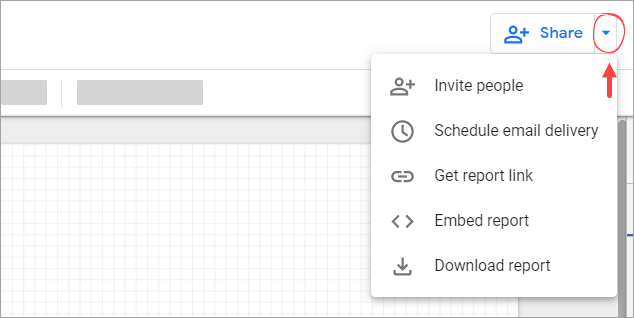
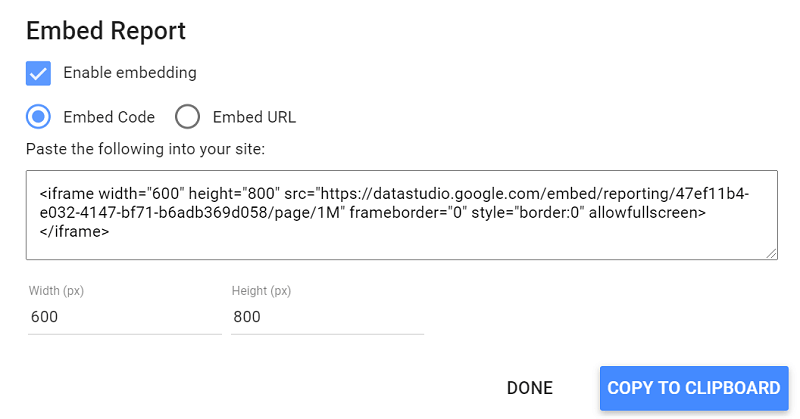
The get report link option will help you generate a secure link for easy report sharing. The embed report feature helps you add reports as a URL link or a code.
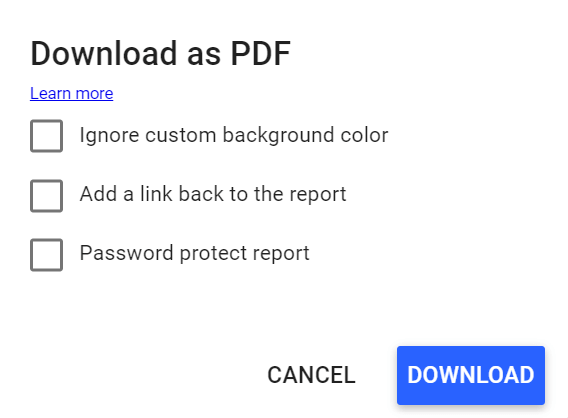
You can download reports as PDF documents. You can also use passwords to protect your PDF reports.
Collaboration and data sharing on Tableau are a bit more advanced. Developer tools (Tableau Desktop and Tableau Public) are used to create data reports, visualizations, and dashboards. Sharing Tools (Tableau Server, Tableau Online, and Tableau Reader) are used to share reports and dashboards.
Tableau offers direct connections to Google Sheets and Excel, so you can use them as a source. If you need to automate data exports from Tableau dashboards, you can use Coupler.io. It is a reliable tool to collect data from different apps, including Tableau, Airtable, Jira, Xero, and many others. So, you can set up a Tableau export to Google Sheets, for example, every day without any coding. Additionally, you can export data from Tableau to BigQuery or Tableau to Excel.
As for the native Tableau sharing data options, here is what you can have:
- Tableau Desktop: It helps users to create reports and edit dashboards through the desktop. Unlike Tableau Public, Tableau Desktop users can share data reports and dashboards locally or on the public cloud.
- Tableau Public: Tableau Public users can only share workbooks to Tableau public cloud. It has limited privacy because any user on the public cloud can access and download the data reports.
- Tableau Server: It’s suitable for sharing dashboards created with Tableau Desktop with external parties. It provides additional data security, control, and storage options. It’s great for work collaboration.
- Tableau Online: It’s the cloud version of Tableau. It’s suitable for sharing reports created with Tableau Desktop with relevant parties. It supports authentication controls and web authoring to protect data accessibility and collaboration respectively.
- Tableau Reader: It’s a free tool for viewing data insights created by Tableau Desktop or Tableau Public. It doesn’t support any form of editing or modification.
Looker Studio vs Tableau: Learning ?urve
Looker Studio doesn’t require any complex software installation or lengthy registration process. Its tools are simple to use. Therefore, this makes the Looker Studio onboarding process straightforward, especially for newbies.
With great power comes great complexity is the story of Tableau. The interface is simple to use. But its numerous features make it best suited for seasoned data analysts.
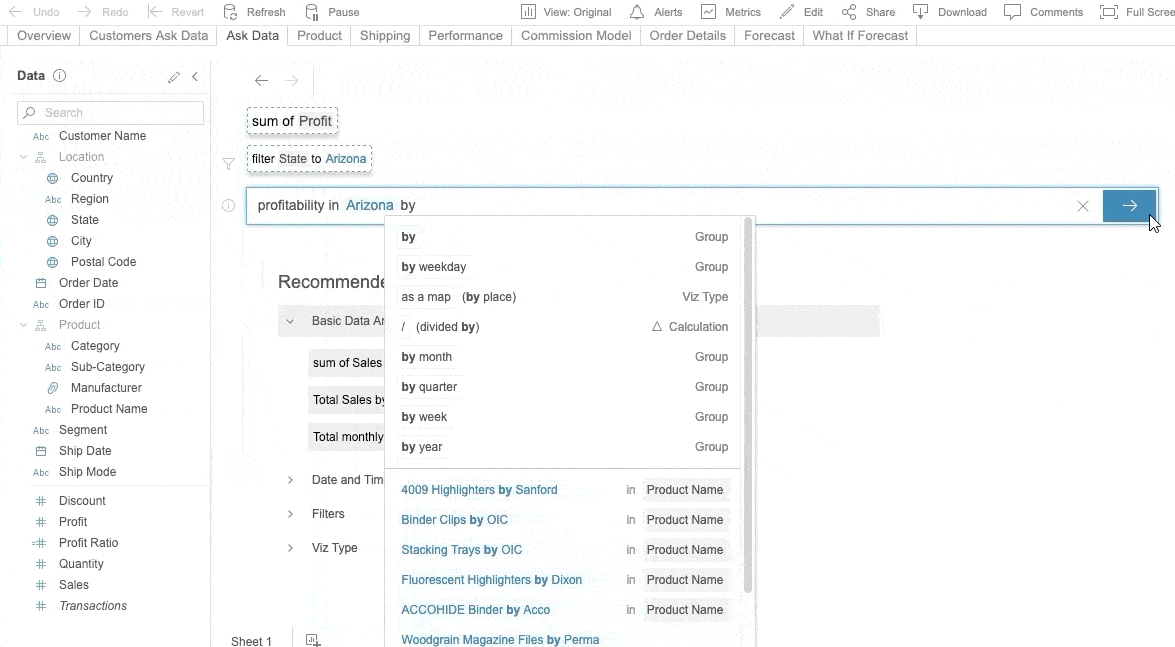
However, you can work your way around data analysis on Tableau through the Ask Data and Explain Data features. These features use artificial intelligence to provide simplified answers to queries.
Is Looker Studio a threat to Tableau?
The simplistic answer to the rhetorical question is “yes”. And the answer goes both ways because both analytics tools operate in the same industry. Although Tableau remains the analytics platform to beat.
According to the leading information technology firm, Gartner, Tableau has led the marketing BI industry in the past nine years. Both analytics platforms have their merits depending on your needs. Looker Studio is best suited for individuals, while Tableau is a good fit for enterprises.
To summarise, the reasons you should use Looker Studio include:
- It’s free: It offers an extensive hub of data analytics tools for free. Looker Studio is the BI tool you need if you’re a data analyst on a tight budget.
- Simplified sharing controls: If you’re familiar with Google products, such as Google Docs, sharing data on Looker Studio should be straightforward. Its sharing and collaboration processes are easy to understand.
- It’s easy to navigate: You don’t need to be a tech guru to use Looker Studio. Its interface and analytics features are simple to use. And should you need support, the in-app Help menu is available to guide you.
In like manner, the reasons you should use Tableau include:
- Fast and complex data analysis: Tableau is your go-to tool if you’re a big fan of numbers and complicated analysis. The analytics tool will help you explore complex BI reports at the speed of light.
- Mobile Access: Tableau dashboards are mobile-friendly. This means you can manage dashboards through your mobile device.
- Extensive Connections: Data connectors are the lifeblood of dashboards. Tableau offers a rich extension to multiple databases for efficient analysis.
Lastly, feel free to check the Coupler.io blog page to explore the in-depth functionalities of Looker Studio and Tableau. Also, check our article on Power BI vs Tableau and Looker Studio vs. Power BI – they can be helpful as well. Happy visualization!