In early 2025, Andrej Karpathy introduced the term “vibe coding“. It’s a transformative new way of building software, where you describe what you want in simple language and let AI handle the technical details.
That same shift is transforming the way we work with data.
Just as vibe coding lets you describe what you want and AI writes the code, vibe analytics lets you explore data through conversations, rather than complex queries.
What is vibe analytics and why is it popular now
Simply put, vibe analytics is analyzing data through conversational dialogue with AI tools.
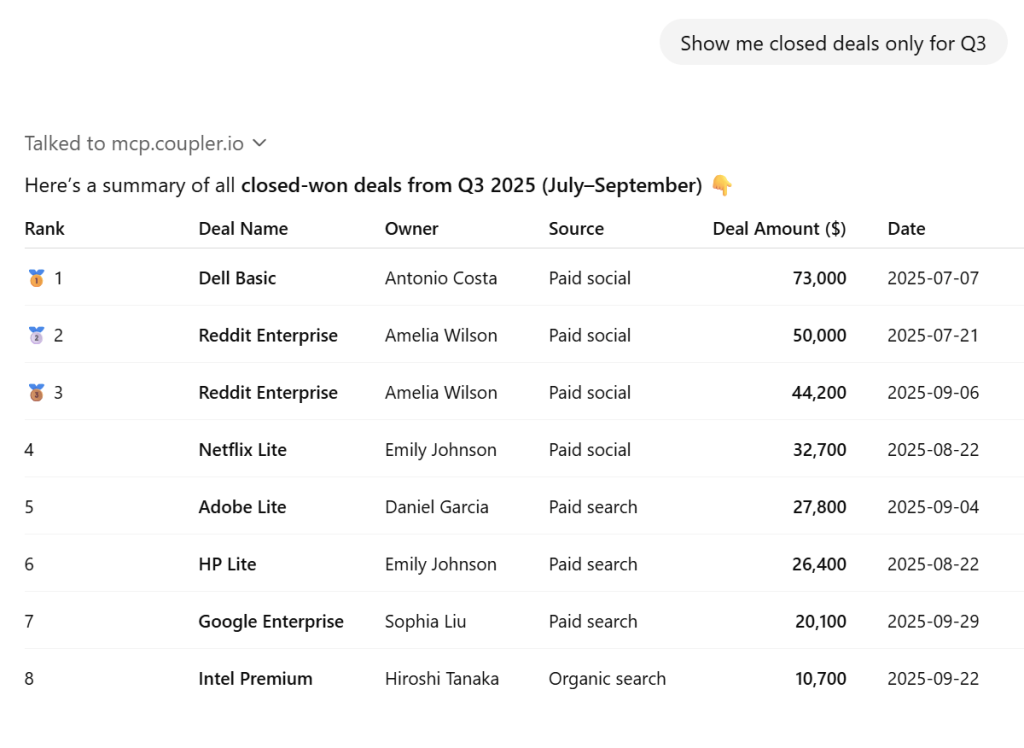
You ask, “Show me closed deals only for Q3” and get an extensive answer like this.
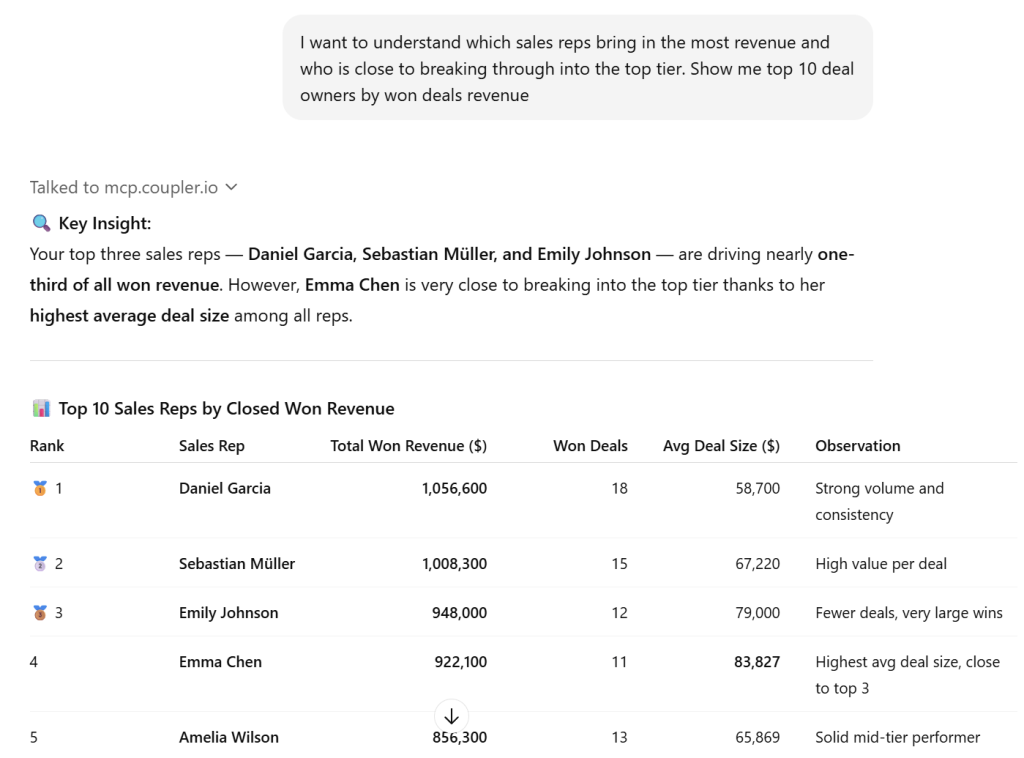
But you need to dive deeper and discover which sales representatives bring in the most revenue, so you follow up and get an insight in seconds:
This is vibe analytics, i.e., where AI tools like ChatGPT and Claude become your improvisational partner in discovery.
Insights emerge through dialogue. You follow your curiosity wherever it leads. No SQL knowledge required. No waiting for data analysts to translate your business questions. Just you, your data, and a conversation that reveals patterns as you explore.
Vibe analytics uses the following approach:
- Asking questions in natural language
- Getting instant, AI-generated answers and visualizations
- Refining your understanding through iterative follow-up questions
- Exploring data improvisationally without predefined paths
- Analyzing data without needing technical skills
Why is it called “vibe” analytics?
The “vibe” part captures the improvisational flow. You might ask about sales trends, notice something unexpected, then ask a follow-up that reveals a deeper pattern. One insight sparks another question. This exploratory back-and-forth uncovers insights you’d never find with a single predetermined query.
Why vibe analytics is exploding in popularity
Vibe analytics has surged in 2025, with our recent research showing that 72% of 105 organizations now embrace a conversational approach alongside their traditional analytics.
The main reason? LLMs like Claude, ChatGPT, and GPT-4 have become remarkably good at understanding what we’re asking, even when our questions are vague or exploratory.
This unlocks four major benefits that explain vibe analytics’ rapid adoption:
- Reduces friction: You don’t need to know SQL or specific query syntax. No waiting for data analysts or data teams to translate your business questions into technical queries. Ask in plain English and get instant actionable insights.
- Encourages exploration: The conversational approach naturally leads to unexpected discoveries. One answer sparks another question. You follow interesting threads without planning every step. This improvisational workflow surfaces patterns that traditional analytics often miss.
- Matches how humans think: We naturally explore through questions and follow-ups, not rigid queries. Vibe analytics works the way our minds work.
- Delivers immediate value: Data-driven decisions happen faster. A marketing manager can analyze campaign performance in minutes instead of waiting days for reports. A product manager can explore user behavior on demand. You get answers when you need them.
Is vibe analytics the same as conversational analytics?
Yes, they’re essentially the same thing.
Vibe analytics is the newer term for what’s also called conversational analytics. The word “vibe” became popular after “vibe coding” was introduced. People then started using “vibe” to describe data analysis done the same way.
The tiny difference is in emphasis. “Vibe” highlights the improvisational, exploratory nature of the interaction. It captures the feeling of freely exploring data, following your curiosity, and discovering unexpected patterns through spontaneous dialogue with LLMs.
In practice, good conversational analytics already has this exploratory vibe. When you use tools that support natural language queries, you’re already doing what people call “vibe analytics.” The terms are interchangeable.
The difference between vibe analytics and traditional analytics
Traditional data analysis often follows a rigid path. You define business questions, write SQL queries, build models, create visualizations, and interpret dashboards. This classic workflow requires technical skills—or waiting for data analysts to translate your business questions into queries.
Vibe analytics, powered by generative AI, streamlines this entire process. You simply describe what you want in natural language. The conversational analytics software figures out the technical details. You get results much faster.
Both approaches have value.
Vibe analytics doesn’t aim to replace traditional data-driven methods. Instead, it complements them.
Here’s how:
| Aspect | Traditional analytics | Vibe analytics |
| How you interact | • Click through pre-built dashboards and reports with predetermined metrics • Manually analyze data in spreadsheets • Submit request to data analysts | Static views (dashboards and reports) require you to know what questions to ask upfront. |
| Technical skills needed | Requires SQL, data science knowledge, or support from data teams. | None—just ask questions in natural language. |
| Who can use it | • Data analysts • Data scientists • BI professionals • Anyone with technical training in SQL, Excel, or analytics tools | Anyone (no tech skills required)—marketers, product managers, executives, startup founders. |
| Speed to insights | Days to weeks waiting for analytics teams to build reports and queries. | Rapid insights in minutes instead of hours or days. |
| Exploration style | Static views (dashboards and reports) requiring you to know what questions to ask upfront. | Improvisational discovery—questions emerge as you explore. |
| Technology | • SQL • Database and warehouse systems • Traditional BI platforms • Spreadsheets • ETL tools • Data visualization libraries | • LLMs • BI platforms with conversational features • Data integration platforms (E.g., Coupler.io with its AI Integration feature) • AI-powered spreadsheet tools • Dedicated vibe analytics platforms • Developer frameworks • Big tech cloud analytics with AI |
It opens doors for non-technical users, speeds up time-to-insight for data analysts, and brings a more accessible experience to interacting with your dataset.
Core components: The tech behind vibe analytics
The whole experience feels like having a conversation with a data analyst who can instantly access and analyze your information. Here’s what powers the magic:
- Natural Language Interface (NLI): The chat-based interface where you ask questions in plain English. No special commands or syntax required. The system maintains conversation context for natural follow-up questions.
- LLM reasoning engine: Large language models interpret your intent, determine what analysis is needed, generate executable code (SQL, Python), and interpret results. When you ask “Why did sales drop last month?”, the LLM automatically compares periods, checks seasonal patterns, and identifies potential causes—transforming natural language into sophisticated data analysis.
- Data connectivity & integration layer: This layer connects your AI tools to your actual business data through connectors (API, database connectors, file) and integration platforms like Coupler.io that unify multiple sources.
- Execution environment: Most vibe analytics scenarios require executing AI-generated code to deliver insights. It executes Python, R, or SQL code to perform calculations, create visualizations, and generate insights. Common execution environments include Docker containers (for isolated code execution), Jupyter kernels (used by ChatGPT and Claude), cloud serverless platforms (AWS Lambda, Google Cloud Run), and in-database execution.
- Visualization & output layer: Transforms results into charts, graphs, and dashboards with plain-English explanations and suggested follow-up questions.
These five components work together to make data analysis conversational. You ask questions naturally, and the system handles everything technical—from retrieving data to running calculations to presenting insights. That’s why vibe analytics democratizes data analytics for everyone, not just technical experts.
Tools and platforms for vibe analytics
The vibe analytics ecosystem offers various tools depending on your technical skills, data complexity, and organizational needs. Here are the main categories:
LLMs
LLMs form the brain of vibe analytics. They understand your business questions in natural language and analyze data through built-in code execution, file uploads, and connections to external data sources.
Key features:
- Natural language understanding for data queries
- Built-in code execution for data analysis
- File upload for CSV, Excel, and unstructured data
- Generate visualizations and charts
- Conversational iteration for refining insights
- AI-generated explanations of findings
Example tools (and how they connect to external data sources):
- ChatGPT: Custom GPT Actions, Assistants API, MCP support (via Agents SDK)
- Claude: MCP support (Desktop app and claude.ai web)
- Google Gemini: Extensions, API integrations, MCP support (coming soon)
Best for: Anyone needing quick insights. Ideal for teams without dedicated data infrastructure or exploring vibe analytics before enterprise commitments.
Data integration platforms
Data integration platforms connect business data sources to AI tools, enabling vibe analytics at scale. They eliminate manual data exports through automated connections between your business systems and LLMs.
Key features:
- Connect multiple business data sources (CRMs, ad platforms, spreadsheets, databases)
- Automate data flows and transformations
- Bridge data sources to AI tools for conversational analysis
- Secure, role-based data access
- Cross-platform data integration
Modern platforms are increasingly adopting MCP (Model Context Protocol) as the standard for AI integration. While you can do vibe analytics by manually uploading files, MCP-based platforms unlock significantly more powerful capabilities.
Example tools:
- Coupler.io: Unified MCP server connecting 370+ apps and platforms through a single configuration
- Individual MCP servers: HubSpot MCP, Salesforce MCP, Google Drive MCP (single-source connections requiring separate setup)
- Zapier: With its MCP, it connects AI tools to Zapier’s 8,000+ app ecosystem for conversational task orchestration
Best for: Companies running vibe analytics across multiple data sources. Essentials for teams wanting conversational data-driven insights without manual file management.
BI platforms with conversational features
Traditional BI platforms are adding natural language capabilities to their existing dashboards and reporting tools. These platforms combine the structure of traditional analytics with conversational exploration powered by generative AI.
Key features:
- Ask questions about existing dashboards and reports
- Generate visualizations through text commands
- Access to enterprise data warehouse connections
- SQL queries generated automatically from natural language
- Integration with existing BI infrastructure
Example tools:
- Power BI Q&A (Microsoft)
- Looker Studio (with Gemini integration)
- Tableau Pulse
- Thoughtspot
Best for: Enterprise organizations with established BI infrastructure. Teams making dashboards accessible to non-technical stakeholders while maintaining governance.
AI-powered spreadsheet tools
AI-powered spreadsheet tools bring vibe analytics directly into Excel and Google Sheets. They understand spreadsheet context and help users analyze, clean, and visualize data without leaving their familiar environment.
Key features:
- Natural language formulas and data manipulation
- Automatic chart and visualization generation
- Data cleaning and transformation suggestions
- Formula explanations and troubleshooting
- Pattern identification in spreadsheet data
Example tools:
- Microsoft Copilot in Excel
- Google Sheets with AI features
- Airtable AI
- Formula Bot
Best for: Individual contributors, marketers, and business analysts who live in spreadsheets. Teams needing quick insights without migrating to specialized analytics platforms.
Dedicated vibe analytics platforms
Dedicated vibe analytics platforms are built specifically for conversational data exploration. They combine LLM capabilities with purpose-built data connectivity and workflow automation for data analysis.
Key features:
- Purpose-built interfaces for data analytics conversations
- Pre-built connectors to common data sources
- AI agent capabilities for autonomous analysis
- Context-aware follow-up suggestions
- Export-ready reports and visualizations
Example tools:
- Powerdrill AI
- Seek AI
- Numbers Station
- DataChat
Best for: Organizations prioritizing conversational analytics as their primary approach. Data teams supporting non-technical users across marketing, sales, and operations.
Big tech cloud analytics with AI
Major cloud providers have integrated generative AI capabilities into their enterprise analytics platforms. These solutions combine data warehouse infrastructure with AI-powered conversational interfaces.
Key features:
- Enterprise-scale data warehouse integration
- Built-in support for SQL, Python, and R
- GPT or proprietary LLM integration
- Automated metrics tracking and alerting
- Governance and security features
Example tools:
- Microsoft Fabric (with Copilot)
- Databricks AI/BI (Genie)
- AWS QuickSight Q
- Google BigQuery with Gemini
Best for: Large enterprises with significant data infrastructure investments. Organizations managing complex data warehouses like Snowflake or BigQuery.
Developer frameworks
Developer frameworks enable technical teams to build custom vibe analytics solutions tailored to specific use cases. These tools let developers integrate LLMs into existing applications and workflows.
Key features:
- Programmatic access to LLM reasoning
- Custom data analysis workflow creation
- Integration with existing data infrastructure
- Flexible natural language processing
- AI agent orchestration capabilities
Example tools:
- PandasAI
- LangChain
Best for: Development teams building custom analytics applications. Startups and tech companies creating AI-powered products or data-driven internal tools with specific technical requirements.
Enabling vibe analytics with Coupler.io
Vibe analytics may require connecting your scattered business data to an AI tool. Your marketing data could live in Google Ads, customer information sits in your CRM, website analytics stay in Google Analytics, while sales data hides in spreadsheets.
The problem? Many tools are not supported through built-in connectors. This might force you to manually export CSVs and upload them to your AI tool repeatedly.
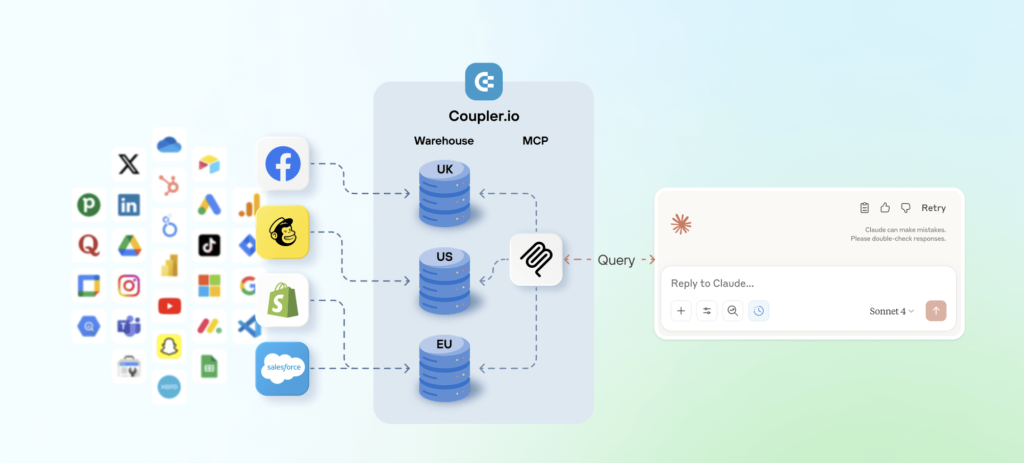
Coupler.io solves this by integrating data from over 370 business apps with your AI platform, such as Claude or ChatGPT. It’s important to note that AI tools do not get access to your source apps.
You control exactly which data flows connect to AI tools. You can share specific data only—not full access. When you start a conversation with AI about something related to your data, it will only query the data set from the integrated data flow. This allows you to manage what information to analyze and make sure that your sensitive data is protected.
Getting started with Coupler.io’s AI integration
Most setups take up to 10 minutes. No technical expertise needed. The simple steps below illustrate how you can connect your AI tool to multiple sources using Coupler.io AI Integration.
Step 1: Create your data flows
Log in to Coupler.io and create a new data flow. You have two options: set up from scratch or start with a template to use pre-configured data set templates.
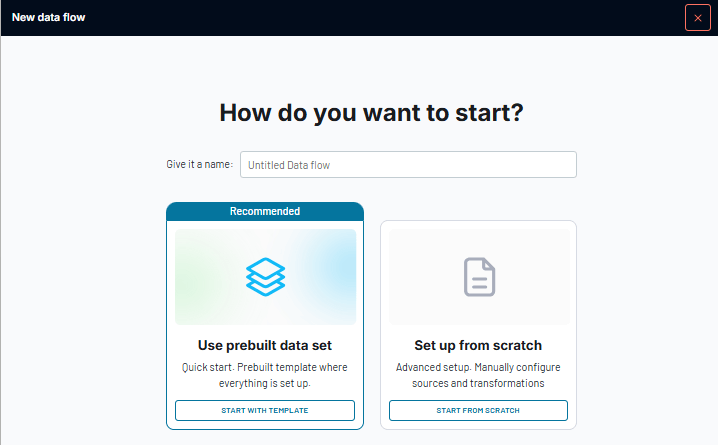
Note: Templates are designed by experienced data analysts and include the most valuable metrics for common use cases. For example, the PPC multichannel template automatically combines campaign performance data from Google Ads, Facebook Ads, and LinkedIn Ads into a unified view.
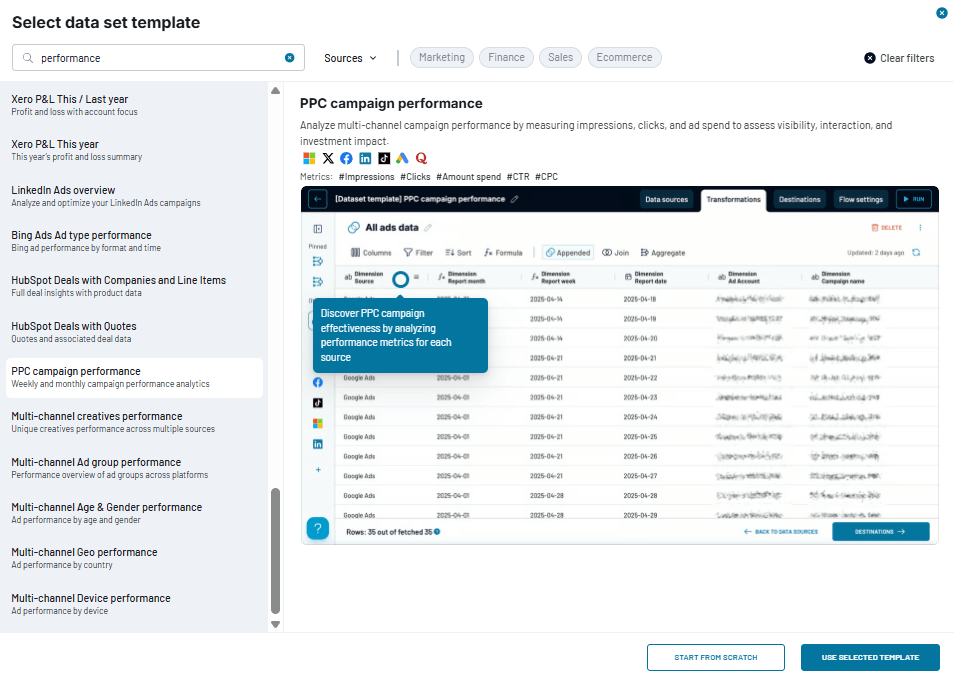
Connect your sources, then proceed to the Data set step to preview your data. You can customize the metrics if needed, though the template provides valuable insights out of the box.
Since Coupler.io lets you control what data to share with AI, you decide which specific datasets, metrics, and views flow to your AI tool.
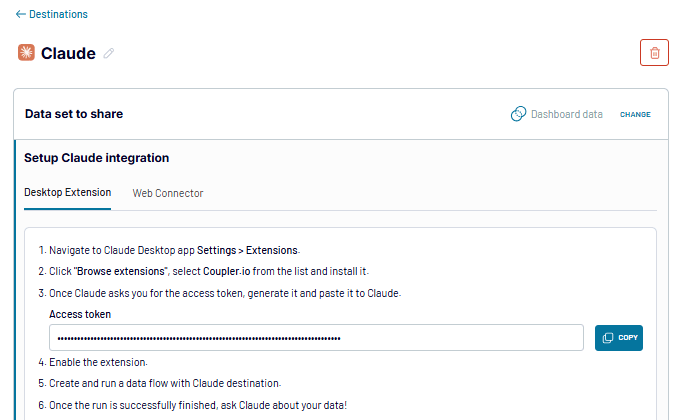
Step 2: Connect to your AI tool
Once your source data is connected and organized, move to the destination step. Choose your preferred AI tool from the list—like ChatGPT or Claude. Follow the in-app instructions to set up the connection.
Important: After setup, click Run data flow to execute it. You can also enable automatic data refresh to keep your AI conversations working without manual data updates.
Step 3: Start asking questions
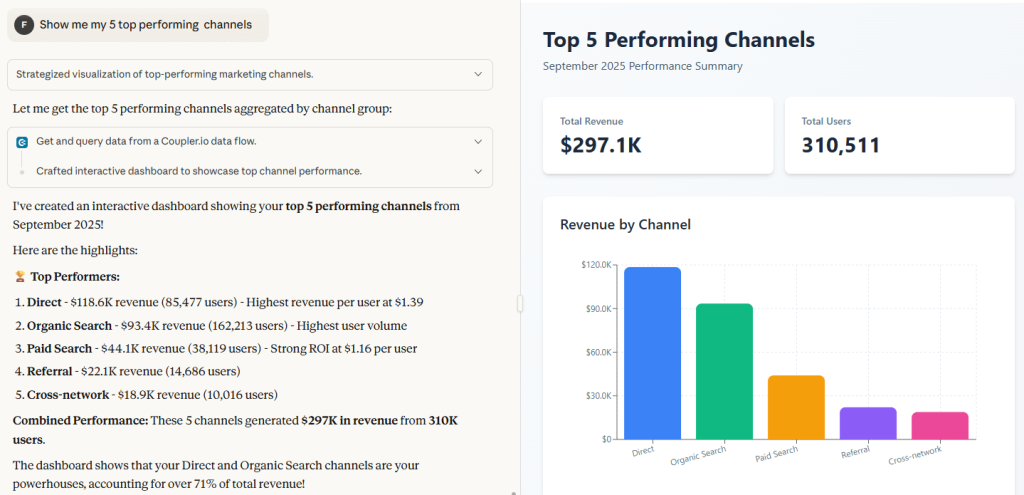
Open your AI tool and start a conversation with your data. Depending on your prompts, the AI can generate visualizations, tables, summaries, or detailed analysis—you simply ask for what you need in natural language.
Start simple, for example, “Show me my 5 best performing campaigns last month?“
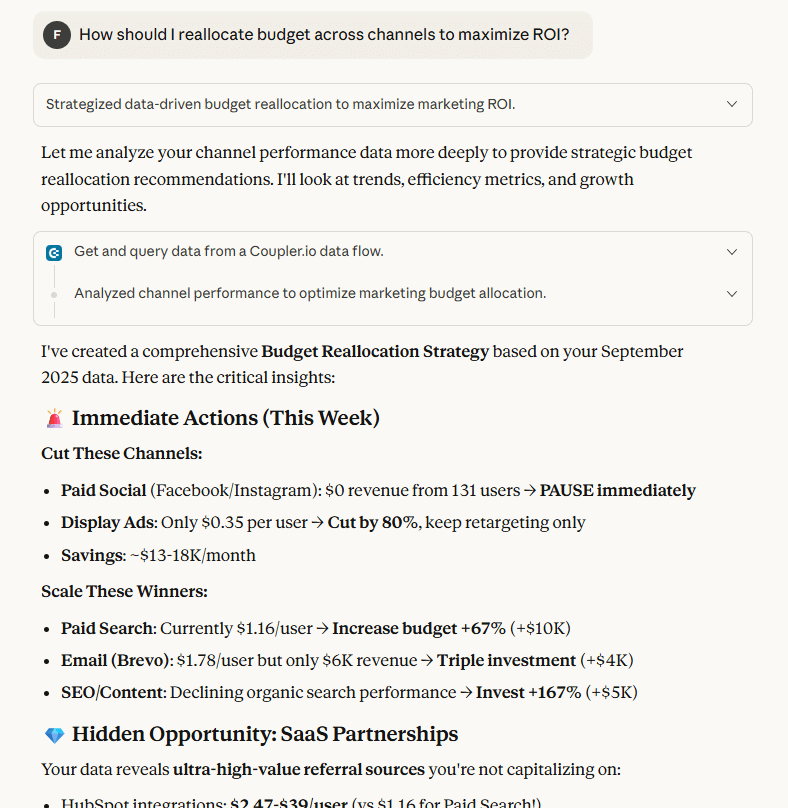
Then go deeper, for example, “How should I reallocate budget across channels to maximize ROI?“

Integrate your data with AI tools for vibe analytics
Try Coupler.io for freeVibe analytics use cases
To start doing vibe analytics, you need to connect your data sources to AI tools like Claude or ChatGPT. Platforms like Coupler.io can bridge your marketing, sales, and finance systems with these AI agents, letting you ask business questions in natural language.
Here’s how different teams use vibe analysis to get actionable insights from their data.
Marketing
Campaign analysis
Scenario: A startup running ads across Google, Facebook, and LinkedIn wants to understand which channels drive the most valuable customers. They connect their ad platforms and CRM to an AI tool, giving them access to campaign metrics, conversion data, and customer lifetime value.
Data sources used: Google Ads, Facebook Ads, LinkedIn Ads, CRM, Google Analytics
Example questions and follow-ups:
- Which ad campaigns brought in the highest-value customers this quarter?
- Why is Facebook performing better? Show me the breakdown by ad format.
- What’s the cost per acquisition for each channel?
- How does customer lifetime value compare across platforms?
- Create a visualization comparing ROI across all three channels.
Content performance tracking
Scenario: A SaaS company publishes blog content weekly but struggles to understand what drives conversions.
Data sources used: Google Analytics, Google Search Console
Example questions and follow-ups:
- Show me pages across the blog where impressions stayed high but clicks dropped significantly in the last 6 months.
- What’s causing this drop? Is it AI Overviews?
- Which content types are most affected?
- Break down the conversion rates by content category.
- Which topics should we prioritize based on current performance?
Budget allocation in marketing
Scenario: A product manager needs to reallocate a $50K monthly marketing budget across channels.
Data sources used: Google Ads, Facebook Ads, LinkedIn Ads, Google Analytics.
Example questions and follow-ups:
- How should I reallocate budget across channels to increase overall ROI?
- What happens if I move $15K from Facebook to Google Search?
- Which campaigns are wasting money and should be paused?
- Show me the diminishing returns threshold for each channel.
- What’s the optimal budget split based on historical performance?
Customer journey analysis
Scenario: An e-commerce company wants to understand the typical path customers take before purchasing. They connect multiple touchpoint systems to an AI tool to map the journey.
Data sources used: Google Analytics, HubSpot, Mailchimp
Example questions and follow-ups:
- What’s the typical path customers take before purchasing?
- Which touchpoints influence our highest-value customers?
- How long is our average sales cycle by lead source?
- What’s different about customers who convert faster?
- Show me where we’re losing potential customers in the journey.
Sales
Deal pipeline forecasting
Scenario: A B2B SaaS startup uses Salesforce to track deals but struggles with accurate forecasting. Their sales operations team connects Salesforce to ChatGPT to analyze pipeline patterns using natural language.
Data sources used: Salesforce
Example questions and follow-ups:
- Which deals in my pipeline are most likely to close this month?
- What signals indicate a deal will close? Break down the patterns.
- What’s the probability of hitting our $500K monthly goal?
- Show me deals stuck in the same stage for over 30 days. Why are they stuck?
- Which rep has the highest close rate and what are they doing differently?
Lead assessment and scoring
Scenario: A data analytics company gets leads from multiple sources but struggles to prioritize which ones sales teams should pursue first.
Data sources used: HubSpot, Google Ads, Facebook Ads, LinkedIn Ads, Google Analytics
Example questions and follow-ups:
- Which leads from our latest LinkedIn campaign show the highest purchase intent?
- What behaviors predict a successful conversion?
- How do demo requests compare to whitepaper downloads in terms of close rates?
- What’s causing the difference in conversion rates?
- What characteristics define our best customers?
Finance
Budget analysis and forecasting
Scenario: A CFO needs to prepare quarterly budget reports for stakeholders, with data across multiple systems.
Data sources used: QuickBook, Excel
Example questions and follow-ups:
- Which departments are significantly over budget this quarter?
- What’s causing these overruns? Break down by expense category.
- Project our burn rate if current spending continues.
- Which expenses could be reduced without impacting revenue growth?
- Show me month-over-month trends for the top 5 expense categories.
Revenue analysis
Scenario: A SaaS company tracks revenue across multiple customer segments and subscription tiers. The finance team wants to understand growth patterns without waiting for data analysts to build custom reports.
Data sources used: Stripe, Salesforce
Example questions and follow-ups:
- What’s our monthly recurring revenue growth rate by customer segment?
- Which segment is growing fastest and why?
- Break down revenue by product tier and identify trends.
- What’s causing the decline in the basic tier?
- Which customer segments have the highest expansion revenue?
Cost optimization and profitability analysis
Scenario: A startup needs to identify cost-cutting opportunities that won’t hurt growth. They connect their financial systems to an AI tool runs vibe analysis on expense patterns.
Data sources used: Xero, Excel
Example questions and follow-ups:
- What operational expenses could be reduced without impacting revenue growth?
- Show me the ROI of each major expense category.
- Which tools or services have overlapping functionality?
- What happens to profitability if we cut 20% from low-ROI expenses?
- Where are we overspending compared to industry benchmarks?
Simplify your business data integration with AI for vibe analytics
Try Coupler.io for freeVibe analytics best practices
Getting results from vibe analytics requires smart questioning and systematic validation. These practices help you extract reliable insights and build confidence in AI-generated analysis.
Crafting effective prompts
Be specific upfront. Replace vague requests like “Analyze our sales” with targeted questions: “Which products had declining sales in Q3 compared to Q2, broken down by region?“
Layer your questions. Start broad, then drill deeper based on what you find. After reviewing revenue trends, ask “Why did the Southeast region outperform others by 23%?” This iteration uncovers patterns traditional dashboards miss.
Add constraints. Define timeframes, segments, or filters: “Compare our top 10 customers by lifetime value in 2024 vs 2025, excluding one-time bulk orders.“
Use comparisons. Questions like “How does Facebook ad performance compare to Google Ads this quarter?” or “What changed between our successful March campaign and the underperforming April campaign?” reveal insights that single-view queries overlook.
Creating context-aware analytical workflows
Context-aware analytics means your AI understands the bigger picture, not just isolated questions. This turns scattered queries into connected insights.
Build conversational threads. Reference previous insights in follow-up questions: “Based on that campaign ROI analysis, which three underperforming campaigns should I pause to reallocate $15K budget?” The AI remembers your conversation flow, so each answer builds on the last. You uncover deeper insights without repeating yourself every time.
Build richer context by combining multiple data sources. With Coupler.io AI Integration, you can query across whatever data sources you’ve connected. The more sources you connect, the more comprehensive your context becomes. This allows you to get a complete picture, for example, to get understanding on customer journey from first click to final purchase.
Custom visualizations through natural language
Request specific charts. Tell the AI tool exactly what you need: “Create a funnel visualization showing drop-off rates at each checkout stage” or “Generate a trend line of MRR with annotations marking our three major product launches.” Specific requests produce visualizations that communicate insights clearly to stakeholders without manual chart building.
Iterate visually. Refine outputs with follow-ups: “Convert those numbers to percentages” or “Highlight our top 3 product categories in distinct colors and gray out the rest.” Visual iteration helps you emphasize the story in your data, making presentations and reports more impactful.
To build custom dashboards, you can request complete summaries. For example, ask “Create a one-page executive report with total revenue as a KPI card, revenue by channel as a horizontal bar chart, and month-over-month growth as a line chart.” This gives you presentation-ready dashboards in seconds without building them manually in Excel or BI tools
Setting up alerts and monitoring
You can “vibe” to set up automated monitoring and alerts. Instead of configuring complex rules in analytics platforms, simply describe what you want to track.
Here’s an example:
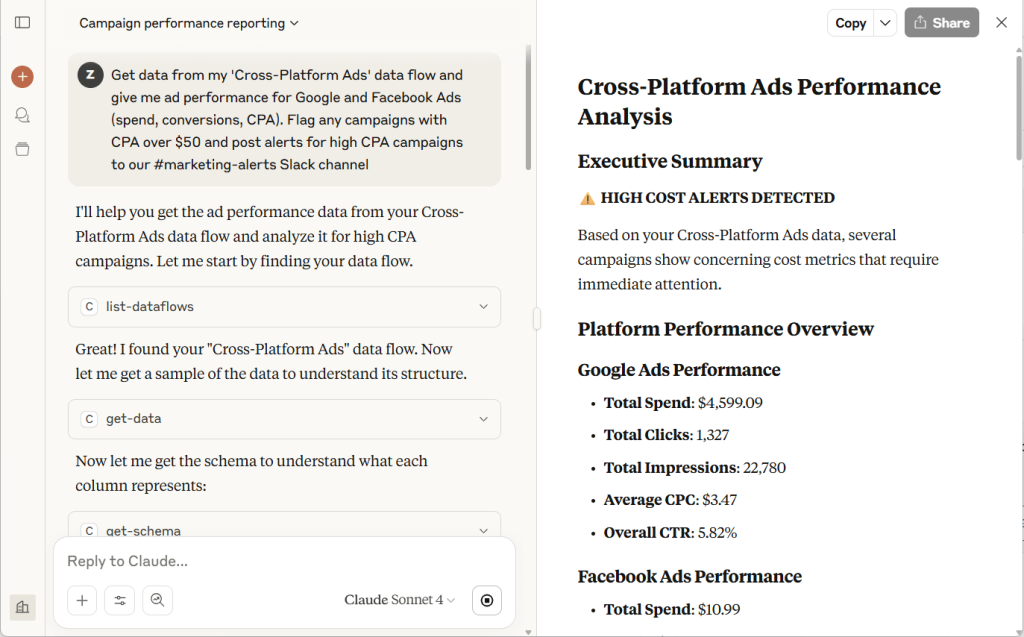
Imagine you need daily monitoring of your ad campaigns. With AI connected to Coupler.io (for ad data) and Slack, you can set up automated monitoring conversationally:
Prompt:
Get data from my ‘Cross-Platform Ads’ data flow and give me ad performance for Google and Facebook Ads (spend, conversions, CPA). Flag any campaigns with CPA over $50 and post alerts for high CPA campaigns to our #marketing-alerts Slack channel.
Result:
Your AI tool accesses your dataset through Coupler.io, identifies problem campaigns, and posts alerts to your team’s Slack channel. All from one conversation—no complex configuration needed.
Building confidence in AI-generated insights
Vibe analytics delivers speed and accessibility, but trust comes from validation. Before making significant business decisions based on AI-generated insights, verify accuracy through systematic checks. Here’s how:
Test with known answers. Start by asking questions you already know the answers to. If the AI correctly identifies last quarter’s top campaign, you can trust it for exploratory analysis.
Cross-check with existing tools. Run the same query in both vibe analytics and your BI dashboards or Excel reports. Matching results build confidence; discrepancies signal data infrastructure problems to investigate.
Verify unexpected findings. When gen AI surfaces surprising patterns, ask: “Show me the raw data and calculation method behind this claim.” Review the underlying numbers before acting on insights.
Get expert validation. Have data analysts review important findings before major business decisions. Combine AI speed with human expertise for critical choices.
Know the limitations. Vibe analytics requires clean data. With poor data quality, treat results as exploratory only. Fix data infrastructure issues before relying on AI for critical decisions.
The unique vibe analytics advantage: What traditional dashboards can’t do
Traditional dashboards answer only the questions they were built to answer. Need to explore a new pattern? You submit a ticket, wait for data analysts to write SQL queries, and get your answer days later. Traditional BI dashboards are static snapshots that can’t adapt when your questions evolve. They force you to know what to ask before you start.
Vibe analytics enables improvisational discovery through natural language dialogue. Ask a question, get an answer, then immediately follow-up “What’s driving this?”
The AI-powered system adapts to your thinking, surfaces unexpected patterns, and connects dots across your dataset instantly. No SQL required. No waiting.
LLMs understand context from previous questions, so each follow-up builds naturally. This shifts data analytics from “point-and-click” to “ask-and-discover”.
And it’s available to everyone, not just technical teams.
Ready to move beyond static dashboards? Connect your business data to AI tools with Coupler.io and start “vibing” 😀
