How to Connect LinkedIn Ads to Claude for Efficient Paid Ads Performance Analysis

Campaign Manager in LinkedIn Ads gives you campaign-level CPL and CTR. It does not show you which audience segment is driving cost, which creative is generating leads, or how your Lead Gen Forms compare to website click campaigns. This is where AI comes in.
Analyzing LinkedIn Ads data with Claude means asking those questions directly and getting answers from data rather than building manual cross-references every time you need them. Here is how to connect LinkedIn Ads to Claude and what you can do once the data is live.
How to use Claude with LinkedIn Ads
| Connection method | What data it reaches | Setup effort | Best for | Watch out for |
| Coupler.io | Full LinkedIn Ads dataset: campaigns, creatives, audience dimensions, Lead Gen Forms, video ads | Low, no code, no API keys | Recurring LinkedIn Ads performance analysis, multi-account reporting, cross-platform analysis | Automated refresh on paid plans |
| Manual export (Campaign Manager CSV) | Campaign performance, ad performance, demographics, conversion performance | Medium, one export per session | One-time review of a specific period | No scheduling, no cross-dimensional joins |
| Community MCP server (e.g., linkedin-ads-mcp) | LinkedIn Ads campaign and creative data via Marketing API | High, requires LinkedIn Developer App, OAuth, local install | Conversational queries for teams with engineering capacity | Token expiry, complex setup, no scheduled refresh |
| LinkedIn Marketing API + Python | Full LinkedIn Ads data programmatically | High, build and maintain a pipeline | Custom attribution models, proprietary pipelines | OAuth management, API rate limits, ongoing engineering work |
Coupler.io is the only method that handles calculations before Claude sees the data. That matters because Claude interprets numbers well but produces unreliable results when it computes across large or summarized datasets. Coupler.io runs the math and returns verified results. Claude explains what they mean.

Analyze your LinkedIn Ads data in Claude with Coupler.io.
Get started for freeClaude LinkedIn Ads connector by Coupler.io for conversational PPC analytics
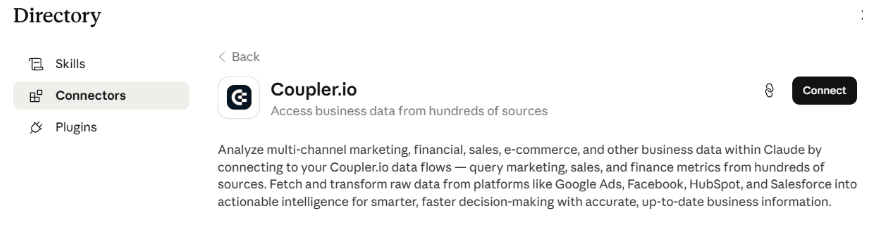
Coupler.io is a data integration platform and AI analytics solution that connects your LinkedIn Ads data to Claude through an MCP server. It provides a Claude connector for over 400 data sources, so LinkedIn Ads data can sit alongside Google Ads, HubSpot, or GA4 in the same conversation. In addition to Claude, you can connect business data to ChatGPT, Gemini, and other AI tools.
Coupler.io serves as a middle layer between LinkedIn Ads data and Claude. The Coupler.io Analytical Engine handles all calculations, including cross-dimensional joins, weighted CPL averages, spend-to-lead ratios, and more. Claude does not do math but interprets the results provided by Coupler.io.
The data refreshes on a schedule you set. So when you ask Claude about your LinkedIn Ads campaign performance, the answer reflects what is happening now. This is how teams generate LinkedIn Ads insights with Claude AI without waiting on a manual export cycle.
Step 1: Create a data flow for your LinkedIn Ads data
Create a new data flow in Coupler.io to connect LinkedIn Ads to Claude. Use the form below, then click Proceed to sign up for Coupler.io for free.
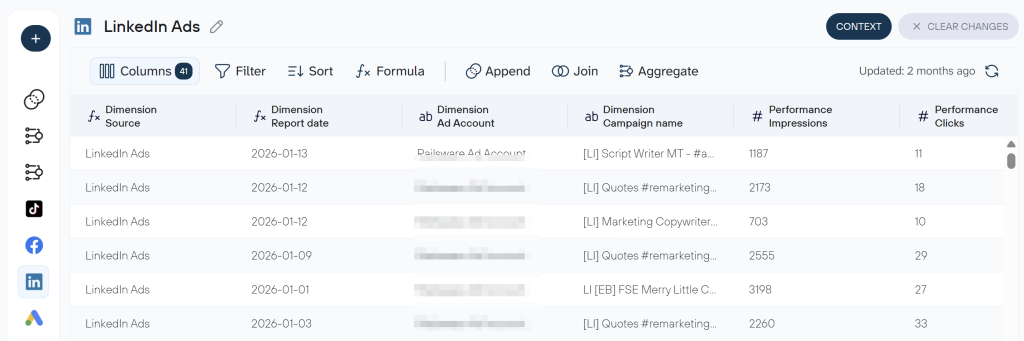
Connect your LinkedIn Ads account and select which ad accounts to include. Then choose a report type from three categories: Reports (Ad analytics by single dimension, Ad analytics by multiple dimensions), Leads generation (Sponsored leads), and Core components (Campaigns, Creatives, Video ads, Shares, Conversions, Campaign groups).
For Ad analytics by single dimension, select the dimension you want to break performance down by seniority, job title, job function, company, or campaign. You can select up to 18 metrics per report. Plus, other data sources like Google Ads, GA4, or HubSpot can be connected in the same data flow for cross-platform analysis.
Coupler.io previews your data and lets you make it ready for analysis in Claude. You can hide columns, add calculated metrics, aggregate data, or combine information from other connected sources. It is also useful to attach business context to your data set, such as conversion definitions and naming conventions, so Claude interprets the data correctly from the first query.
Step 2: Connect Claude
With your dataset ready, time to integrate your data to Claude. Select it as the destination and click Get connector to open the Coupler.io connector page in the Claude app. Authorize access to your Coupler.io workspace.
Once connected, the Coupler.io connector appears in your Claude session. Back in Coupler.io, click Save and Run to load the first dataset.
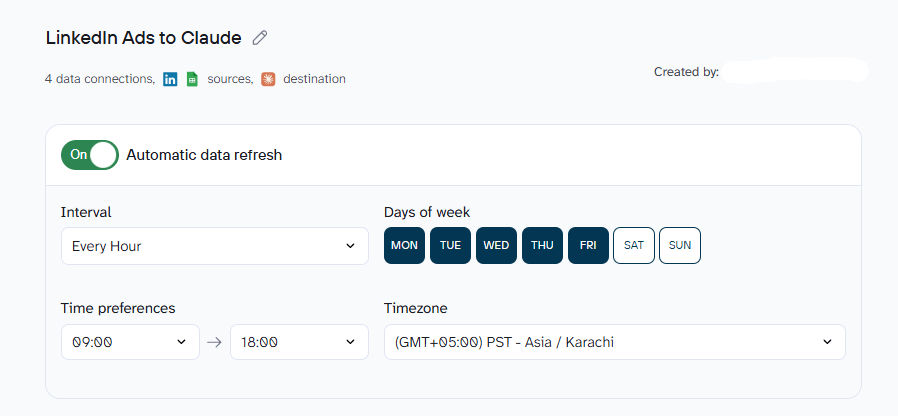
Set a refresh schedule. This is what automates your LinkedIn Ads reporting workflow so Claude always pulls from current performance data rather than a static snapshot.
Step 3: Start a conversation with Claude about your LinkedIn Ads
Open Claude at claude.ai or in Claude Desktop after the first successful run. Claude will prompt you to authorize the Coupler.io MCP server connection. Approve it, and your LinkedIn Ads data is available.
Here is an example of a prompt to start with:
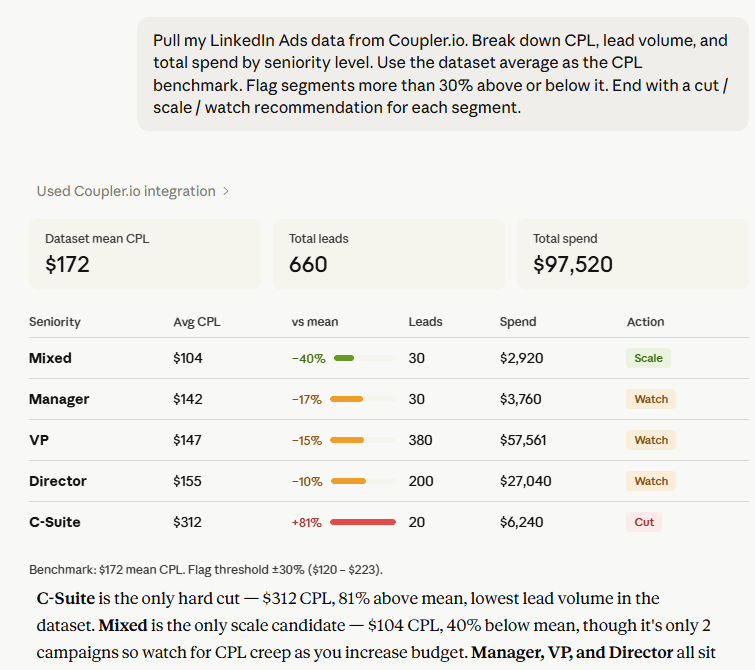
Pull my LinkedIn Ads data from Coupler.io. Break down CPL, lead volume, and total spend by seniority level. Use the dataset average as the CPL benchmark. Flag segments more than 30% above or below it. End with a cut / scale / watch recommendation for each segment.
What LinkedIn Ads data you can connect to Claude
The LinkedIn Ads data connector in Coupler.io supports these report types. Each one unlocks a different layer of analysis in Claude:
- Campaigns: campaign-level metrics including impressions, CTR, CPC, CPL, spend, objective, targeting parameters, and job titles. The foundation for LinkedIn Ads campaign analysis Claude performs includes budget allocation comparisons, cost efficiency by objective, and spend pacing across active campaigns.
- Campaign groups: grouped campaign performance for budget management and pacing analysis across related campaigns.
- Creatives: individual ad creative performance including CTR, CPM, CPC, conversions, and engagements. LinkedIn Ads creative analysis with Claude starts here and helps compare single image, carousel, document, and text ad formats against each other on the metrics that matter.
- Video ads: views, viewing rate, and engagement data. Covers LinkedIn Sponsored Content analysis Claude runs for video formats specifically.
- Ad analytics by single dimension: performance metrics broken down by one chosen dimension, which can be campaign, creative, company, job title, seniority, or industry. Because LinkedIn consolidates all campaign types into a single master Ad Analytics dataset, this report also enables LinkedIn Message Ads analytics with Claude alongside Sponsored Content. This is the report that makes audience segment CPL breakdowns possible.
- Ad analytics by multiple dimensions: breakdown combining two dimensions simultaneously. For example, campaign plus creative. Returns dimension IDs and requires a Join with campaign or creative data for readable labels.
- Sponsored leads: Lead Gen Form submission data including form opens, completions, completion rates, and CPL per form. This is what enables the LinkedIn Lead Gen Forms analysis Claude can perform. It’s a data type specific to LinkedIn with no equivalent in other platforms covered in this series.
- Conversions: conversion tracking for website and offline events, with attribution by campaign and creative.
- Shares / Sponsored Content: sponsored post data for single image, carousel, and document ad formats. Covers creative-level engagement for Sponsored Content campaigns.
You can select up to 18 metrics per report. If you need more, Coupler.io has a documented workaround.
Examples of how you can analyze LinkedIn Ads data with Claude
Here are three examples of LinkedIn analytics worth running once your LinkedIn Ads data is connected. Each one answers a question most B2B marketers are already asking but haven’t had a fast way to get to the answer.
Find which creatives are driving leads
B2B marketers running multi-creative campaigns often have no idea which specific creative is generating leads. Campaign Manager reports total conversions at the campaign level. Getting a creative-level CPL breakdown requires exporting a separate creatives report, downloading an ad analytics report, and aligning the two by campaign ID. Most skip it until a campaign is already over budget.
Once your LinkedIn Ads data is in Coupler.io, you can ask Claude to do it in seconds:
My LinkedIn Ads data is connected via Coupler.io. For each campaign active in the last 60 days, break down performance by creative. Show CTR, CPL, and total leads per creative. Flag any creative that has spent more than $500 but generated zero leads.
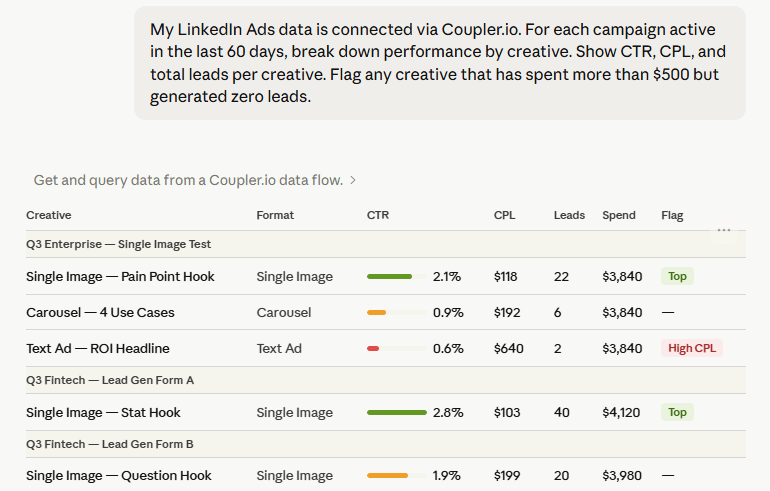
Claude returns a ranked creative breakdown with CPL and CTR per creative, flagging zero-conversion spends directly. It also identifies format patterns, whether single-image consistently outperforms carousel, or whether the gap is in headline copy rather than visual format.
The threshold to keep in mind is that any creative consuming more than 20% of a campaign budget with zero conversions should be paused, not A/B tested further. Claude surfaces these without requiring manual calculation across two separate exports.
Break down CPL by audience segment
LinkedIn’s targeting precision is what separates it from every other ad platform in this series. You can reach a Head of Data at a 500-person SaaS company. You can also accidentally pay $400 to reach a junior analyst at the same company if your seniority targeting is too broad. CPL at the VP level and CPL at the Manager level are structurally different numbers. The audience pool is smaller, the competition is higher, and the buying intent may be completely different.
Without breaking down LinkedIn Ads performance analysis with Claude by seniority and job function, budget optimization is based entirely on guesswork.
Using my LinkedIn Ads data from Coupler.io, break down CPL and conversion rate by job seniority level and job function for the last 90 days. Which audience segments are delivering leads below my target CPL of $150? Which are significantly over it? Suggest targeting adjustments based on the data.
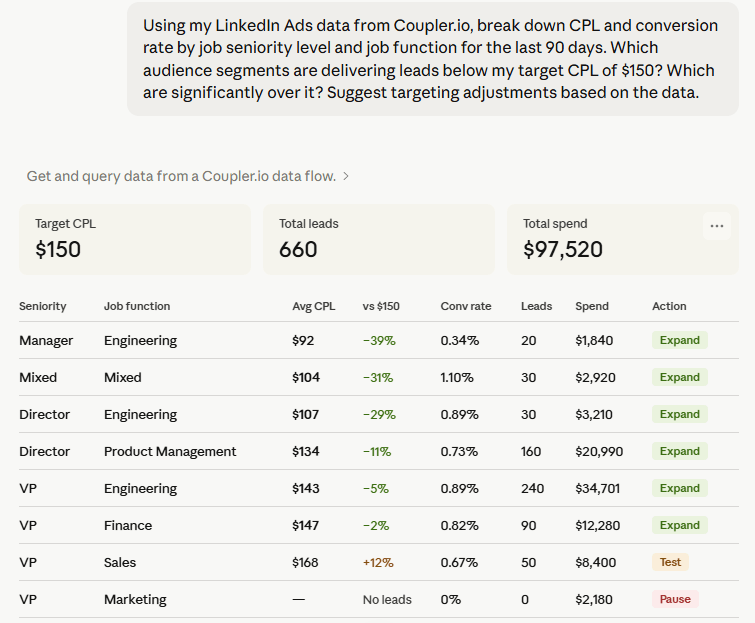
Claude returns a segmented breakdown of CPL and conversion rate by seniority and job function. High-CPL segments with low conversion rates get flagged for exclusion or bid reduction. Strong-performing segments become candidates for budget reallocation or audience expansion.
If your campaign uses Lead Gen Forms, the CPL you see reflects in-platform submissions. If it drives to a website, it reflects landing page conversions. These are not the same event. A $90 Lead Gen Form CPL and a $90 website conversion CPL might look identical in a cross-campaign report but represent completely different buyer journeys. Attach that distinction in Coupler.io’s context feature before running the query so Claude is not comparing apples to entirely different fruit.
Diagnose Lead Gen Form performance
LinkedIn Lead Gen Forms are a native lead generation format. The user submits a pre-filled form inside LinkedIn without leaving the platform. The upside is that there’s little to no friction. The downside is that Campaign Manager buries the form-level data. Completion rate, CPL per form variant, and how in-platform leads compare to website conversion leads require navigating across multiple Campaign Manager tabs and building a manual comparison.
Pull my LinkedIn Lead Gen Form data from Coupler.io. For the last 30 days, show form completion rate, total leads, and CPL for each form variant. Compare CPL from Lead Gen Forms against CPL from website click campaigns running in the same period.
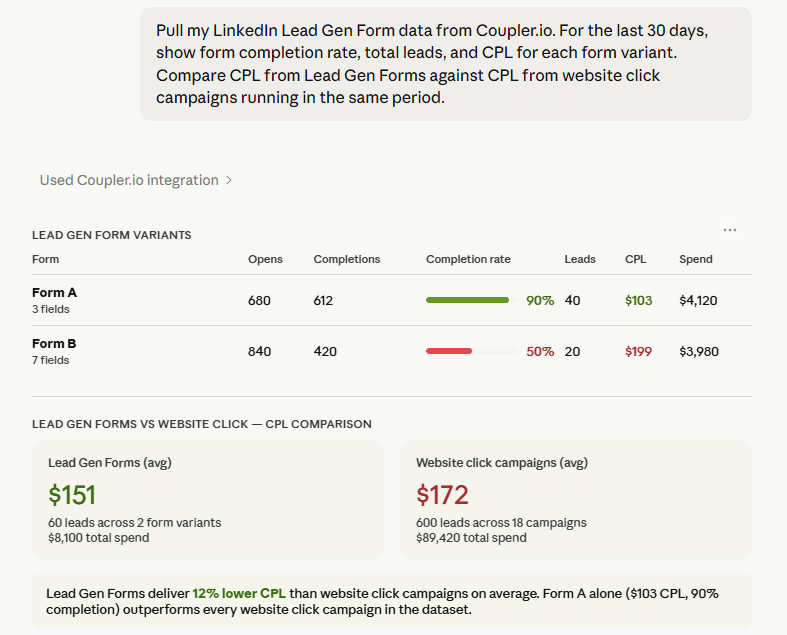
Claude returns form-level breakdown by completion rate and CPL per variant, alongside a direct comparison with website click campaign CPL. The output drives a real budget decision: whether to shift spend toward in-platform lead generation or toward driving traffic to a landing page, based on actual CPL differences rather than assumptions.
Completion rates below 10% on a Lead Gen Form usually indicate one of two things: too many fields for the audience’s patience, or an offer that does not create enough urgency to complete in the moment.
Talk to Claude about your LinkedIn Ads performance
Try Coupler.io for free.Top 5 Claude prompts for LinkedIn Ads performance analysis
Use these to summarize LinkedIn Ads results with Claude or go deeper on specific performance dimensions. Each prompt is ready to copy into Claude after connecting your LinkedIn Ads account through Coupler.io:
Which campaigns are on track to exhaust their budget before the end of the month? Show spend to date, daily burn rate, and projected days remaining for each active campaign. |
Show average ad frequency by campaign for the last 30 days. Flag any campaign where frequency exceeds 3 — those audiences may be experiencing fatigue and need creative rotation. |
Compare performance across campaign groups. Show total spend, leads generated, CPL, and CTR for each group. Flag any group where CPL has increased more than 15% compared to the prior period. |
Break down CPL and impressions by job title targeting for the last 90 days. Which job titles are converting at the lowest CPL? Flag any title segment spending over $1,000 with zero conversions. |
For every Lead Gen Form in my account, show form opens, completions, completion rate, and CPL over the last 30 days. Which forms have the highest drop-off between opens and completions? |
What matters when you connect LinkedIn Ads data to Claude
LinkedIn Ads analysis in Claude is only as reliable as the data going in. Here are four places where it typically breaks, and what fixes each one.
Attach context like metric and conversion definitions before your first query
LinkedIn Ads uses “conversions” to mean different things depending on the campaign objective. A click to a website, a Lead Gen Form submission, and a custom conversion event can all appear in the same conversions column in Campaign Manager. Without definitions attached to the dataset, Claude treats these as interchangeable and the analysis produces wrong CPL figures across campaigns using different conversion types. Coupler.io’s context feature lets you define which conversion type each dataset tracks once, and those definitions persist across every query.
Calculations that require weighted averaging
CPL comparisons across a LinkedIn Ads account require weighting by spend. A campaign that spent $200 and generated 2 leads at $100 CPL should not carry the same weight as a campaign that spent $20,000 and generated 200 leads at the same CPL. The two are not comparable at face value. The Analytical Engine applies the correct weighting before Claude sees the numbers. Claude interprets the output rather than running the arithmetic, which is what makes the result trustworthy across large campaign datasets.
Pre-built skills for paid performance analysis
Two skills from Coupler.io’s skills library apply directly to LinkedIn Ads workflows. The marketing-analytics skill covers paid, organic, email, and social performance, which means it handles LinkedIn Ads campaign analysis, cross-channel CPL comparison, and anomaly detection without a custom prompt for each query.
The report-generation skill takes that output and formats it into a validated report with a TL;DR, key metrics, context, recommendations, and open questions, with an arithmetic check before the report finalizes. For teams presenting LinkedIn Ads results to clients or leadership, both skills together mean the analysis and the deliverable come out of the same Claude conversation.
Sending the same data to multiple destinations
The same Coupler.io flow that connects your LinkedIn Ads data to Claude can simultaneously load data to Google Data Studio, Google Sheets, Power BI, or BigQuery. It will keep your LinkedIn Ads dashboard up to date for stakeholders who need visuals rather than a conversation. One connection, two outputs, no second export step. For more on Coupler.io’s AI integrations, see the AI integrations overview.
Other ways to connect LinkedIn Ads to Claude
These alternatives each serve a specific situation. Coupler.io covers the recurring analysis use case, but for one-off reviews, technical teams, or custom pipelines, the options below are worth knowing.
Manual export
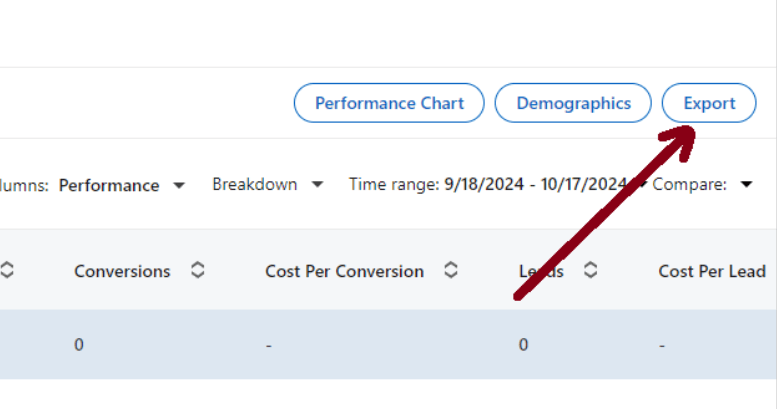
In Campaign Manager, navigate to the campaign groups, campaigns, or ads you want, confirm the date range, and click Export. Select a Report Type: Campaign performance, Ad performance, Demographics, or Conversion performance. Choose a column view and time breakdown (Daily, Monthly, or All) and download the CSV.
This one’s fine for a one-off audit of a specific flight period. The issue surfaces when the same analysis needs to run again next week. The export, clean, and upload cycle repeats from scratch. And there is no way to join campaign performance against creative performance in a single export, which means the most useful LinkedIn Ads comparisons require manual assembly every time.
Community MCP servers
Two community-built MCP servers connect LinkedIn Ads directly to Claude: linkedin-ads-mcp by Daniel Popa and mcp-linkedinads by radiateb2b. Both use the LinkedIn Marketing API and handle campaign analysis, creative analysis, and benchmarking. They are meaningfully more capable than a basic data extraction tool.
Getting them running is not trivial. You need to register a LinkedIn Developer App, complete an OAuth authentication flow in the terminal, install the server locally via npm, and manually edit your Claude Desktop config JSON. When your LinkedIn access token expires, the connection breaks and the auth flow starts again.
These servers are a reasonable choice for technically comfortable teams who want ad hoc LinkedIn Ads queries without a subscription.
What they cannot do: scheduled data refresh, multi-account aggregation, cross-platform joins with Google Ads or HubSpot, or persistent business context across sessions. Coupler.io’s connector is also MCP-based but available as a ready-to-use connector in Claude’s directory with no local server, no Developer App, and no token to rotate.
LinkedIn Marketing API + Python
The LinkedIn Marketing API uses separate REST endpoints for performance data (Ad Analytics API) and campaign metadata (Campaign Management API). Getting a complete picture requires querying both and joining on campaign ID. Authentication runs through OAuth 2.0 with r_ads and r_ads_reporting scopes. There is no official Python SDK, so most teams build directly against the API using requests and handle pagination manually.
The 18-metric-per-request cap applies here too. The right case for building this is custom attribution: joining LinkedIn Ads conversions against CRM records or modeling multi-touch across channels. For standard campaign analysis, it is more infrastructure than the problem requires.
Which method should you choose?
Coupler.io is the fastest way to connect LinkedIn Ads to Claude for recurring performance analysis. Any question you plan to ask Claude more than once, such as CPL by audience segment, creative fatigue tracking, Lead Gen Form optimization, and budget pacing all belong in a scheduled data flow. Setup takes around five minutes.
Manual export works for a one-time review. Once you need the same analysis refreshed with current data, the manual process costs more time than it saves.
Community MCP servers suit technically capable teams who want direct conversational access to LinkedIn Ads without an additional subscription. OAuth management and local setup are the tradeoff.
The LinkedIn Marketing API is the right choice for custom attribution models or proprietary reporting workflows too specific for an off-the-shelf connector.
FAQs
Can I analyze multiple LinkedIn Ads accounts with Claude?
Yes. When configuring the source in Coupler.io, you select which ad accounts to include from a dropdown. All selected accounts feed into the same dataset. This is particularly useful for agencies managing several clients. You can ask Claude to compare performance across accounts or segment the analysis by account in a single conversation.
Is connecting LinkedIn Ads to Claude safe?
Yes. Coupler.io operates as a read-only layer between your LinkedIn Ads account and Claude. Your LinkedIn Ads data is delivered through an encrypted, token-based MCP connection. Claude can read and analyze what the data flow contains but cannot modify campaigns, adjust budgets, or access anything outside what you’ve shared. Your LinkedIn credentials never reach Claude directly. Coupler.io is SOC 2 Type II certified, GDPR compliant, and HIPAA compliant.
Can I combine LinkedIn Ads with Google Ads or HubSpot in the same analysis?
Yes. Coupler.io supports multiple data sources in one data flow. Connecting Google Ads alongside LinkedIn Ads lets you compare CPL across platforms in the same conversation. Adding HubSpot brings CRM data into the picture so you can ask Claude which LinkedIn Ads leads progressed to pipeline and whether the CPL held up against actual revenue attribution.
Does this work on both Claude.ai and Claude Desktop?
Yes. The Coupler.io connector installs through Claude’s connector directory on both the Claude web app and Claude Desktop. The data refresh schedule runs independently of whichever interface you use.