JSON output is the default for almost every API, webhook, and app that doesn’t have a native connector. The data is in the form of nested objects, cryptic field names, and arrays inside arrays. Paste that into Anthropic’s Claude, and you’ll get somewhere, but not far.
The right method to upload JSON to Claude depends on where your data lives: a static file on your desktop, or a live API that updates constantly. In this article, I walk you through how each method works, so you can pick the one that fits your data and your team.
Choose the right method to connect JSON data to Claude
| Connection method | Setup effort | Who does the math | Best for | Watch out for |
|---|---|---|---|---|
| Coupler.io | Low: no code required | Analytical Engine | Recurring analysis from live APIs or large JSON datasets | – |
| Manual file upload | None | Claude | One-off analysis of a static JSON file | 30MB file limit, no scheduling, no refresh |
| Paste JSON into chat | None | Claude | Quick queries on small snippets | Context window limits, no persistence |
| Custom MCP server | High: requires development | Claude | Full control over tool access, internal or proprietary systems | Build, host, and maintain cost |
| API scripts | High: requires engineering | Claude | Scheduled pulls from specific endpoints | Both APIs need proficiency and ongoing maintenance |

Connect your JSON data to Claude with Coupler.io
Get started for freeConnect JSON data to Claude with Coupler.io
Coupler.io is a no-code data integration platform with AI analytics support. It connects data from over 400 sources to AI tools, such as Claude, ChatGPT, Gemini and more. The connection is based on the Coupler.io MCP server, which requires zero technical knowledge to use for your data integration with AI. You will forget about CSV exports, manual uploads, and hand-cleaning nested JSON.
The connector accepts any REST API endpoint or webhook payload directly, making it easy to transform JSON with Claude as the destination.
Before the data reaches Claude, Coupler.io transforms nested objects and arrays into structured tables, renames fields, and refreshes on a schedule. This way, Claude works with clean data, and you get accurate answers.
It only takes a couple of minutes to connect your business data to Claude with Coupler.io. Here’s a step-by-step walkthrough.
Step 1: Create a data flow for your JSON source
Sign up for a free Coupler.io account. Create a new data flow and select JSON as your source, or use the form below.
In the source settings, paste your API endpoint URL and configure authentication with API keys, bearer tokens, or custom headers.
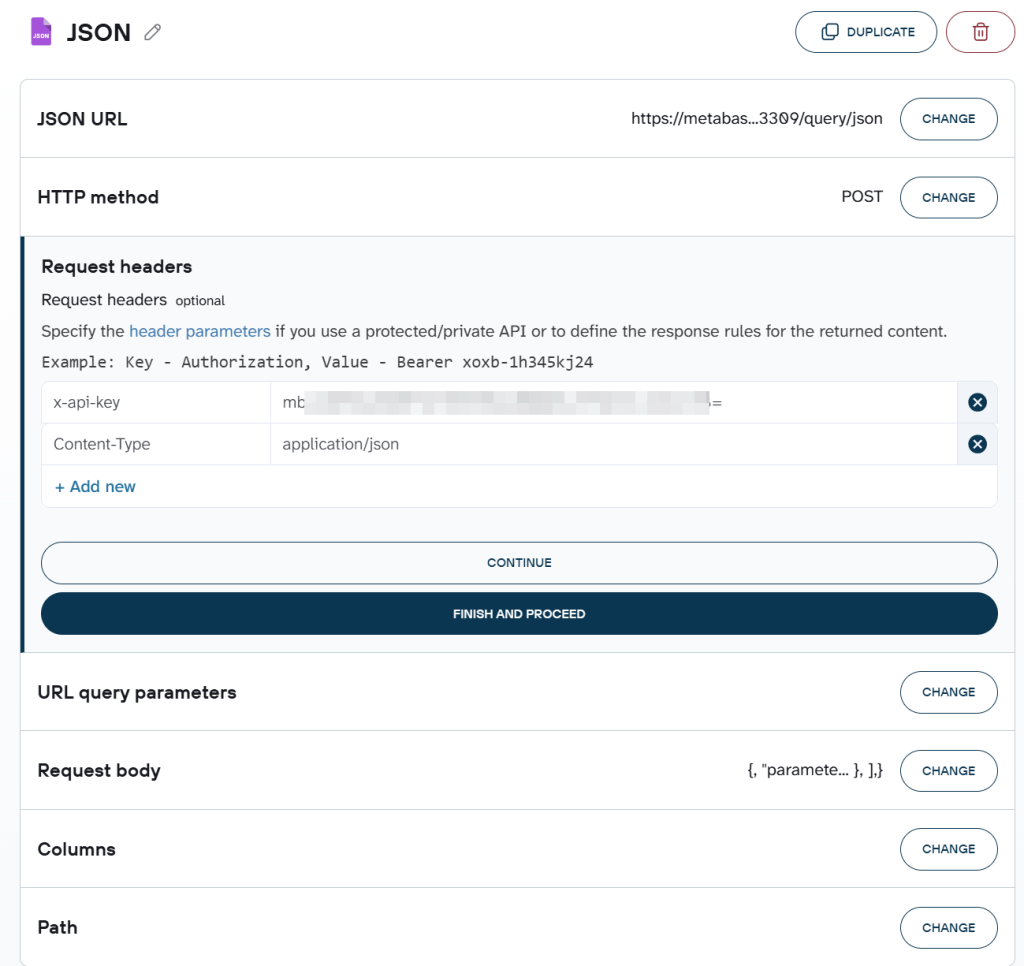
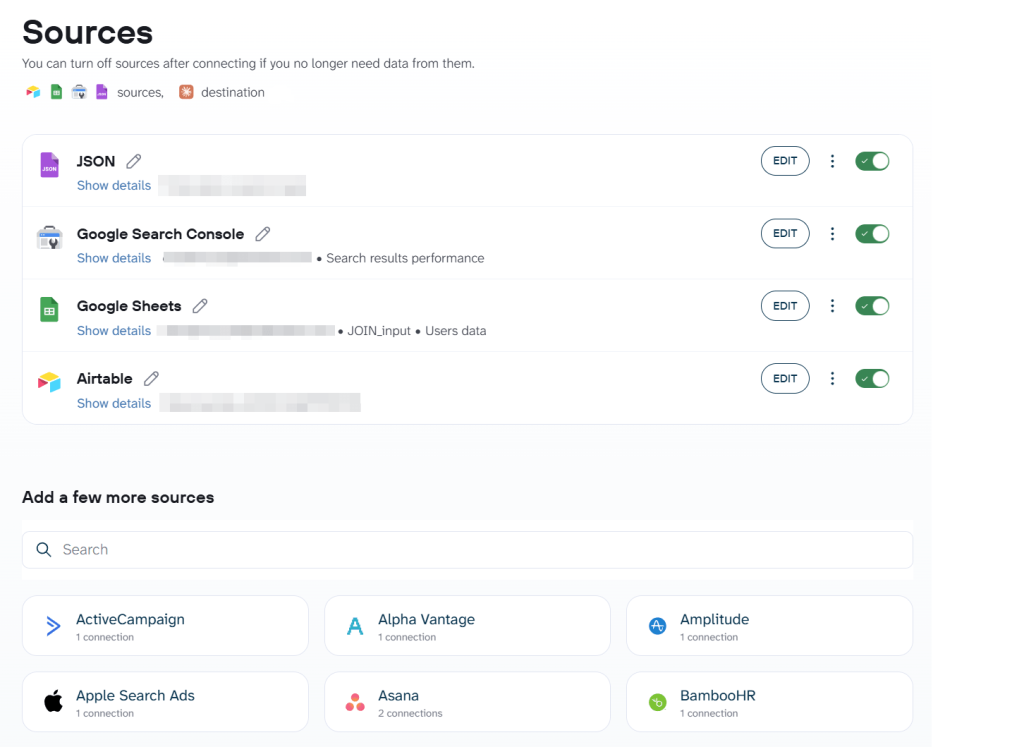
You can connect multiple endpoints or blend JSON data with information from other apps. Coupler.io supports over 400 ready-to-use Claude integrations.
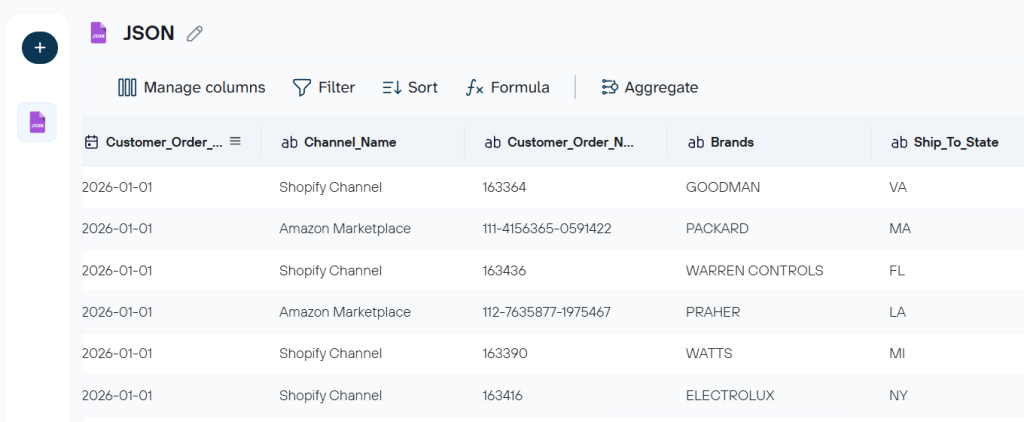
Then organize nested fields, hide columns you don’t need, rename cryptic keys, and so on to make your dataset analysis ready in AI. This is where parsing happens before Claude ever sees the data.
Step 2: Connect Claude
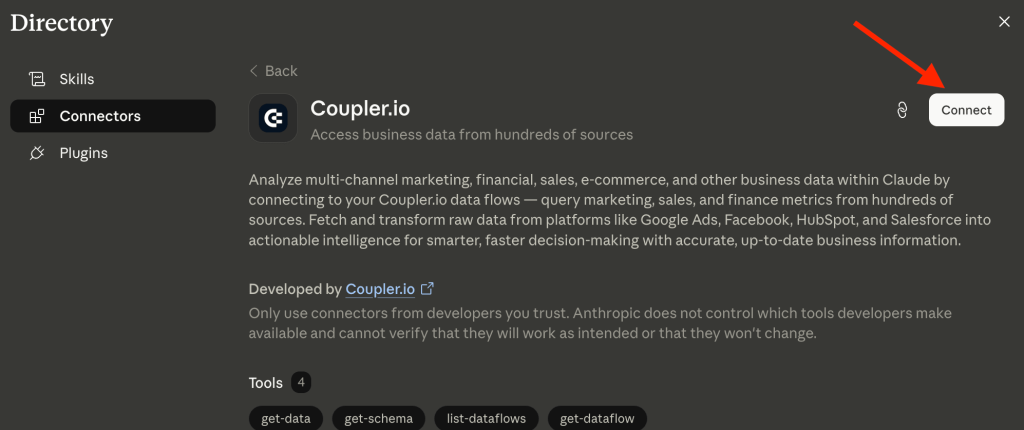
Select Claude as your destination and click Get connector. This opens the Coupler.io connector page directly inside the Claude app.
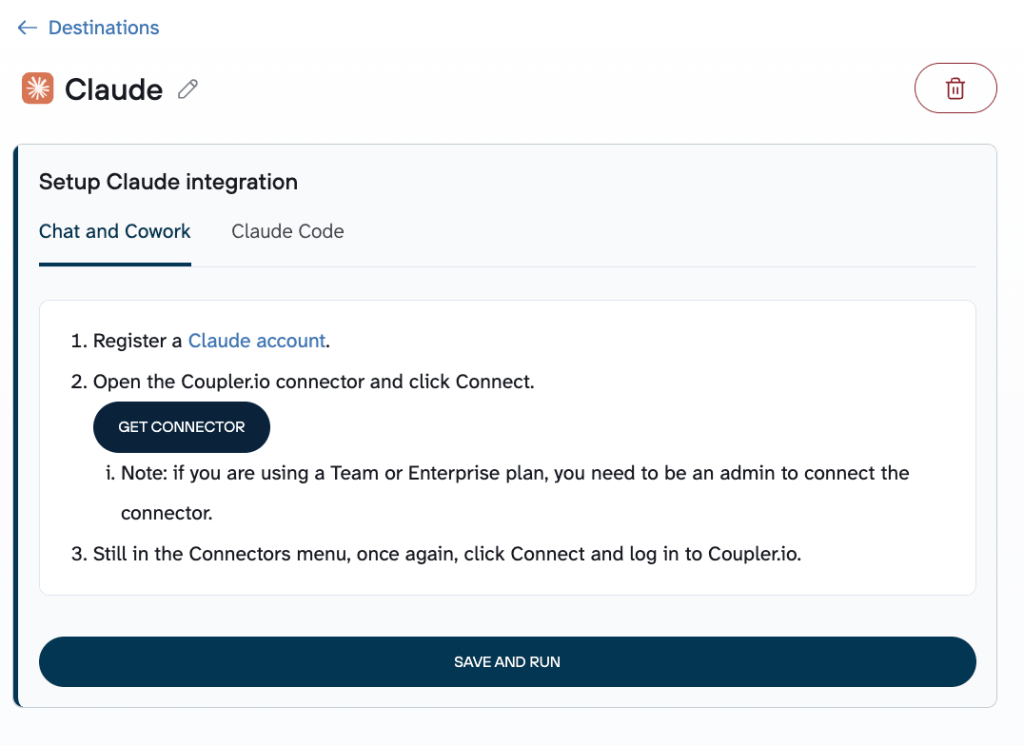
Connect and authorize Coupler.io to share data with Claude.
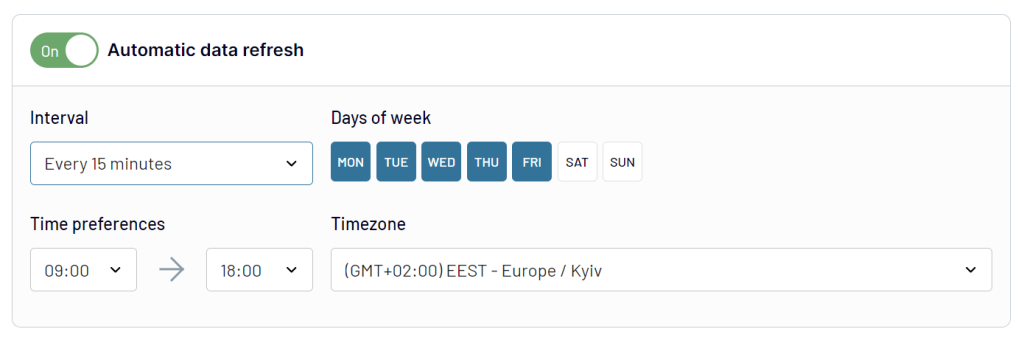
Set your refresh schedule: hourly, daily, or weekly, depending on how often your JSON source updates. Now, click Save and Run.
Step 3: Start analyzing your JSON data in Claude
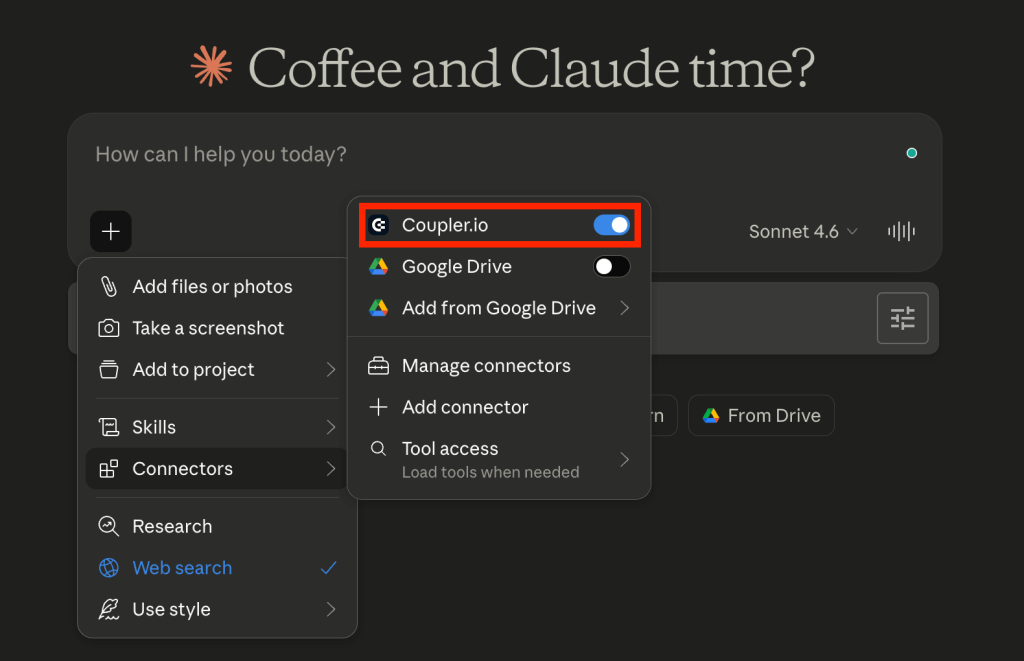
After the first successful run, open Claude. Toggle the Coupler.io connector in the list of Claude data connectors. This will give access to the Coupler.io MCP server.
Your JSON data is now available as a structured dataset. Ask Claude anything about your data in plain language.
For example, if you connected an order export from a custom app: “What was total revenue by product category last month, and how does that compare to the month before?“
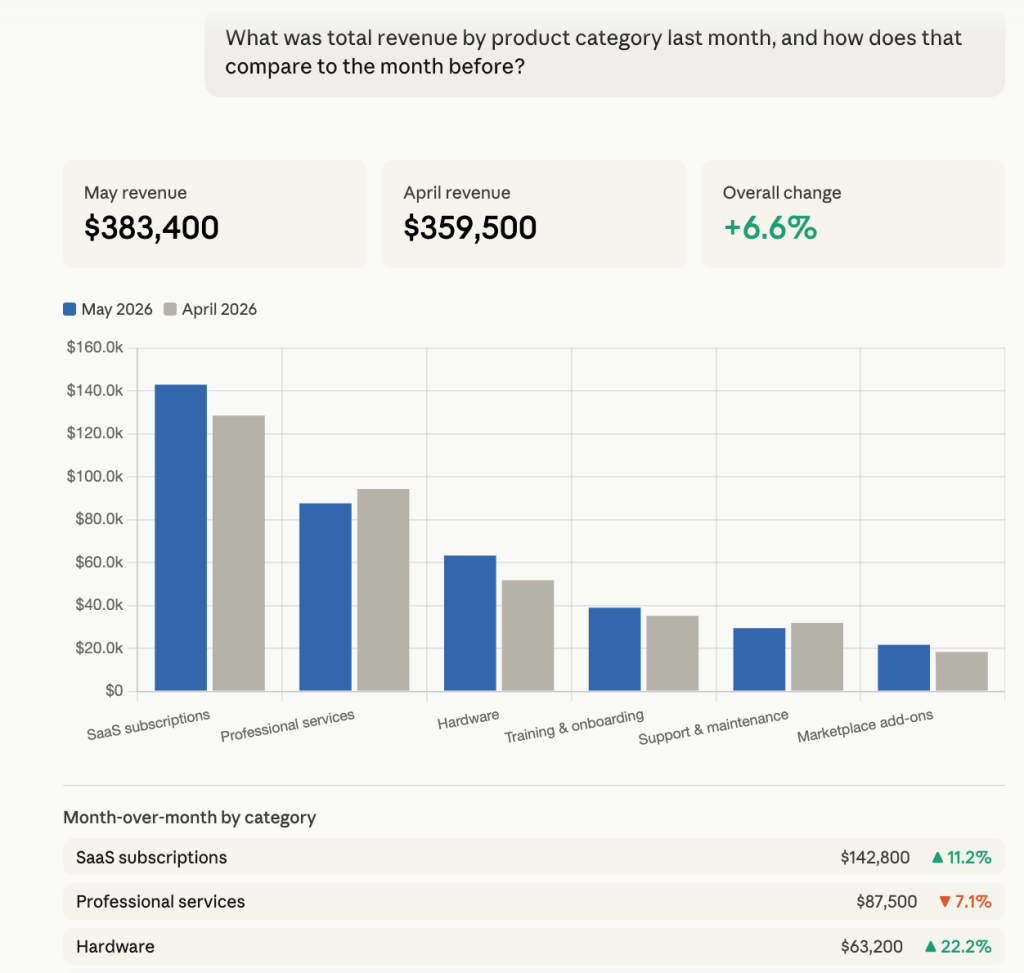
In this interpretation, Claude breaks down revenue by product category, compares it against the previous month, and flags which categories grew and which dropped.
Let Coupler.io parse your JSON before Claude sees it
Get started for freeExamples of how to use Claude with JSON
The setup of the JSON data connector by Coupler.io above works the same regardless of where your JSON comes from. What changes is the kind of question you ask Claude once the data lands. These three use cases show what that looks like in practice.
Analyze order or event data from a custom app export
Many internal tools and niche platforms manage order or event data, but don’t connect to BI tools natively. Without a connector, the only way to analyze it is to export it manually, clean the nested structure, and load it somewhere. This process takes time and breaks the moment the data updates.
By connecting the API endpoint to Coupler.io, the data is structured and on schedule for Claude. From there, Claude returns a category-level breakdown with trend indicators for each. What would have taken a pivot table and manual cleaning takes one question.
What was the total revenue by product category last month, and how does that compare to the month before? Flag any categories where revenue dropped more than 10% |
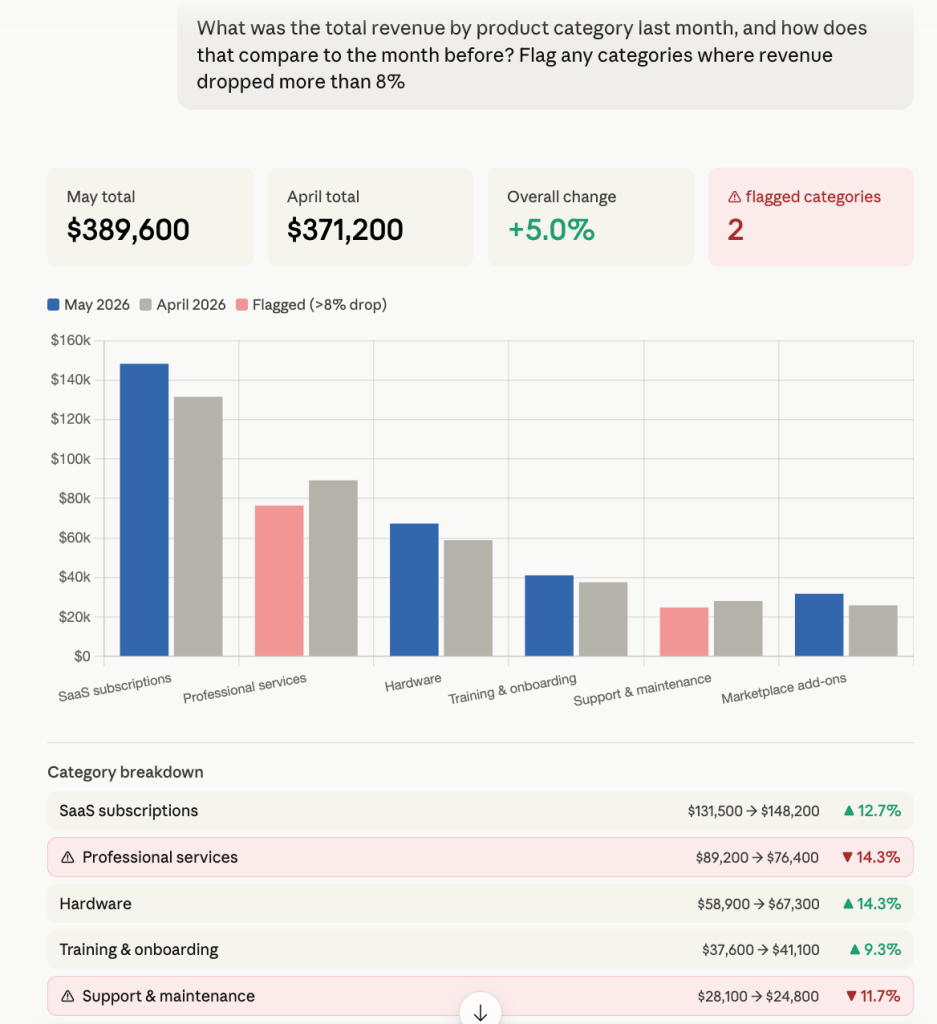
To dig deep, you can ask Claude to drill into specific categories, identify the orders driving the drop, or compare performance across a longer date range.
Understand lead or pipeline data from webhook payloads
CRMs and form tools fire a JSON payload every time a lead is created, a deal moves stages, or a contact updates. Most teams never analyze these payloads in aggregate because they’re scattered across webhook logs with no easy way to query them. This results in pipeline reviews that rely on CRM dashboards that don’t show where leads are actually stalling.
To understand this, ask questions like:
Where in the pipeline are deals most likely to stall? Show me the number of deals that entered and exited each stage over the last 60 days, and flag any stage where the average time increased compared to the previous period. |
Claude returns a stage-by-stage breakdown with entry and exit counts and average time in stage.
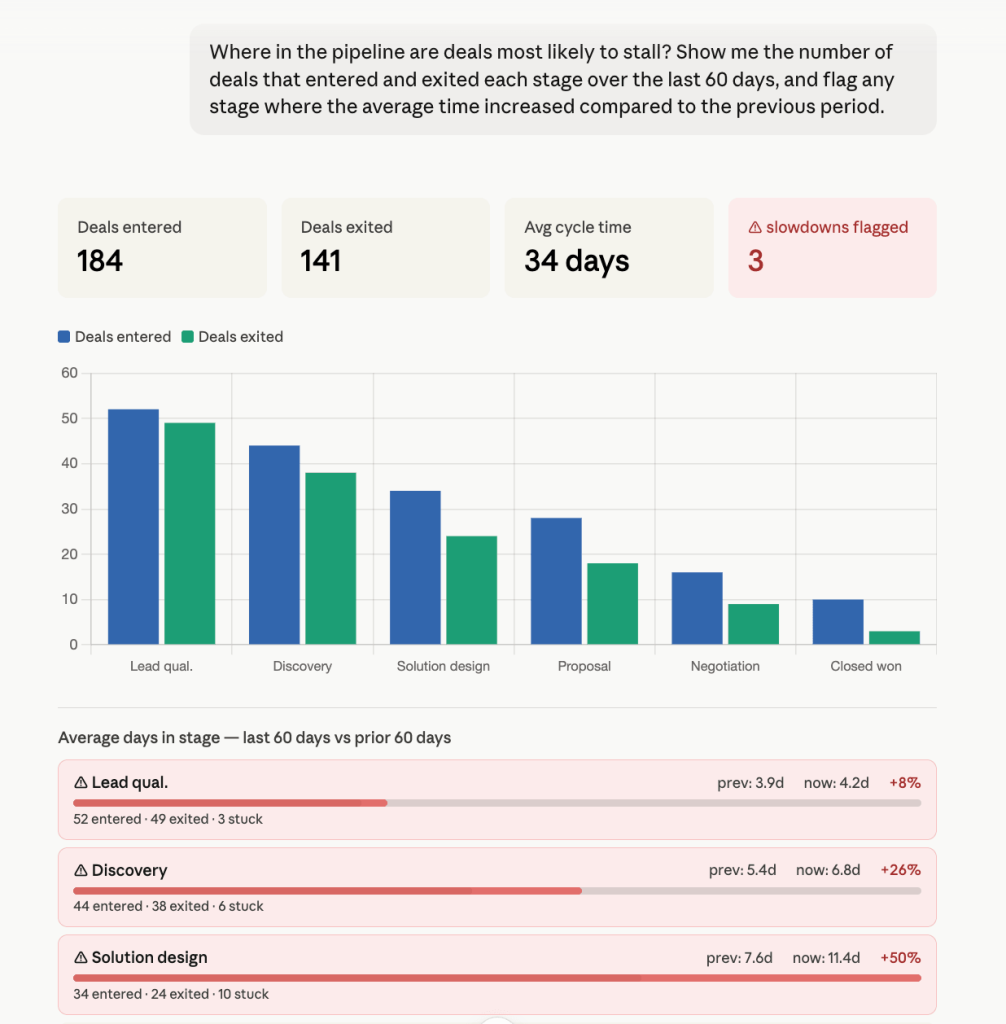
You can continue your analysis by asking Claude to break down stall rates by lead source, identify which sales reps have the longest stage times, or flag deals that have been sitting in one stage for more than 30 days.
Query data from an API that other tools don’t connect to
Every team has at least one data source nobody has built a connector for: a scheduling tool, a support platform, or an internal database. The data is technically accessible through a JSON API, but practically out of reach for anyone without engineering support. It never makes it into a report, a dashboard, or a conversation
Below is an example of analyzing data from a customer service tool:
What are the top five recurring issues by ticket volume over the last 30 days? Flag any category where the average resolution time increased by more than 20% compared to the previous period |
Claude gives a ranked breakdown of issue categories with volume and resolution time trends. Categories that spike in resolution time without a corresponding spike in volume are usually process problems and are worth investigating first.
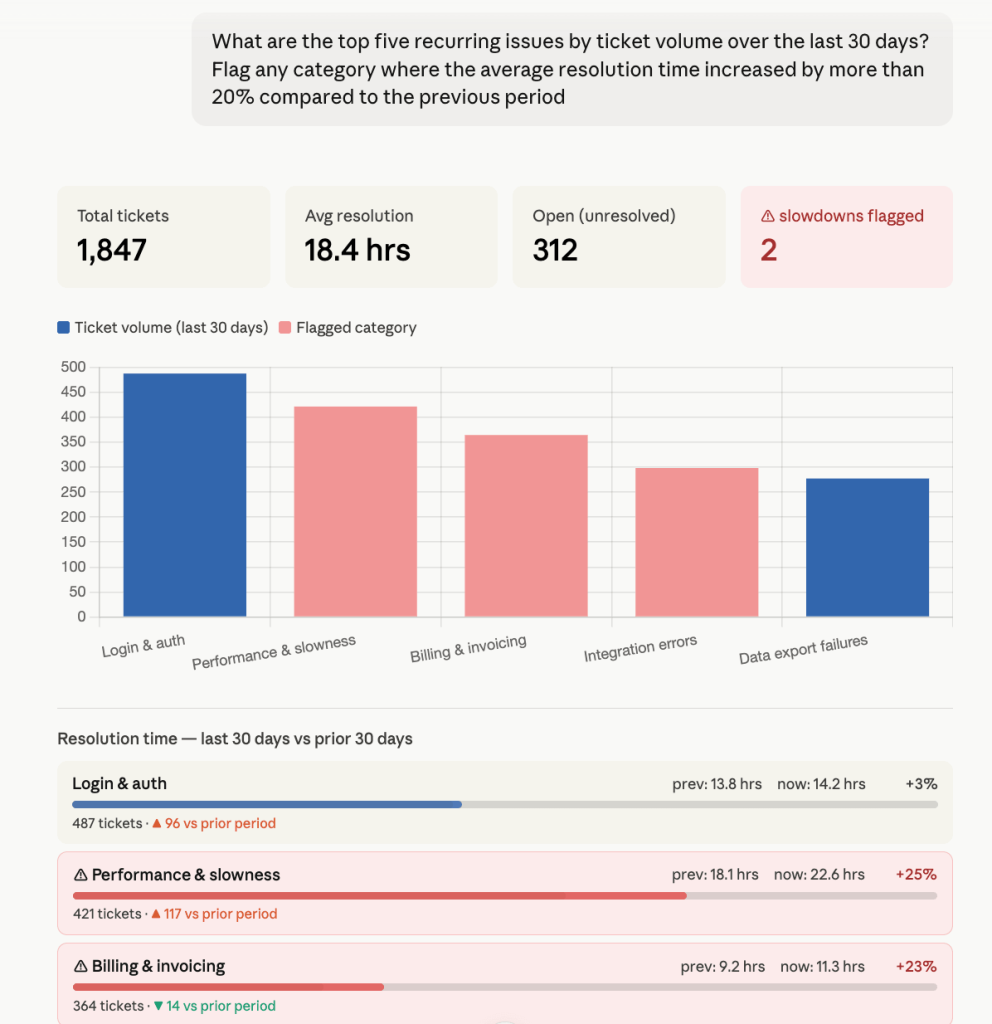
To understand better, ask Claude to identify which agents are handling the highest volume. You can also find tickets that have been open the longest or compare resolution times across different issue categories.
Ask Claude questions about your JSON data
Get started for freeClaude prompts for JSON data analysis
These prompts work directly in Claude once your JSON source is connected. Copy, paste, and adjust the details to match your data.
Revenue or event totals by category over a date range
“Show me revenue totals by customer tier over the last quarter. Which tier contributed the most growth and which declined?”
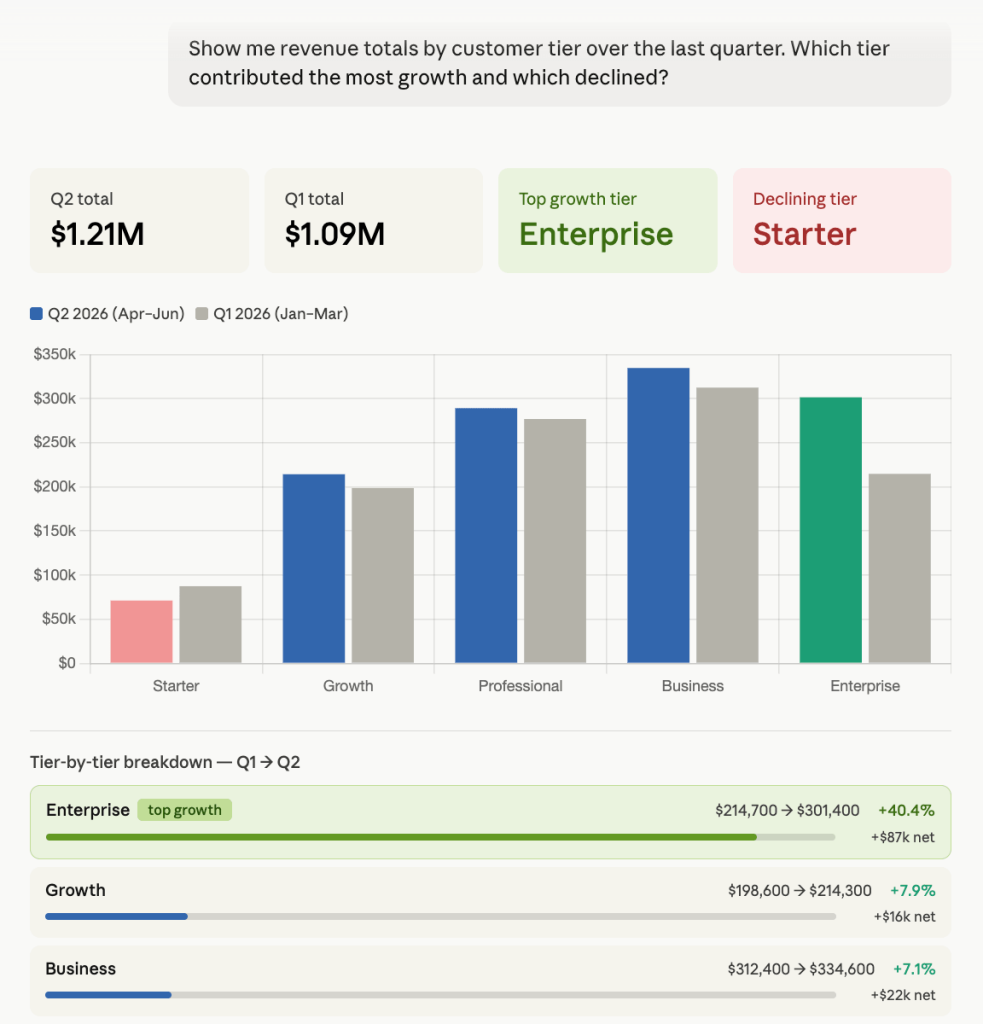
Revenue by customer tier tells a different story from top-line revenue. Overall numbers can look healthy, while one tier quietly shrinks, which is usually the first signal of a retention or positioning problem.
It is useful for pricing reviews, retention planning, or deciding where to focus next quarter.
Customer or record segmentation by activity or value
“Segment customers by total order value over the last 90 days. Group them into high, mid, and low value tiers and show me how many records fall into each group.”
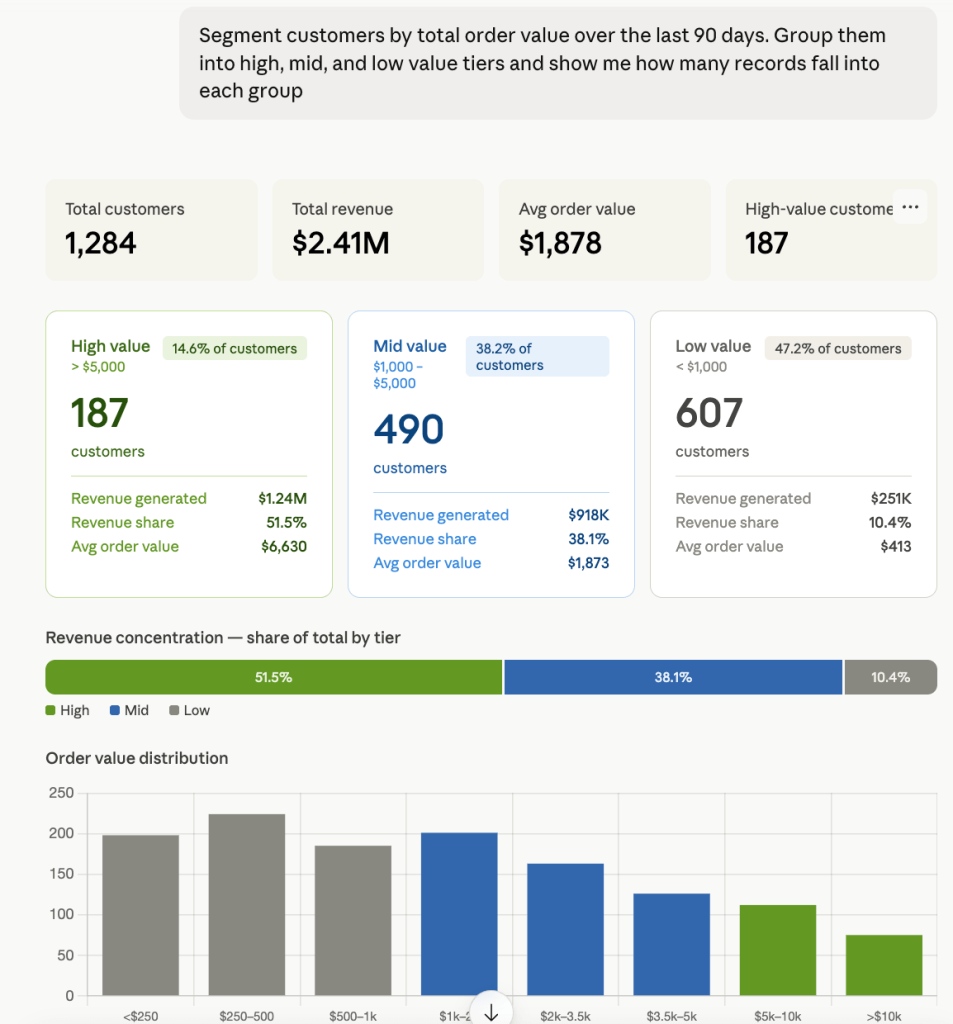
Most customer bases follow the same pattern: a small high-value segment drives a disproportionate share of revenue while the largest segment contributes the least. Knowing exactly where that split is and how wide it is changes how you prioritize retention, upsell, and acquisition efforts.
Claude segments customers into three tiers, shows the record count and revenue share for each, and breaks down order value distribution across the full range. Use this prompt when you want to identify which customers are worth the most attention and where the biggest revenue concentration risk sits.
Validate JSON with Claude: missing or null field detection
“Scan this dataset for missing or null values. Which fields have the most gaps, and are there any records where more than three fields are incomplete?”
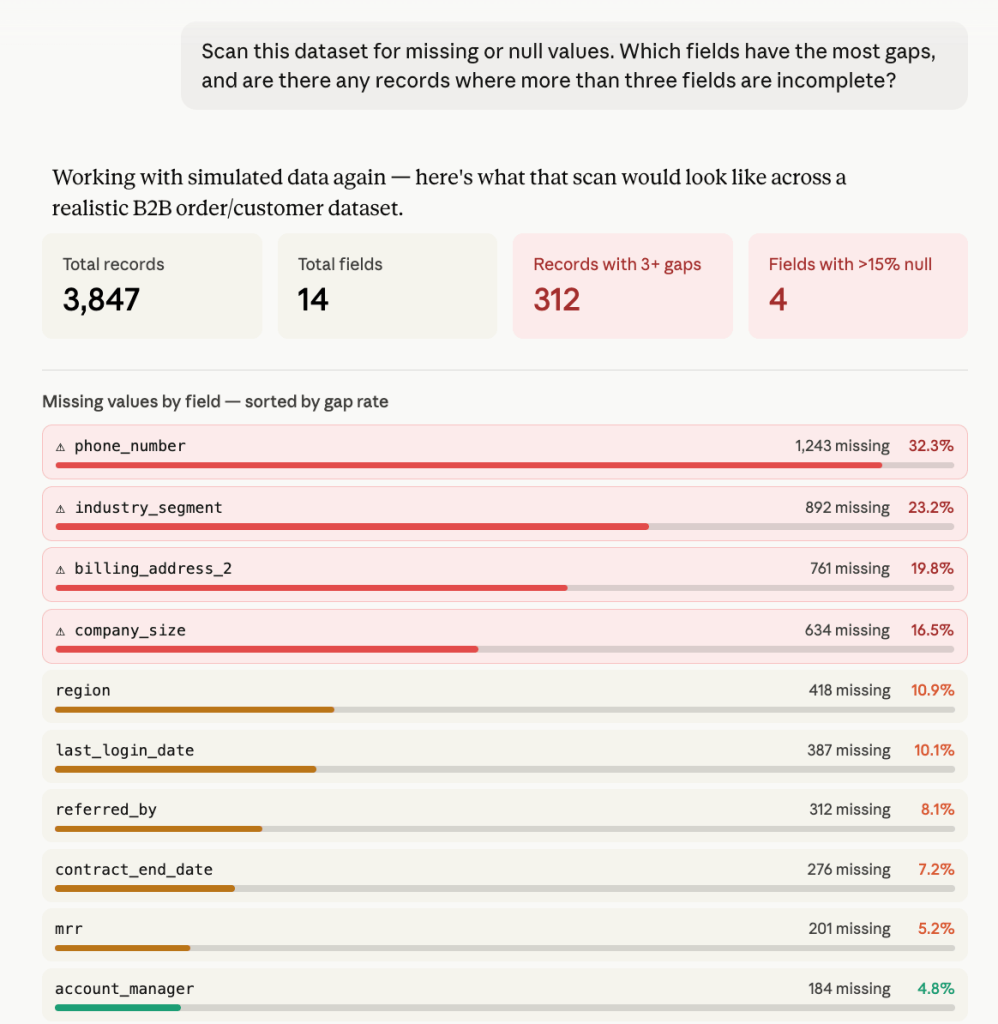
Incomplete data doesn’t announce itself. It shows up later in a report that silently undercounts or an automation that fails on empty fields. Running this scan before any analysis tells you exactly what you’re working with.
Claude sorts fields by gap rate, flags the ones above a set threshold, and identifies records with multiple incomplete fields in one pass. Use this prompt to validate JSON with Claude before trusting any downstream analysis, especially when you’re working with a new source for the first time, after a data migration, or any time your results look off and you’re not sure why.
Pipeline or funnel drop-off by stage
“Based on this pipeline data, which stage has the highest drop-off rate? Show me the number of records that entered and exited each stage over the last 60 days.”
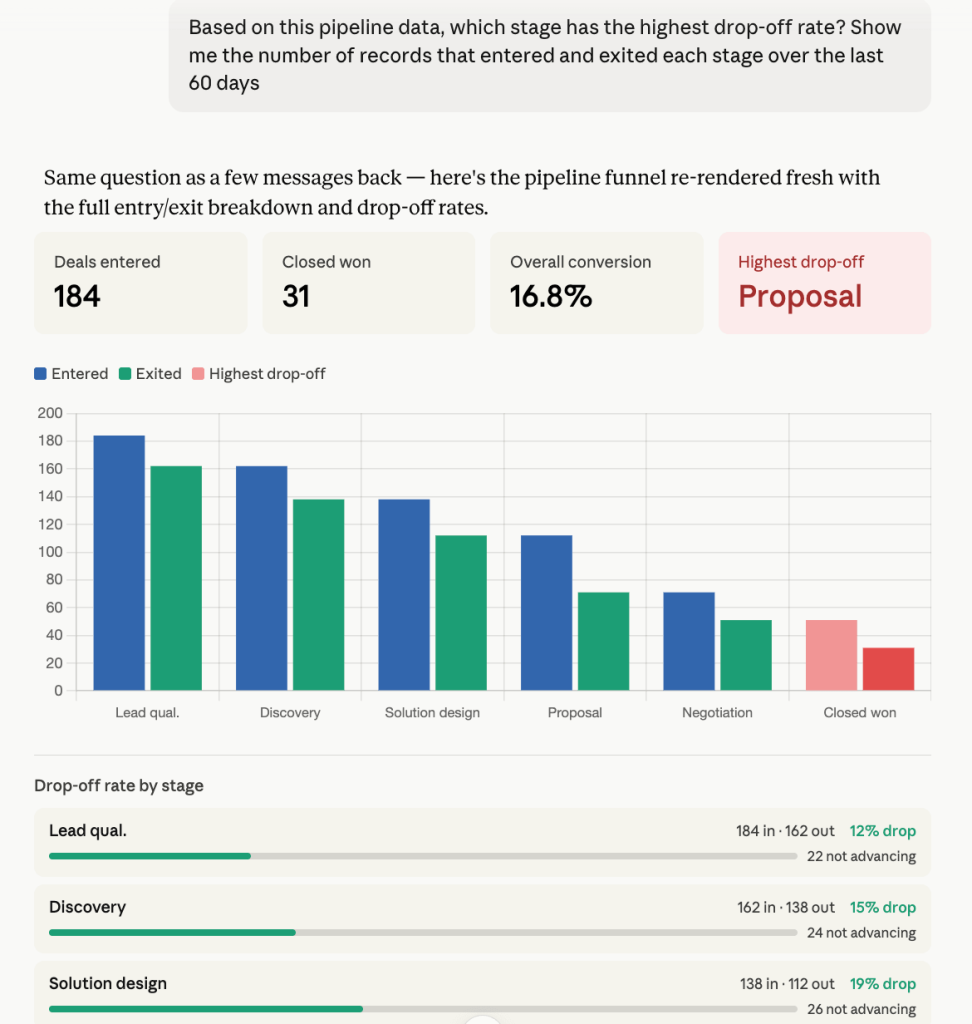
Pipeline reviews usually focus on what’s closing. This prompt focuses on what’s leaking and where. Every stage loses some deals, but the stage with a disproportionate drop-off is where the real problem sits.
Lead or traffic source performance comparison
“Compare lead sources by total pipeline value generated last quarter. Which sources brought in the most leads, and which converted at the highest rate?”
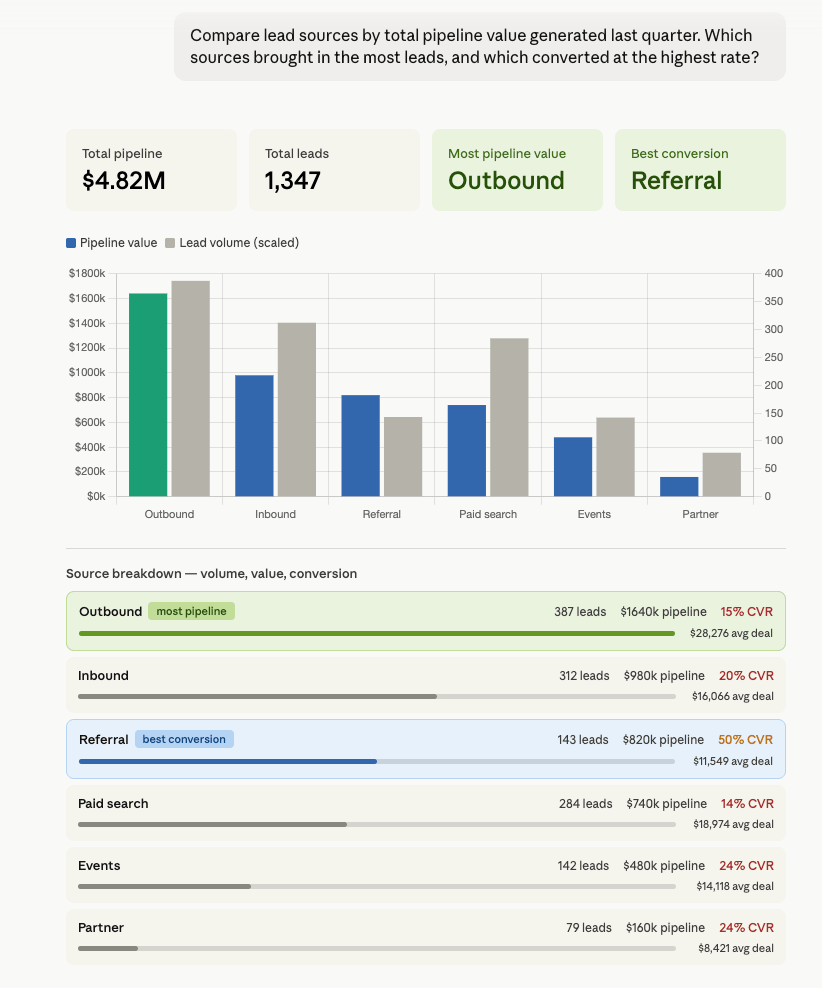
Volume and conversion rarely come from the same source. The channel bringing in the most leads is rarely the one converting at the highest rate. Optimizing for one without knowing the other leads to misallocated budget.
Use this prompt during quarterly planning or budget reviews when you need to make a case for where to invest or pull back based on what’s actually converting.
JSON schema analysis with Claude
“Review this dataset and tell me if the structure looks consistent. Are there fields that appear in some records but not others? Flag anything that looks like a schema change.”
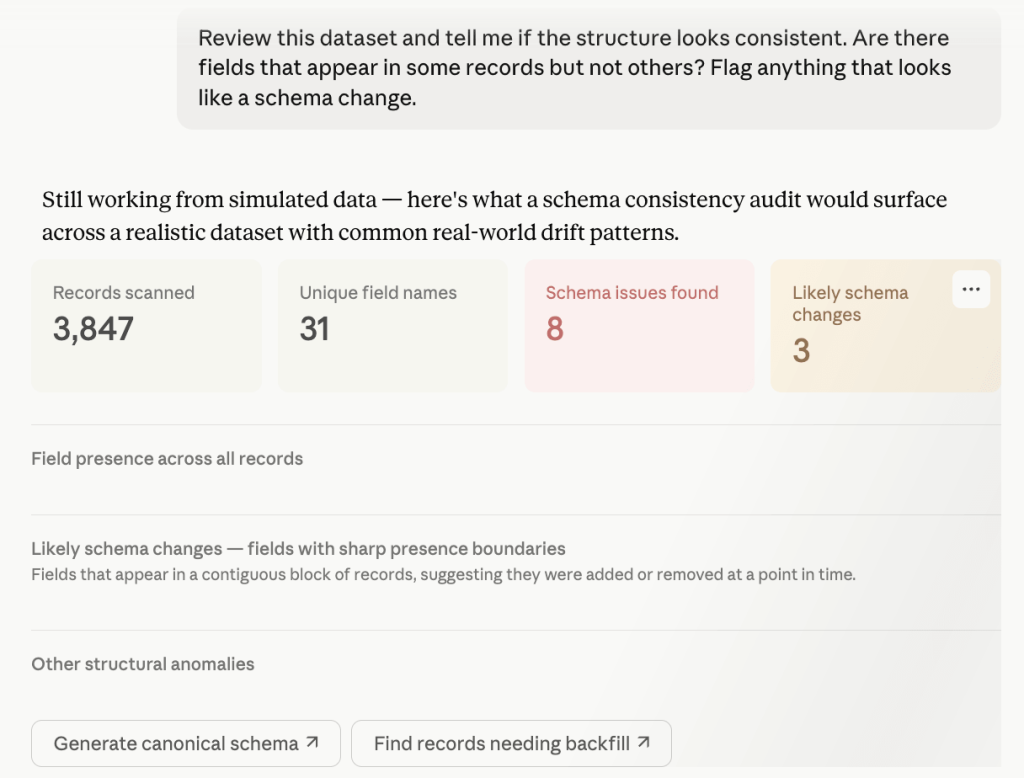
JSON APIs change over time. For example, fields get added or removed without notice. If your analysis is built on an assumed structure and that structure shifted three months ago, every query since has been working with incomplete data.
Claude flags inconsistencies and identifies fields that appear in a contiguous block of records. Run this JSON schema analysis with Claude prompt when you’re connecting a new JSON source for the first time, or for debugging unexpected output from a JSON API. You can also use this to compare two JSON files with Claude and spot exactly what changed between them.
Plain-language summary for a non-technical stakeholder
“Summarize this dataset for a non-technical stakeholder. What are the three most important things it shows, and are there any numbers that look unusual or worth flagging?”
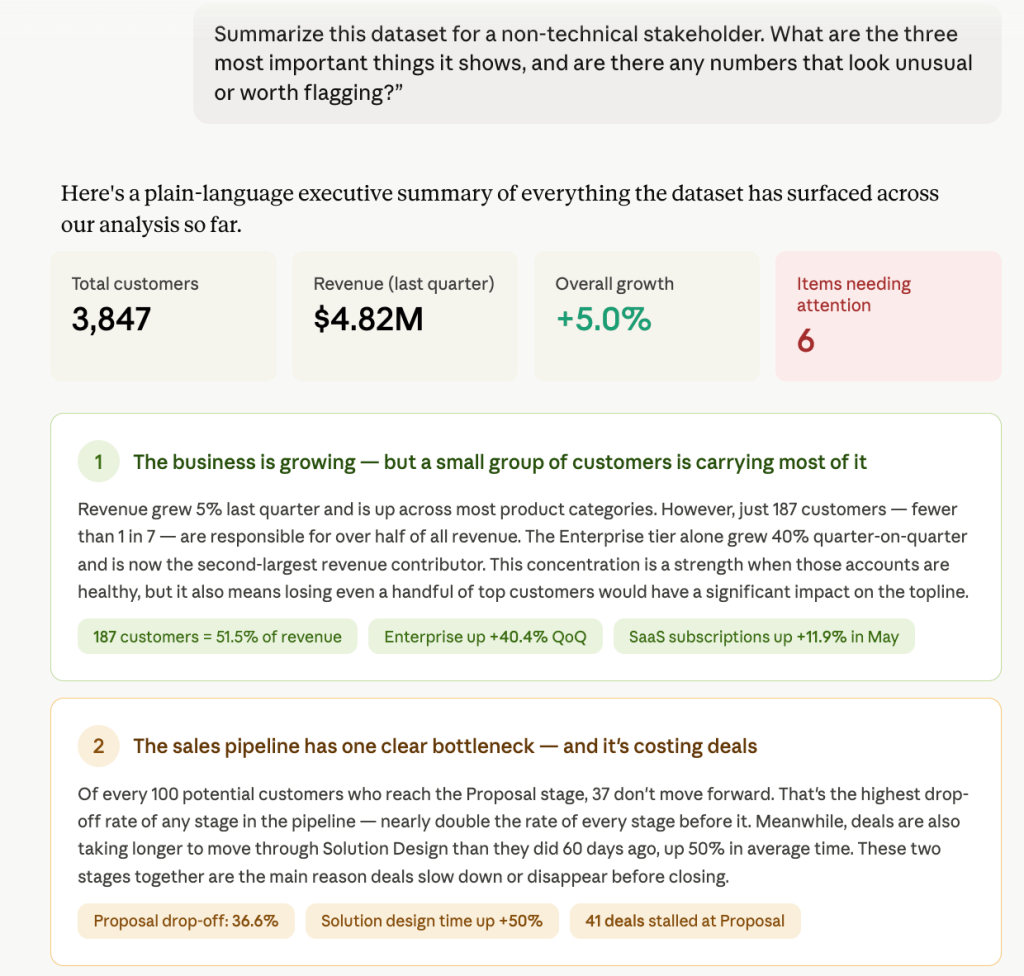
Not everyone who needs to understand the data wants to dig into it. Executives, clients, and cross-functional teams need the headline, the risk, and the next step.
The fastest way to summarize JSON data with Claude is to let it read across the full dataset and surface what matters in plain language. You can use this when you need to share findings with someone outside the analysis, put together a quick brief before a meeting, or turn a week’s worth of data into three sentences.
What matters when you analyze JSON data with Claude
The method matters, but so does the setup. A few things make the difference between analysis you can trust and answers that send you in the wrong direction.
Field names mean nothing when there is no context
JSON keys are written for systems. A field named evt_typ, src_id, or usr_ext lands in Claude as an opaque string. Without context, Claude makes its best guess at what the field means and that guess shapes every answer it gives you.
Coupler.io lets you attach a field dictionary to your data flow once. From that point, every session starts with Claude already knowing that ord_st means order status, src_id means lead source, and evt_typ means event type. The analysis gets sharper the more context you give it.
Claude interprets numbers; it doesn’t crunch them
JSON arrays can hold thousands of records. Ask Claude or any other LLM to sum order values, count event types, or calculate averages directly across a large array, and the results drift. LLMs are strong at translating questions into queries and explaining results. They are weak at arithmetic.
Coupler.io’s Analytical Engine handles the calculations. It runs the aggregations, processes the date range comparisons, and returns verified results. Claude then explains the numbers and identifies patterns. The math is done before the data reaches Claude.
Recurring JSON analysis shouldn’t start from scratch each time
If you’re pulling from the same API endpoint every week and asking similar questions, rebuilding the analysis from scratch each time is time-consuming. The data structure is the same, the questions are similar, and the context shouldn’t have to be re-explained every session.
Coupler.io’s pre-built skills handle the patterns that repeat with JSON data: reading unfamiliar schemas, summarizing structured exports, and generating recurring reports from existing workflows. Set it up once, and the analysis runs on schedule without you having to prompt it from zero each time.
The same data flow should serve different audiences
Not everyone on a team wants to talk to Claude. Some people want a live spreadsheet they can filter. Others want a dashboard they can share in a meeting. Others want to ask questions in plain language and get answers back fast.
Connect your JSON source once in Coupler.io and route it to Claude, Google Sheets, and Looker Studio. The people who want a spreadsheet get one. The people who want a dashboard get that. One data flow, multiple destinations.
Connect 400+ sources to Claude with Coupler.io
Get started for freeOther ways to upload JSON to Claude
Coupler.io is the right path for recurring analysis of live JSON data. For everything else, here are the alternatives.
Manual file upload
The simplest way to upload JSON to Claude is directly through the chat. Drag and drop the file into the conversation, or use the attachment button to upload it. Claude reads the structure, interprets the fields, and is ready to answer questions immediately.
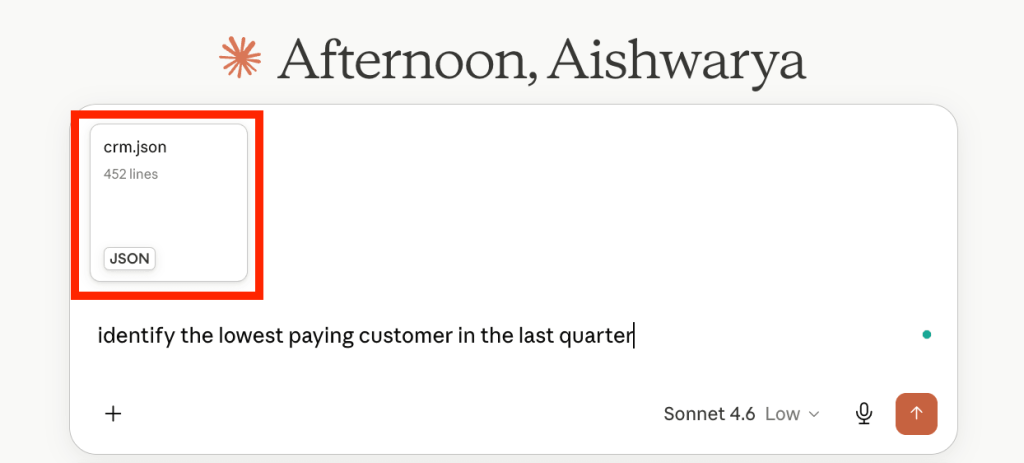
The limit is 30MB per file and up to 20 files per conversation. For a one-off analysis of a static export, this is the fastest method. For anything recurring, it breaks quickly. Every time the data updates, you download a new file and upload it again. I would not rely on this approach for any analysis you need to repeat.
Paste JSON into the chat
For small payloads like a single API response, a webhook sample, or a short record set, pasting valid JSON directly into the chat works fine. Claude reads the syntax and can answer questions about it immediately.
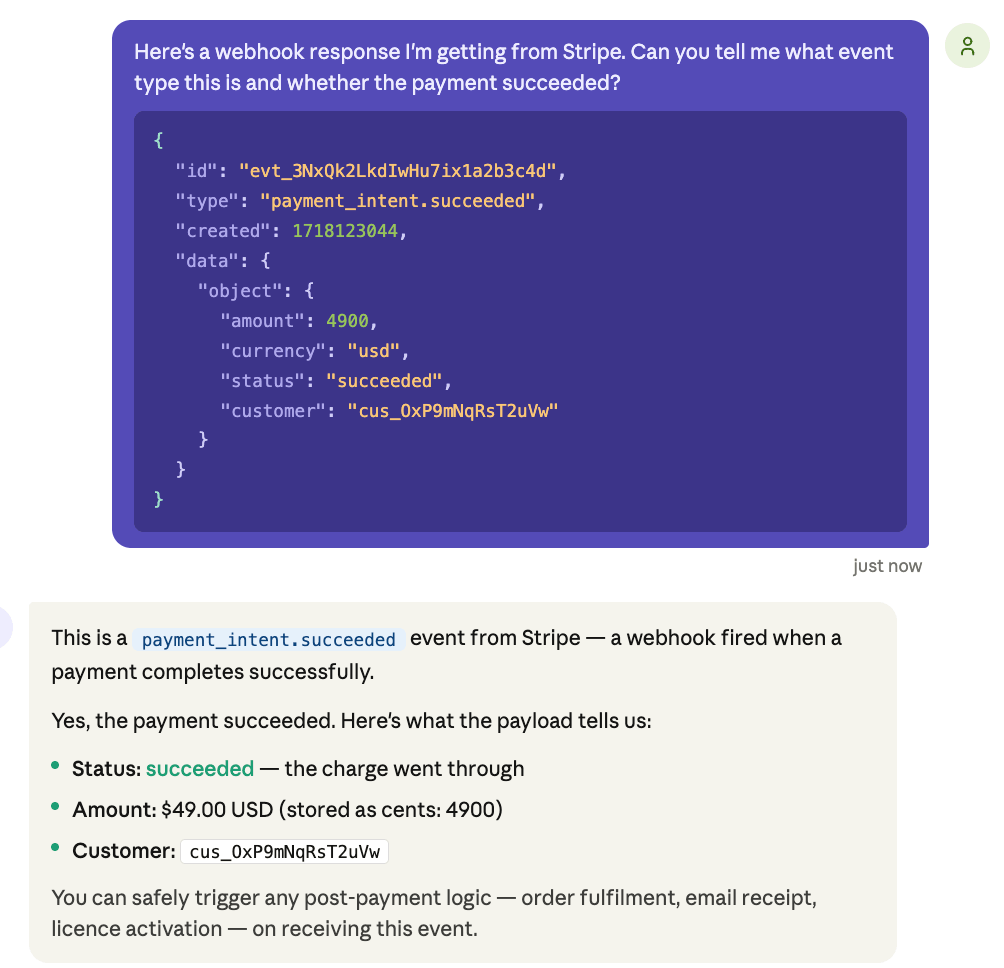
The ceiling is Claude’s context window. It is not suitable to analyze large JSON files with Claude. It will hit the limit and get cut off, which means incomplete data and unreliable answers. Paste works for quick checks and one-off queries. It’s not a method for analyzing large JSON files with Claude.
Custom MCP server (Claude JSON connector)
If your team has engineering capacity and needs full control over how JSON data is exposed to Claude, building a custom MCP server is an option. You define exactly which endpoints Claude can access, what data it sees, and how authentication works.
A typical setup involves writing a server in Python or TypeScript, hosting it, and configuring tool use, so Claude can call your endpoints as functions. You’ll store your API key and bearer tokens in environment variables, define the JSON schema for each tool call, handle retries and error responses, etc. You can run the server from the command line or deploy it to a container. The Anthropic docs and the MCP spec on GitHub cover the protocol details.
The tradeoff is the build and maintenance cost. A custom MCP server requires development time, hosting, and ongoing upkeep every time the source API changes. Coupler.io’s connector is also MCP-based. The difference is that it’s ready to use without building or maintaining anything.
API scripts and function calling
API scripts written in Python or similar languages pull JSON from a source endpoint on a fixed schedule and pass it to Claude through the Anthropic API or SDK. The same pattern works with OpenAI’s API if your team uses GPT models instead. Function calling (also called tool use) lets Claude decide which endpoint to call based on the question. It’s better for conversational queries where the data source isn’t always predictable.
Both require engineering work. Scripts are relatively straightforward to build, but rigid. Any change to the source API or the analysis requirements means updating the code. Function calling adds flexibility but increases complexity. For teams without dedicated engineering support, the build-and-maintain cost outweighs the benefit for most JSON analysis use cases.
Which method should you use?
Whether you’re looking to query JSON with Claude AI once or on a recurring schedule, the right method comes down to three questions.
Is your JSON from a static file or a live source?
If you exported a file once and need quick answers from it, upload it directly to Claude or paste the contents into the chat. Both work fine for a one-off. If your JSON comes from an API, a webhook, or any source that updates regularly, a static upload stops working the moment the data changes. You need a method that keeps pace with the data.
How often do you need fresh data in Claude?
Weekly reports, recurring pipeline reviews, regular ops checks: anything that happens on a schedule needs a method that refreshes on a schedule. Manual uploads and pasting work once. Coupler.io connects to the source directly and automates the refresh, so the analysis is always running against up-to-date data without anyone having to trigger it manually.
Does your team have the engineering capacity to build and maintain a pipeline?
For most teams doing recurring analysis of JSON data, Coupler.io is the practical path. The connector handles the Claude integration, data preparation, scheduled refresh, and more without any code. You spend time on the analysis, not the pipeline.
Custom MCP servers and API scripts give you full control, but they come with a real build and maintenance cost. Every time the source API changes, someone has to update the code. For teams without dedicated engineering support, that cost adds up fast.
Get your JSON data into Claude without the manual work
Get started for freeFAQs
Can I connect multiple JSON sources in one data flow?
Yes. Coupler.io lets you add multiple sources to a single data flow. If your JSON data comes from more than one API endpoint (separate accounts, different environments, or multiple services), you can pull them together before the data reaches Claude. Claude then works with a combined dataset rather than switching between separate conversations.
Does Coupler.io work with both Claude Desktop and Claude web?
Yes. The Coupler.io MCP server works with both the Claude web app at claude.ai and Claude Desktop. The setup process is the same for both. Connect through the Coupler.io connector page in Claude’s directory, authorize, and set your refresh schedule. The data is available whichever version of Claude your team uses.
Is connecting JSON to Claude safe?
Coupler.io sits between your JSON source and Claude as a secure data layer. The connection is read-only. Claude can view and analyze the data you share, but it cannot modify your source systems. Coupler.io is SOC 2 Type II certified, GDPR compliant, and HIPAA compliant. Data transmitted for analysis is not retained by Anthropic for model training. If you run the local MCP server, data processing happens on your own machine.
What types of JSON can I use with Claude?
Claude accepts any valid JSON: flat arrays, nested objects, arrays of objects, and mixed structures. For clean output, Coupler.io handles the parsing and flattening before Claude sees the data. If you’re uploading manually, the JSON file needs to be well-formed (no trailing commas, no unquoted keys). Claude will flag syntax errors in malformed files.
Can Claude replace a data analyst for JSON work?
Not entirely. Using Claude for data analytics accelerates the interpretation step. It can group, filter, and explain patterns across your dataset. But AI agents like Claude don’t define the right questions, understand your business strategy, or know which metrics matter most. Think of it as a fast research assistant, not a replacement for human judgment. Coupler.io’s Analytical Engine handles the calculations so Claude doesn’t have to guess at the numbers.