Have you just started running a business, or been trying your best, but your retail business is just not going anywhere? One of the most common reasons is indifference to the cash flow of your business. Money may not be everything, but it certainly makes things run more smoothly. If you can’t manage it well, your business processes can seize.
So what is the answer to this problem? This article may help you.
Note: Jump right to the templates section if you already know how to make cash flow forecasts and which data to analyze. If you don’t, read on to explore.
What is a cash flow forecast?
A cash flow forecast is an estimate of money that will flow in and out over a certain period of time. It’s a business tool meant to answer the major question:
Will there be a positive balance of cash at EACH POINT IN TIME?
Cash flow forecasting usually rests on the financial data (income and outgoings) of previous periods.
What is the purpose of a cash flow forecast?
The primary goal of a cash flow forecast is to see whether you have positive balance at EACH POINT IN TIME. For example, you know that you are going to receive $20,000 next month and only spend $10,000. This is great, isn’t it? The trouble comes if today you have $5,000, and you need to pay $10,000 tomorrow, while your $20,000 is only expected at the end of month. Cash flow forecasting is meant to release you from this headache. Here are some other reasons why you need cash flow forecasting:
- Easier budgeting
Some say that budgeting and cash flow forecasting are the same. This is mostly true. However, the major difference is that budgets do not display bank or cash movement separately, whereas cash flow forecasts do. So, budgeting based on financial forecasts is much easier because you already have a complete list of the income and outgoings of the company based on past data.
- Costs planning
When making a cash flow forecast, you basically analyze the financial data of the past period and make a prediction for the future period. Some expenses are recurrent, while others can depend on the season. For example, in the last 3 months, we got $10,000 each month, while our expenses were only $5,000. Can we plan to invest $5,000 next month? No, we can’t, because the next month is December – Yuletide is coming. During this period, our income usually goes down and we spend $5,000 more for holiday parties.
- Reduce financial risks
Another example is for Company Z, which made a proper cash flow forecast and reduced unnecessary expenses. This helped it avoid bank loans that would have caused huge total outgoings in the view of the expected rise in inflation. This is a long-term financial risk that any of you may expect.
Why is a cash flow forecast important?
Let’s sum up the above to identify the core value of cash flow forecasts – they tell you whether your business is on track:
- If you have more money going out than coming in, you’re heading in the wrong direction.
- If the money in overlaps the money out, you’re good!
- If you have much more money coming in than going out, your business may be ready to scale up.
Cash flow forecasting models
A cash flow forecasting model is a structure for you to make an estimate of the money in and out. Basically, it’s a table with two dimensions:
- Cash flow types
- Reporting periods
Based on the reporting periods, there are three types of cash flow forecasting models:
- Short-term
- Long-term
- Seasonal
Short-term forecasting
Short-term cash flow forecasting may cover daily and weekly reporting periods. This model is best for creating cash flow forecasts of routine daily income and outgoings to track whether there is enough money at each point in time.
Long-term forecasting
Long-term cash flow forecasting covers reporting periods beyond one year. This model targets major strategic decisions and is very much related to resource implications. It may include new product planning, as well as business or facility development.
Seasonal forecasting
Seasonality is crucial for any business (not just seasonal ones) to analyze income and costs throughout the year. This model helps you make minor strategic decisions, such as sales projection, production planning, budgeting, and various operational plans.
Which cash flow forecasting model to choose
Your choice should rely on the targets of your strategic decisions – major goals require long-term forecasting; minor ones, short-term. Keep in mind that the longer the time horizon to forecast, the less accurate it is expected to be.
How to create a cash flow forecast
Here are the basic steps you need to take to make a cash flow projection:
- Step 1. Choose the cash flow forecasting structure (model)
Choose the forecasting model you want to use and build a table that will correspond to the structure of the model.
- Step 2. Input the historical financial data into the table
Input the data that contains details of cash income and outgoings transactions for the past period(s) into your cash flow table. You can copy and paste historical data manually from your accounting spreadsheet or software. You may also automate the data import from your accounting system, such Xero or QuickBooks, into your spreadsheet.
To do this, you need Coupler.io, an integration solution that allows you to connect Google Sheets, Excel or BigQuery to your accounting software for data import. There are many integrations available, for example, QuickBooks to Google Sheets. In addition, you can always switch between sources and destinations, for example to connect Google Sheets to BigQuery.
Try it yourself for free right away. Just select the needed data source in the form below and click Proceed. Create a free Coupler.io account with no credit card required and follow the inapp instructions to load your data.
- Step 3. Forecast your cash flow
Once you have your historical data about income and outgoings, you can forecast the cash flow for the future periods. You can calculate the inflow and outflows manually, or use the Google Sheets FORECAST function to automate the prediction.
Cash flow forecast formula
Cash Flow Forecast = Opening Balance + (Expected Inflows – Expected Outflows) Opening Balance– the money you have in the bank account at the start of the forecasting period.Expected Inflows– the income you expect.Expected Outflows– the outgoings you expect.
So, if your opening balance is $1000, and you expect to earn $600 and spend $500, your cash flow forecast will look like this:
1000 + (600 - 500) = $1100How to calculate expected cash inflows and outflows
Once you input your historical financial data, you can analyze it to make some expectations and estimates for the money that will be going in and out. Here are some of the best practices for this:
- Estimate the expected outflows
Expected outflows include the regular expenses you had in the past period(s), as well as other expected expenses in the future period. It’s also a best practice to reserve some amount for unexpected expenses to mitigate risks. Sum up all the values you have to get a forecast of cash outflow for the next period.
- Estimate the expected inflows
Expected inflows rest on the income value from the past period(s) and include estimates based on your expectations. For example, if you spent some cash on an advertising campaign, you may expect a rise in customers, i.e. cash inflow.
How to automate cash flow forecast creation
If you’re ready to rely on predictions provided by Google Sheets, then you can go with the FORECAST function. This will calculate the expected value for your costs or income based on a linear regression of a dataset. Let’s check it out with an example.
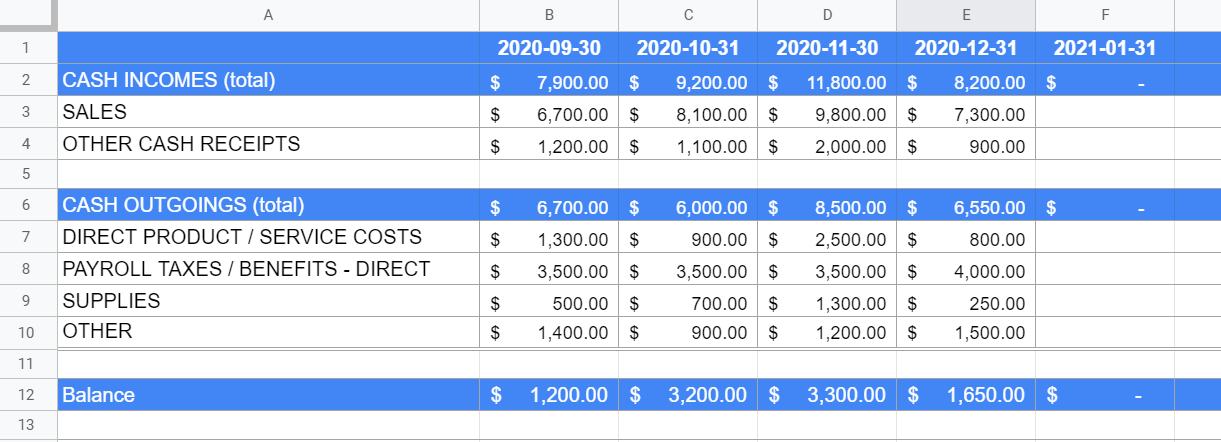
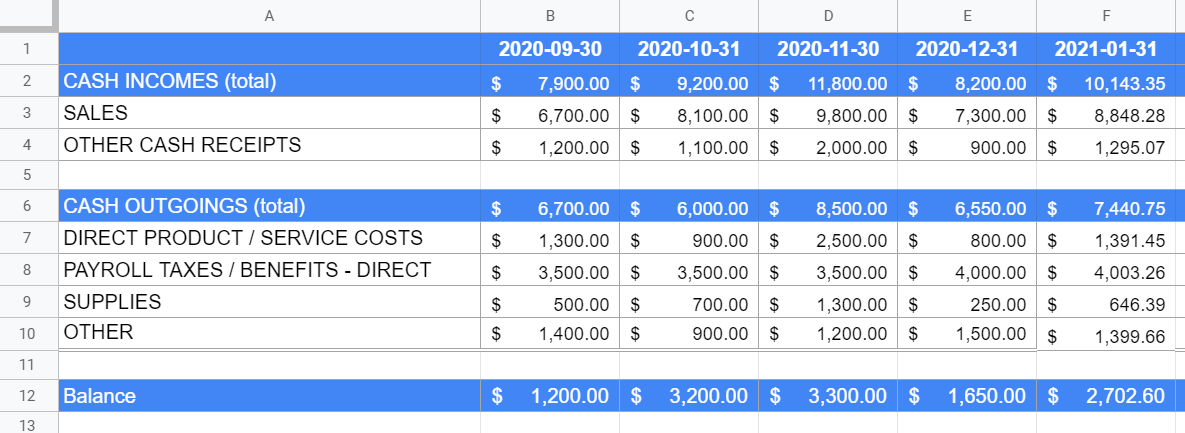
We have the following costs and income data for the last four months (Sep to Dec). Let’s predict both cash inflows and outflows in January using the FORECAST function.
FORECAST formula syntax is the following:
=FORECAST(x, data-y, data-x)For example, to forecast sales, here are the parameters we need:
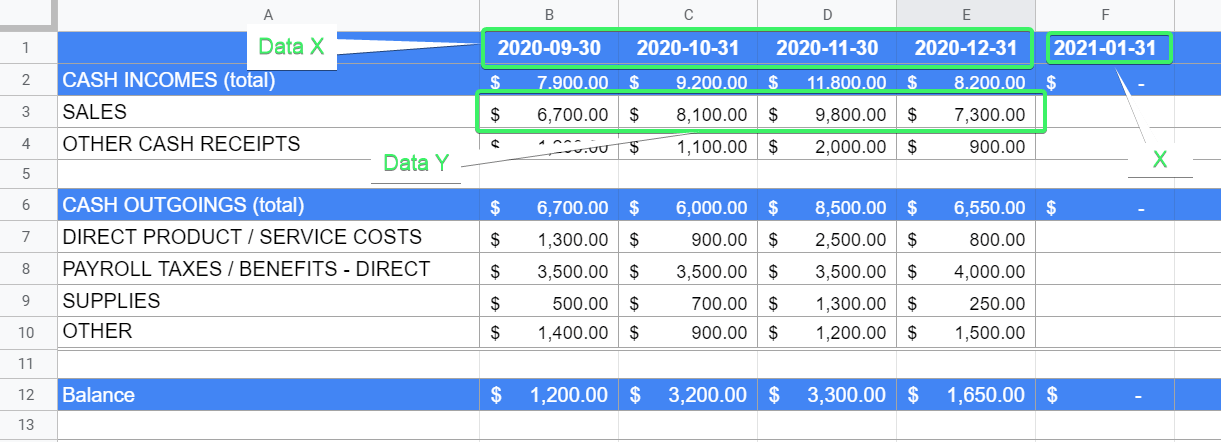
The formula will look like this:
=forecast(F1,B3:E3,B1:E1)
F1– Date value for the forecastB3:E3– Historical financial data rangeB1:E1– Date values that correspond to the historical financial data range
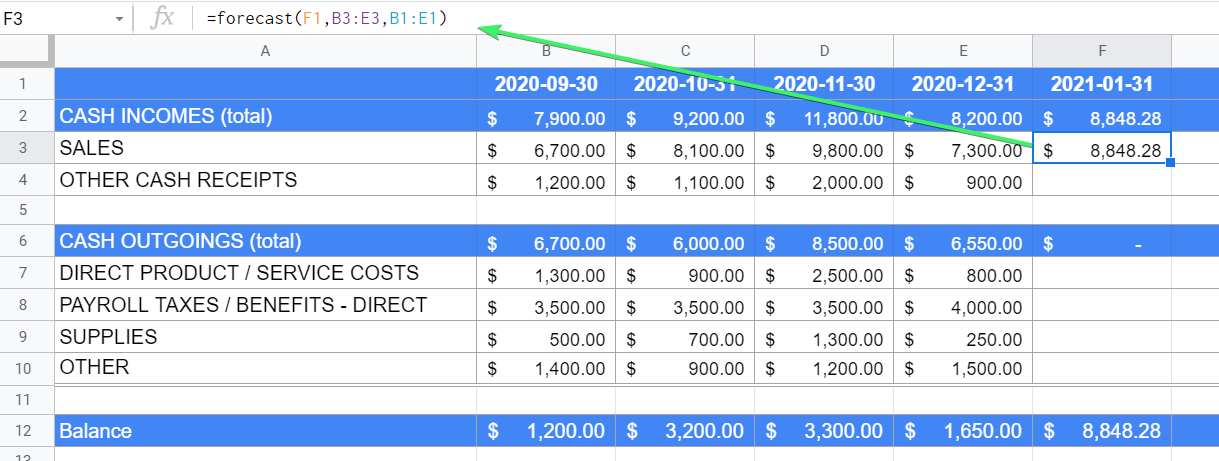
Google Sheets predicted that our sales will be $8,848.28 in January. Let’s apply this formula for other categories of cash inflows and outflows. For this, you need to fix the x and data-x parameters using the $ symbol, as follows:
=forecast($F$1,B3:E3,$B$1:$E$1)
Now you can copy and paste the formula to other cells. Here is the result:
A reasonable question is how accurate the FORECAST formula can be. Since it is based on the historical data, the more data you provide, the higher the accuracy is. However, you should not entirely rely on FORECAST function since it cannot consider factors not viewable in the historical data.
Cash flow forecast example
As an example, we chose a case of a small business owner who needs to forecast cash flow for an online book store. Let’s go step by step.
Step 1. Choose the cash flow forecasting structure (model)
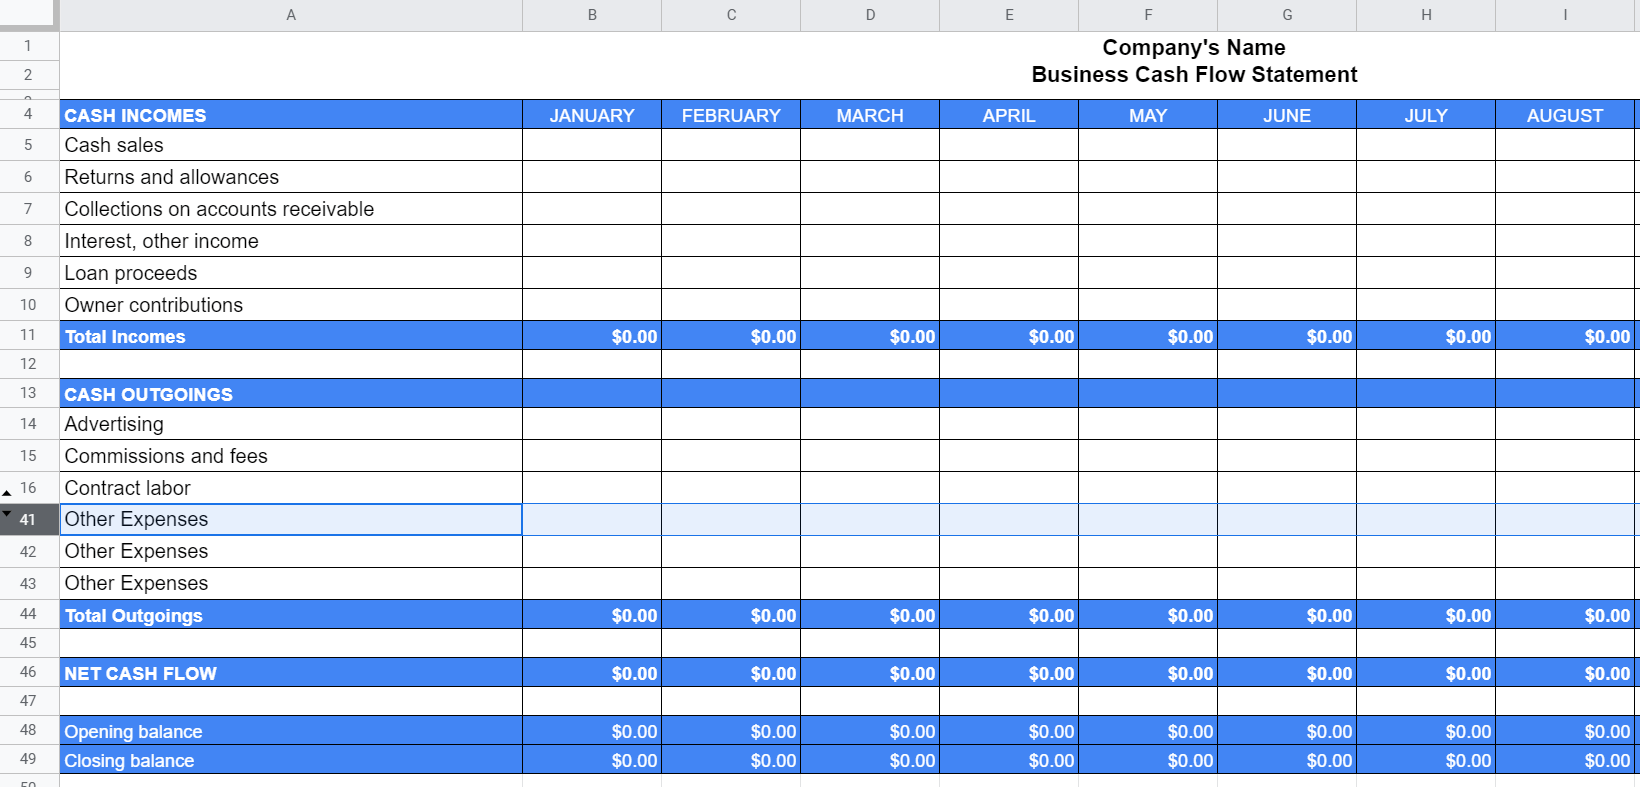
The store owner wants to estimate cash flow for the next month, March. So, we’ll choose a short-term forecasting model and use the following sample of a cash flow table:
Step 2. Input the historical financial data into the table
We have financial data for the previous months: January and February. So, let’s fill out the cash income and outgoings categories.
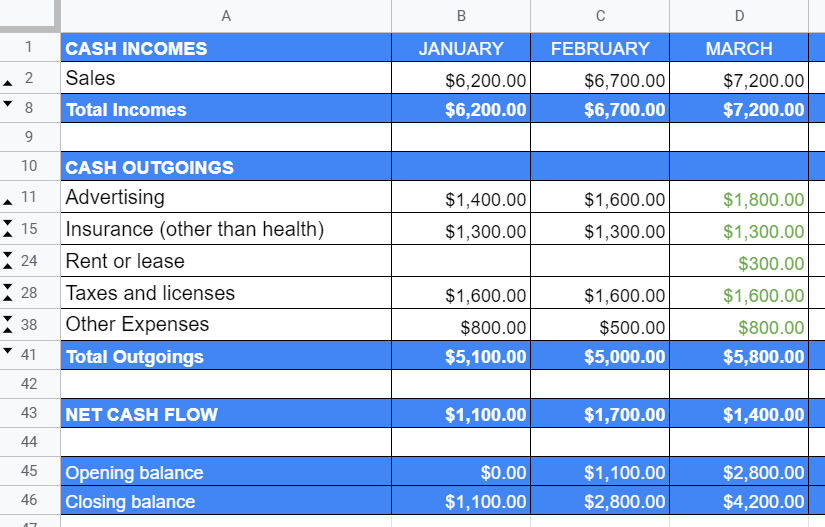
In the income section, we only have one category, Sales, whereas the outgoings include expenses for Advertising, Insurance, Taxes and Licenses, and Other (uncategorized) Expenses. Here is how the table will look:
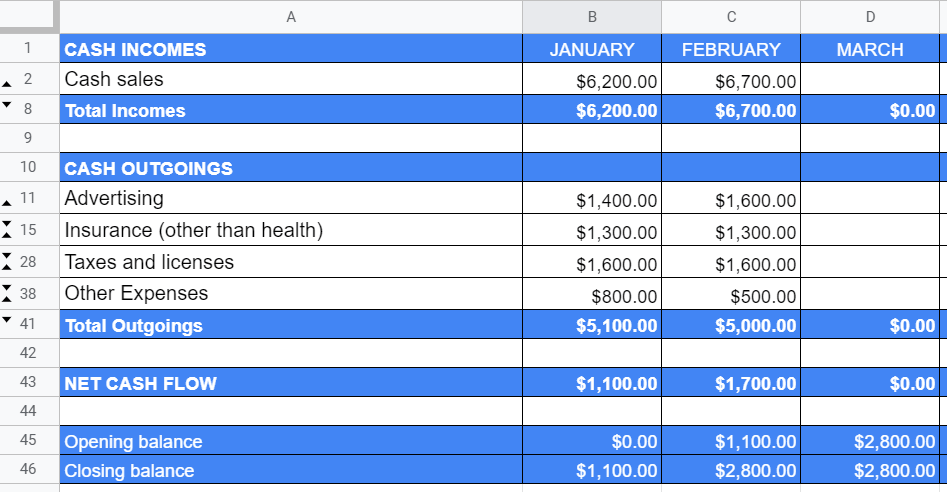
We used the Google Sheets SUM function to sum both the Total Income and Total Outgoings.
- The Net Cash flow is the difference between Total Income and Total Outgoings.
- The Closing balance is the sum of the Opening balance of the previous month and the Net Cash flow of the current month.
- The Opening balance of the current month equals the Closing balance of the previous month.
Step 3. Forecast your cash flow
Now, the best bit – let’s make a cash flow forecast for March. To do this, we need to analyze the data of the past periods, January and February, and project our expectations.
Forecast outgoings
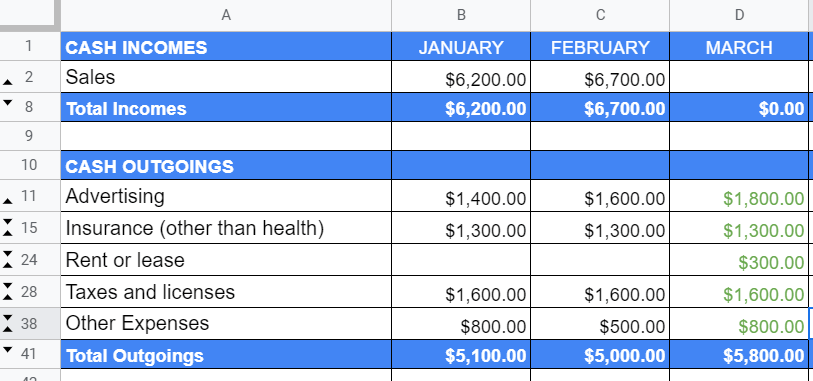
- First, let’s input the regular expenses that we know exactly. These are Insurance and Taxes – they are fixed, so no variations in their values are expected.
- Next is Advertising. We know that we invest money in this category of expenses and plan to increase this month by month. So, Advertising will cost $200 more than in previous months.
- In March, we plan to rent a storehouse. This will cost an additional $300. So, a new category will appear in the list of outgoings.
- It’s also good to reserve around $800 as Other expenses for unexpected outgoings.
Here is what our cash outflow forecast looks like:
Forecast income
It’s not easy to predict sales we’re going to have, but let’s give it a shot. A $200 increase in Advertising caused an increase of $500 in sales. So, we can assume that, in March, we’ll benefit from another sales rise. The total cash income is expected to be $7,200.
Considering the estimates above, the net cash flow at the end of March is expected to be $1,400.
Cash flow forecast templates for Google Sheets
Check out the following templates that may help you with this task. Feel free to copy them and customize them for your needs.
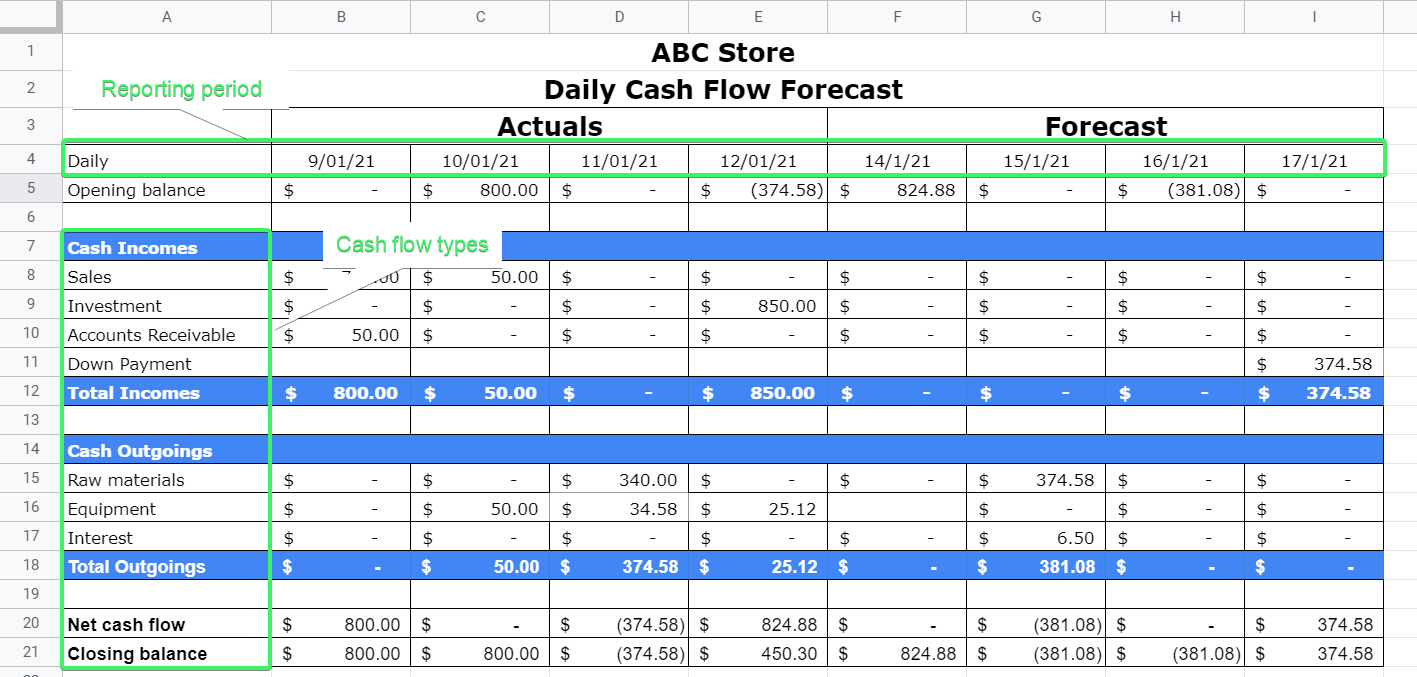
Daily cash flow forecast template
Template for manual forecasting
Template with integrated FORECAST function
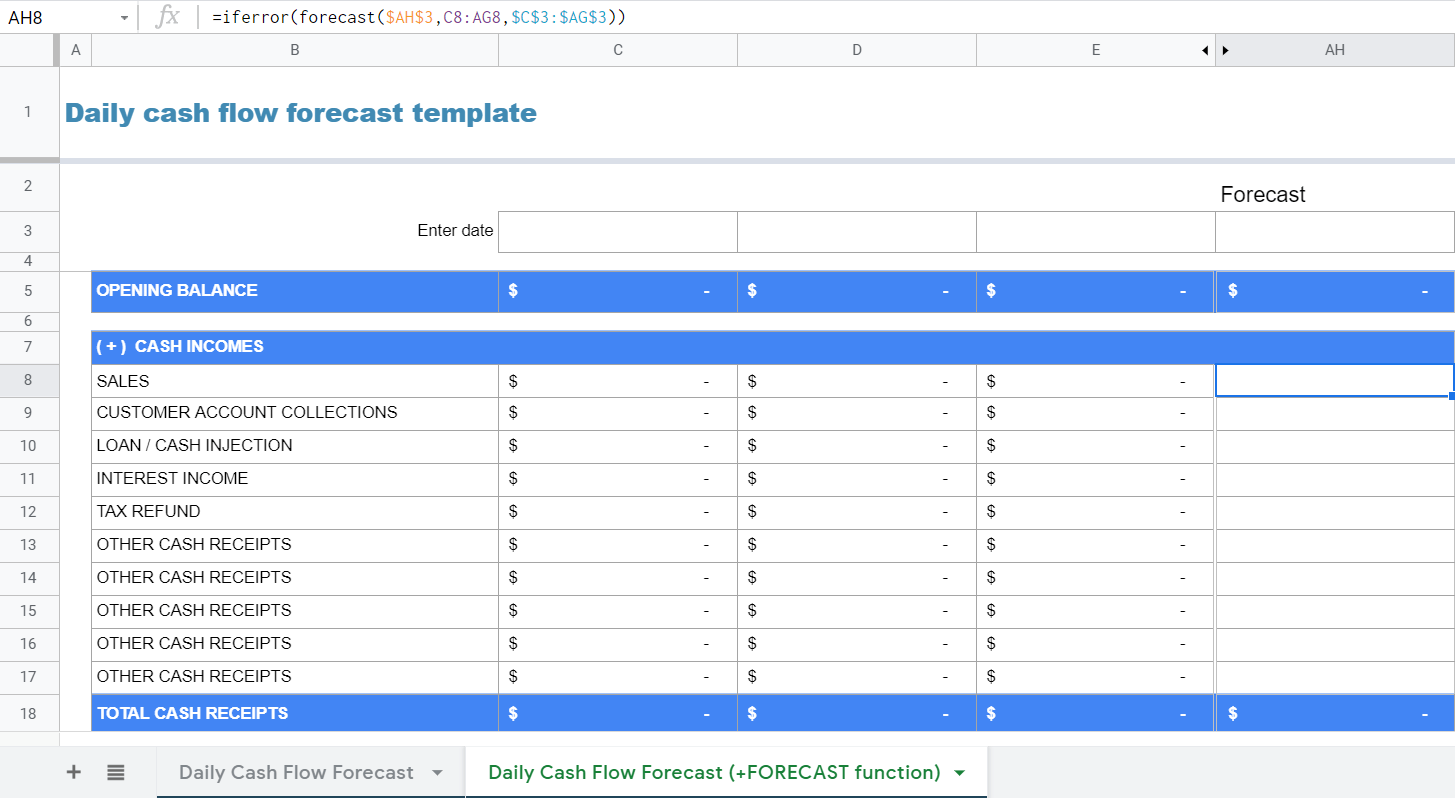
This is a cash flow dashboard template optimized for projecting your cash inflows and outflows on a daily basis. You need to select days from the drop-down calendar and input the values that correspond to Cash Income and Cash Outgoings. The template will automatically calculate totals, as well as the Net Cash flow and Closing/Opening Balance.
Use the Daily Cash Flow Forecast (+FORECAST function) to automate the forecast.
Weekly cash flow forecast template
Template for manual forecasting
Template with integrated FORECAST function
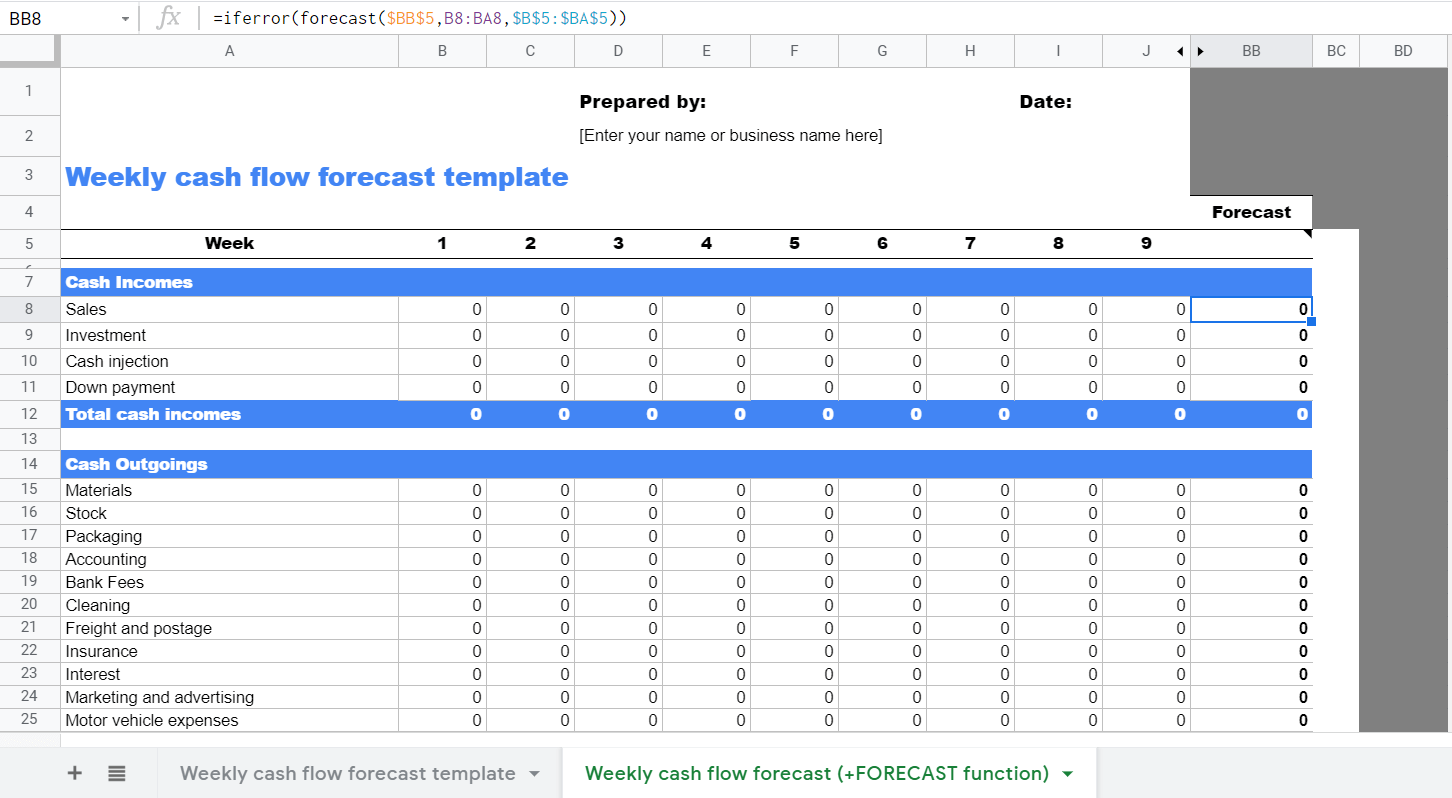
If you want to make cash flow projections on a weekly basis, then you may benefit from this template. It allows you to calculate the expected cash inflows and outflows once you input the financial data from the past weeks.
Use the Weekly Cash Flow Forecast (+FORECAST function) to automate the forecast.
12 months cash flow forecast template
Template for manual forecasting
Template with integrated FORECAST function
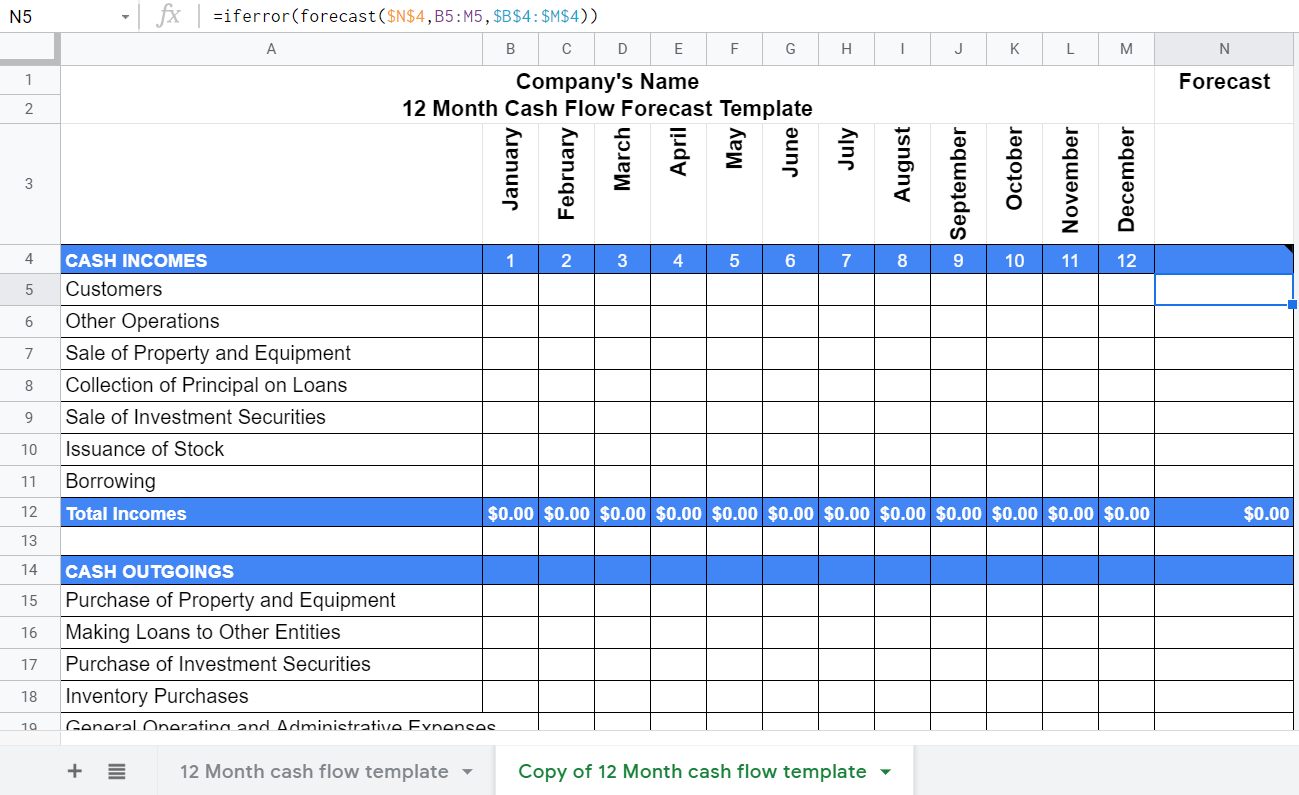
Monthly cash flow projections are best for small business purposes. This 12 months cash flow forecast template is a ready-to-use cash flow table that you can modify for your business or project. All you need to do is input financial data from the past month just like we did in the example above. The template will automatically calculate the key values, so you can make a cash flow forecast easily.
Use the 12 Month Cash Flow Forecast (+FORECAST function) to automate the forecast.
Business cash flow forecast template
There is no universal template that will suit every type of business. However, we recommend starting with the 12 months cash flow forecast template. You can easily adapt it for your business, be it a small retail shop or a large ecommerce store. Later on, you can decide whether you need short-term forecasting models or not.
Personal cash flow forecast template
Hmm, most of the article was about cash flow forecasting for business. At the same time, you can freely use the described best practices and templates for personal finance. We recommend building a personal expenses tracker in Google Sheets or using a ready-made one. This tool is meant to help you categorize expenses by category and analyze how much you spend on each. Here is a ready-to-use template that you can utilize to forecast cash flow.
Project cash flow forecast template
Template for manual forecasting
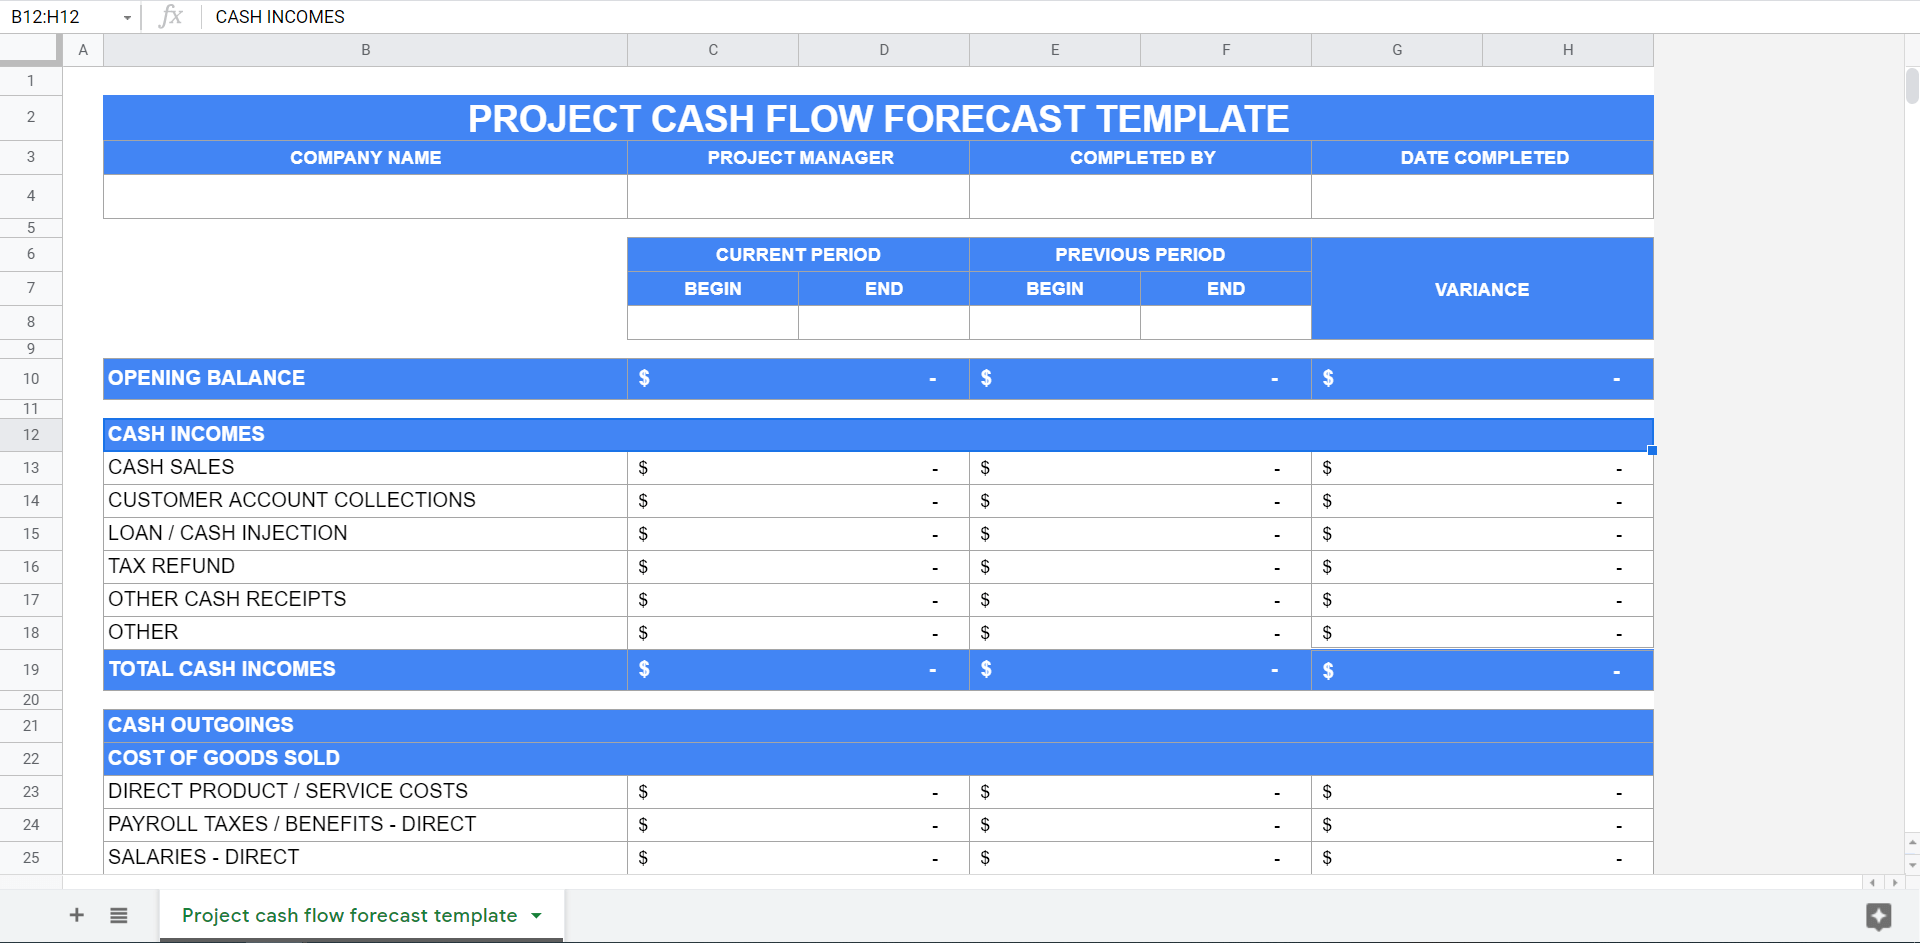
You can use this template to forecast cash flow for your project based on a flexible time range. For example, you may analyze income and expenses for the last 16 days, and your forecast period can be bigger, e.g., 25 days. However, we do not recommend going this way since a flexible time range usually results in higher gaps in estimates.

Create dynamic cash flow reports with Coupler.io
Get started for freeHow can I make my cash flow forecasts more accurate?
To increase the accuracy of your forecasts, you need to analyze as much data as possible. Financial data for two months is not reliable for a thorough analysis. If you want to do your best, it would be better to analyze the data for the previous years, so you can track tendencies, variations, seasonality, and other influencing factors. For example, you can do this by visualizing data with Google Sheets marketing dashboard templates.
Another important thing is to think long-term. When you know the ins and outs of your business, you can predict the expenses that may seem unexpected at first glance for inexperienced professionals. Nevertheless, it’s unlikely that you will ever manage to make 100% accurate predictions. But you can make an effort to approach this value. Good luck!