Power BI is a great option to visualize all your business data in one place. It connects to many different services you use for your business, including Salesforce. You can create beautiful visualizations with this tool while extracting valuable insights from your Salesforce data.
The good news? Connecting Power BI to Salesforce is a quick and easy process. And in this article, we’ll show you how! ?
Power BI connect to Salesforce – What are the options?
The following are some ways you can connect Microsoft Power BI to Salesforce:
Use the Salesforce to Power BI connector by Coupler.io
Many third-party integration tools allow you to pull data from Salesforce based on API calls. An example of this is Coupler.io. It’s a data integration platform with AI analytics support that offers a connector to automate exports of Salesforce data directly to Power BI.
Use standard Power BI connection to Salesforce
One way to connect Microsoft Power BI to Salesforce is by using the standard connectors. There are two different types of these. Each is designed to connect to different categories of your customer data in Salesforce.
Here are the two connectors:
- Salesforce Objects. It connects to standard objects (such as Accounts, Contacts, Opportunities, Leads, Cases, etc.) and custom objects you create on Salesforce. Often, objects are related to one another. And when using this connector to get data from multiple objects that are related, it may be necessary to apply joins/mergings.
- Salesforce Reports. It connects to Salesforce reports you’ve already built on the platform.
We’ll see step-by-step how to use these connectors in the later section.
Use Microsoft Power BI apps
There are Power BI template apps you can install to connect to Salesforce. With these apps’ pre-made dashboards and reports, you can get started right away analyzing and gaining insights into your sales data.
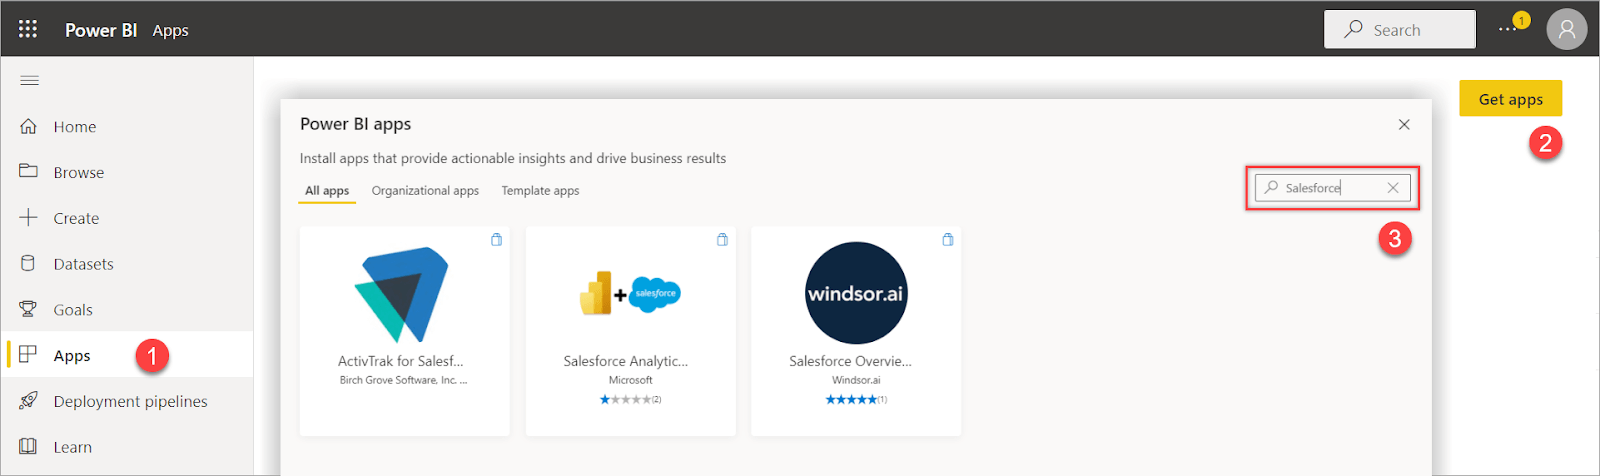
One way to find the apps is by opening the Power BI service and selecting Apps in the navigation pane. Then, click Get apps in the upper-right corner. A window that shows a list of Power BI apps will appear. After that, type “Salesforce” in the Search box to filter the apps. You will see a few apps on the search results.
How to connect Power BI to Salesforce using an integration app – Coupler.io
This is the most actionable option since it allows you to not only connect Salesforce to Power BI but also automate the data flow at a desired schedule.
The process of connecting Power BI to Salesforce starts with creating a Coupler.io account for free. Click Proceed in the form below where we’ve preselected Salesforce as the data source and Power BI as the destination.
Alternatively, Coupler.io makes it easy to automate the export process from Salesforce to Excel, Google Sheets, Looker Studio, and BigQuery.
STEP 1. Extract data from Salesforce
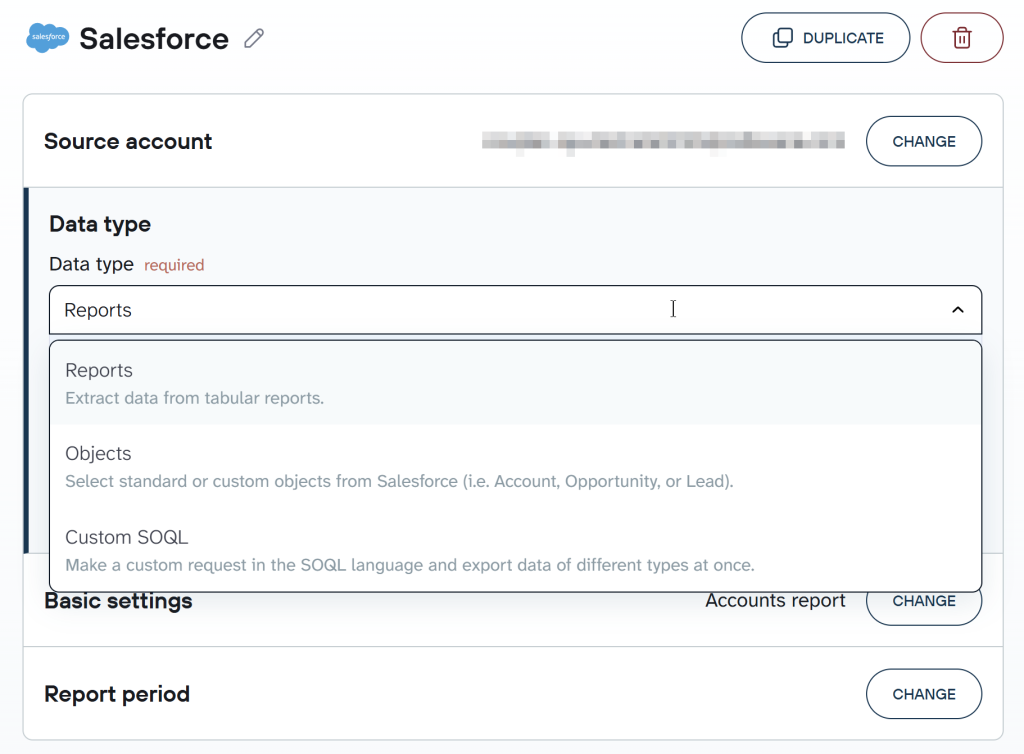
Connect to your Salesforce account and select how to export your data – using pre-defined data categories or with a custom SOQL request. Based on the chosen value, you’ll need to either select a desired data entity or enter an SOQL query.
Coupler.io allows you to combine data from multiple sources into one destination. So, you can click Add one more source and combine the selected Salesforce data entity/query with other ones or even with the data from other applications.
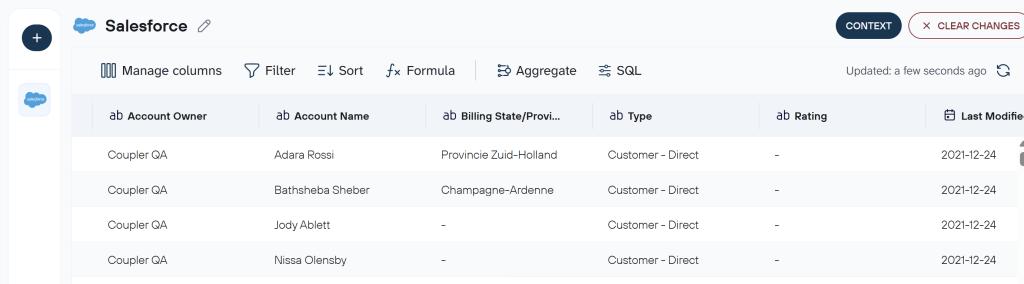
STEP 2. Organize Salesforce data set before loading it to Power BI
The next step is to preview the data you’re going to extract and transform it if necessary. The transformation options include:
- Columns management – you can hide, rename, reorder, and change the data type of columns.
- Calculable columns – you can add new columns using supported calculation formulas.
- Data filtering – you can filter data based on the selected criteria and specified values.
STEP 3. Load Salesforce data to Power BI
Once the data is ready, you can load it to Power BI. For this, you need to follow the instructions on the wizard that explain how you can connect Coupler.io to Power BI.
Basically, you’ll need to do the following:
- Save and run your data flow
- Copy the provided Power BI integration URL (you can refresh it if necessary)
- In Power BI, choose Get data from Web and insert the URL.
Welcome your Salesforce data to Power BI.
Once the data is loaded to Power BI, you can automate the Salesforce to Power BI integration to refresh the data set on a custom schedule. For this, toggle on Automatic data refresh either during the data flow setup or at any time later. This feature requires you to specify the schedule for automated data exports:
- Choose the interval (ranging from monthly updates to every 15 minutes).
- Select specific days for the automated export.
- Set the preferred time.
- Specify the applicable time zone for accurate scheduling.
You’re all set! Coupler.io will automatically update data from Salesforce in Power BI. You can now start building the reports and Salesforce dashboards you need.

Connect Salesforce to Power BI with Coupler.io
Get started for freeHow to link Power BI to Salesforce
Now, let’s see how to retrieve Salesforce objects and reports using the standard Power BI connectors. You can follow the steps below using Power BI Desktop in just minutes!
Power BI connect to Salesforce objects
To connect to a Salesforce Object:
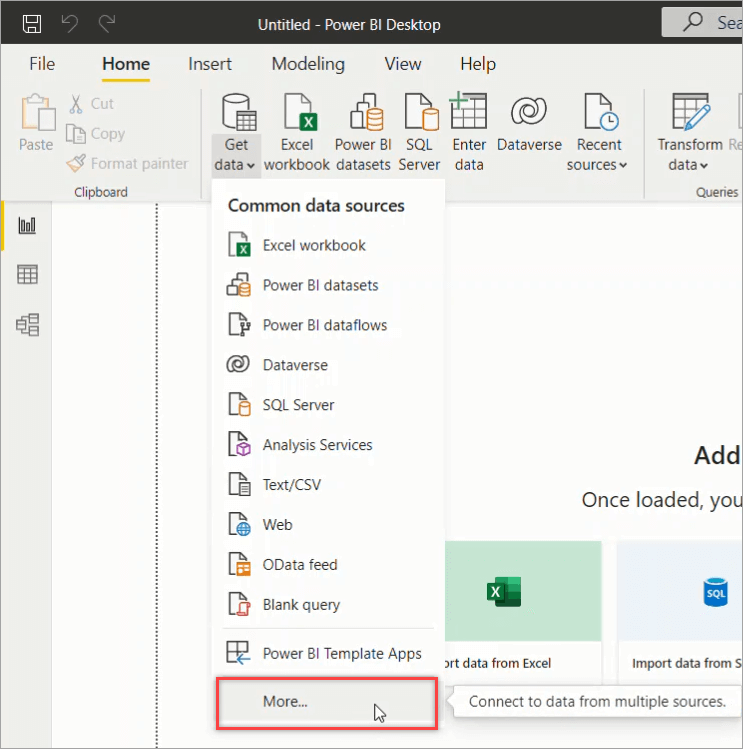
STEP 1. Click Get Data. On the dropdown list that appears, select More…
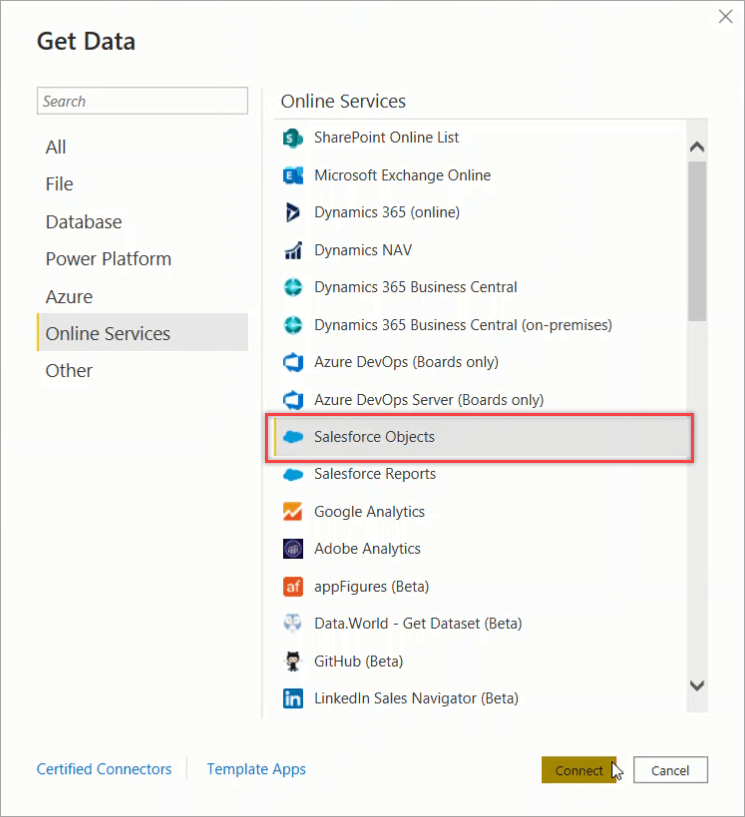
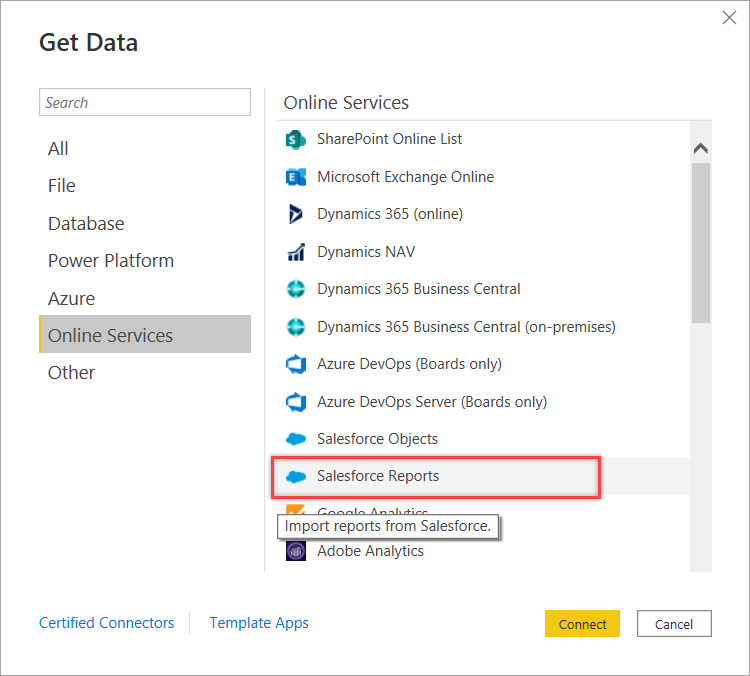
STEP 2. On the left pane, select Online Services. On the connector list on the right, select Salesforce Objects, then click Connect.
STEP 3. In the Salesforce Objects window, choose the URL to sign in and click OK to continue.
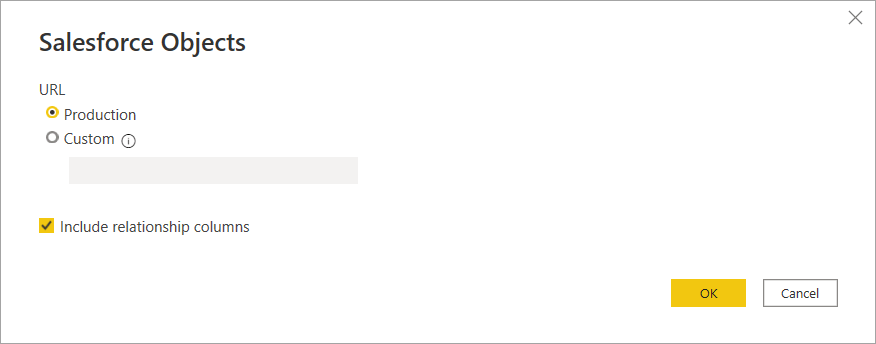
By default, Production URL is selected. You can also choose Custom and enter a custom URL to sign in. This might be the domain you’ve created within Salesforce, such as:
https://company.salesforce.com
Check the Include relationship columns option to bring the relationships between objects into Power BI.
STEP 4. Click Sign in to sign in to your Salesforce account. A window will appear, allowing you to enter your login credentials. Once you’ve successfully signed in, click Connect.
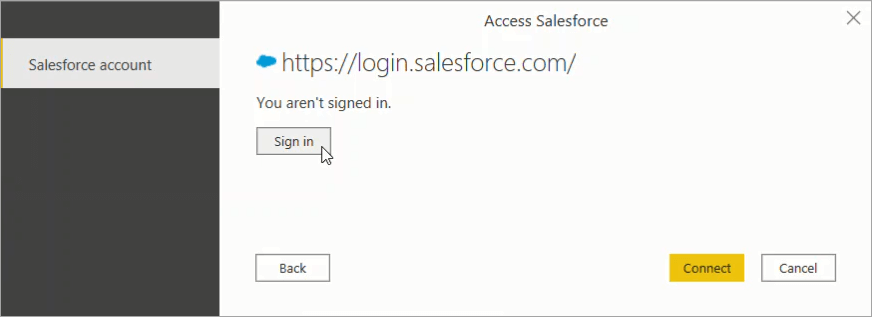
Please note that the first time you sign in, you will be asked to verify your identity by entering a code sent to your email address.
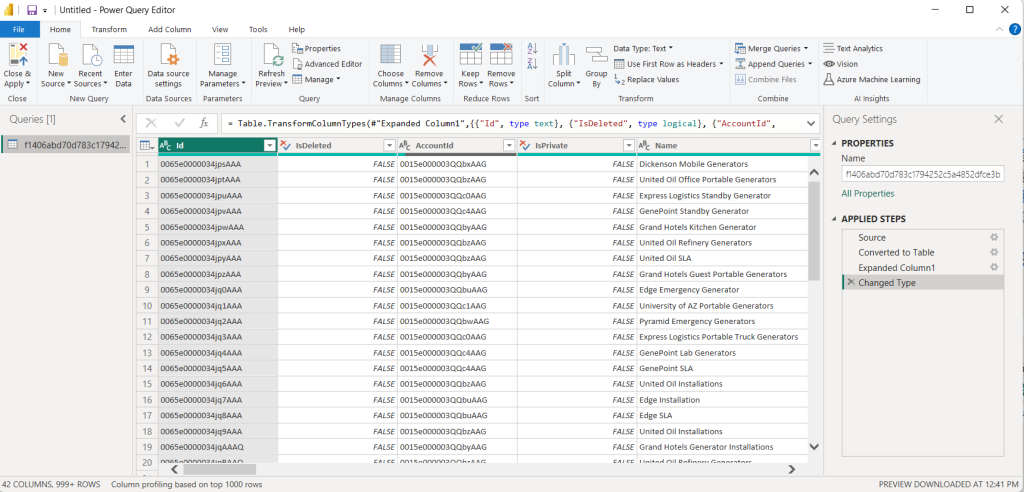
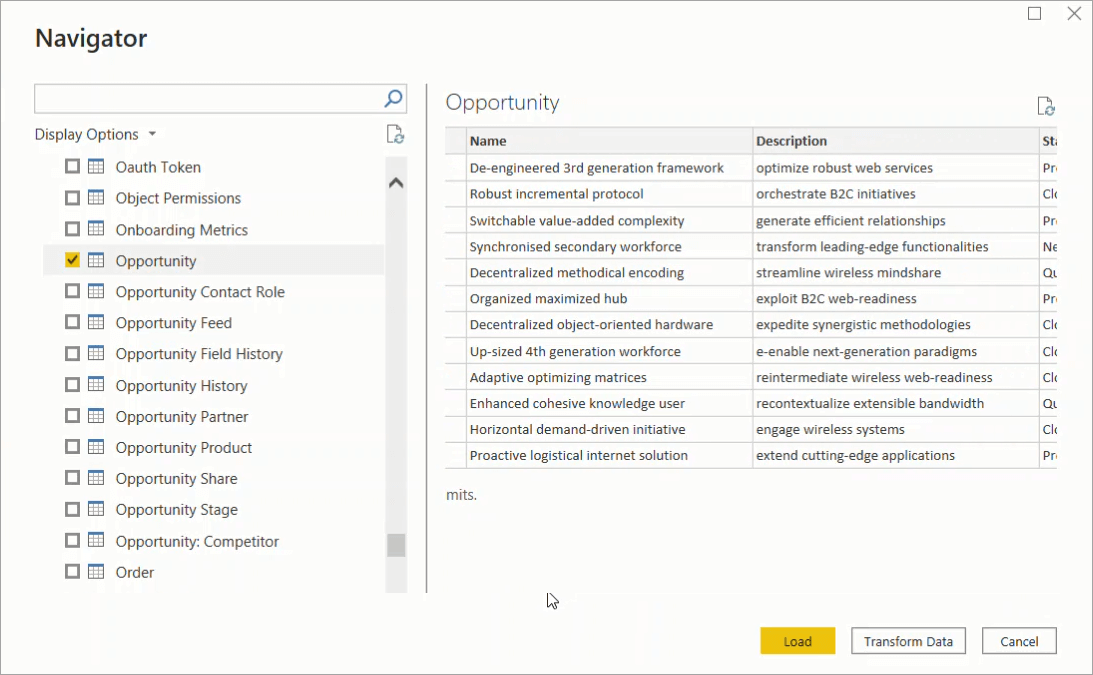
STEP 5. In the Navigator window, select one or multiple objects you want to load. You can then click Load to load the data or click Transform Data to apply data transformations before loading.
Power BI – connect to Salesforce report
Basically, connecting to a Report is similar to connecting to an Object. You will only have slight differences in some of the steps.
One important thing to note is that you can only retrieve 2000 rows using the Salesforce Reports connector. This limitation is set by Salesforce. As a workaround for this Power BI to Salesforce connection issue, you can use the Salesforce Objects connector to retrieve all the rows and recreate the reports you want — from scratch.
Follow the steps below to connect to a Salesforce Report:
STEP 1. Click Get Data. On the dropdown list that appears, select More…
STEP 2. On the left pane, select Online Services. Next, select Salesforce Reports on the right and click Connect.
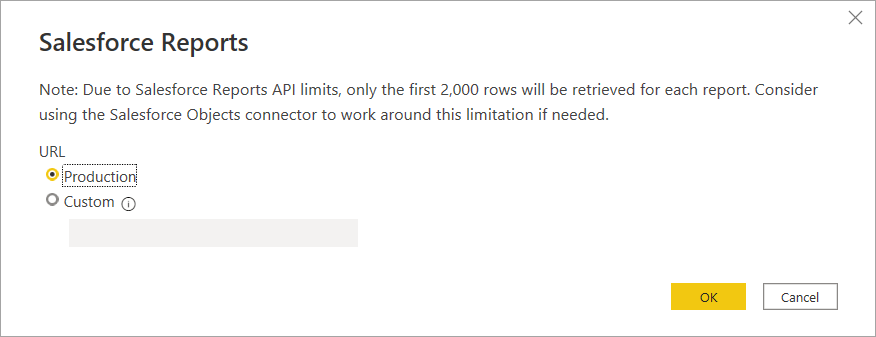
STEP 3. In the Salesforce Reports window that appears, choose the URL you use to sign in to Salesforce. By default, Production is selected. Choose Custom if you want to connect to a custom domain or sandbox.
Notice that the connector limitation is displayed on this window.
STEP 4. Click Sign in to sign in to your Salesforce account. A window will appear, allowing you to enter your login credentials. Once you’ve successfully signed in, click Connect.
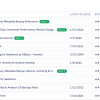
STEP 5. In the Navigator window, select one or several reports you want to load. Then, click Load to load the data or click Transform Data to apply data transformations first.
Power BI & Salesforce examples
In this section, we’ll use the Salesforce Objects connector to get data into Power BI and create visualizations.
We’ll create a report in Power BI and then make a dashboard from this report. Sounds interesting and worth your time? Let’s go through the examples below!
Power BI Salesforce report
Let’s get started by creating an Opportunity Report that pulls data from two Salesforce objects: Account and Opportunity.
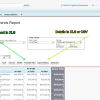
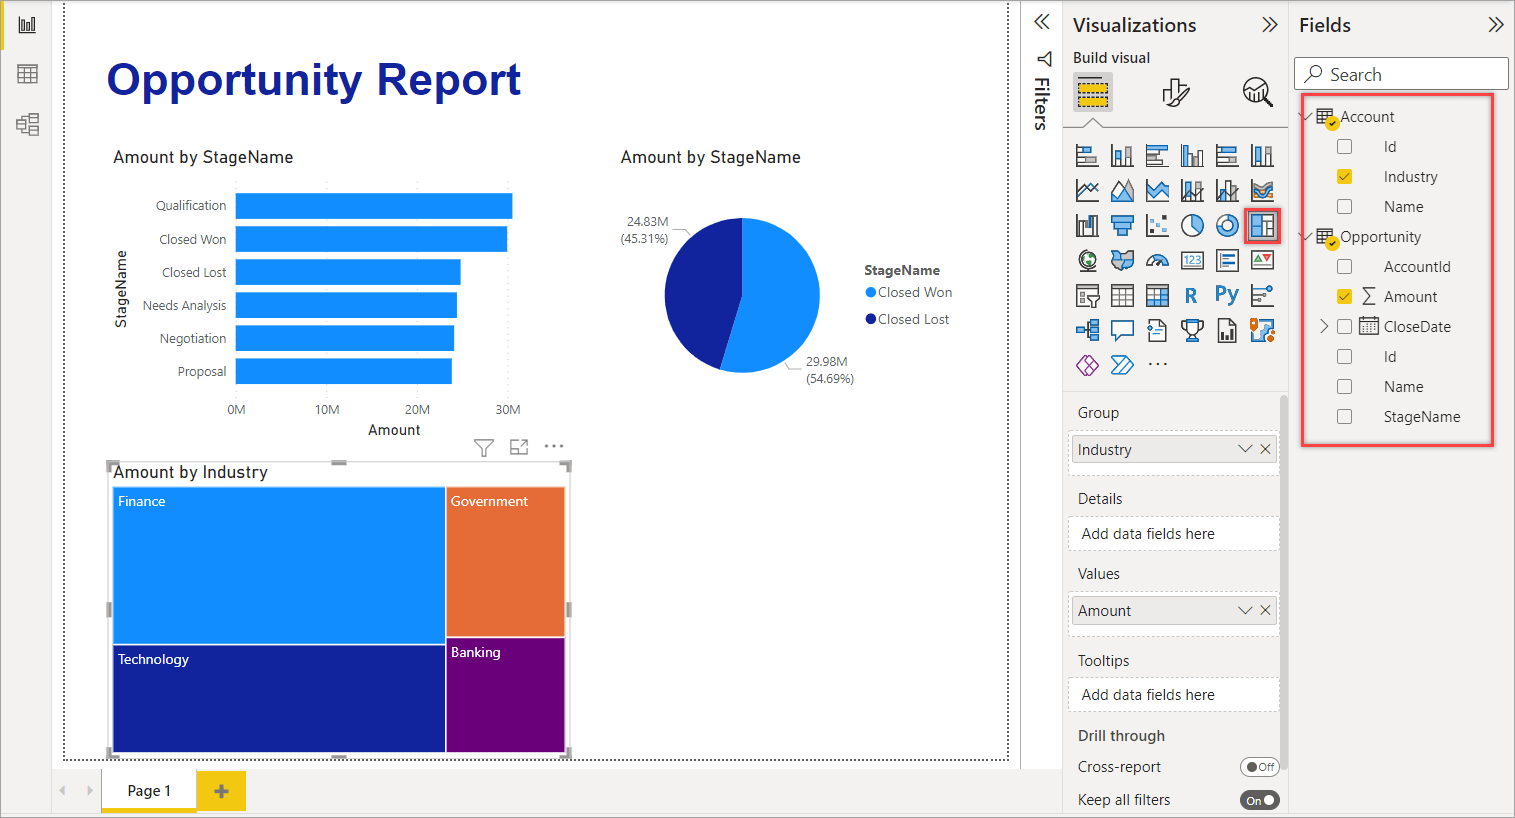
Here’s the final report we’re going to build:
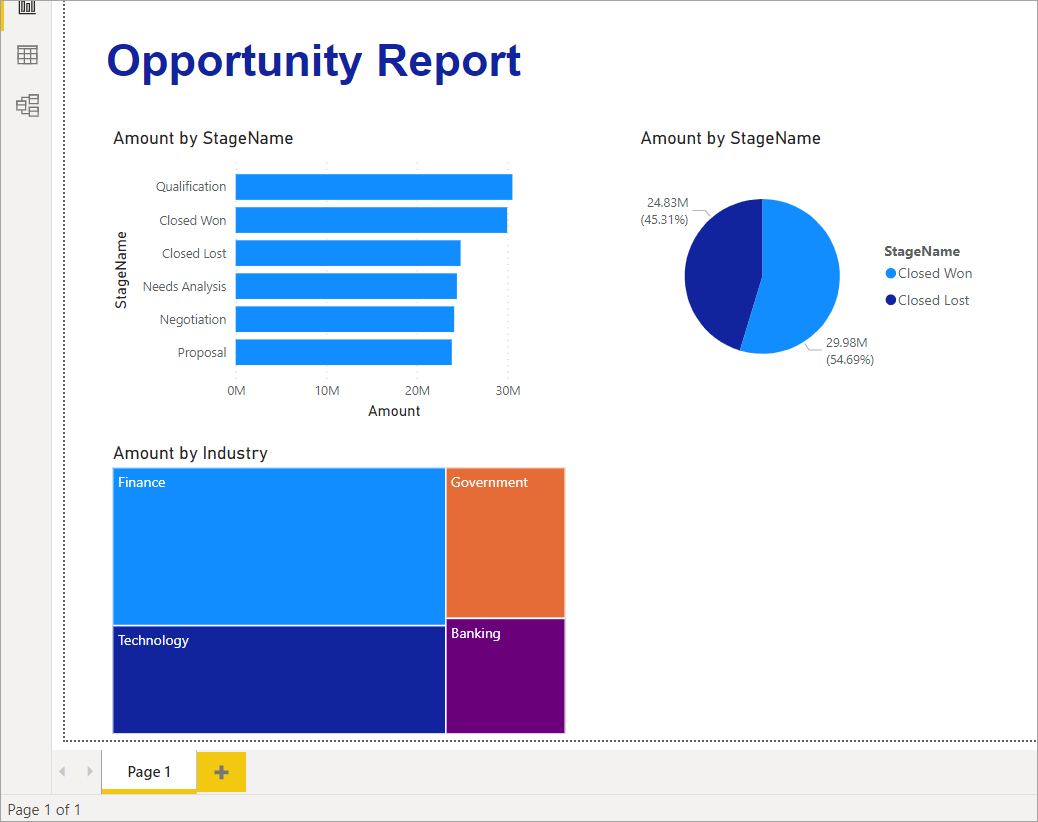
As you can see, the report has 3 charts showing Opportunity amounts by different dimensions:
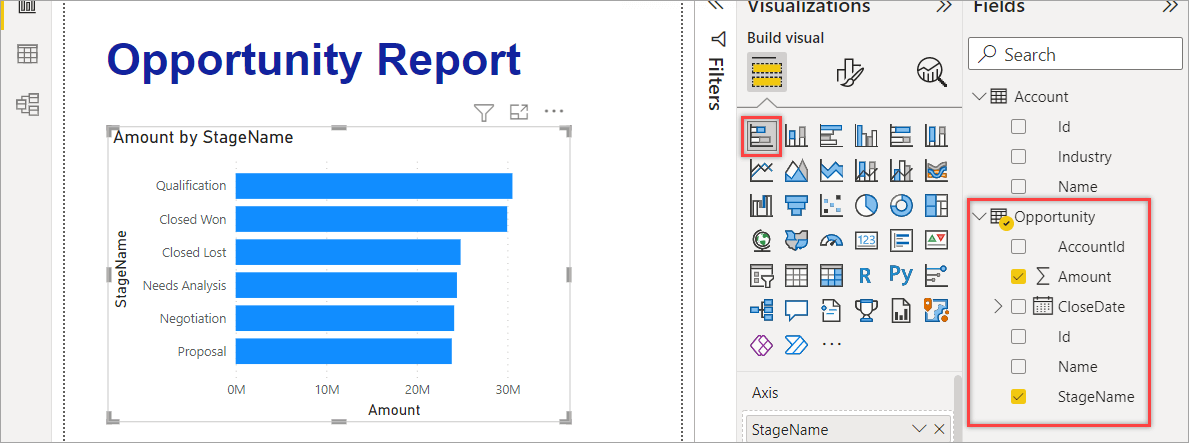
- The first one is a bar chart showing Amount by Stage Name.
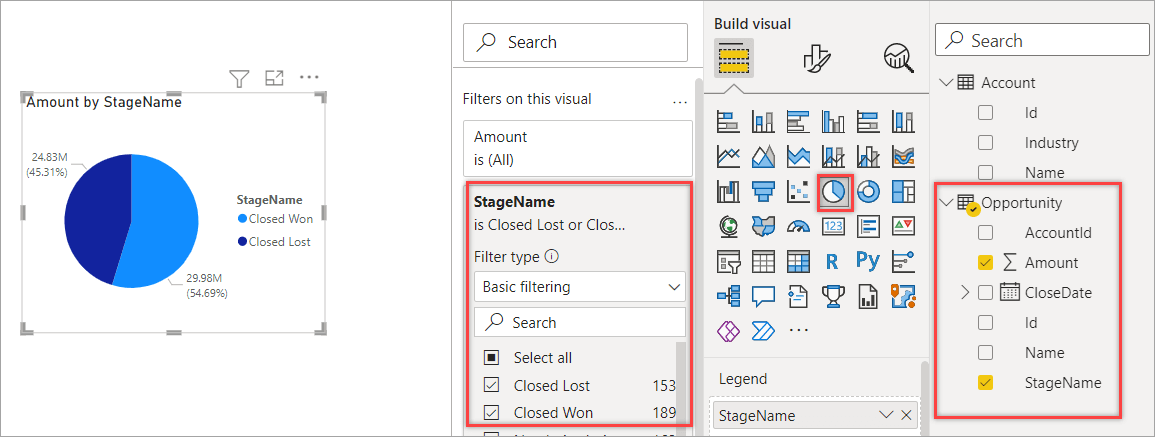
- The second one is a pie chart comparing the Amount for Closed Won vs. Closed Lost.
- The third one is a treemap chart visualizing the Amount by Industry.
To create the above report, follow the steps below:
STEP 1. Open Power BI Desktop and follow STEP 1-5 of connecting Power BI to Salesforce Objects explained previously. In the Navigator window, select Opportunity and Account, then click Transform Data.
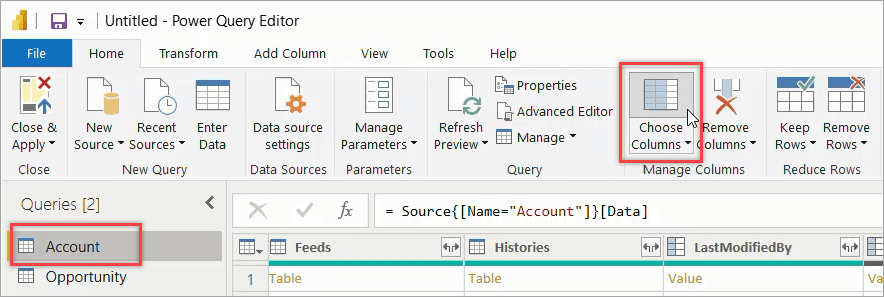
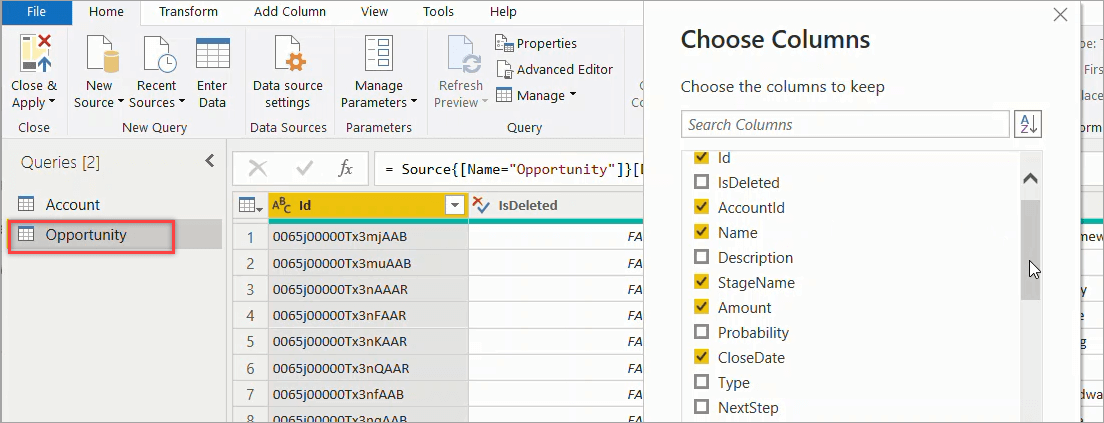
STEP 2. In the Queries pane, click Account. Then, click Choose Column in the Home tab to select only necessary columns that may be necessary for the report.
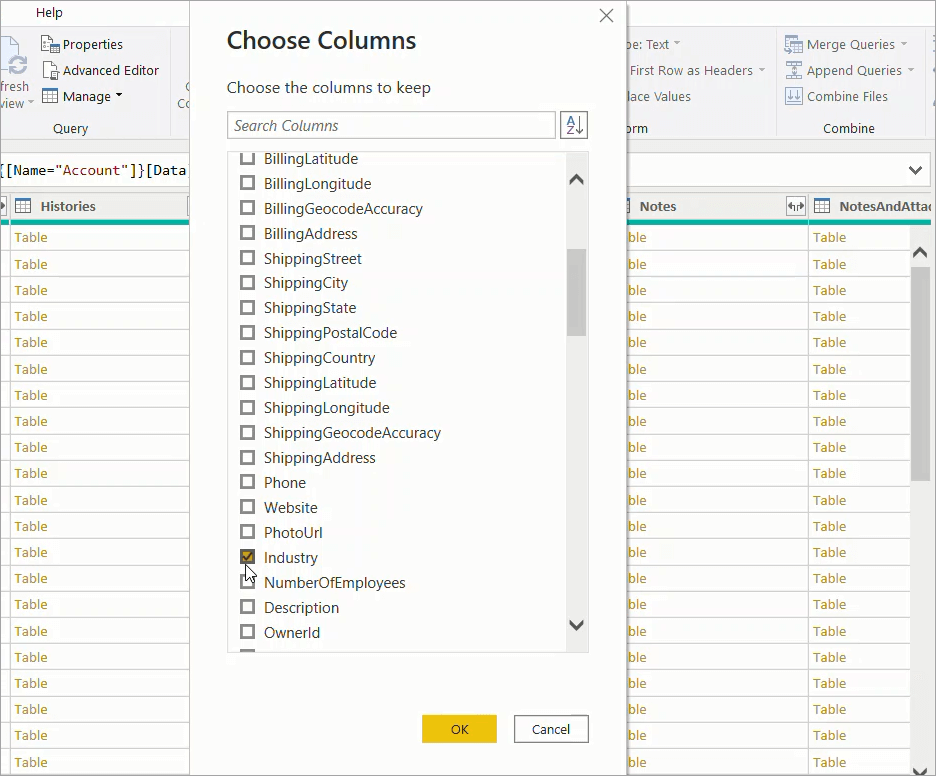
In the Choose Column window, select Id, Name, and Industry column, for example. When done, click OK to close the window.
STEP 3. Apply STEP 2 for Opportunity and let’s select only Id, AccountId, Name, StageName, and Amount columns.
STEP 4. Click Close & Apply.
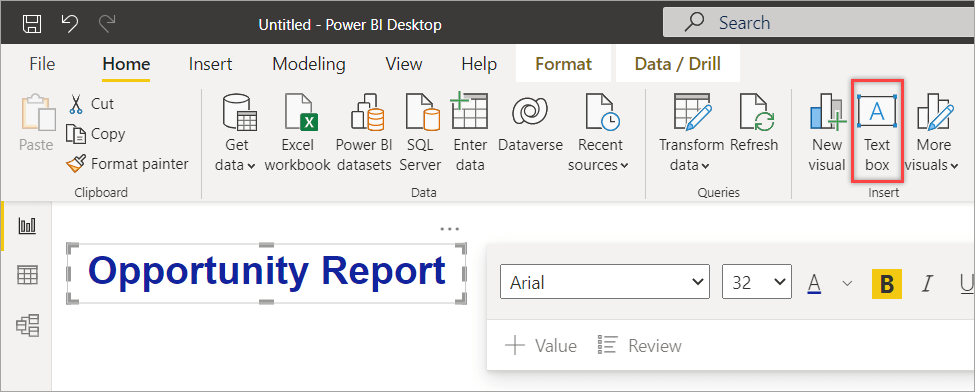
STEP 5. Click Text box and type a title for the report. Customize its font as you like.
STEP 6. Select the Stacked bar chart icon to create a bar chart showing the total Opportunity amount by Stage. Select Opportunity Amount and StageName in the Fields pane.
STEP 7. Select the Pie chart icon to create a pie chart showing the total Opportunity amount for Closed Won vs. Closed Lost. In the Fields pane, select Opportunity Amount and StageName. Then, add a filter for StageName to include only Closed Won and Closed Lost.
STEP 8. Select the Treemap icon to visualize the total Opportunity Amount by Industry. In the Fields pane, select Opportunity Amount and Account Industry.
STEP 9. Click File > Save and save the report as Opportunity Report.pbix to the location you want.
Power BI Salesforce dashboard
Dashboards are a feature of the Power BI service. So, to create a dashboard from the Opportunity Report we’ve just created, we need to publish the report to the Power BI service first.
Follow the below step to create the Salesforce dashboard:
STEP 1. Open Opportunity Report.pbix.
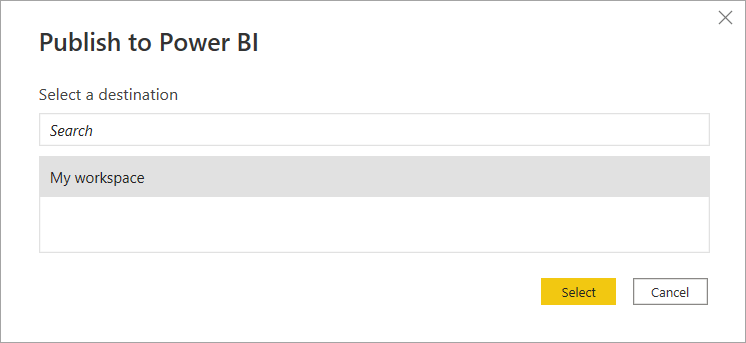
STEP 2. Click File > Publish > Publish to Power BI.
STEP 3. Choose a destination to publish, for example, My workspace. Then, click Select.
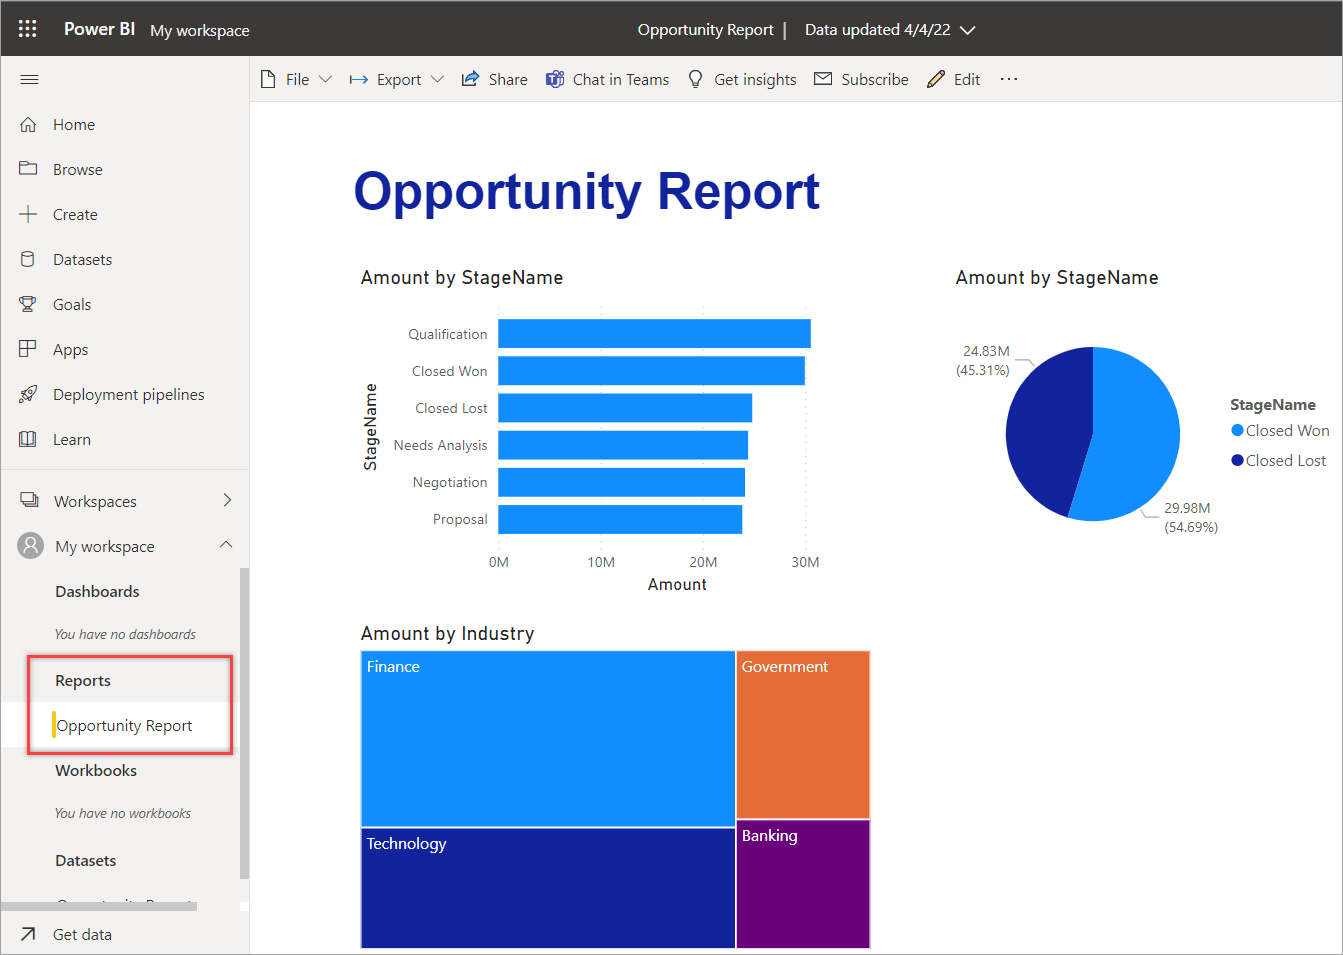
STEP 4. Once published, verify by opening the report in the Power BI service.
STEP 5. Go to My Workspace and click New > Dashboard.
STEP 6. Enter the dashboard name, for example, Opportunity Dashboard.
STEP 7. Open the Opportunity Report.
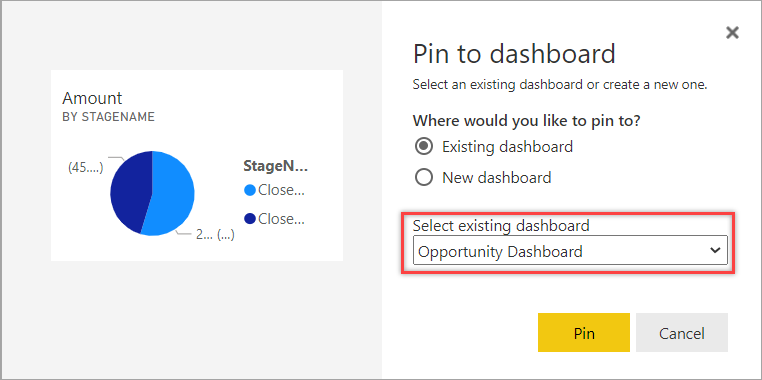
STEP 8. Click the Pin visual icon for the Amount by Stage chart.
STEP 9. On a window that appears, select Opportunity Dashboard, then click Pin.
STEP 10. Open the Opportunity Dashboard. You now have a tile showing the Opportunity Amount by Stage Name.
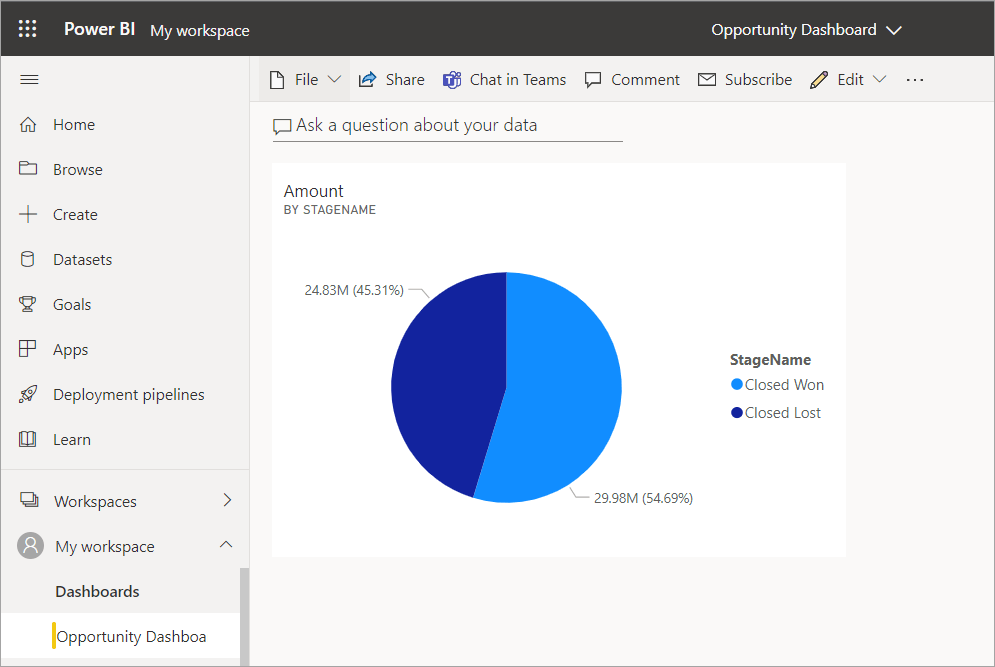
You can also pin tiles from other reports you publish on the Power BI service to tell stories through visualizations.
Learn more about how to use Power BI.
Power BI won’t connect to Salesforce
If you can’t connect Power BI to Salesforce, a few common things might be causing the problem.
First, Salesforce does not support Internet Explorer 11. So, ensure you use supported browsers. You can check out Salesforce’s recommendations and requirements for browsers to get an optimal experience with either Classic or Lightning Experience.
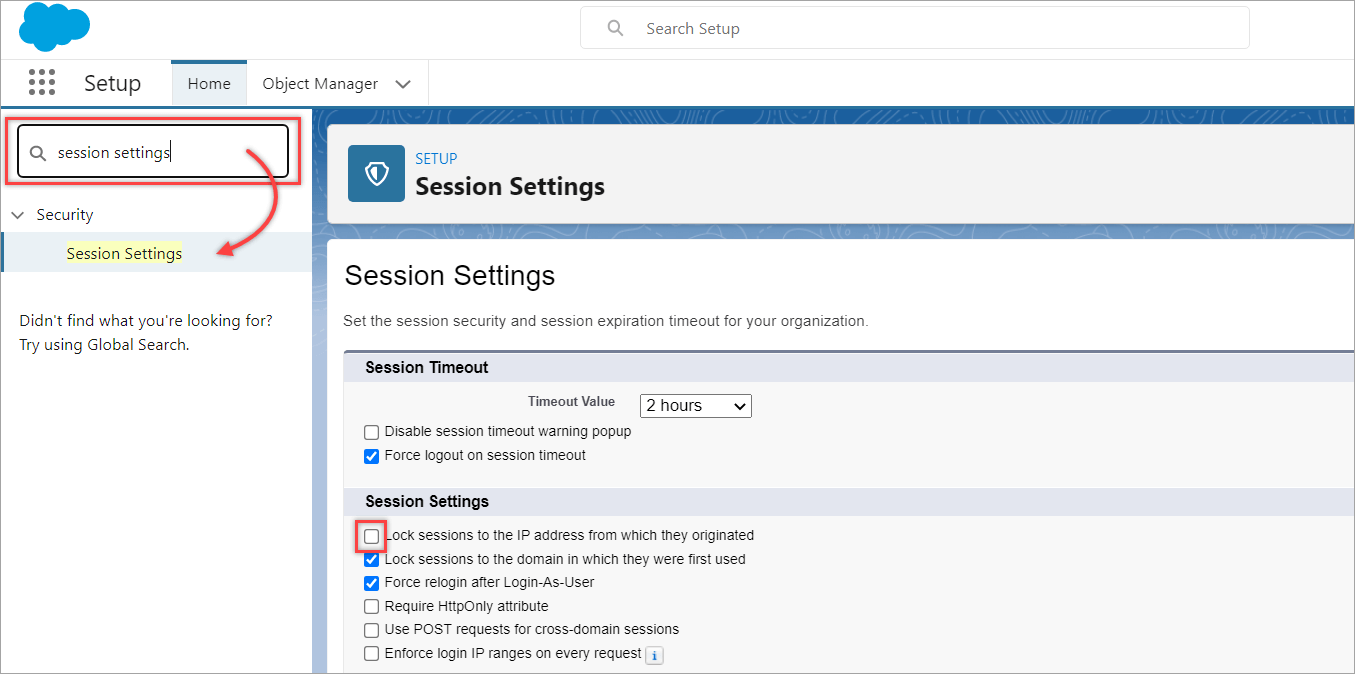
If you still can’t connect, check your Session Settings. Ensure that the option Lock sessions to the IP address from which they originated is unchecked to allow authentication with different ranges of IP addresses.
If you’re still having trouble connecting to your account, contact Salesforce Support for help.
Microsoft Power BI to Salesforce – To sum up
Connecting Power BI to Salesforce can be accomplished in several ways. The easiest way is through Power BI connectors. Depending on the data you want to connect, you can either use the Salesforce Objects or Salesforce Reports connector.
Other than Salesforce, you might need to get data from other services and visualize them in one place using Power BI. In this case, Coupler.io may be worth trying, especially if any of your data sources are not supported by the standard connectors. The tool offers a seamless integration process without coding. You can also set up automatic data refresh on the schedule you want!
And if you want to try visualizing your data elsewhere, Coupler.io also offers the ability to connect Salesforce to Looker Studio. Give it a try if you’d like!
Automate data export with Coupler.io
Get started for free