How to Export Data from Salesforce: CSV, Google Sheets, Excel, and Other Options Explained

Salesforce documentation is rather complicated. You have to jump between multiple pages to understand the options you have for exporting data from Salesforce, and how they work. So we decided to compile all of the useful instructions into one guide. Read on to discover how you can export Salesforce data in many ways.
Export data from Salesforce: What options you have
You can export data from Salesforce in multiple formats and to different destinations.
Automate Salesforce data export to different destinations
Coupler.io, a reporting automation platform, offers a dedicated Salesforce integration. It allows you to export data from Salesforce to Looker Studio, Power BI, Google Sheets, Excel, BigQuery, and other destinations, including AI-powered analysis through the Salesforce MCP. You can automate exports on a custom schedule without any coding. The Salesforce integration supports hundreds of entities available for export, including Campaigns, Products, etc. This is a perfect solution to optimize your reporting and eliminate the challenges associated with it.
Salesforce export data to CSV
- Data Export — This is the native Salesforce functionality to download data as a CSV file. You can run export manually or automatically, at weekly or monthly intervals. Weekly data export is available in Enterprise, Performance, and Unlimited Editions.
- Data Loader – This is a client application for the bulk import/export of data. We won’t cover this option here, since it deserves a separate guide on how to install, configure, and use the Data Loader.
- dataloader.io — This is an app to both export from and import to Salesforce. Data Loader allows you to automate data export/import on an hourly, daily, weekly, or monthly basis. After the export, you need to manually download the exported CSV file to your device. Optionally, you can automate data export to an FTP server, Dropbox, or Box account.
Manually export data from Salesforce to Excel
Microsoft Office Professional Edition provides its users with a built-in Salesforce-to-Excel integration. With it, you can pull Salesforce objects, as well as Salesforce reports, directly into your worksheet.
Export data via the Salesforce REST API
This is a code-based option that opens wide exporting capabilities. However, to be able to export data via the Salesforce API, you’ll need to create a Connected App in Salesforce, obtain an access token, and actually write code to fetch data.
We’ll check out one by one, so you can select the best option for your needs. The fastest, most user-friendly, and most reliable method goes first.
Salesforce data export on a schedule with Coupler.io
You can connect Salesforce to BI tools, data warehouses, and spreadsheets using Coupler.io in 3 simple steps.
Step 1: Collect Salesforce data
Choose a destination app from the dropdown and click on Proceed in the form below. For instance, you can set up a Salesforce Google Sheets integration if you select Google Sheets.
Now, sign up for a free Coupler.io account. If you already have one, log in to your account.
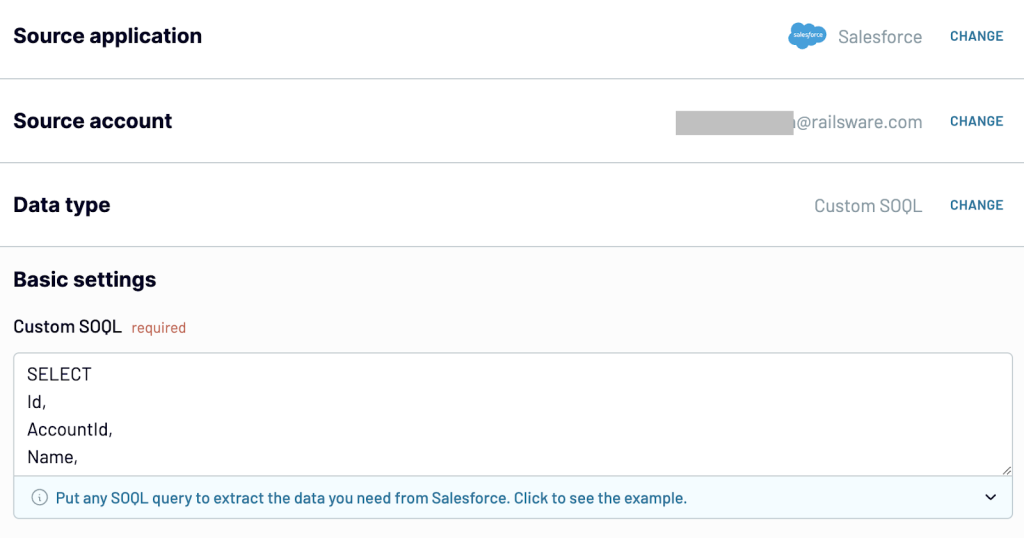
Connect the Salesforce account and configure the source settings. Select how you want to export your data – using pre-defined data categories or with a custom SOQL request. Based on the chosen value, you’ll need to either select a desired data entity or enter an SOQL query.
Step 2: Organize and transform data
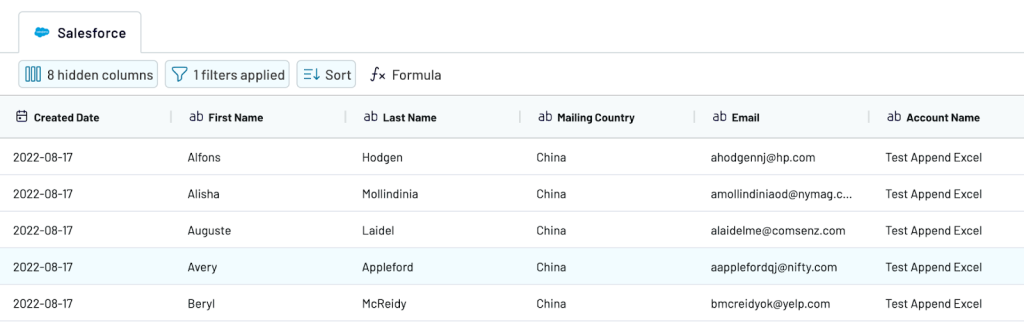
At this step, you can preview and transform the data you’re going to extract from Salesforce. The transformation options include:
- Column management – you can hide, rename, and reorder columns, and edit/change their data type.
- Calculable columns – you can create new columns by using formulas to calculate metrics like annual revenue or opportunity close rates, and more.
- Data filtering – you can easily sort and filter your Salesforce data by specific criteria, like Lead Status, Close Date, or Account Tier.
- Union and Join – you can combine Salesforce data with other sources like marketing databases or customer support logs for a unified dataset.
Step 3: Load data
When the data is ready to load, follow the in-app instructions to configure the destination settings. Choose ChatGPT, Claude, or other AI integrations to get AI-driven sales insights into your data.
Click on Save and Run Importer to kick off the initial Salesforce data export to the chosen destination and launch the connector.
Schedule data export Salesforce
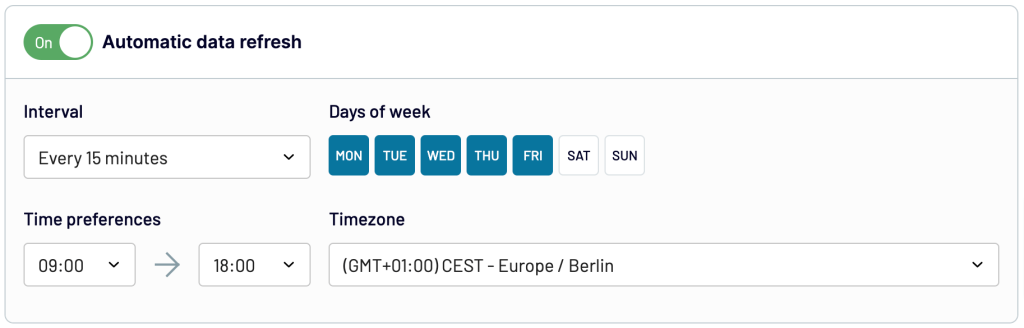
To set up the automated connection between Salesforce and the destination, toggle the Automatic Data Refresh button. Select the time preferences, timezone, and days of the week to automatically export data on a schedule. You can send data from Salesforce every 15 minutes.
With Coupler.io, you get an amazing Salesforce exporting experience. It’s easy to set up, convenient to use, and reliable from any perspective. Scheduled exports are valuable if you’re building a self-updating report or dashboard, or want to create a Salesforce backup copy.
How to export and analyze Salesforce data using dashboards?
Salesforce collects large amounts of sales, marketing, and customer data. It is difficult to analyze or understand this data in the form of tables. But, when visualized properly, it can uncover interesting trends and insights.
BI tools like Looker Studio, Power BI, and Tableau have numerous visualization options. As creating dashboards from scratch can be complex and time-consuming, Coupler.io offers ready-made templates for Salesforce dashboards. To use them, just follow the instructions in the Readme tab. Let’s explore a few Looker Studio templates for Salesforce and how they can make your data analytics easier.
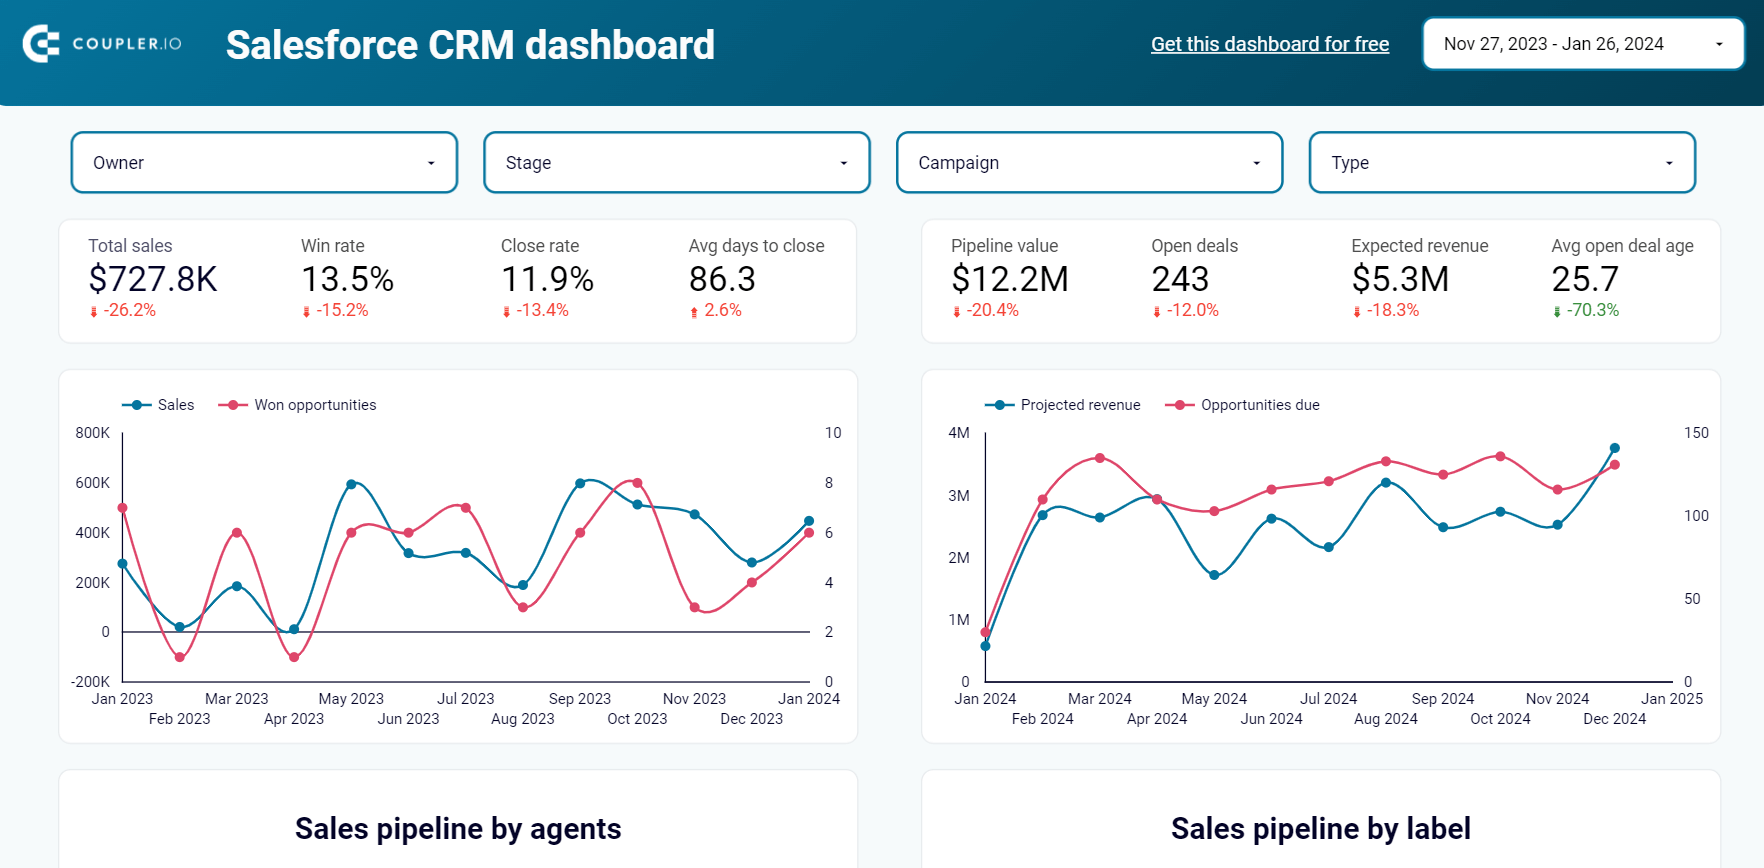
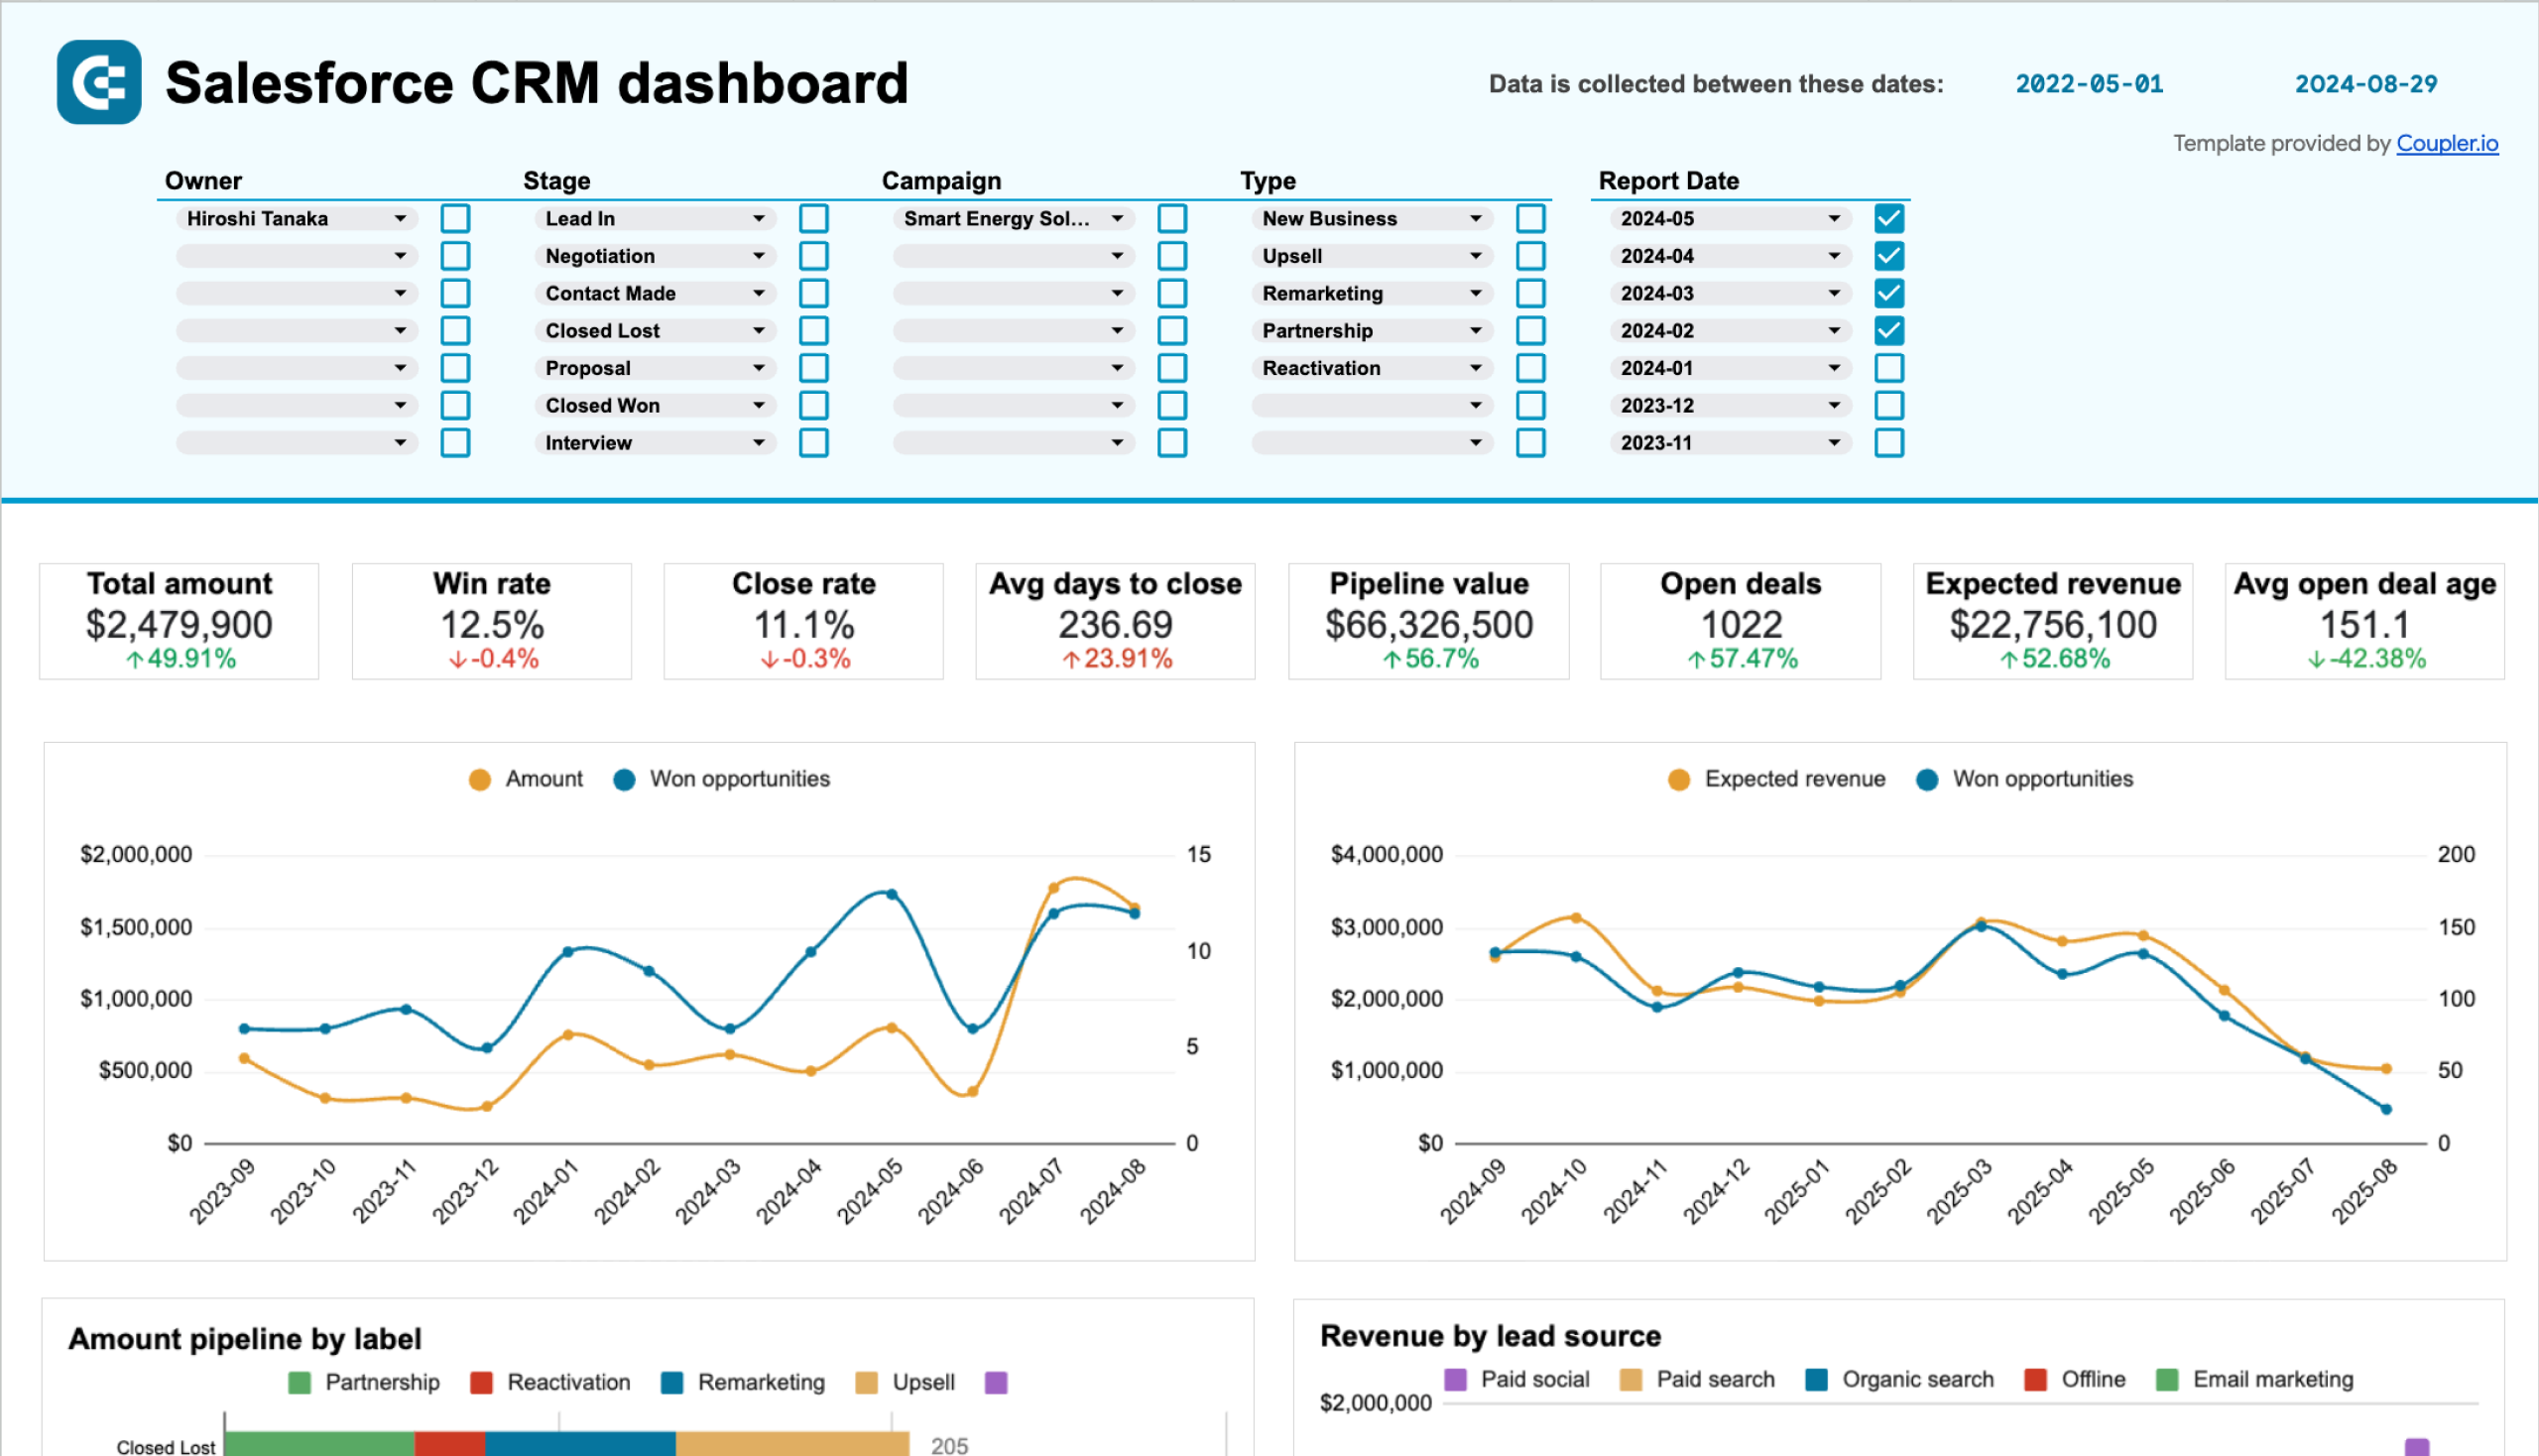
CRM dashboard for Salesforce
Let’s start with the most commonly used dashboard for Salesforce – CRM dashboard. It shows key metrics like Total Sales, Win Rate, and Pipeline Value for a quick health check of your sales.
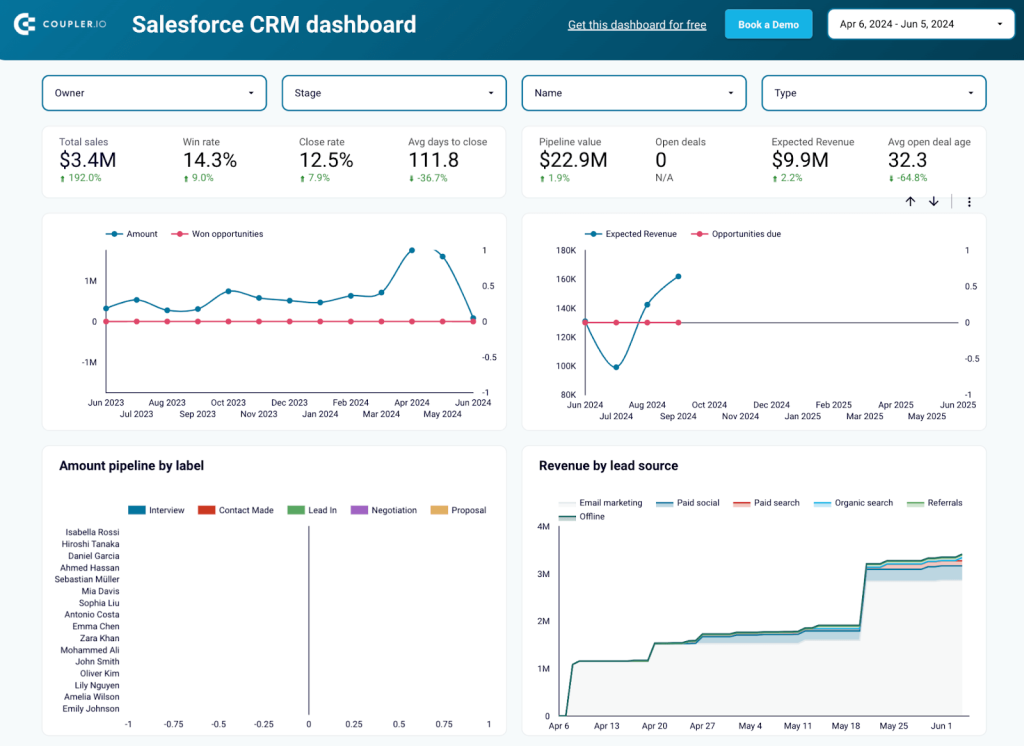
The trend charts help you spot patterns, and pipeline breakdowns show deal progress through stages. The Salesforce dashboard also highlights revenue by lead source and sales reps’ performance. It provides insights into top industries, accounts, and geographical distribution. These visualizations help you quickly identify successful strategies, high-performing team members, and key markets.
The CRM dashboard for Salesforce is available as a template in Looker Studio and Google Sheets. Pick the option that fits your reporting requirements and try it out right away.


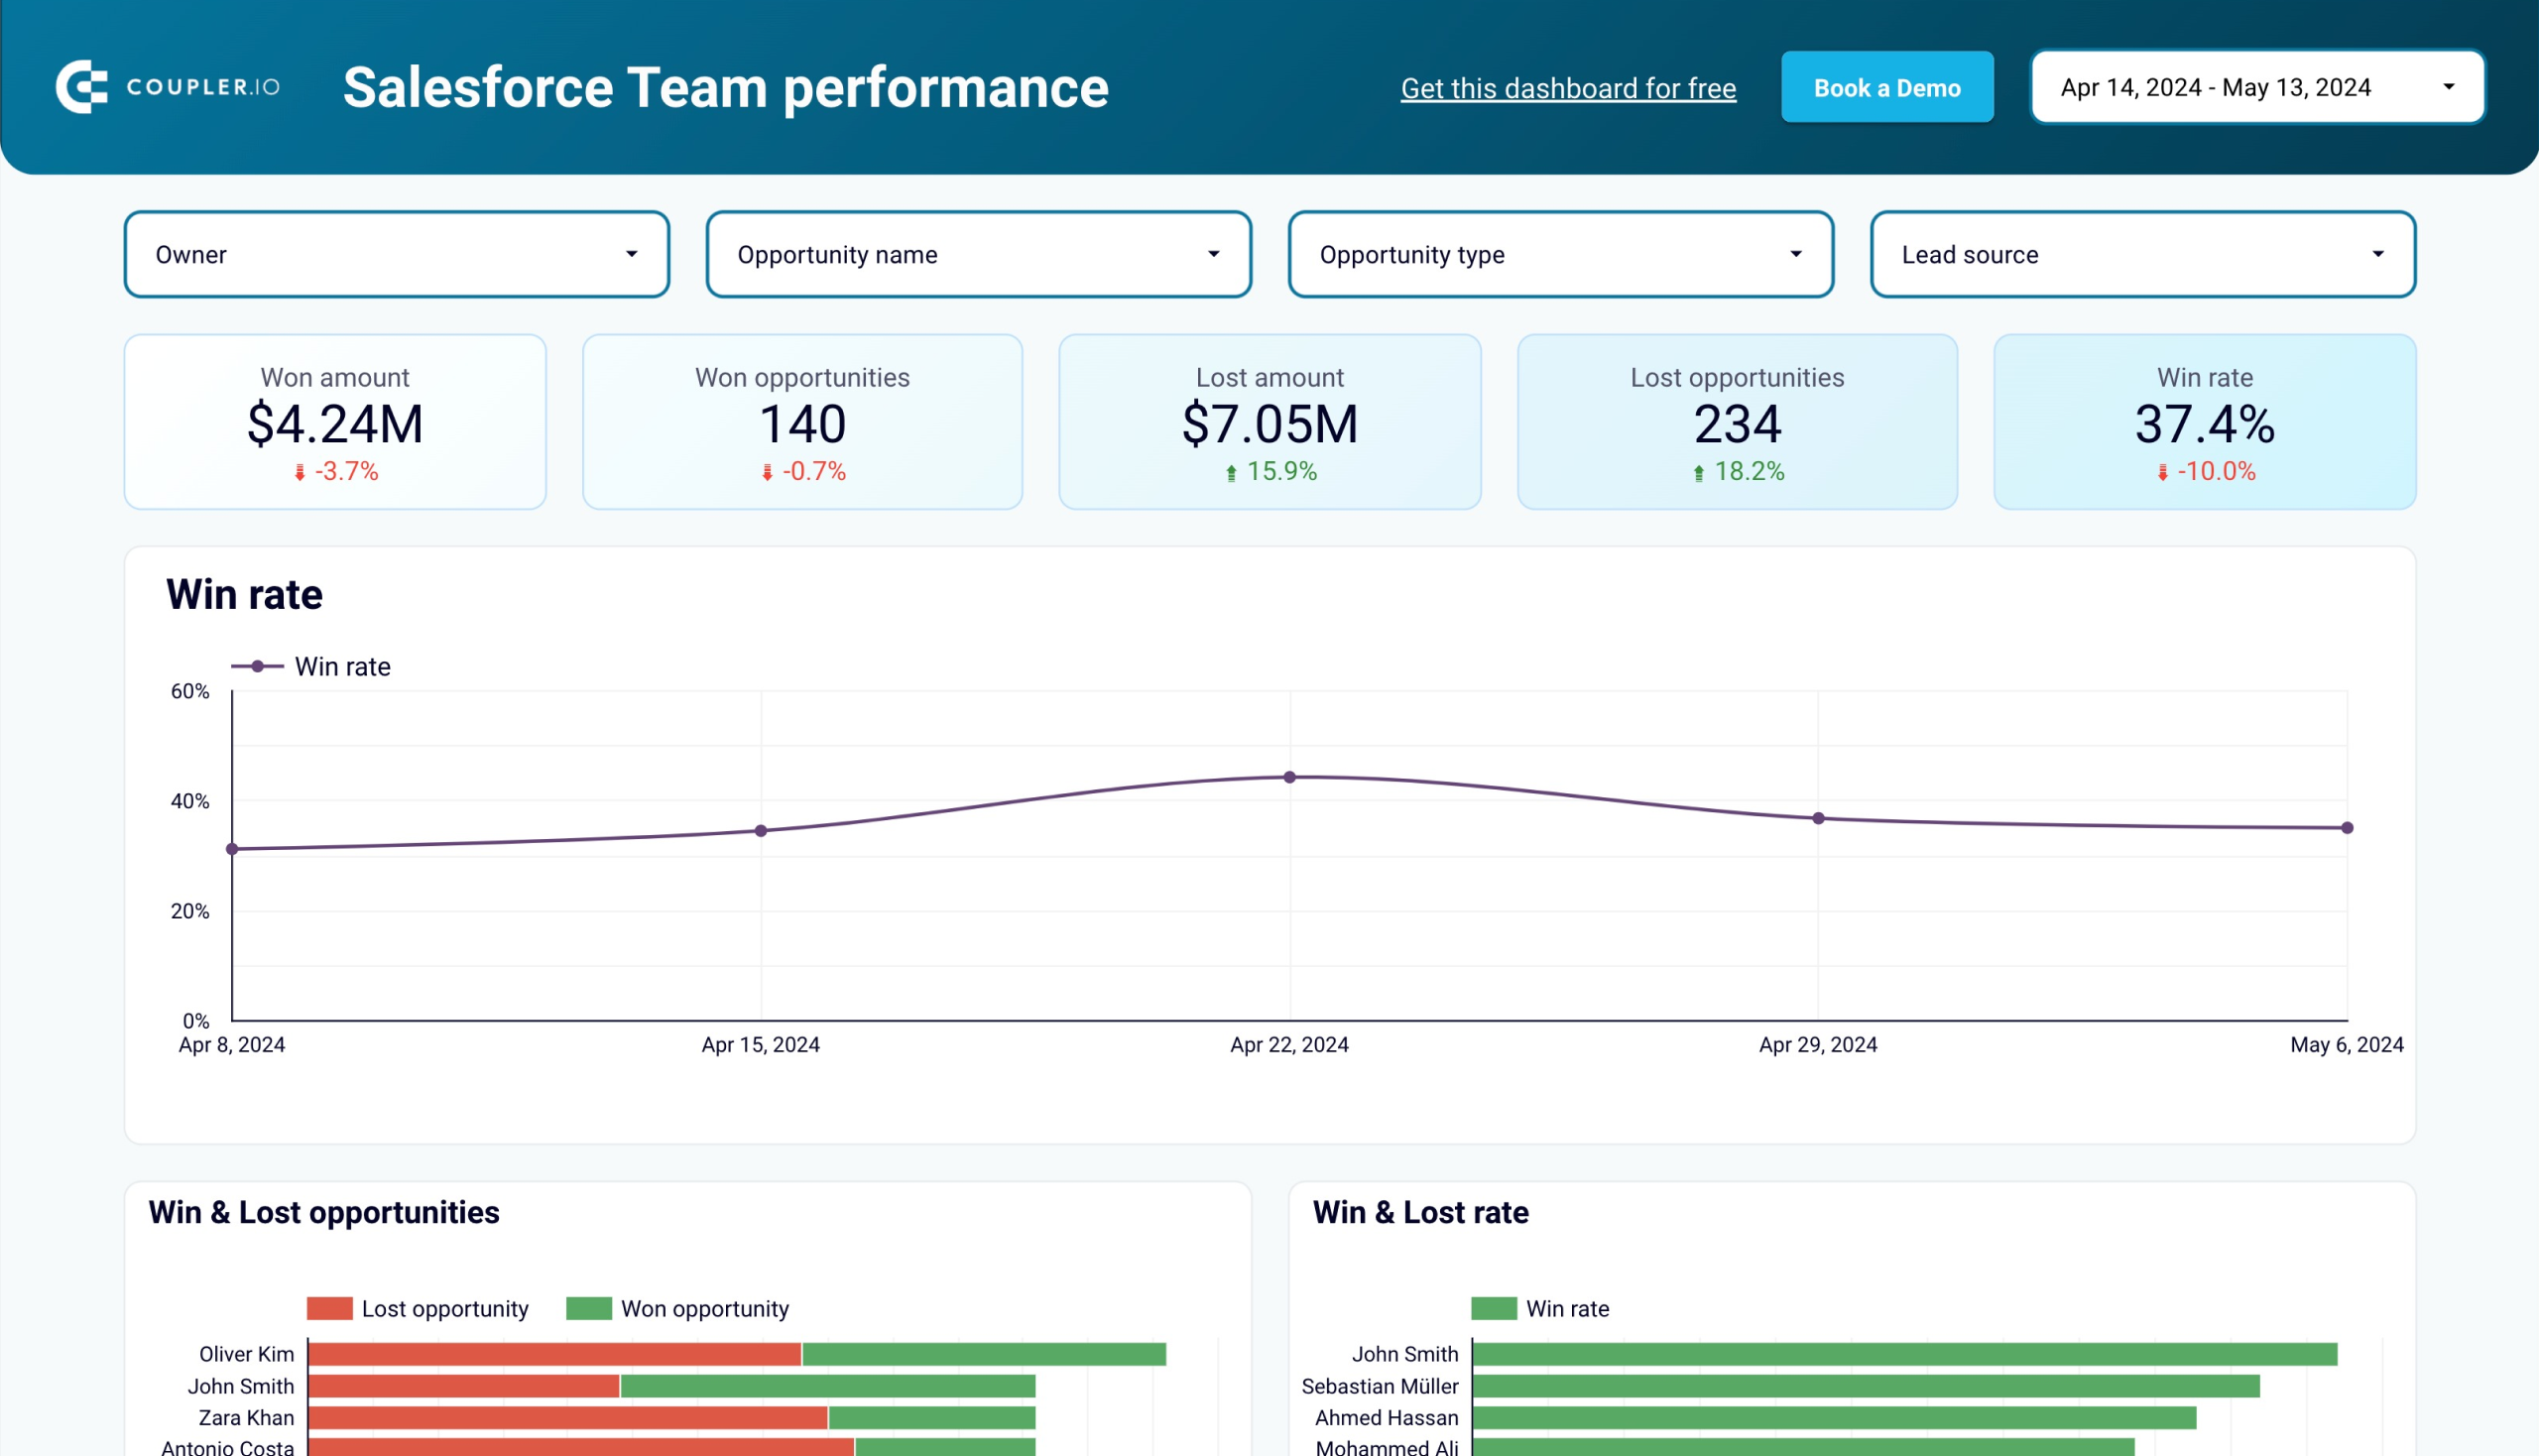
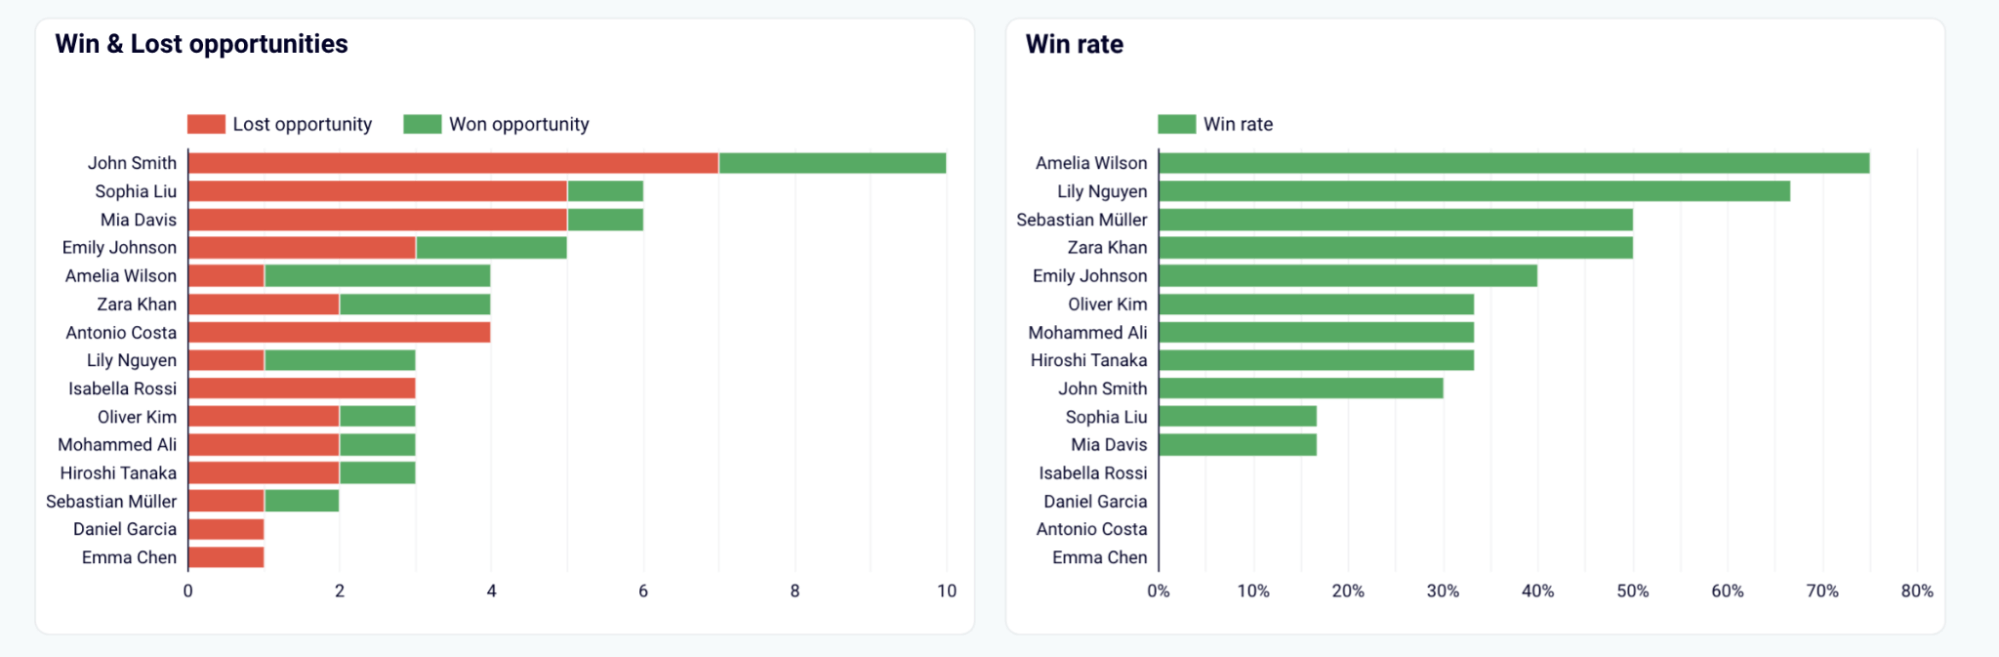
Salesforce team performance dashboard
The Salesforce team performance dashboard lets you focus exclusively on individual team members. It highlights win rates over time and the number of won and lost opportunities per sales rep. You can also see the average amounts of won and lost deals.

The dashboard breaks down performance by opportunity type and size, showing which sales reps excel in different areas. It gives a clear view of the sales pipeline by owner and the stages of opportunities. This helps identify top performers and areas for improvement.
The template to track sales team performance is available for Looker Studio and Google Sheets. Try the version that you like right away.
Salesforce sales dashboard
The Salesforce sales dashboard focuses on two primary metrics – revenue and opportunities. It displays the total amount and number of opportunities with growth percentages.
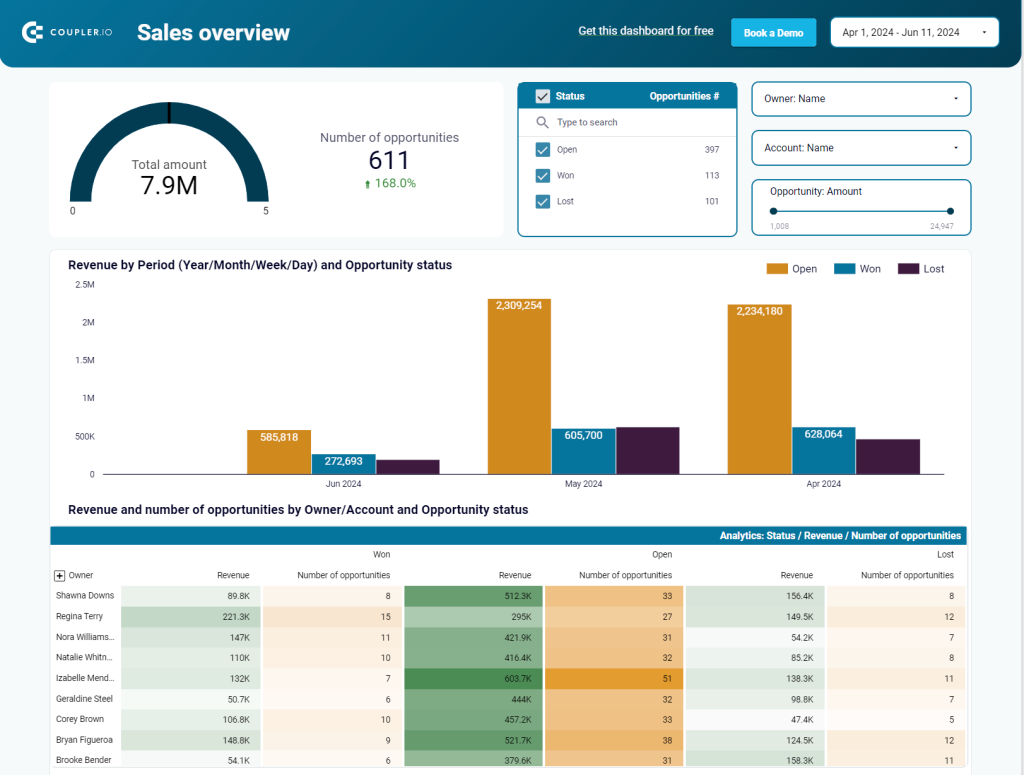
The dashboard breaks down revenue and opportunities by period (year, month, week, day) and by status (open, won, lost). You can see detailed information for open, won, and lost opportunities, including the total amount and count for each category. Additionally, it provides insights into revenue and opportunities by owner, account, and stage, helping you track performance and identify trends.
Salesforce win-loss analytics dashboard
The Salesforce Win-Loss Analytics dashboard helps you understand the success and failure of your sales efforts. It displays key metrics like won amount, lost amount, win rate, and lost rate. You can see the number of won and lost opportunities over time and their amounts.
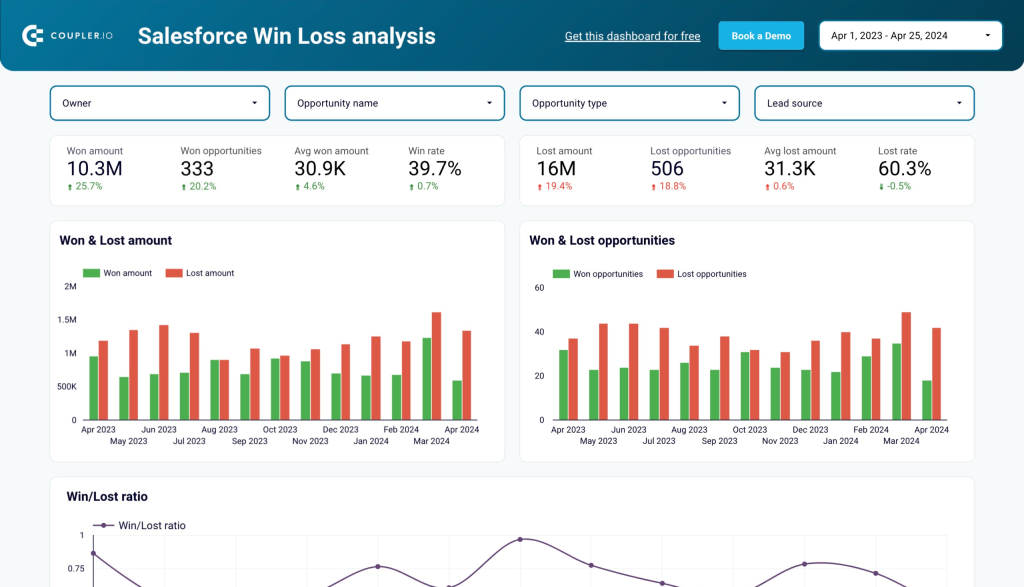
The dashboard breaks down win and loss data by industry, lead source, owner, country, opportunity age, and amount. It also highlights top won and lost opportunities to identify patterns and areas for improvement.
This clear layout makes it easy to analyze your sales performance and strategize for better results.
Salesforce sales analytics dashboard
This Salesforce sales analytics dashboard visualizes the complete sales acquisition funnel. It tracks key metrics like impressions, clicks, leads, SQLs (Sales Qualified Leads), and conversions.
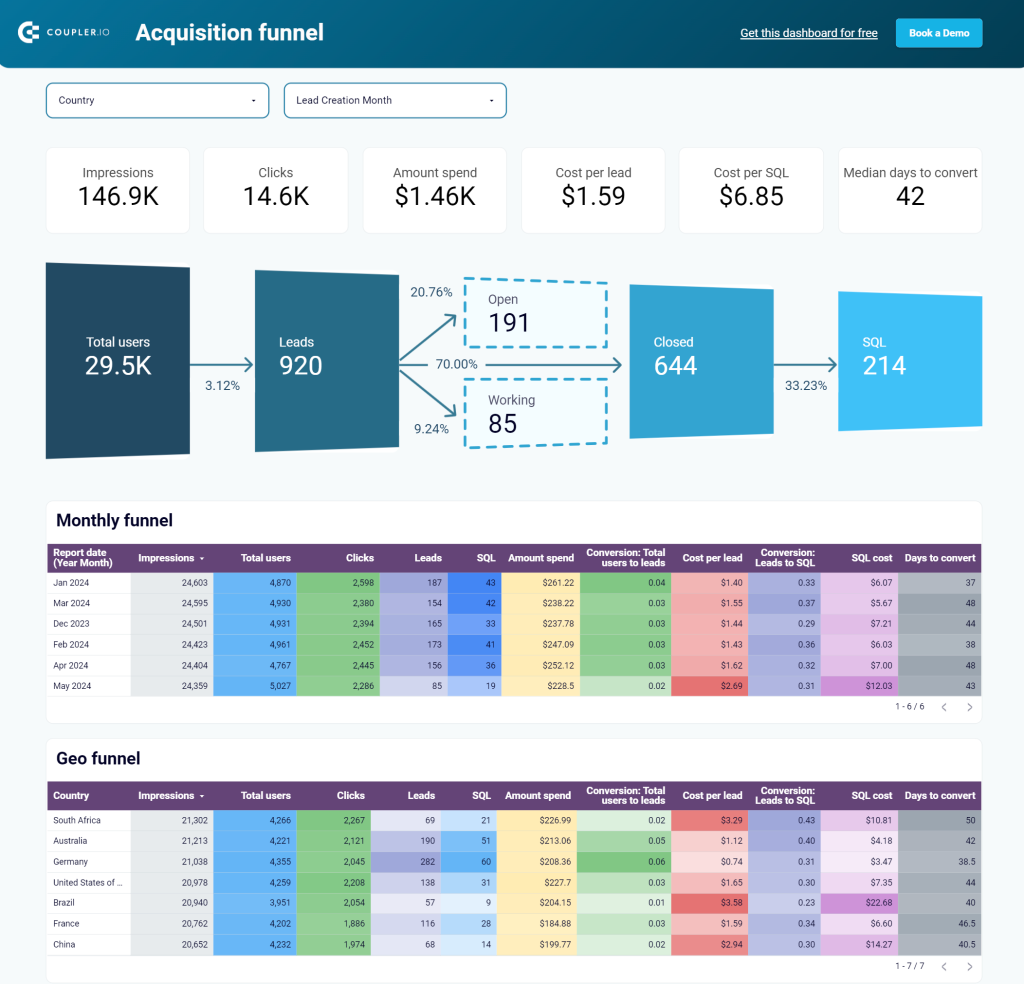
The funnel shows the flow from total users to leads, and then to closed deals and SQLs, with conversion rates at each stage. Monthly and geographical breakdowns give detailed insights about performance by country, ad source, and other dimensions. With this dashboard, you’ll understand how effectively your marketing efforts are converting prospects into sales.
However, for this sales analytics dashboard, you’ll need more than just data from Salesforce. It collects data from Google Analytics and advertising platforms such as Google Ads, Bing Ads, and others.
How to export data from Salesforce using the native Data Export functionality
Export data using Lightning Experience
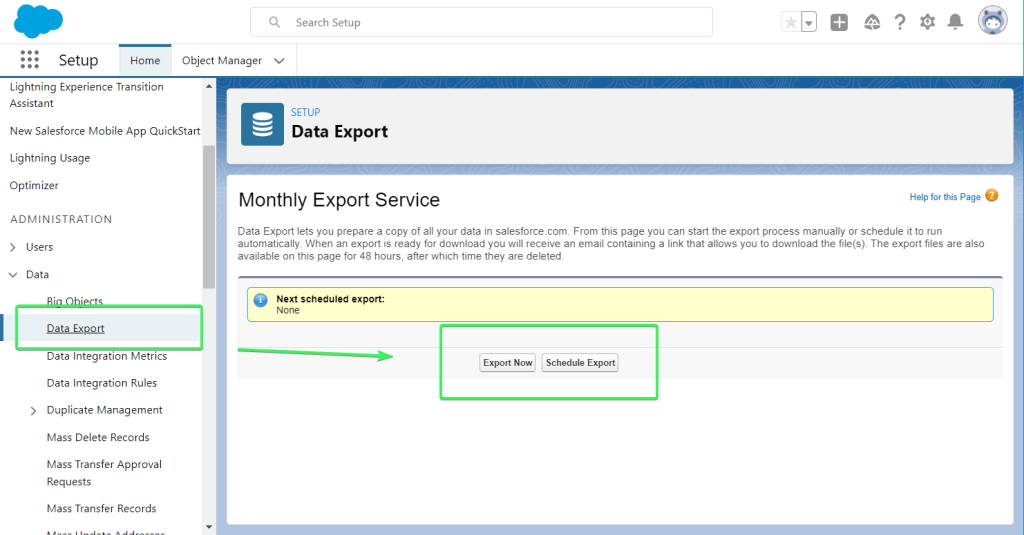
Salesforce promotes Lightning Experience as a way to boost productivity. So, let’s check out first how you can export data using this UI. In the left panel, go to Data => Data Export. You’ll see two options:
- Export Now
- Schedule Export
Export Now
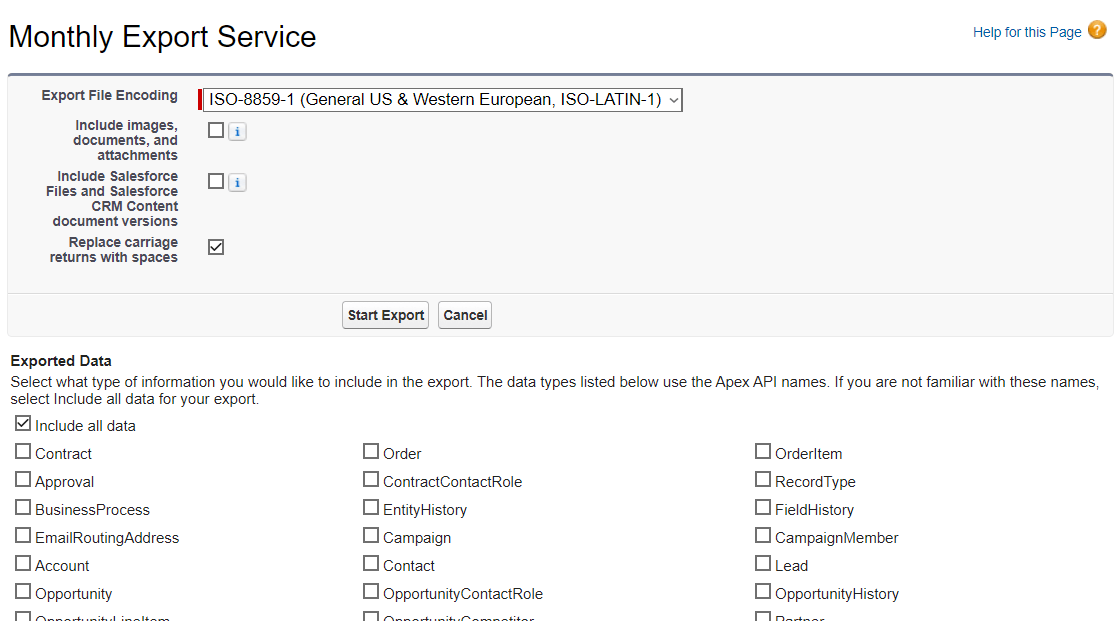
This option lets you manually pull your data from Salesforce once per month. You need to select which data you want to export, then click Save. When file(s) are ready for download, you will receive an email notification.
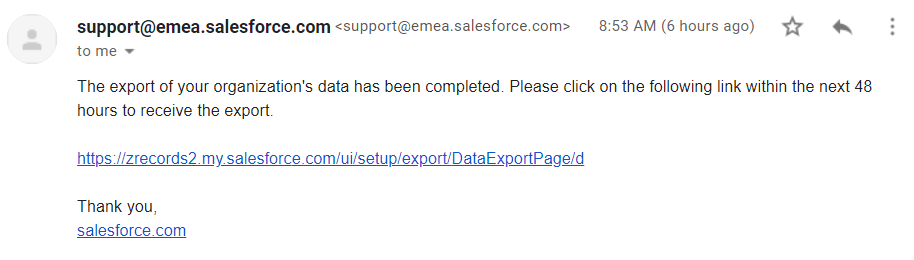
The files will be available for download for 48 hours. The link in the email will lead you back to your Salesforce Data Export page, where you’ll find a link to download the file(s).
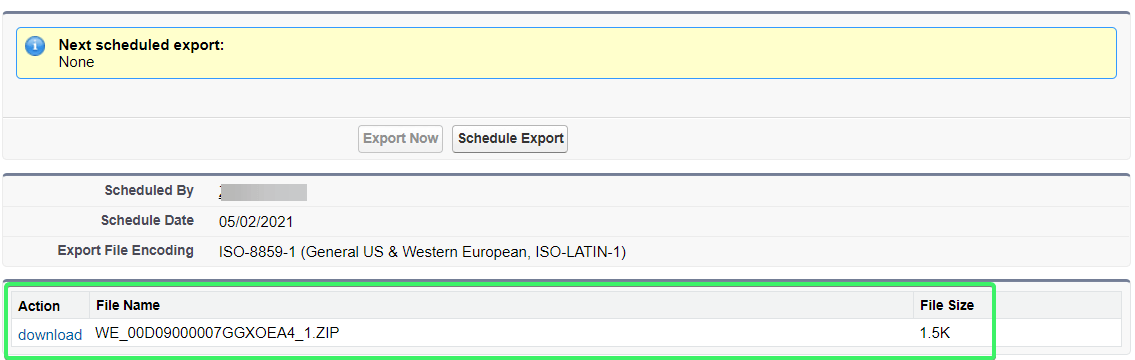
Once you click Download, a ZIP archive (containing a CSV file) will be downloaded to your device.
Warning: The Export Now option is only available once per month. Users of Enterprise, Performance, and Unlimited Editions can export data every week.
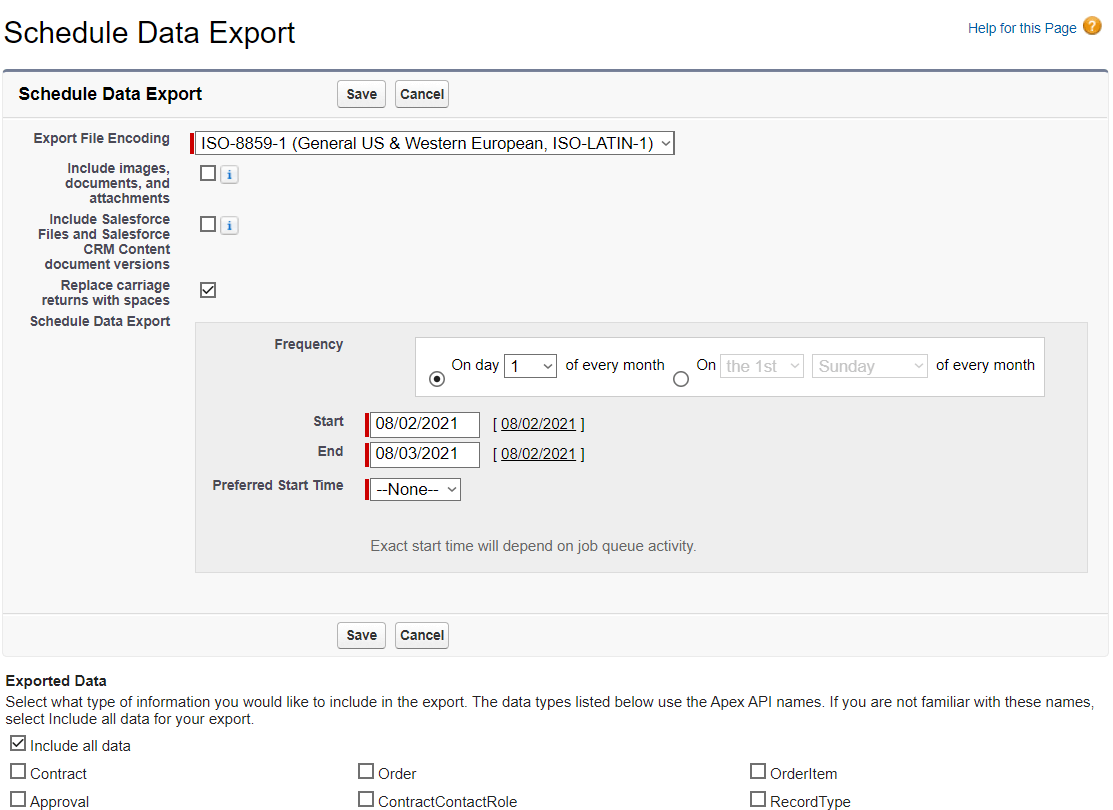
Schedule Export
This option lets you automate data export from Salesforce on a monthly schedule. You’ll need to specify the frequency and choose the exported data. Click Save when ready.
The export file will be exported automatically on the chosen schedule. However, you’ll still need to download it manually to your device.
Export data using Salesforce Classic
If you need to export data using Salesforce Classic, click Setup, then expand Data Management on the left side of the page and select Data export.
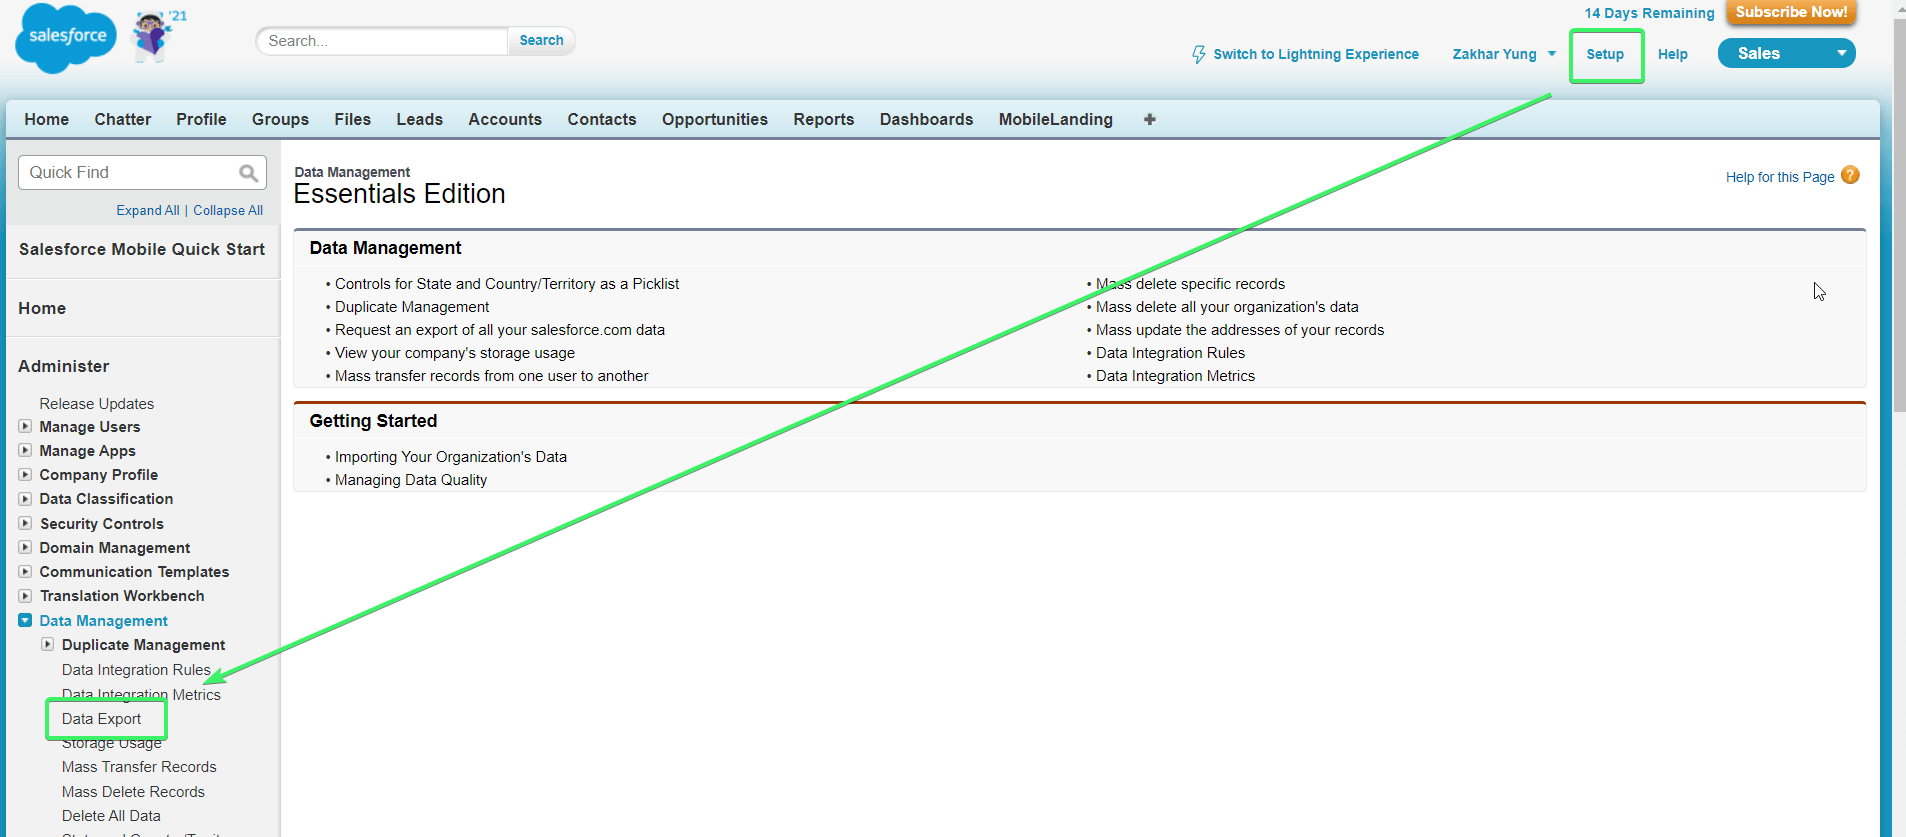
The rest of the flow is the same as with Lightning Experience.
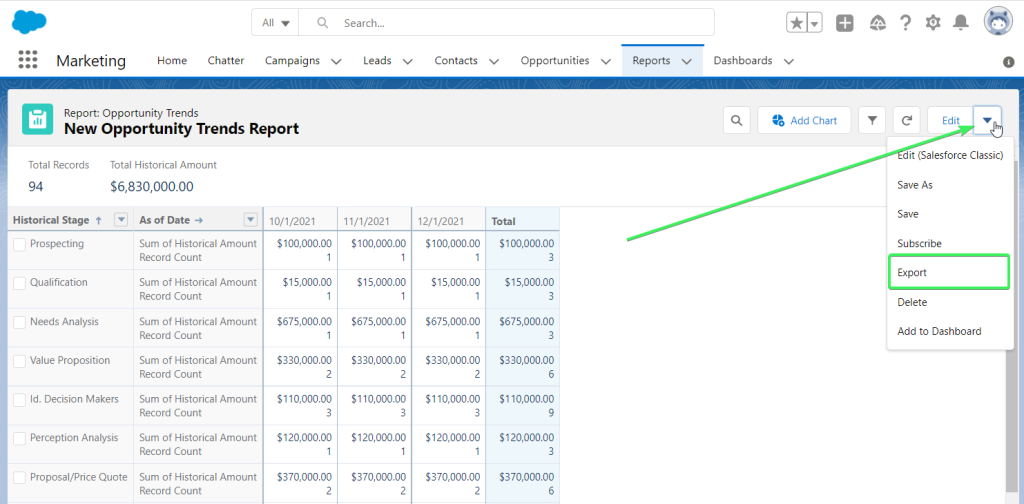
How to export a Salesforce report
Exporting reports from Salesforce has a different flow. You need first to open your report, then you can find the Export option in the Edit drop-down menu on the right.
Then you’ll be able to select the Export view: Formatted report or Details Only.
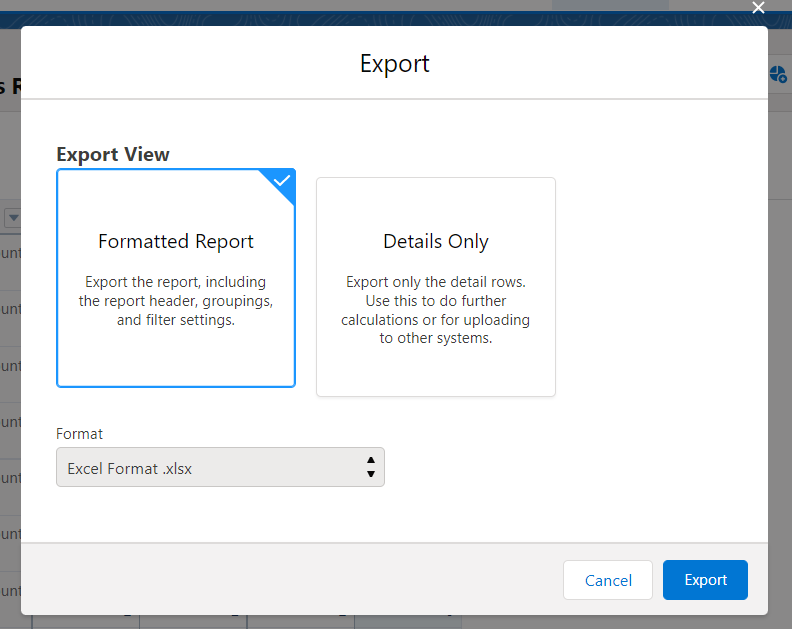
- Formatted reports are available for export as Excel files.
- Details Only are available as both Excel and CSV files.
Click Export to download the chosen format to your device. Read more about how to export Salesforce reports to Excel.
Salesforce data export limits
- Monthly exports, both manual and schedules, are available for all Salesforce editions and let you export data from Salesforce once per 29 days.
- Weekly exports let you export data once per 7 days, but this option is only available in Enterprise, Performance, and Unlimited Editions.
- ZIP archives with CSV files are available to download for 48 hours; then they’ll be removed.
- Each CSV file is approximately up to 512 MB. However, the total size of a ZIP archive can be greater than 512 MB.
Export data from Salesforce to Excel
Well, there are a few options here. Coupler.io allows you to set up a Salesforce to Excel integration if you choose Excel as a destination application. Just click Proceed in the form below to get started for free.
Another solution is to use the built-in Salesforce to Excel connector. But it’s a premium feature supported at:
- Microsoft Office Professional Edition
- Microsoft Office 365 ProPlus subscription
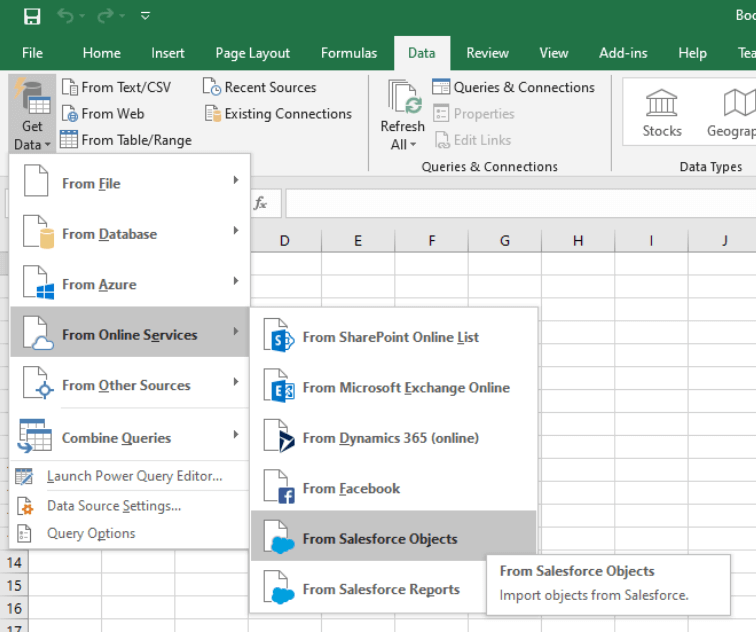
Here is how it looks. Open your Worksheet, go to Data => New Query => From Online Services => From Salesforce Objects.
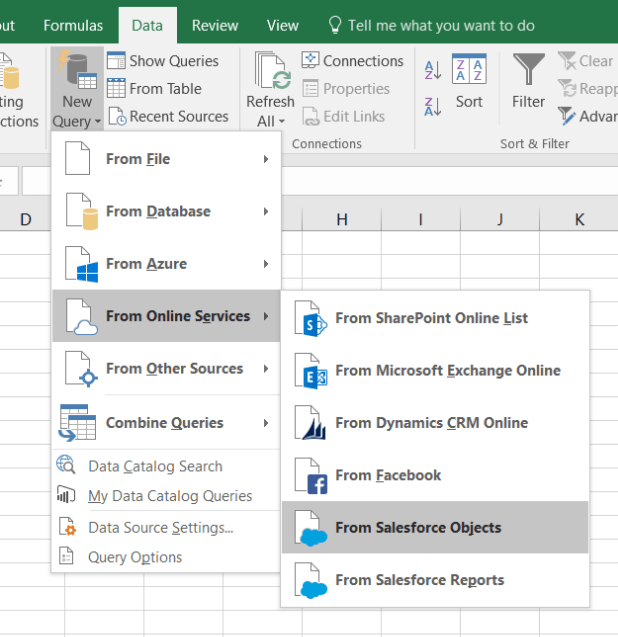
In some editions, the path is a bit different:
Data => Get Data => From Online Services => From Salesforce Objects
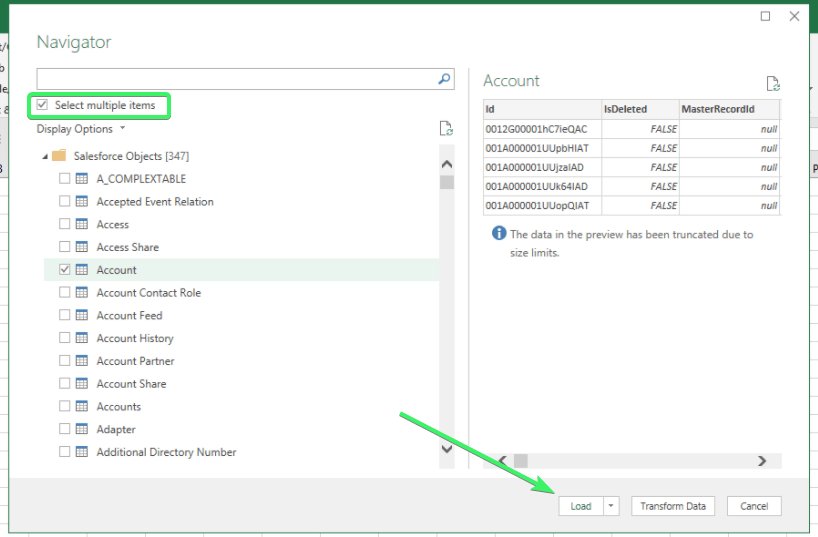
After that, you’ll need to connect to the Salesforce account. The rest of the flow is quite intuitive:
- Select the objects to export
- Mark the Select multiple items checkbox if you’re going to select more than one object to export
- Click Load and welcome your Salesforce data into your worksheet
Unfortunately, most regular Excel users do not have access to this Salesforce to Excel connector. You’re lucky if you have it.
If you don’t, you can try to connect via ODBC (you need to install an ODBC driver) or Microsoft Query Wizard. But we think that the path to export Salesforce to Excel provided by Coupler.io is simpler and more user-friendly.
Export Salesforce data as CSV using Dataloader.io
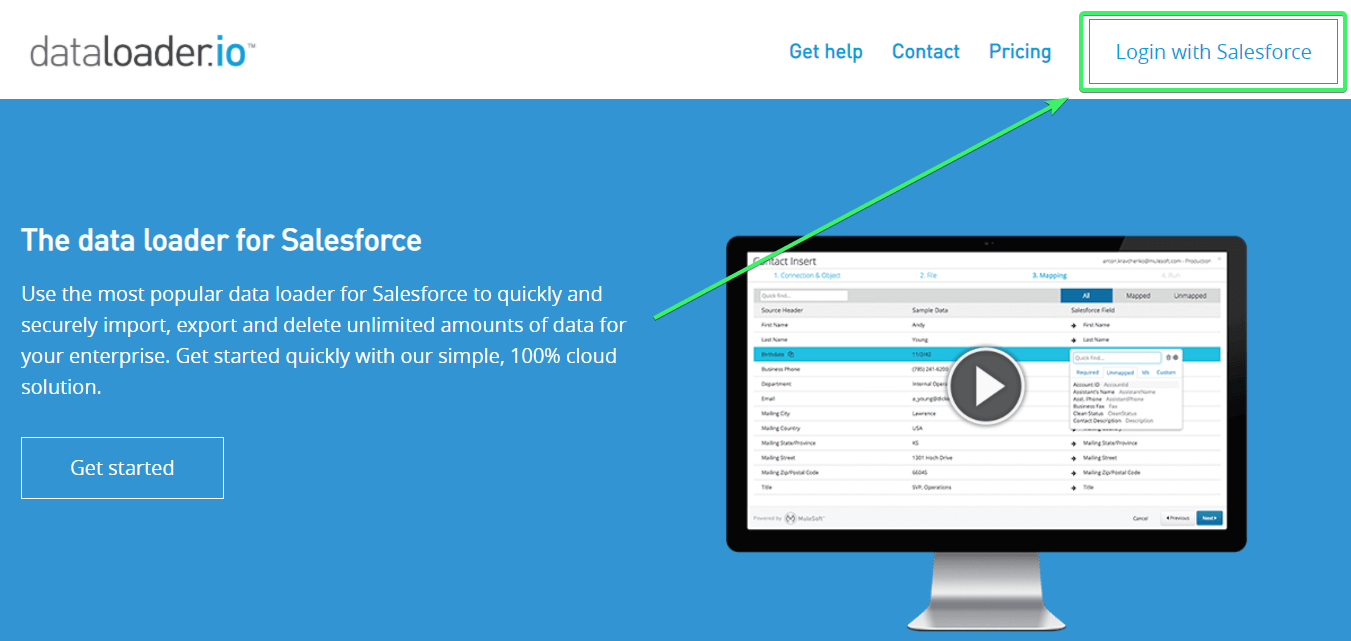
Dataloader.io is a Salesforce-oriented app for data export/import. Its main benefit is that you can export data as CSV as often as you need. In addition, you can pull data directly to Dropbox, Box, or an FTP server. However, the free plan limits the number of exported rows to 10,000. Let’s discover how it works.
- Login with Salesforce to begin. There is no need to install Dataloader.
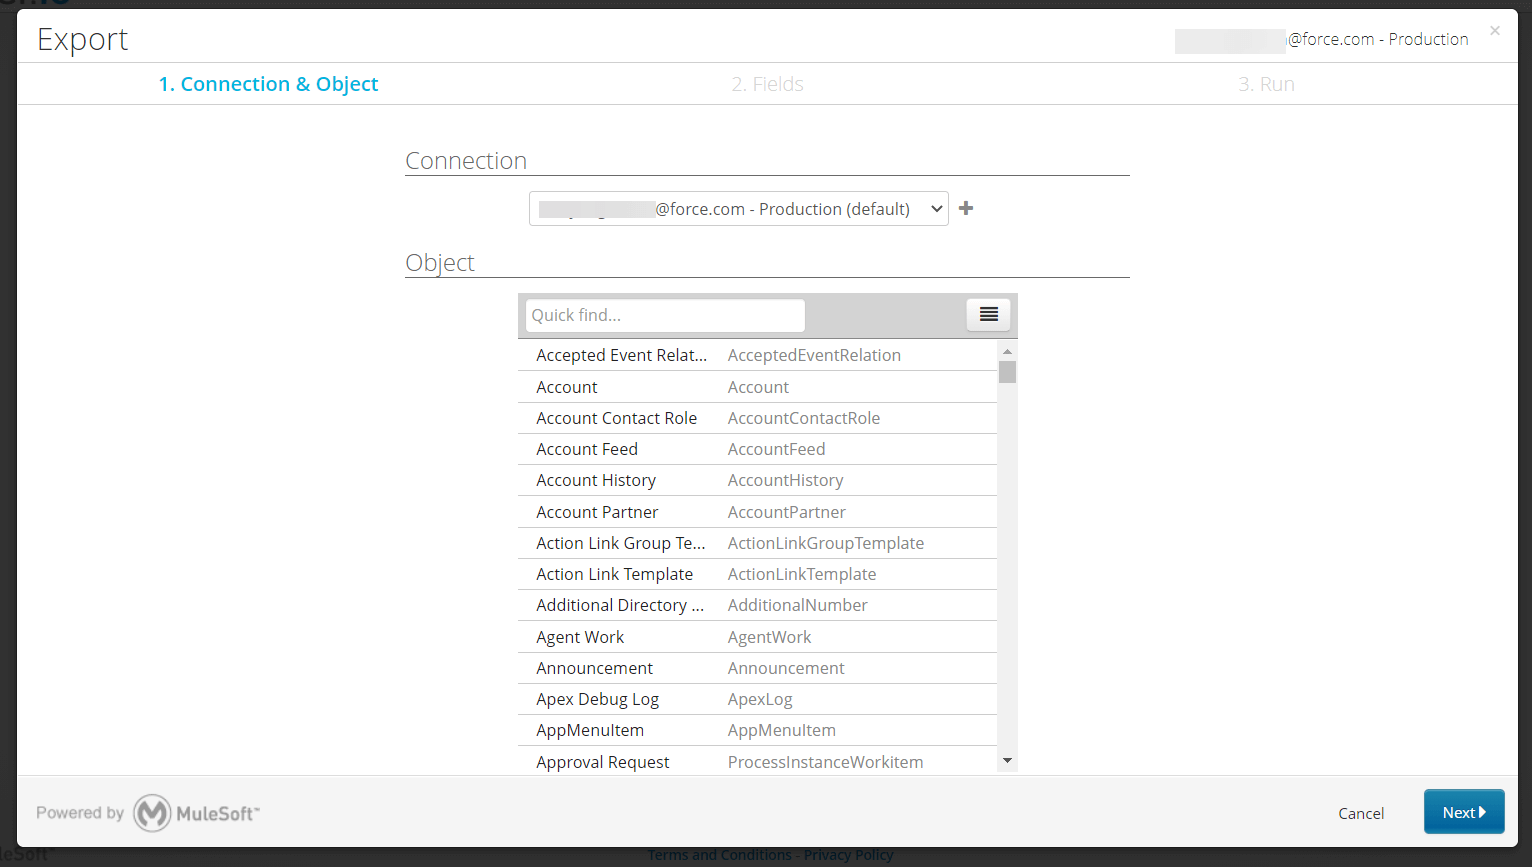
- Click New Task and select Export.
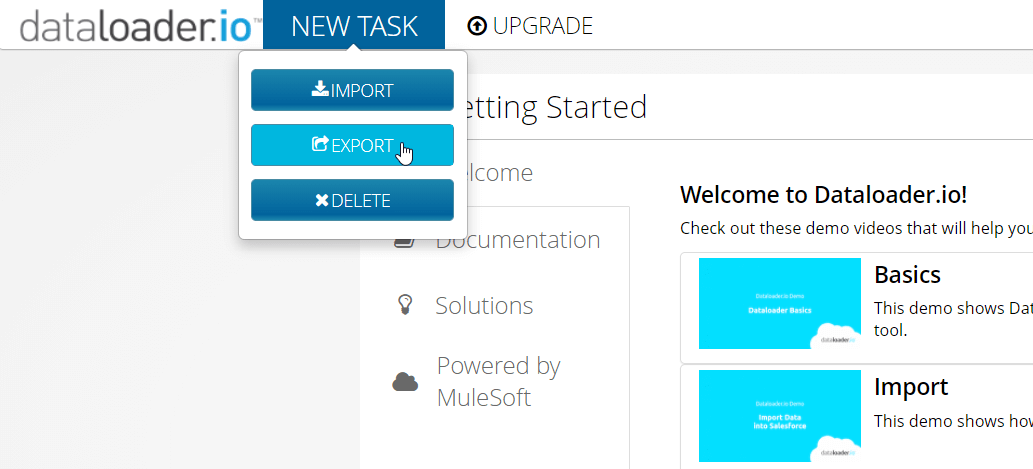
- Choose your connection and object (data entity) to export from Salesforce. Click Next to proceed.
- You need to select fields of the Object (that you chose in the previous step). You can also set up filters and how to order the exported data. The parameters you choose will generate an SOQL query.
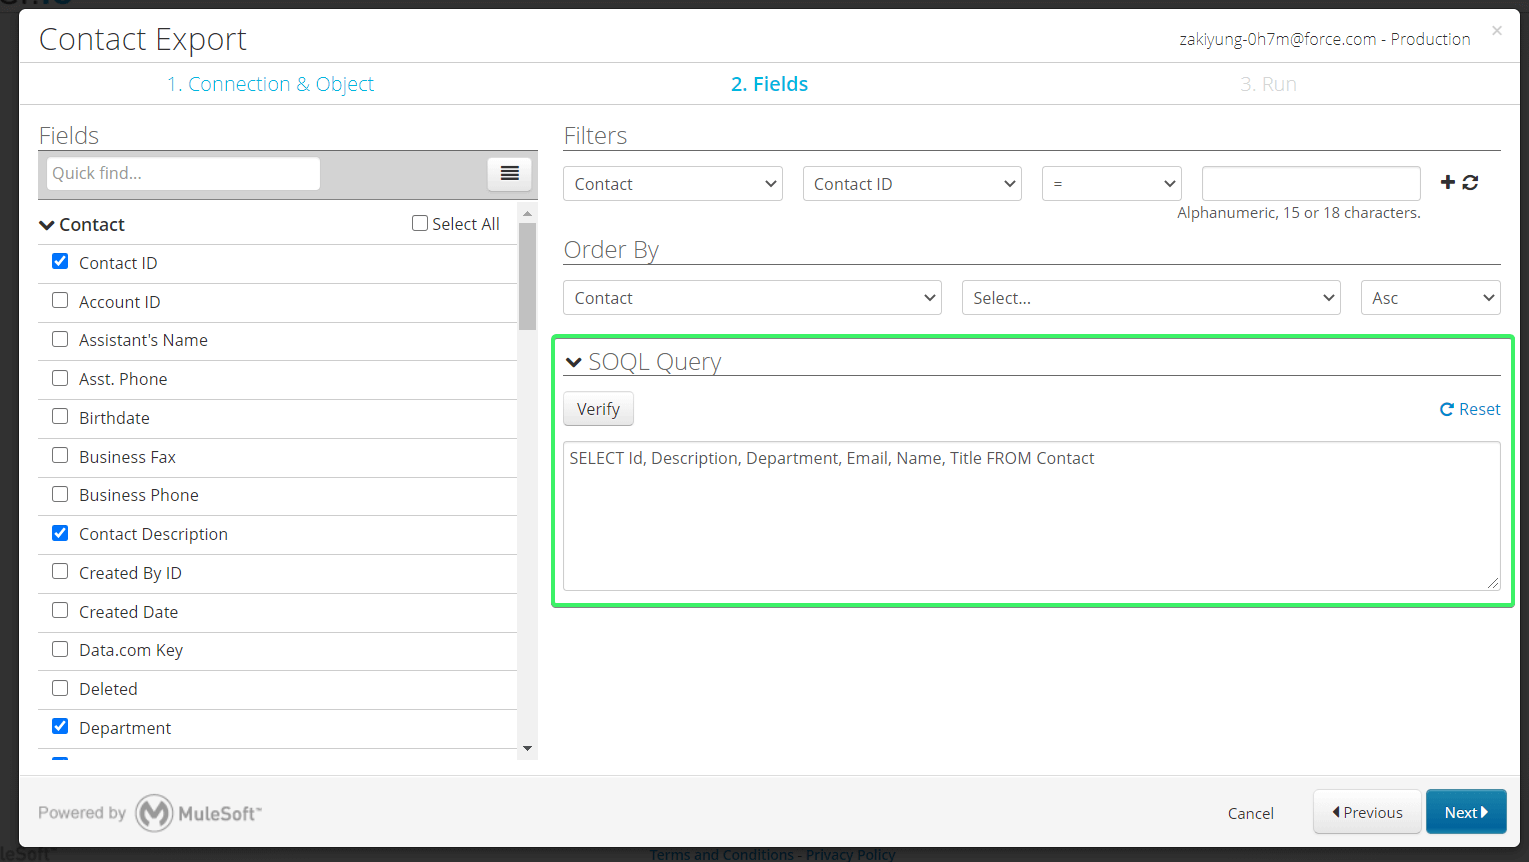
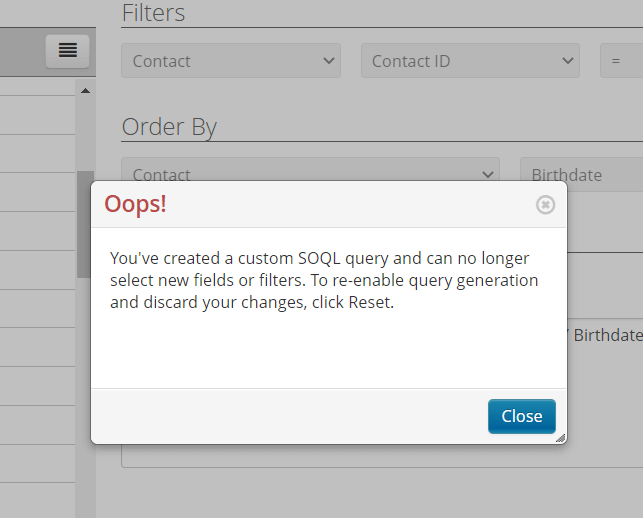
You can create a custom SOQL query yourself and paste it in the SOQL query field. In this case, you won’t be able to use the dropdown parameters of the query generator.
Click Next when you’re ready to proceed.
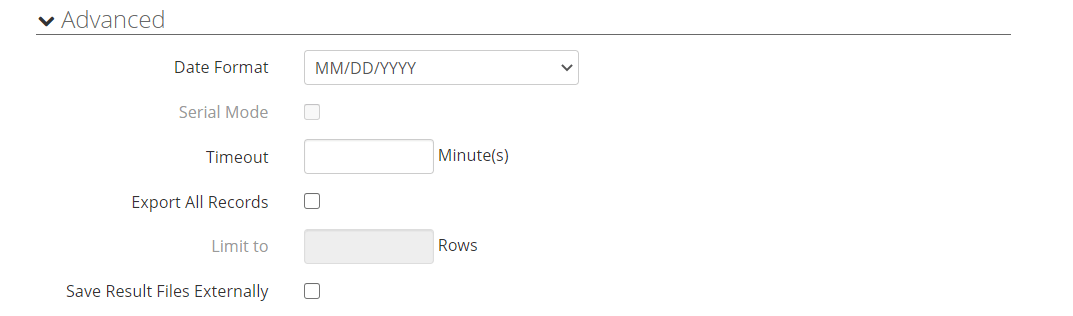
- Now, you can either manually run the export task or automate it on an hourly, daily, weekly, or monthly schedule. To do this, choose Schedule Task and customize the schedule.
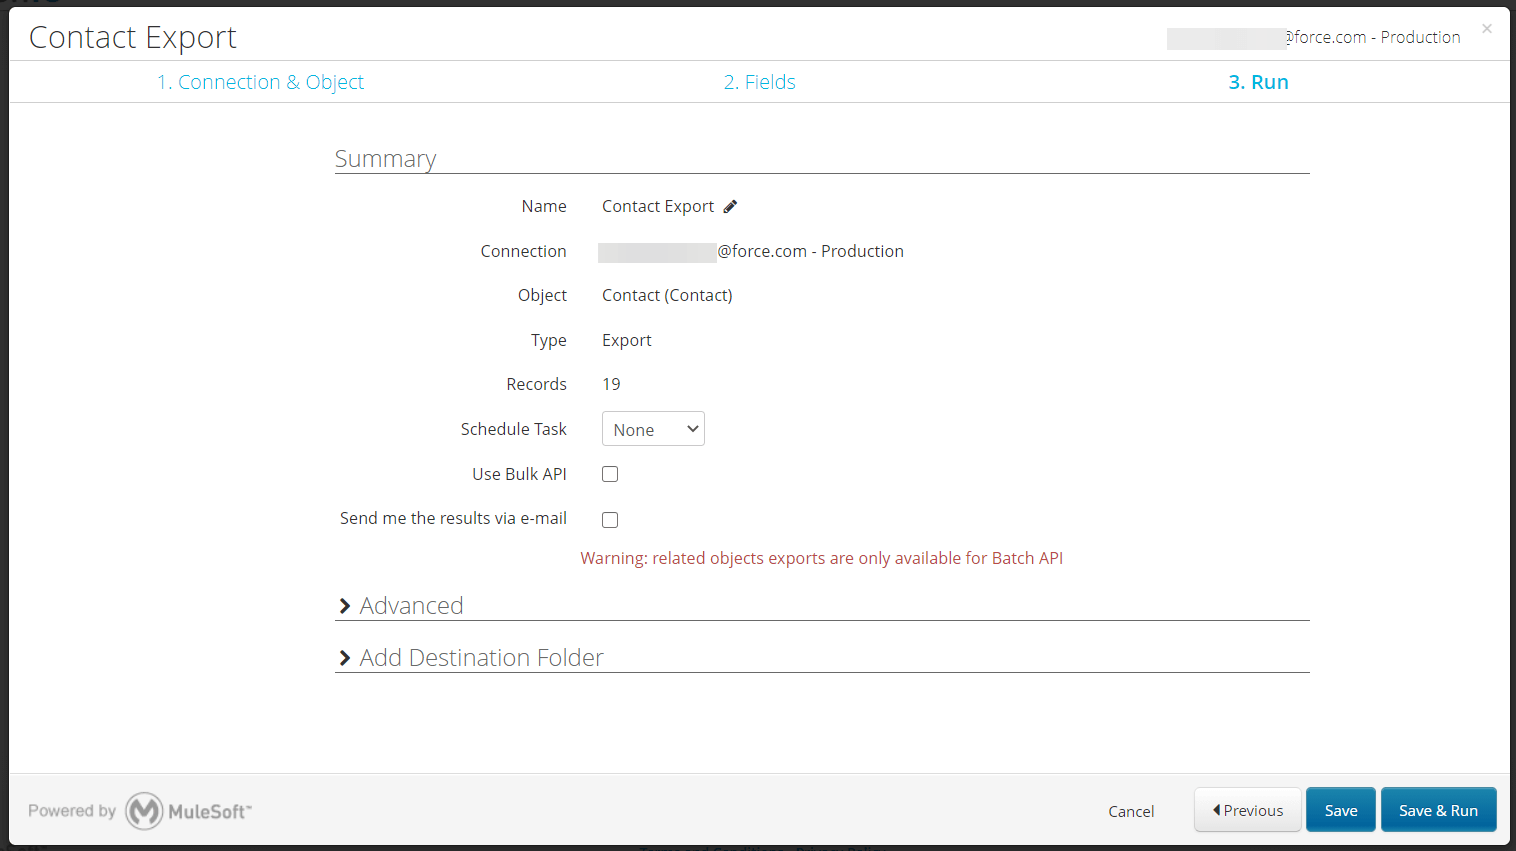
The Advanced section lets you specify the Date format, Timeout, and other parameters:
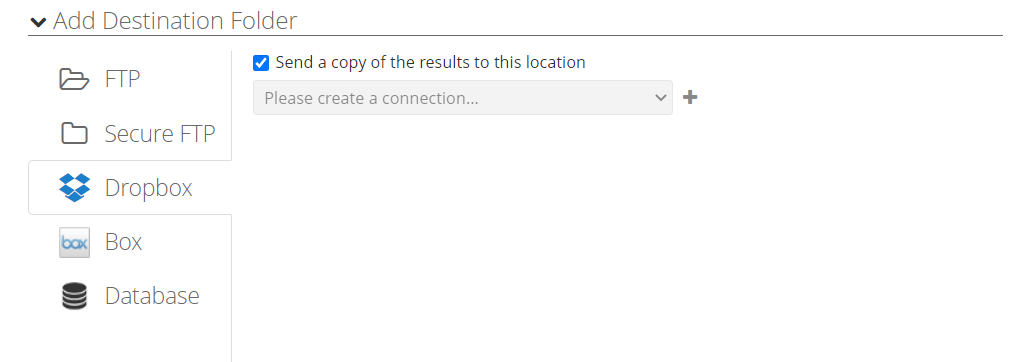
In the Add Destination Folder section, you can connect to an FTP server, Dropbox, or Box to send a copy of the exported data there.
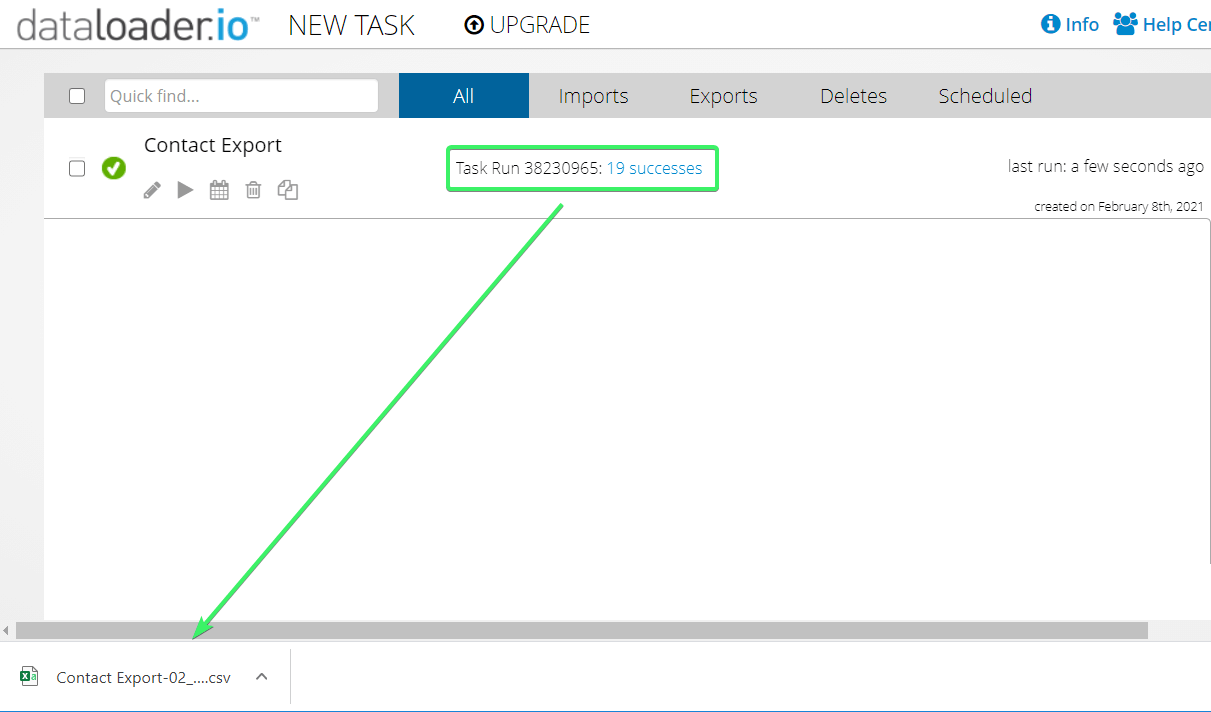
- Click Save & Run when ready and….do not expect to get your CSV file downloaded straight away. Your data export task will be queued. After that, you’ll get a note about a successful run. In our case, it looks like this:
Task Run 38230965: 19 successes
You need to click it once again to get the file downloaded to your device.
Export data from Salesforce using API
In this section, we’ll show how you can set up a Salesforce to Google Sheets integration using the Salesforce REST API. Before we proceed, check out whether your Salesforce edition provides access to the REST API.
| Editions with API Access | Editions without API Access |
|---|---|
| – Enterprise – Unlimited – Developer – Performance | – Group – Essentials – Professional |
API access available? Let’s go then. First, we’ll need to get an access token and instance URL.
How to get an access token in Salesforce
Create a Connected App in Salesforce
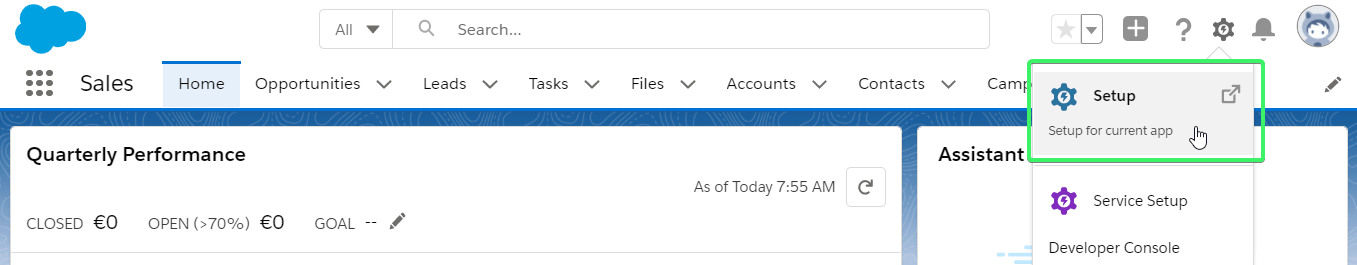
In this example, we’ll be using the Salesforce Developer edition and Lightning Experience UI since it looks tidier in my opinion. First, we need to switch to Setup by clicking the gear wheel symbol on the toolbar.
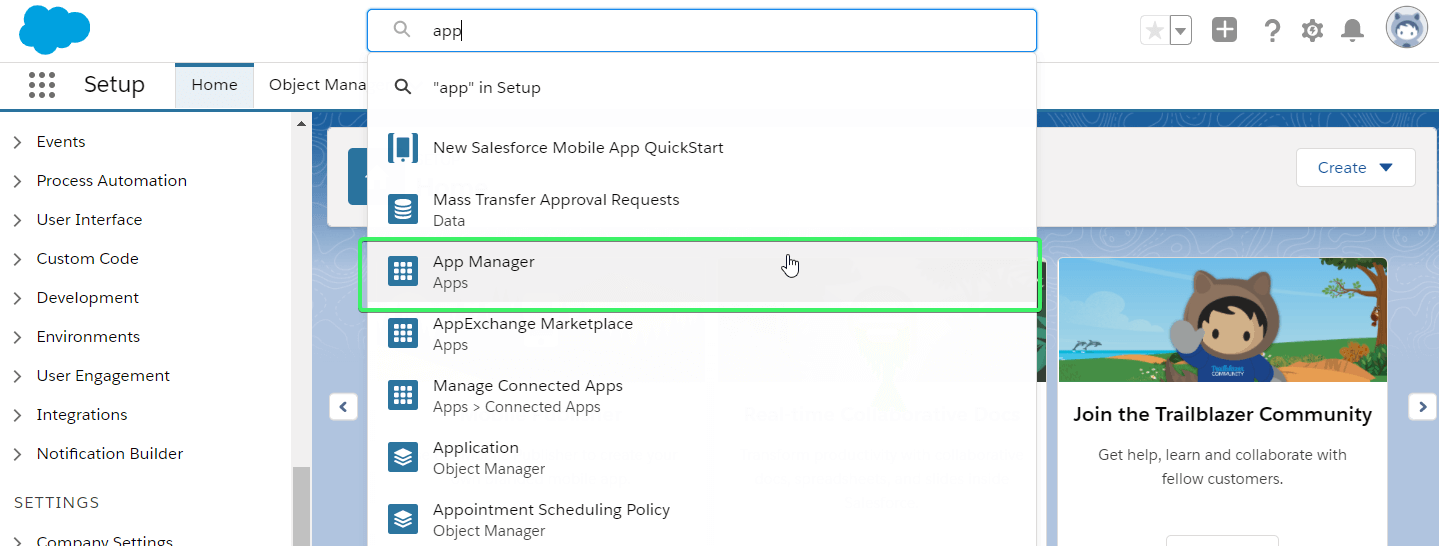
Then go to Apps => App Manager, or just find it using the search setup field.
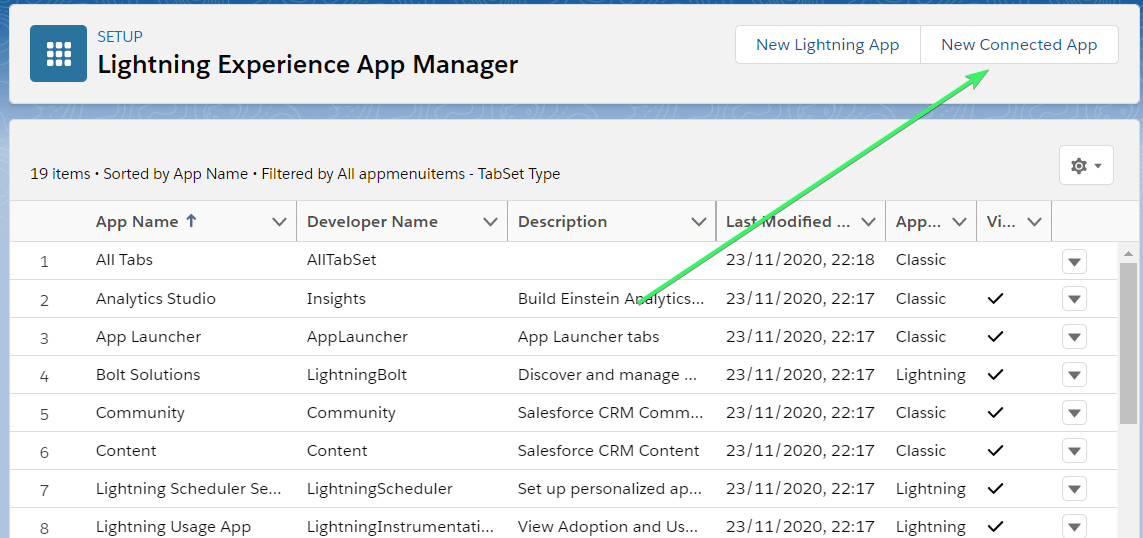
Click New Connected App to create one.
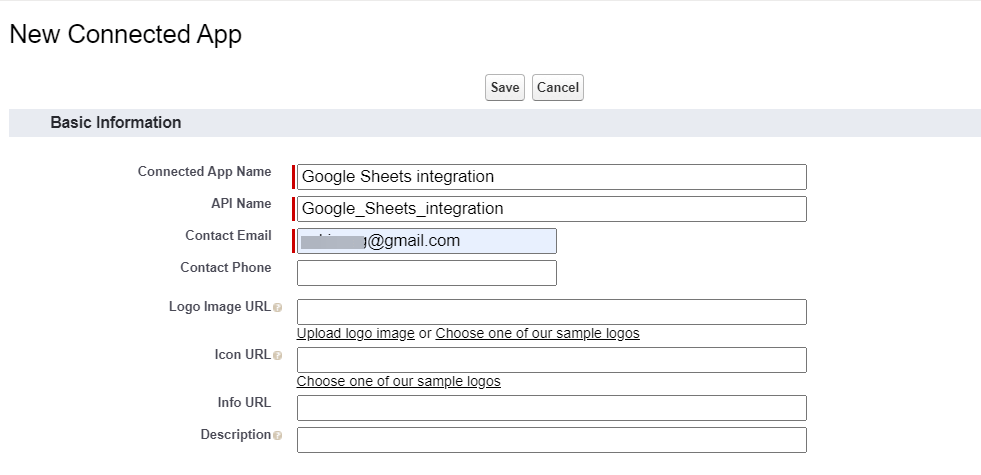
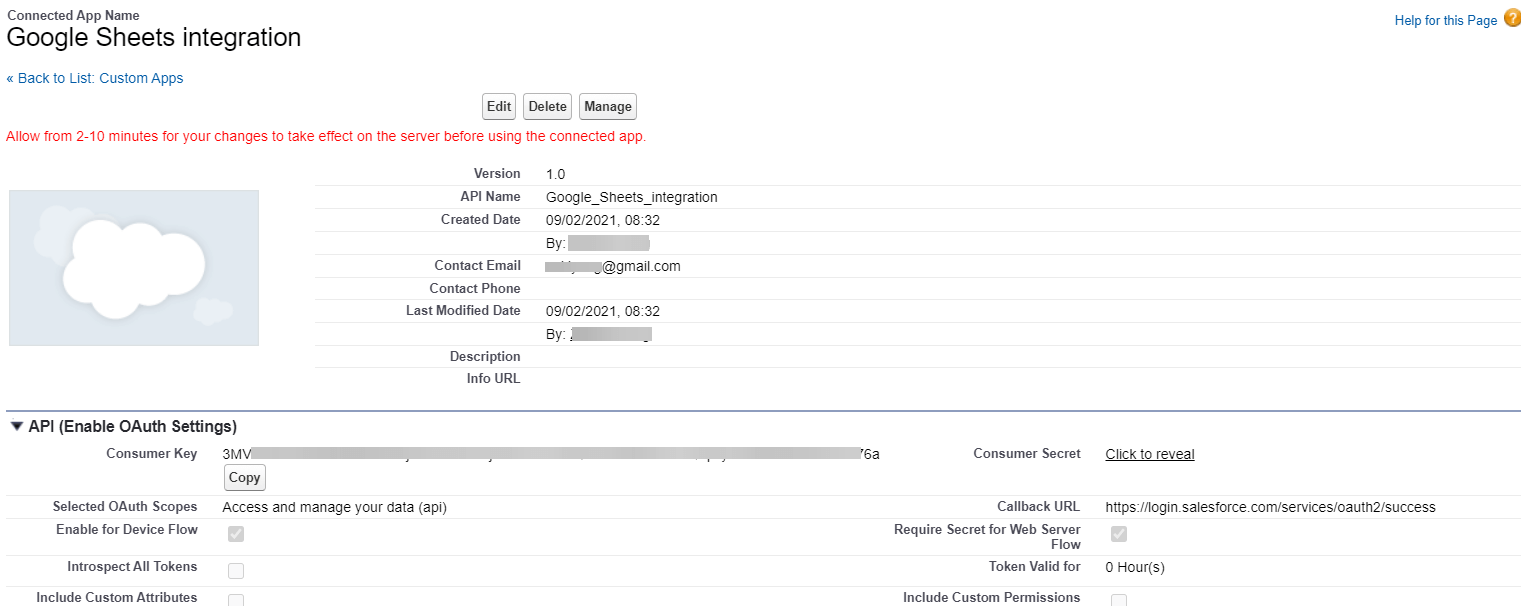
Configure the app by filling out the following fields:
- Connected App Name – name your app
- API Name – it will be populated automatically after you name your app
- Contact Email – specify your email address
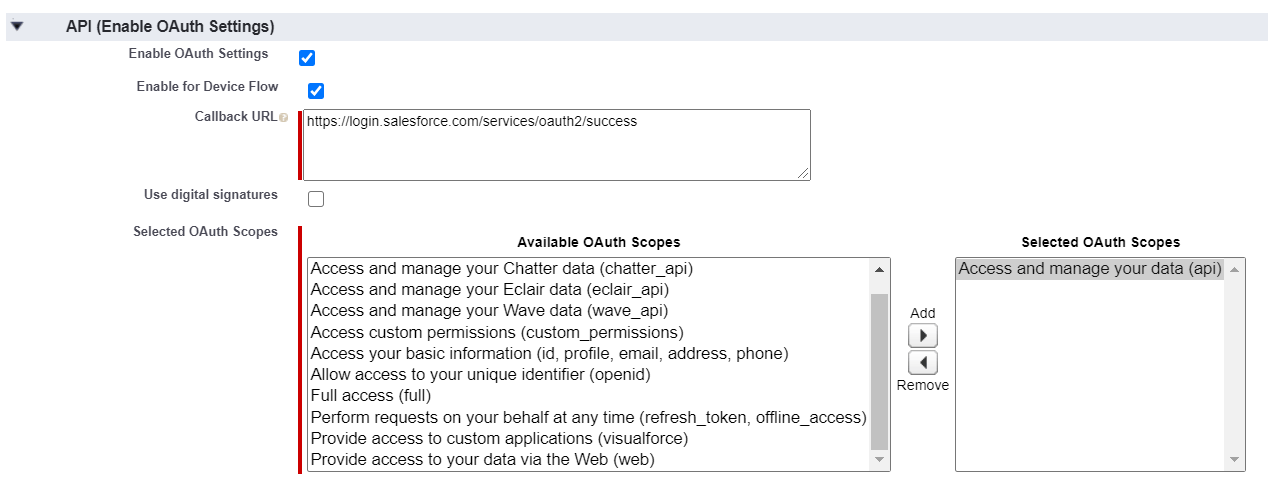
You also need to mark Enable OAuth settings checkbox, which expands a few more parameters:
- Checkbox Enable for Device Flow – it will populate the Callback URL field
- In the Available OAuth Scopes field, select Manage user data via API and click Add to add it to the Selected OAuth Scopes.
?lick Save then Continue to save your connected app and get initial credentials: Consumer Key and Consumer Secret. We’ll be using those to get an API token.
IP Relaxation
We need to edit OAuth Policies before proceeding further. To do this, click Manage and then Edit Policies.
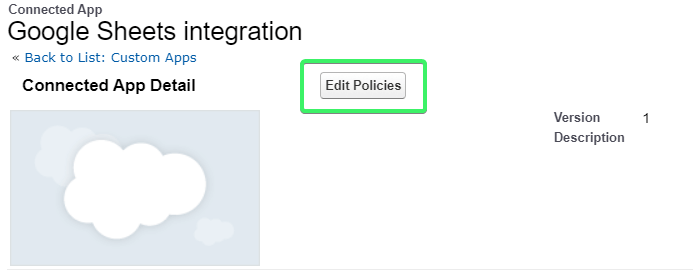
Edit two parameters:
- Permitted Users to All users may self-authorize
- IP Relaxation to Relax IP restrictions
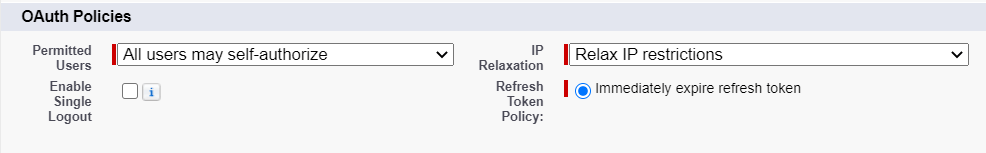
Click Save.
Access token to integrate Google Sheets with Salesforce
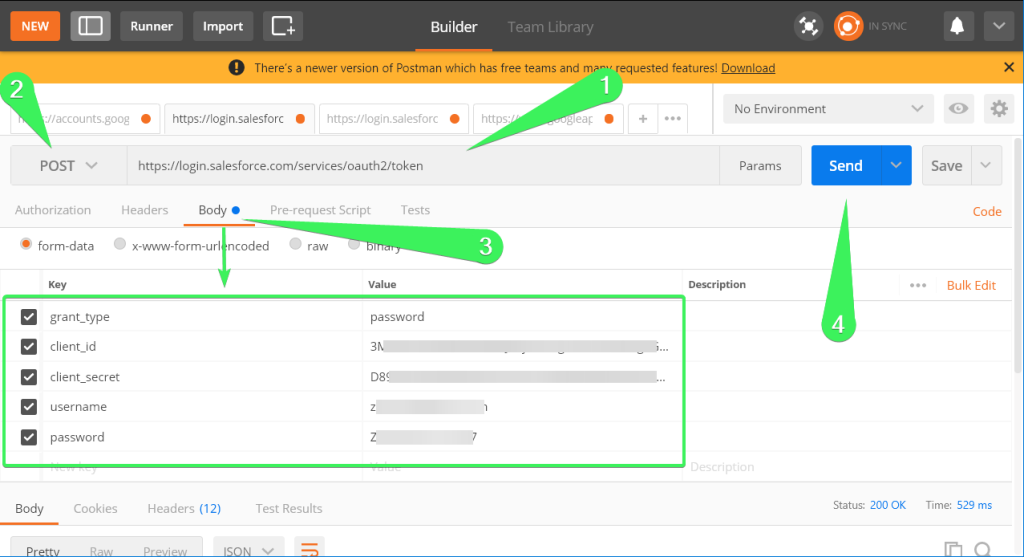
Cheer up, we’re almost there! Let’s get an access token to integrate Google Sheets with Salesforce. To do this, you need to send a POST request to the following URL:
https://login.salesforce.com/services/oauth2/token
The request should must supply the following body parameters:
grant_type=password
client_id={insert-your-customer-key}
client_secret={insert-your-customer-secret}
username={insert-your-username}
password={insert-your-password}
To send a POST request, we’ll use Postman, a Google Chrome app for interacting with HTTP APIs. Do the following:
- Enter the request URL in the field
- Change the request type from GET to POST
- Enter the required body parameters
- Click Send
The access token, as well as the instance URL, will be provided in the response to our POST request.
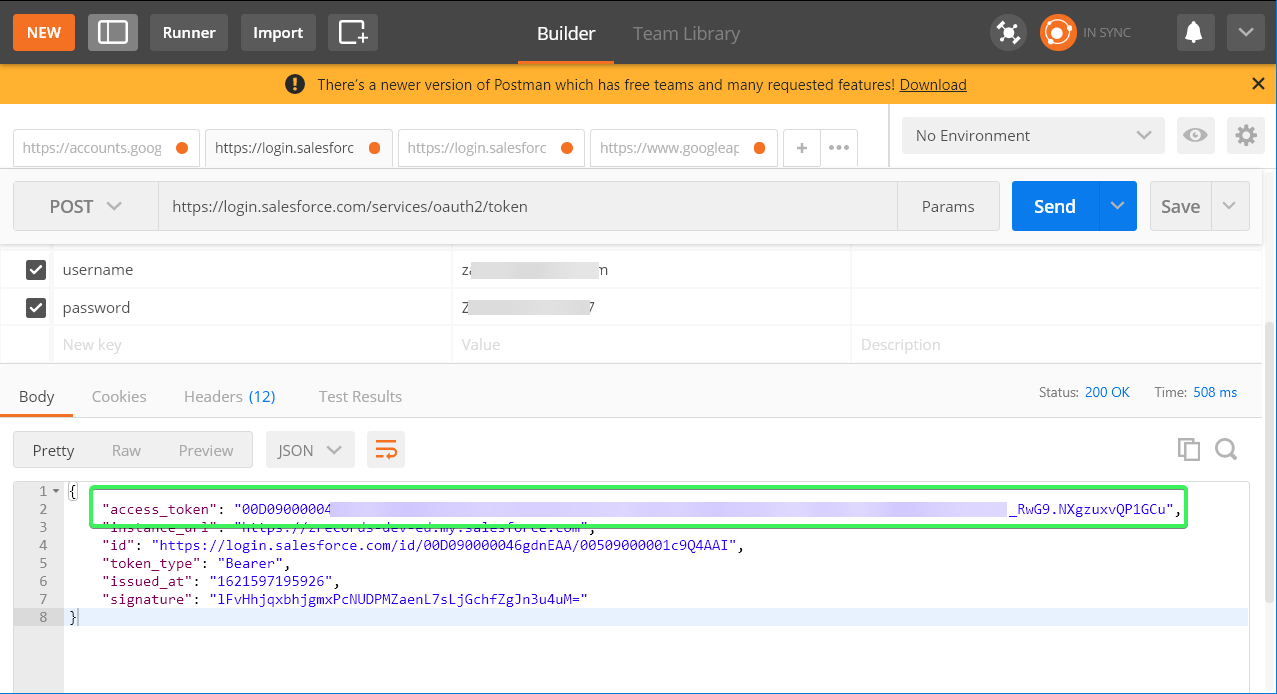
Now we can use it to connect to the Salesforce API.
Connect to the Salesforce REST API without coding
In most cases, you’ll need to write a code to retrieve data from Salesforce and load it to your destination. But if you’re exporting data to Google Sheets, Excel or BigQuery, you can connect to the Salesforce API without a single code line using Coupler.io.
Actually, this is how we exported data from Salesforce CRM before the Salesforce integration was released 🙂
The Transform data and Manage Data steps remain the same, but the Extract data setup will change as follows:
- Choose JSON as your source application and the desired destination app. We’ve preselected it in the form below
JSON importer is an integration to connect to third-party apps via APIs. At the same time, Coupler.io provides many ready-to-use Google Sheets integrations, such as Pipedrive, HubSpot, Xero, and so on. Besides, you can connect those sources with different destinations, for example, HubSpot integration with Excel or BigQuery.
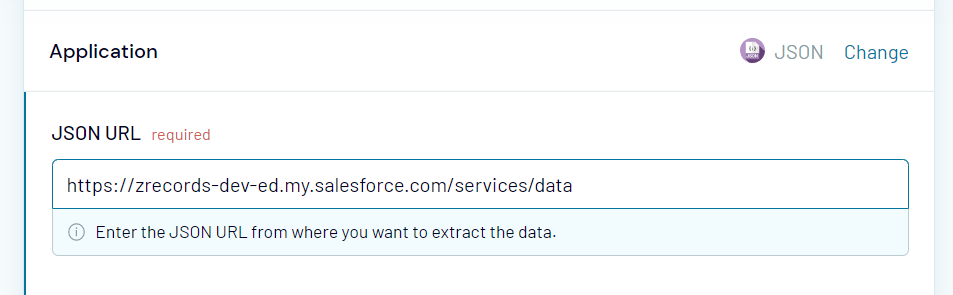
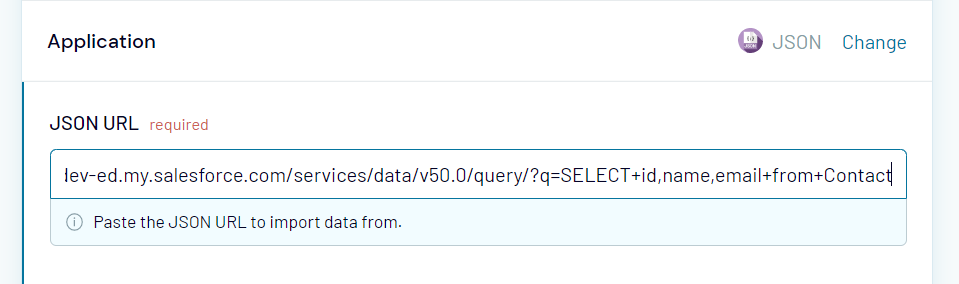
- In the JSON URL field, insert the API URL to the Salesforce API in the following format:
{instance-URL}/services/data/{API-version}/sobjects/{salesforce-object-resource}
{instance-URL}– the instance URL, which you obtained along with the access token{API-version}– the version of the API; you can learn the available API versions be sending the GET request to{instance-URL}/services/data{salesforce-object-resource}– the type of data you want to export; you can learn the list of objects and resources by sending the GET request to{instance-URL}/services/data/{API-version}/sobjects/
For example, here is the JSON URL to obtain a list of Salesforce API versions:
https://zrecords-dev-ed.my.salesforce.com/services/data
- Click Continue. Then, in the request headers field, you need to specify your access token in the following format:
Authorization: Bearer {your-access-token}
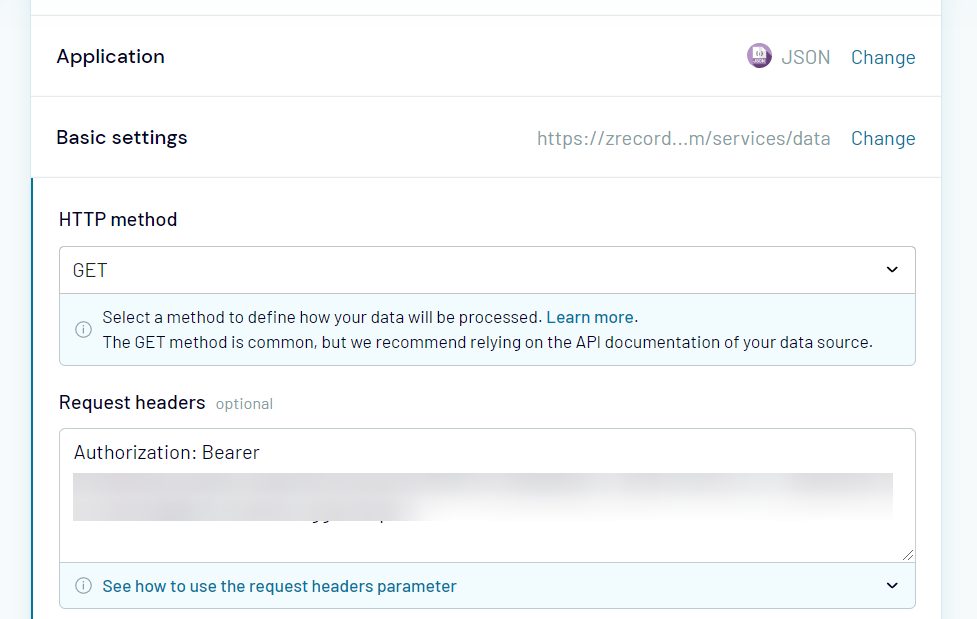
Complete the Destination setup and Schedule, if necessary, and click Save and Run to load data. For example, here is a list of available API versions exported to Google Sheets:
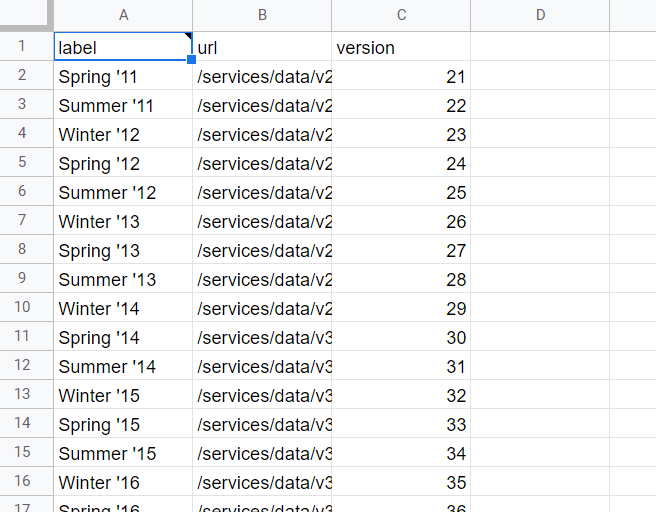
Let’s go further and export something substantial.
Export data from Salesforce for a specific table
If you want to export other data from Salesforce (let’s say, Contacts), you’ll need to use a query (like we did when we exported data with Dataloader.io).
The logic of getting data from Salesforce via API is query-based. This means you need to build a query that specifies the fields and/or filters to export data. Once you have the list of fields, you can build a custom query to retrieve data using the following template:
query/?q=SELECT+{names-of-fields-separated-by-comma}+FROM+{Salesforce-object}
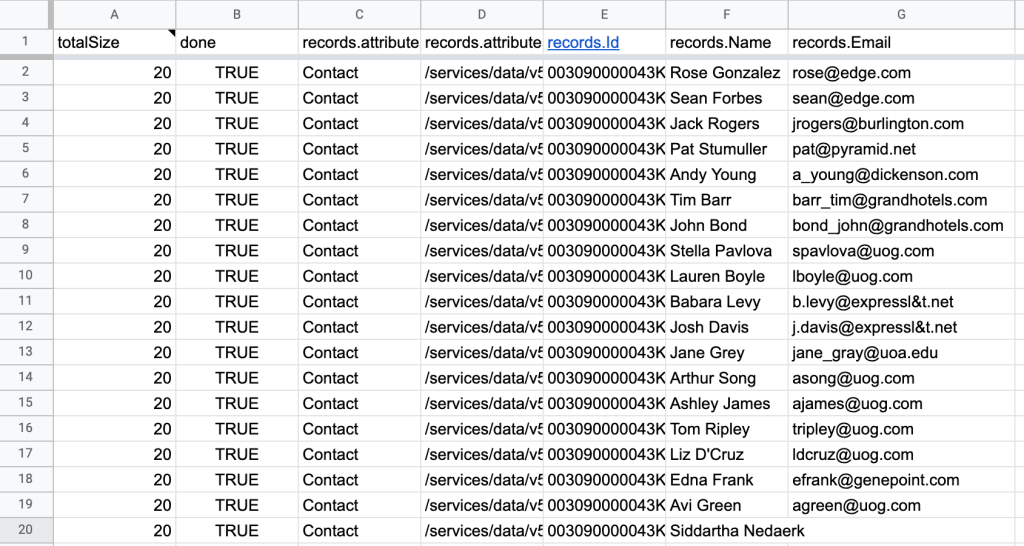
For example, here is a custom query to export Contacts from Salesforce with three fields – id, name, and email:
q=SELECT+id,name,email+FROM+Contact
And here is the configuration of the JSON Client
| JSON URL | {instance-URL}/services/data/v50.0/query/?q=SELECT+id,name,email+from+Contact |
| HTTP headers | Authorization: Bearer {your-access-token} |
Click Save and Run, and a list of Salesforce tables will be transferred to Google Sheets:
Check out the Salesforce API documentation to learn other cases and objects you can export to Google Sheets using Coupler.io.
Can I auto-pull Salesforce data to Google Sheets?
Coupler.io allows you to automate data export from Salesforce on a custom schedule. You simply need to enable Automatic data refresh functionality and customize the export frequency.
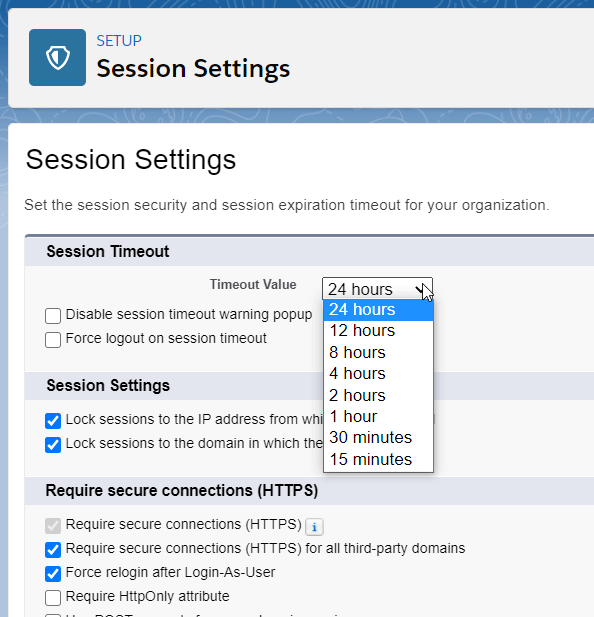
However, the access token stops working when the session expires. Once the session is logged out or expires, you have to obtain a new access token. The maximum session timeout value that you can set is 24 hours.
How often can you export data in Salesforce?
The available frequency of exports depends on the method you use. The native Data Export Service allows you to export data as CSV manually or automatically:
- Once every 29 days for monthly exports
- Once every 7 days for weekly exports that are available in Enterprise, Performance, and Unlimited Editions.
With the Salesforce integration by Coupler.io, you can schedule exports at:
- Every 15 min
- Every 30 min
- Every hour
- Every day
- Every month
This refers to both the ready-to-use Salesforce integrations and the custom connection to the Salesforce API.
The Dataloader.io allows you to automate exports as CSV on an hourly, daily, weekly, or monthly schedule.
Salesforce weekly data export
Manual weekly data exports in Salesforce using the native functionality are only available in Enterprise, Performance, and Unlimited Editions. With Coupler.io or Dataloader.io, you can automate exports on a weekly basis for any Salesforce subscription plan.
Which is the best way for exporting Salesforce data?
If you need to load your Salesforce data directly into a spreadsheet app, Google Sheets or Microsoft Excel, Coupler.io seems to be the best option. Besides, it supports other destinations – BI tools and data warehouses! Another benefit is the automation of exports on a schedule.
Dataloader.io also provides scheduling, but it exports data as CSV, so as the native Data Export functionality. The latter, however, only lets you import data once a month (or week). The Salesforce API opens wider exporting options, but you’ll need to write a piece of code to export data programmatically, or again opt for Coupler.io or another API connector.
You can give each solution a try to find out which one will work best for you. Good luck with your data!

Automate Salesforce data export with Coupler.io
Get started for free