10 ETL Use Cases That Power Marketing, Sales, and Financial Management

What is an ETL pipeline?
An ETL pipeline is a data workflow that consists of three processes that can be automated or implemented manually:
- Extract data from various sources – ad platforms, social media, CRMs, etc.
- Transform data into a usable format through rule-based automation and human-driven data manipulation
- Load data into a target system: spreadsheets, BI tools, databases, data warehouses, and more.
As a result, your disparate data is connected, processed reliably, and available for making quicker, more informed business decisions. To see how, let’s dive into 10 powerful ETL use cases – from PPC and SEO to crucial financial analytics – that are delivering tangible results right now.
Top ETL use cases for improved marketing, sales, and financial performance
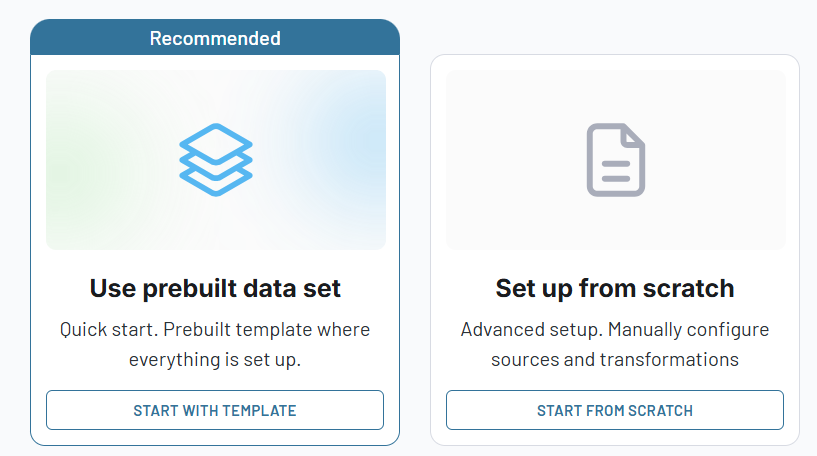
At Coupler.io, we’ve helped our clients with a wide range of ETL use cases. With an ETL tool underneath, Coupler.io allows you to create automated pipelines across marketing, sales, and accounting. You can do this from scratch or with the help of a prebuilt data set template, which already has source data organized into an analysis-ready table.
Also, some ETL pipelines can be turned into visualized insights with our pre-designed dashboards. Below, you’ll find some of our key examples:
1. Monitoring PPC campaign results
Marketers often struggle with fragmented data scattered across various PPC platforms – Google, Meta, LinkedIn Ads, and others – making it hard to get a clear picture of what’s working. Manual data collection and formatting from multiple platforms is time-consuming and error-prone.
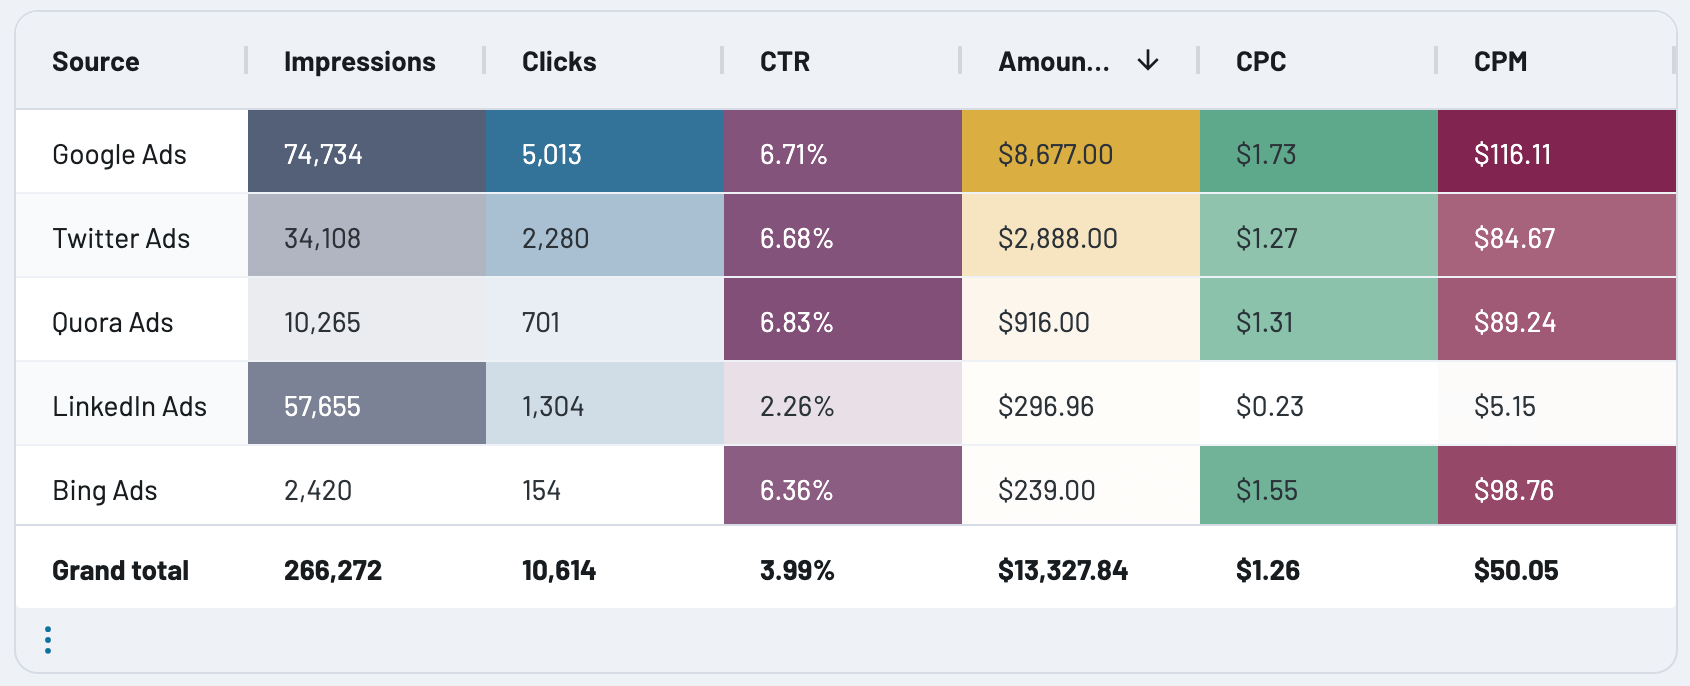
An ETL pipeline solves this by pulling data from each platform. The transformation part allows you to standardize currency formats, normalize campaign naming conventions, and calculate unified cost-per-acquisition metrics across all channels. Once unified, you can compare performance across platforms in one view.
For example, by combining click and spend data, you can see which channels are most cost-efficient. Trends in clicks over time reveal which platforms best engage your audience. Engagement spikes help you identify when to increase bids or adjust scheduling.
Additionally, weekly and monthly roll-ups let you zoom out and plan budgets more effectively, backed by clean, consistent data.
Data sources:
- Google Ads
- Facebook Ads
- Instagram Ads
- TikTok Ads
- Microsoft Ads
- X Ads
- LinkedIn Ads
- Quora Ads
Data transformations: The pipeline consolidates campaign data from different ad platforms by appending rows under shared headers. It also aggregates daily metrics into weekly and monthly rollups.
How to implement: You have two options to get started, depending on your goal. To quickly gather key metrics – clicks, impressions, spend, etc. – across platforms, use the PPC campaign performance dataset template in Coupler.io. It’s a good starting point if you want raw, structured data you can slice and analyze however you like:
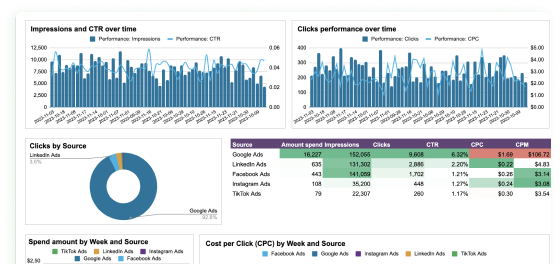
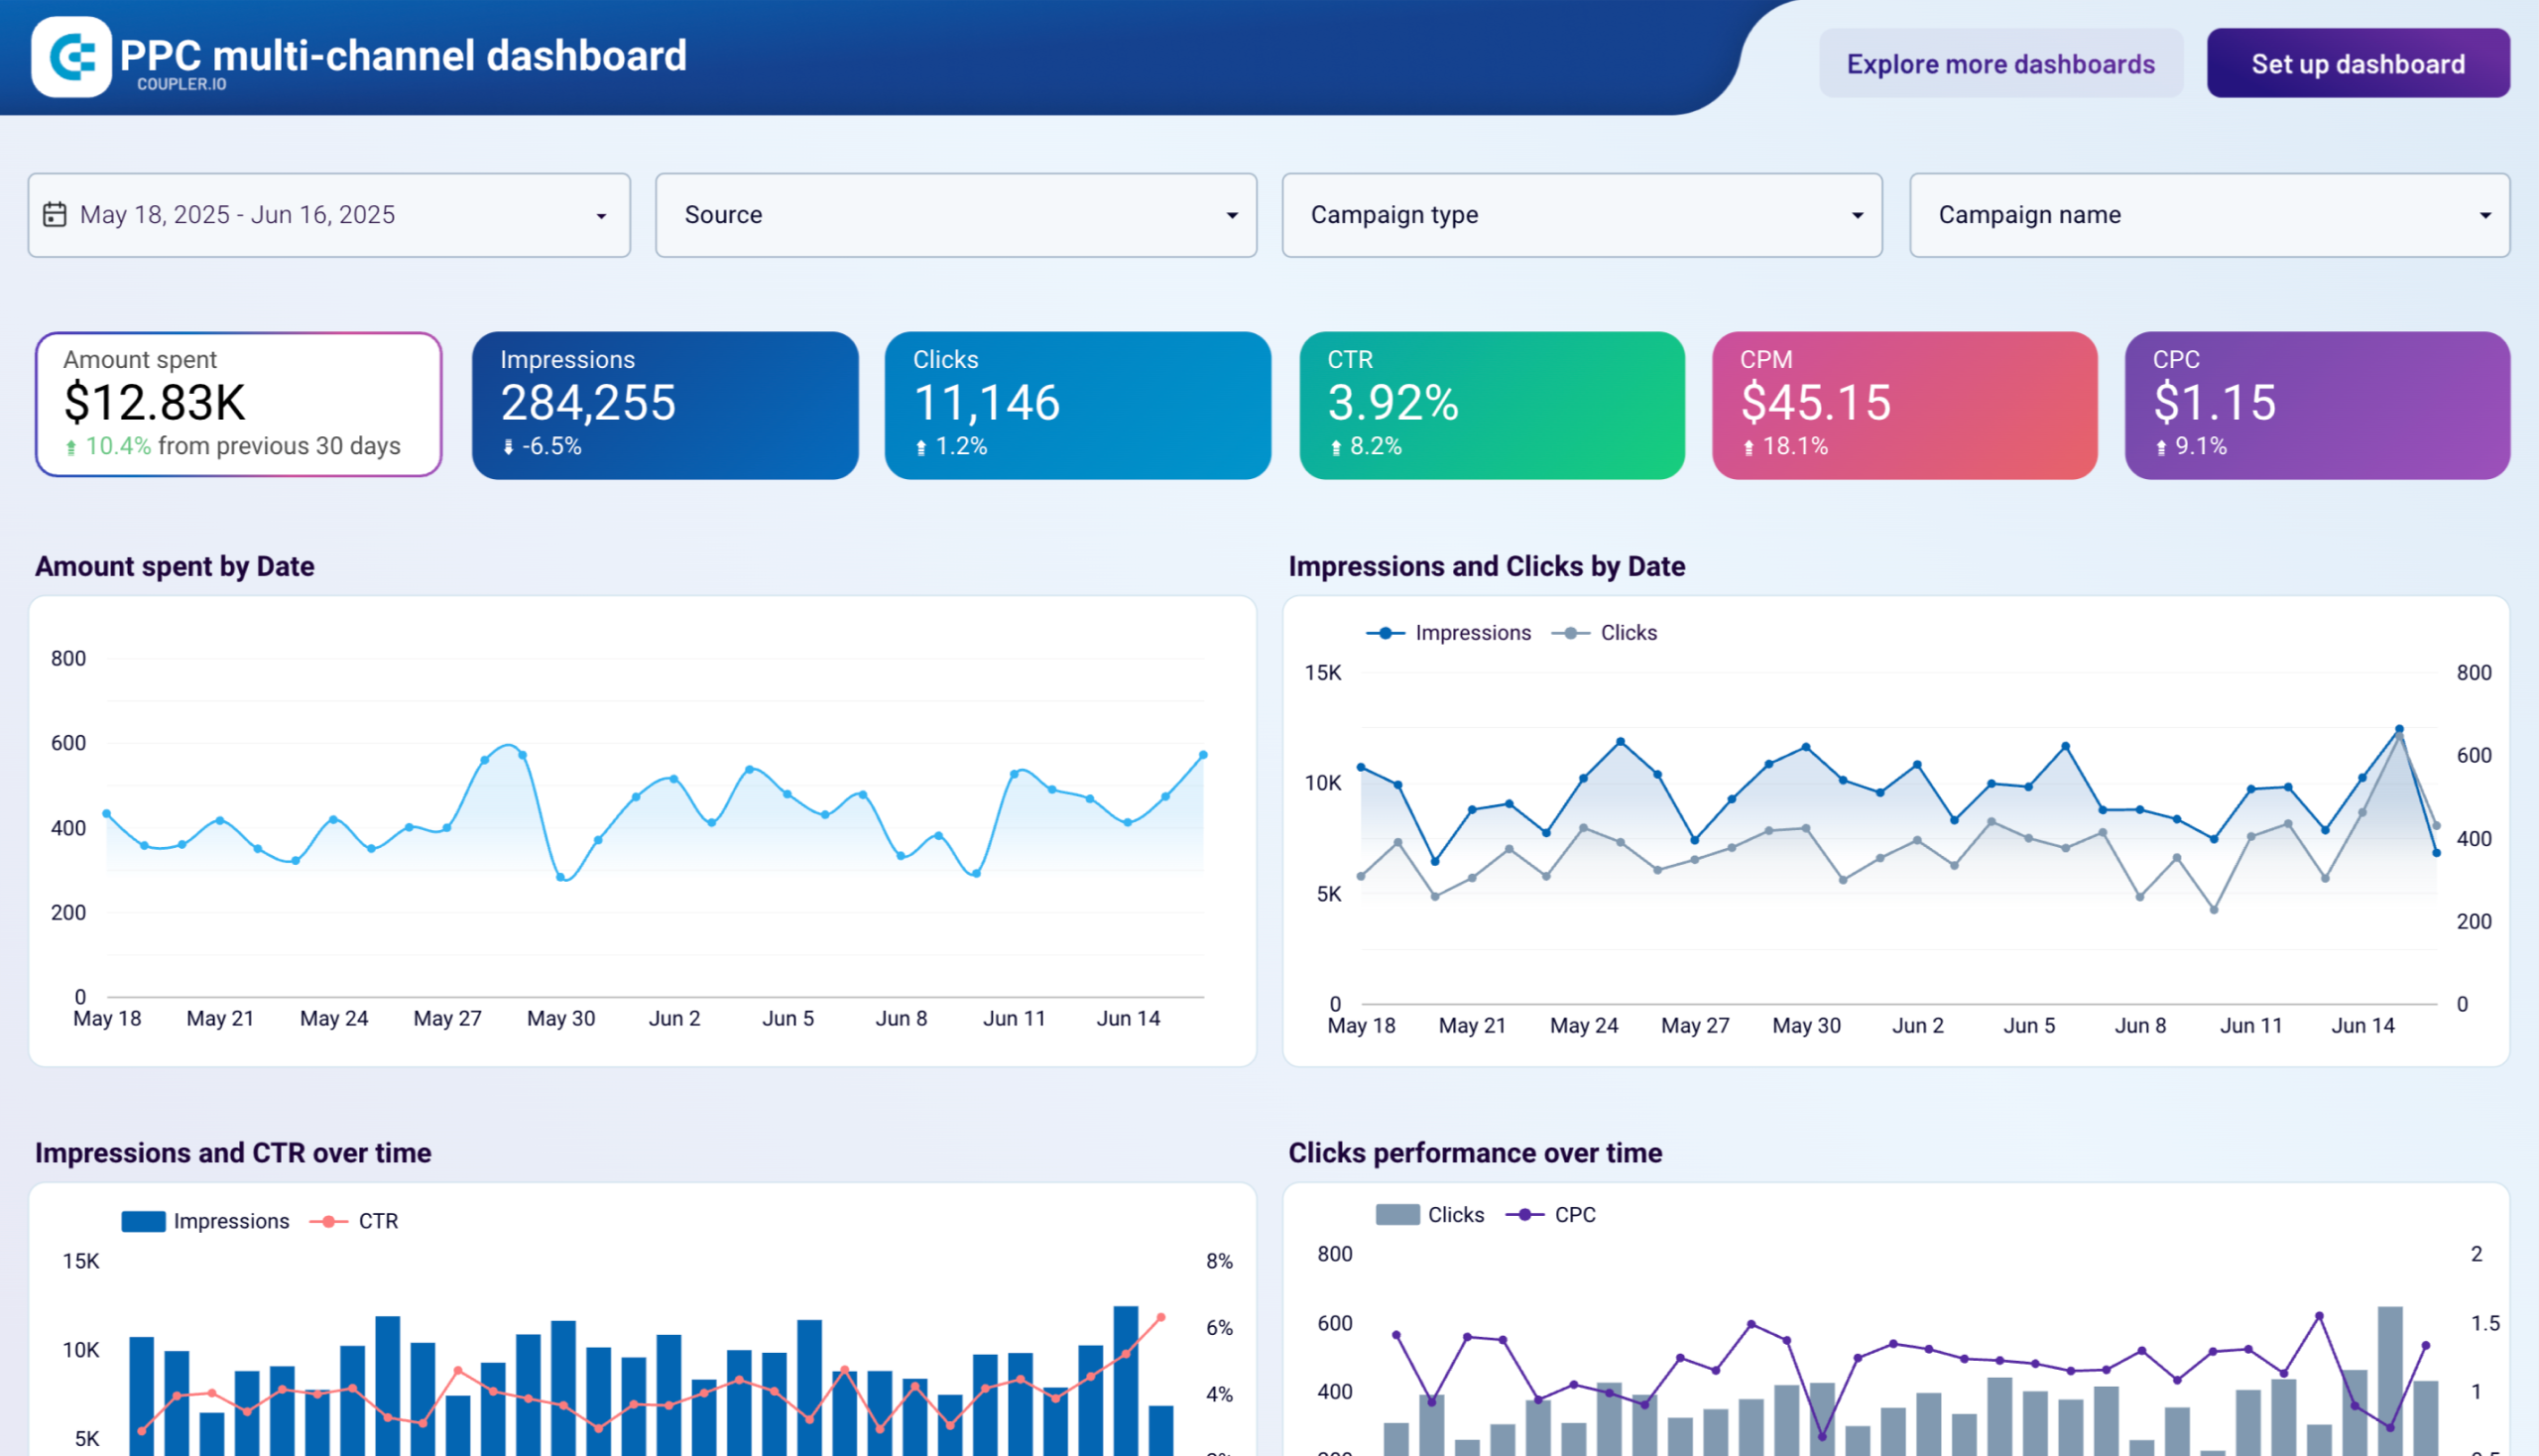
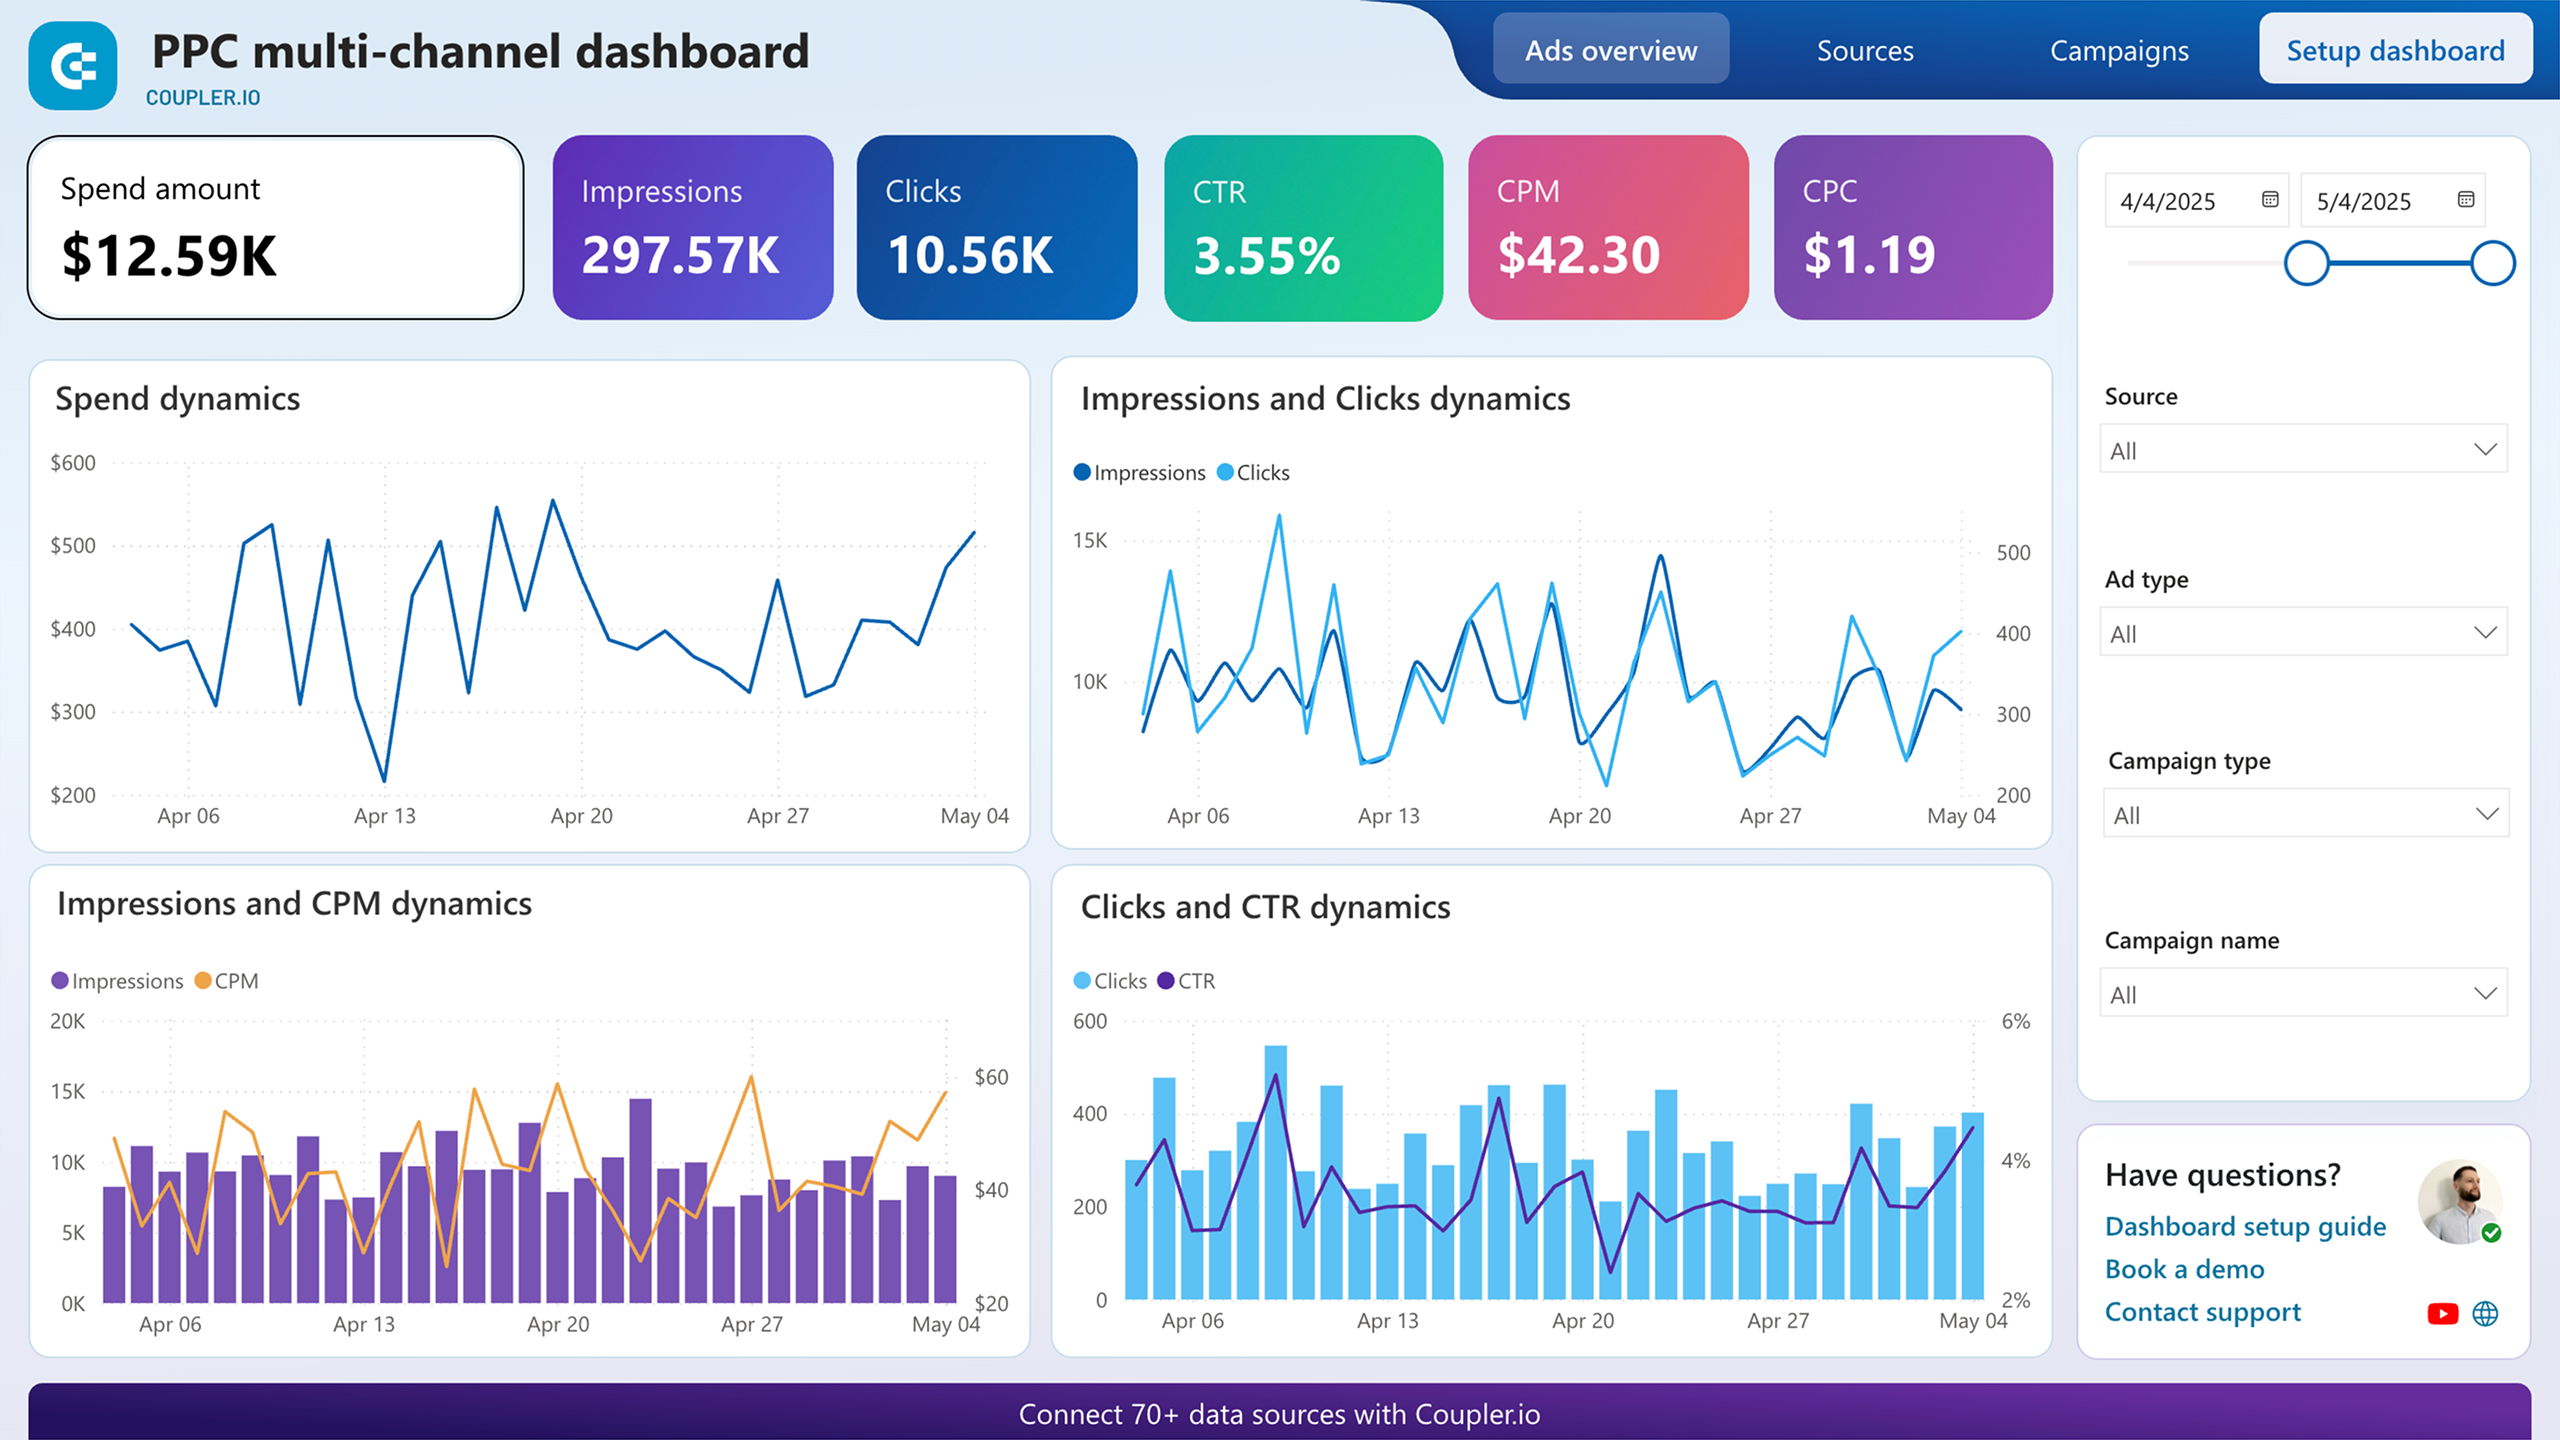
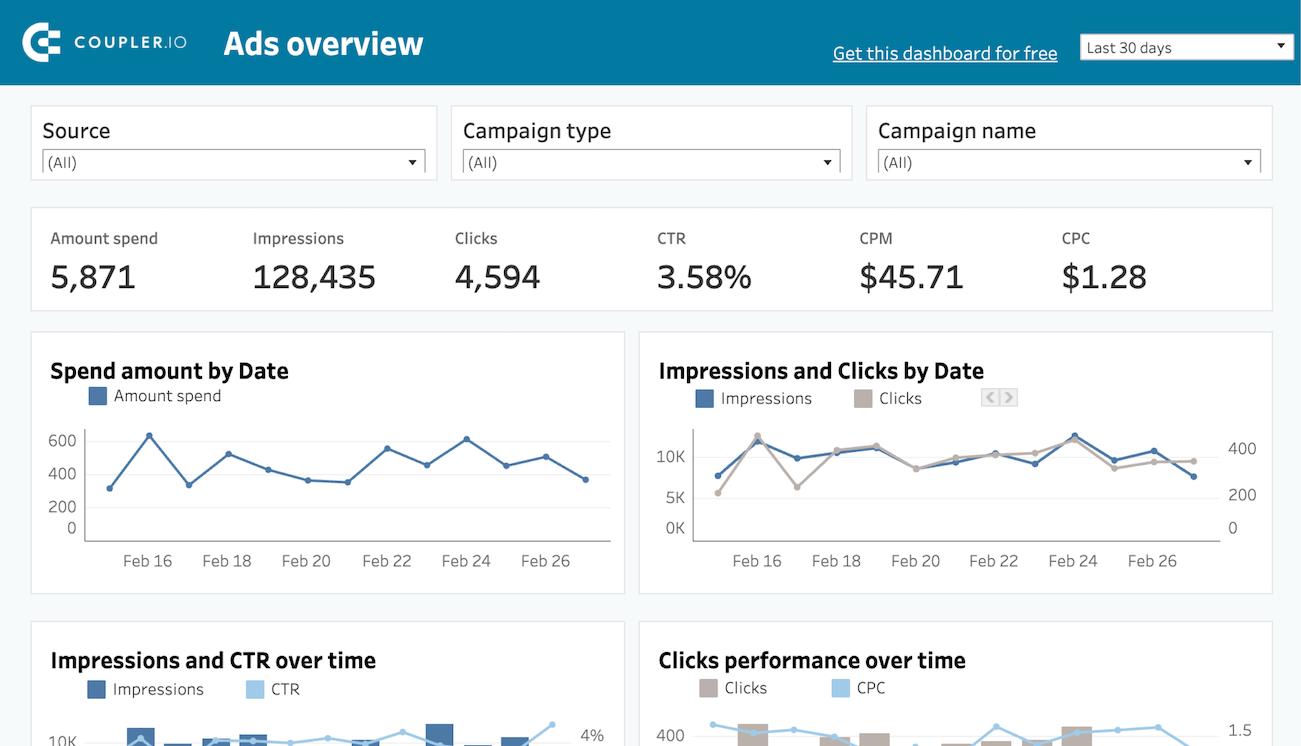
If you prefer to skip the data wrangling and jump straight into insights, pick the PPC multichannel dashboard template – perfect for weekly/monthly reviews or sharing with stakeholders:
You can use this either as a dashboard directly within Coupler.io, or as a template for other tools like Google Sheets, Looker Studio, Power BI, or Tableau. For the latter, simply navigate to the Readme tab within the template for setup instructions.
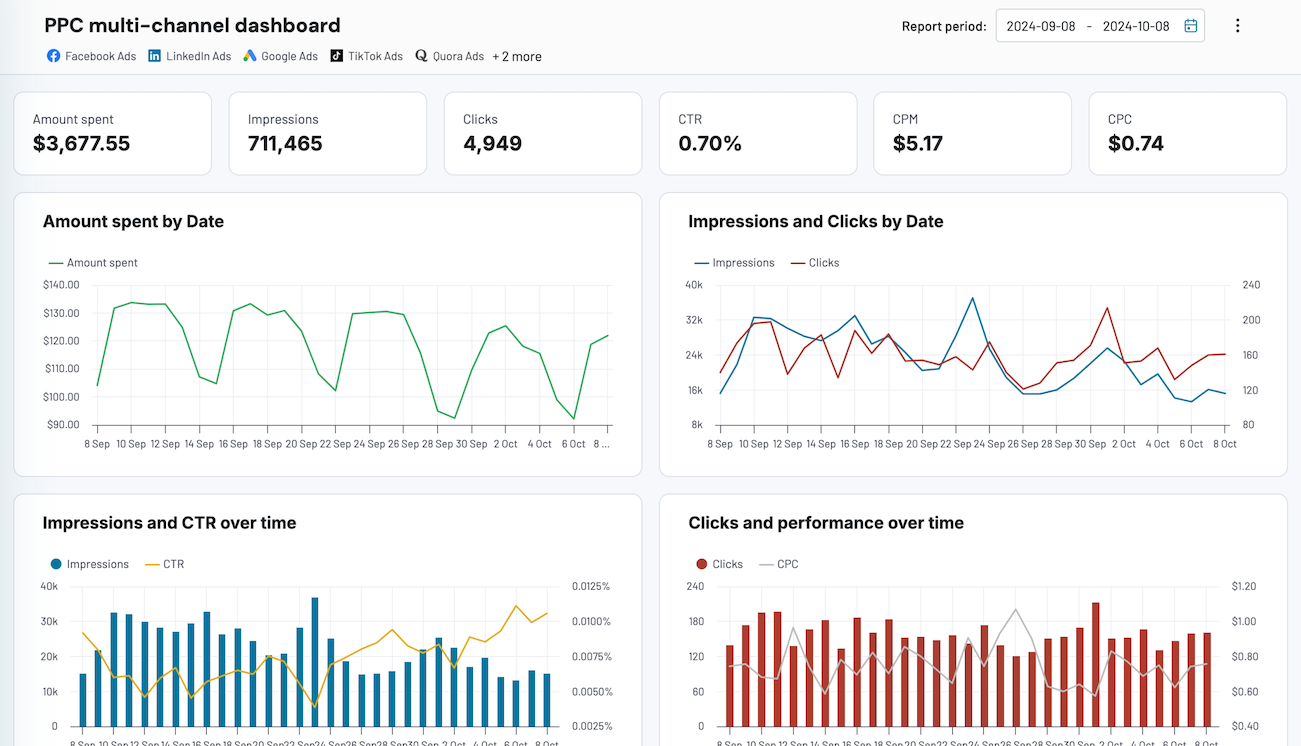
PPC multi-channel dashboard
Consolidate data from multiple advertising platforms including Google, Facebook, LinkedIn, TikTok, and more to track campaign performance, analyze spend efficiency, and optimize your PPC budget allocation across channels.


PPC multi-channel dashboard in Google Sheets
Use a PPC dashboard designed for Google Sheets to track the performance of your campaigns across multiple advertising platforms.

PPC multi-channel dashboard in Looker Studio
Get a comprehensive PPC reporting tool to track the performance of your campaigns launched at multiple advertising platforms.

PPC multi-channel dashboard in Power BI
Utilize a Power BI PPC dashboard for tracking and analyzing your advertising campaigns across multiple platforms.

PPC multi-channel dashboard in Tableau
Track and analyze the performance of your advertising campaigns across various platforms using a one-stop PPC dashboard in Tableau

2. Checking out Snapchat Ads’ effectiveness
Snapchat’s native tools take effort to analyze performance across multiple campaigns, ad sets, and individual ads. Campaign managers often spend significant time manually exporting and combining data from different reporting sections. It’s especially difficult to track metrics like clicks, conversions, and spend all in one view over time.
Through an ETL pipeline, you can fetch your Snapchat ad data into a structured format. This gives you a clear view of clicks, impressions, conversions, and amount spent across all levels – campaigns, ad groups, and ads.
In this case, you can compare performance, monitor spend, and make better decisions about which ads to scale or adjust.
Data sources: Snapchat Ads
Data transformations: Data is unified using join operations, aligning rows based on shared columns. Besides, the data is sorted, and irrelevant columns are hidden.
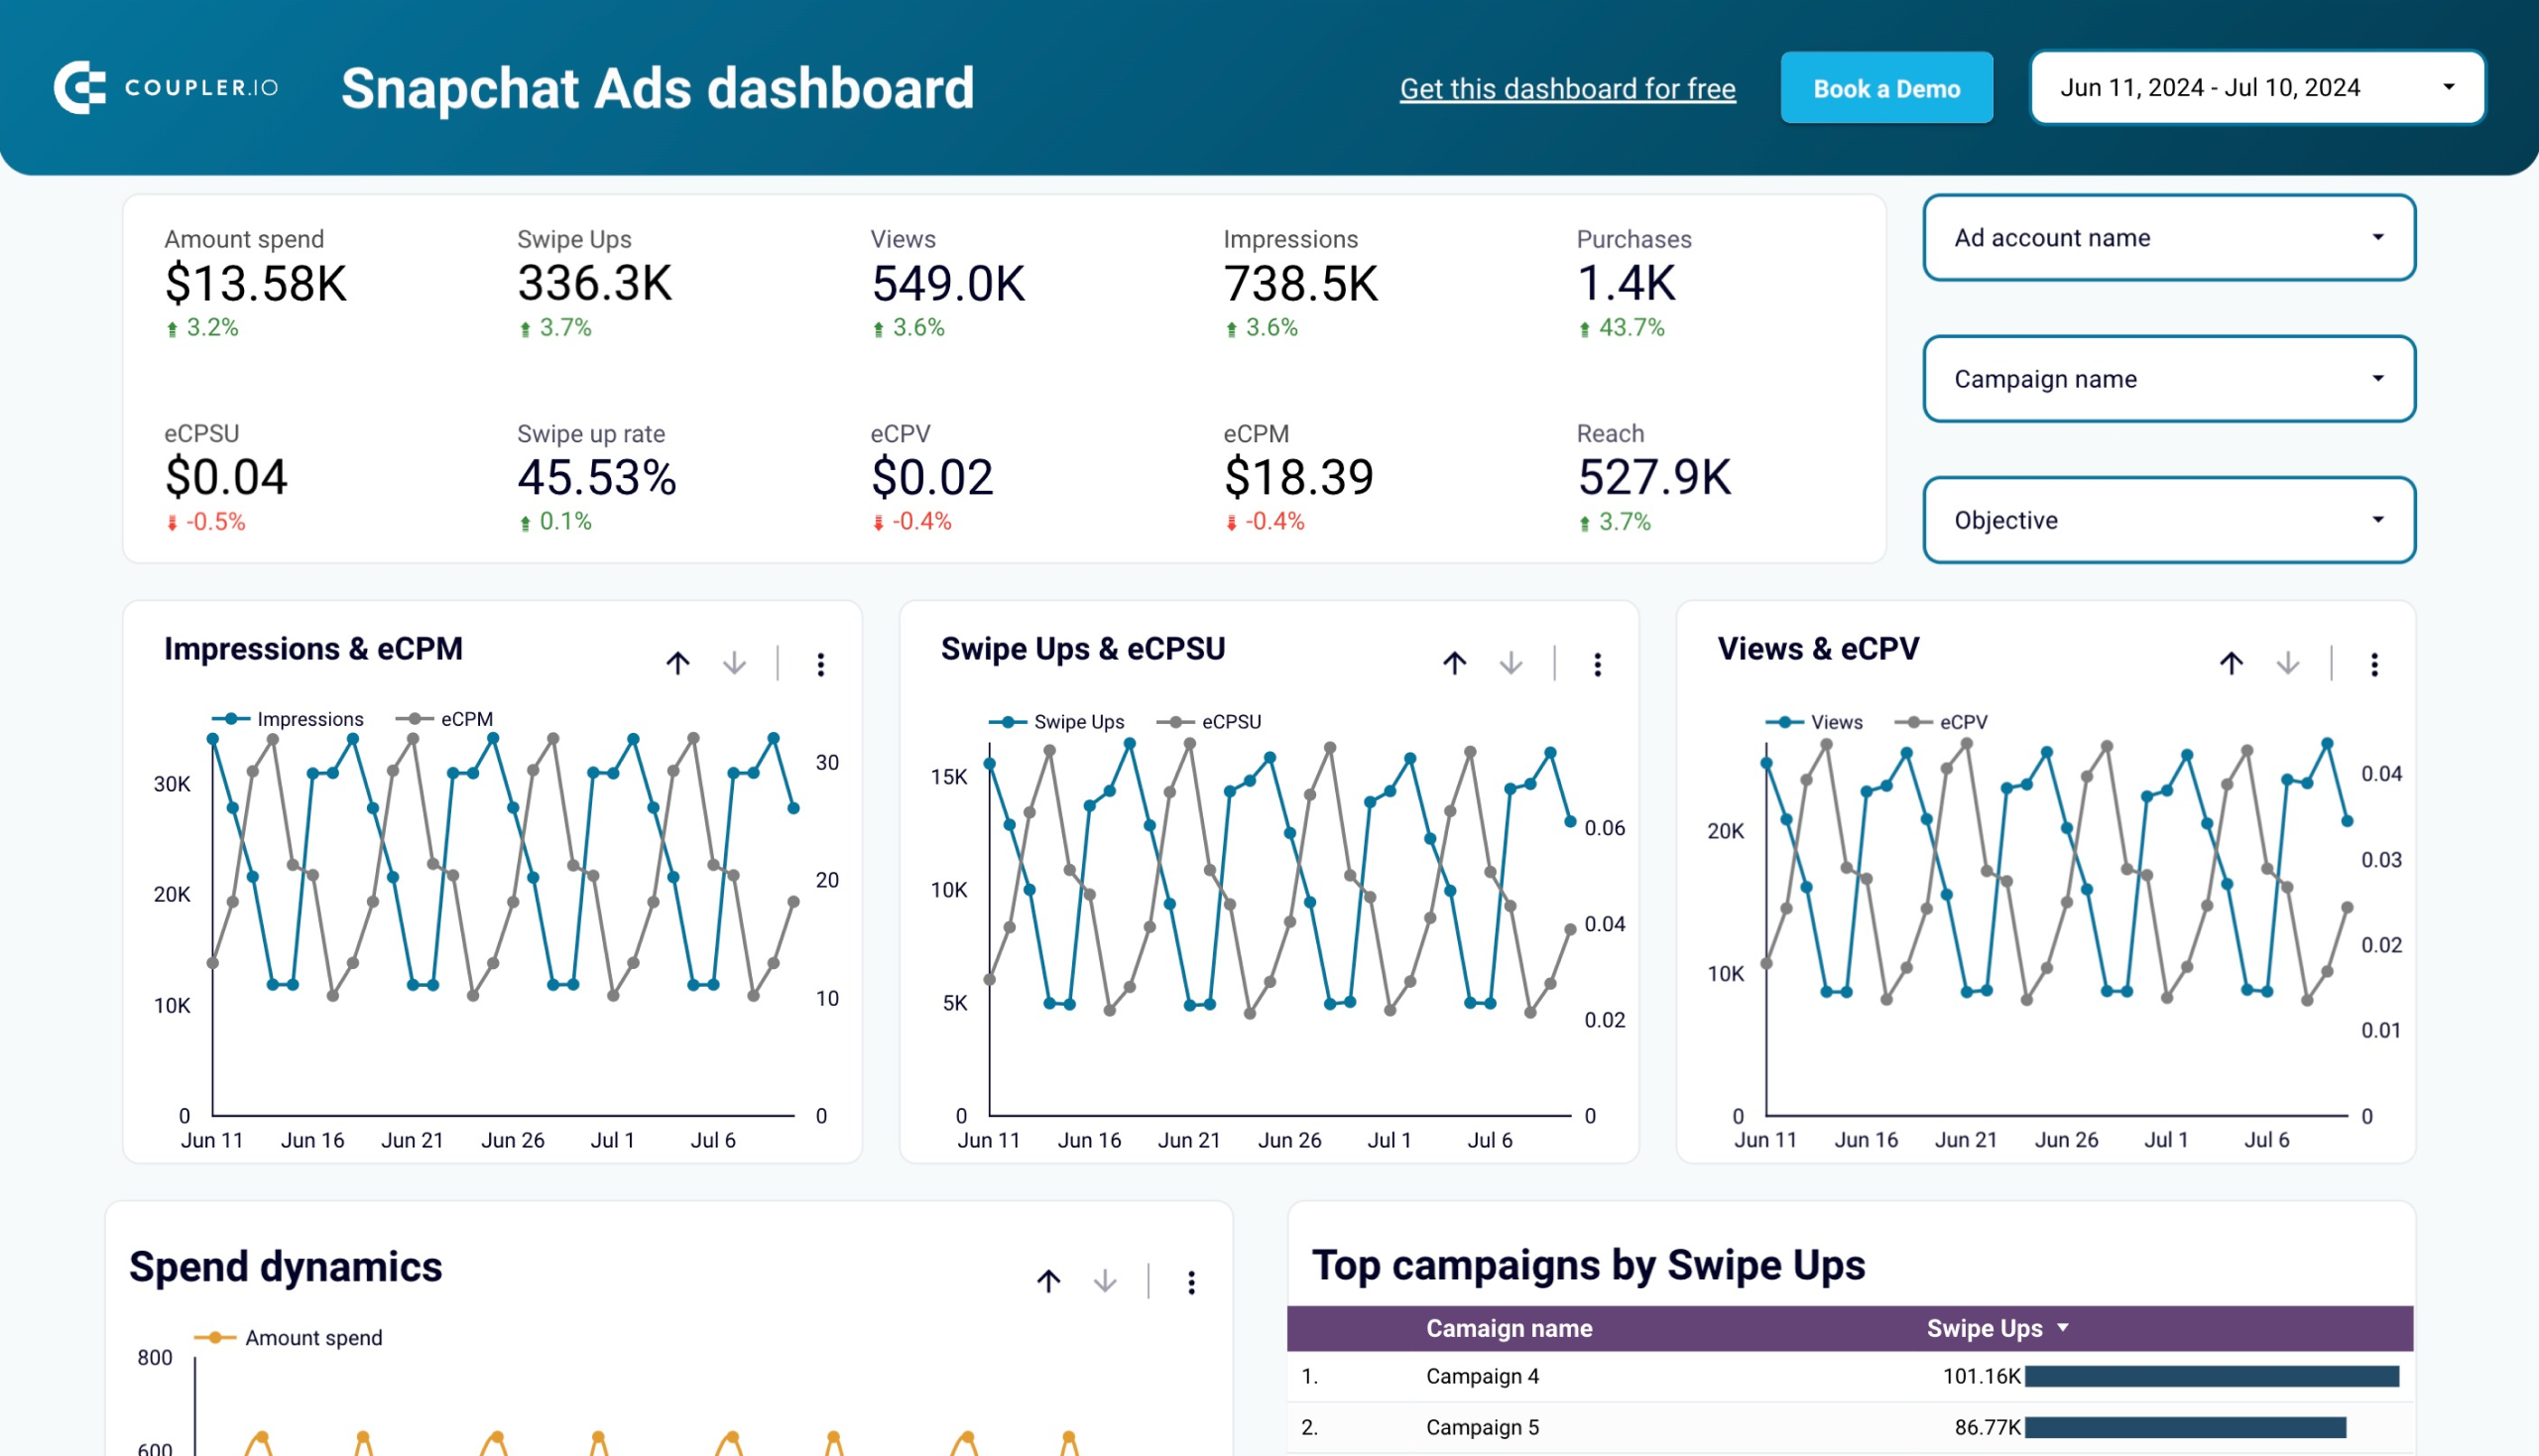
How to implement: The Snapchat Ads performance & ad groups & campaigns dataset template helps you extract detailed metrics like clicks, impressions, conversions, and spend. It gives you a structured view across campaigns, ad sets, and individual ads – ideal for performance analysis and optimization.
To access this template, create a new data flow in Coupler.io from a data set and search for “Snapchat Ads performance & Ad groups & Campaigns”.
For a quick, visual overview, the dashboard template organizes this data into charts and tables. It’s great for comparing ad performance and tracking budget use without building reports from scratch.
The dashboard is available in Looker Studio. To set it up, follow the Readme instructions directly in the template.
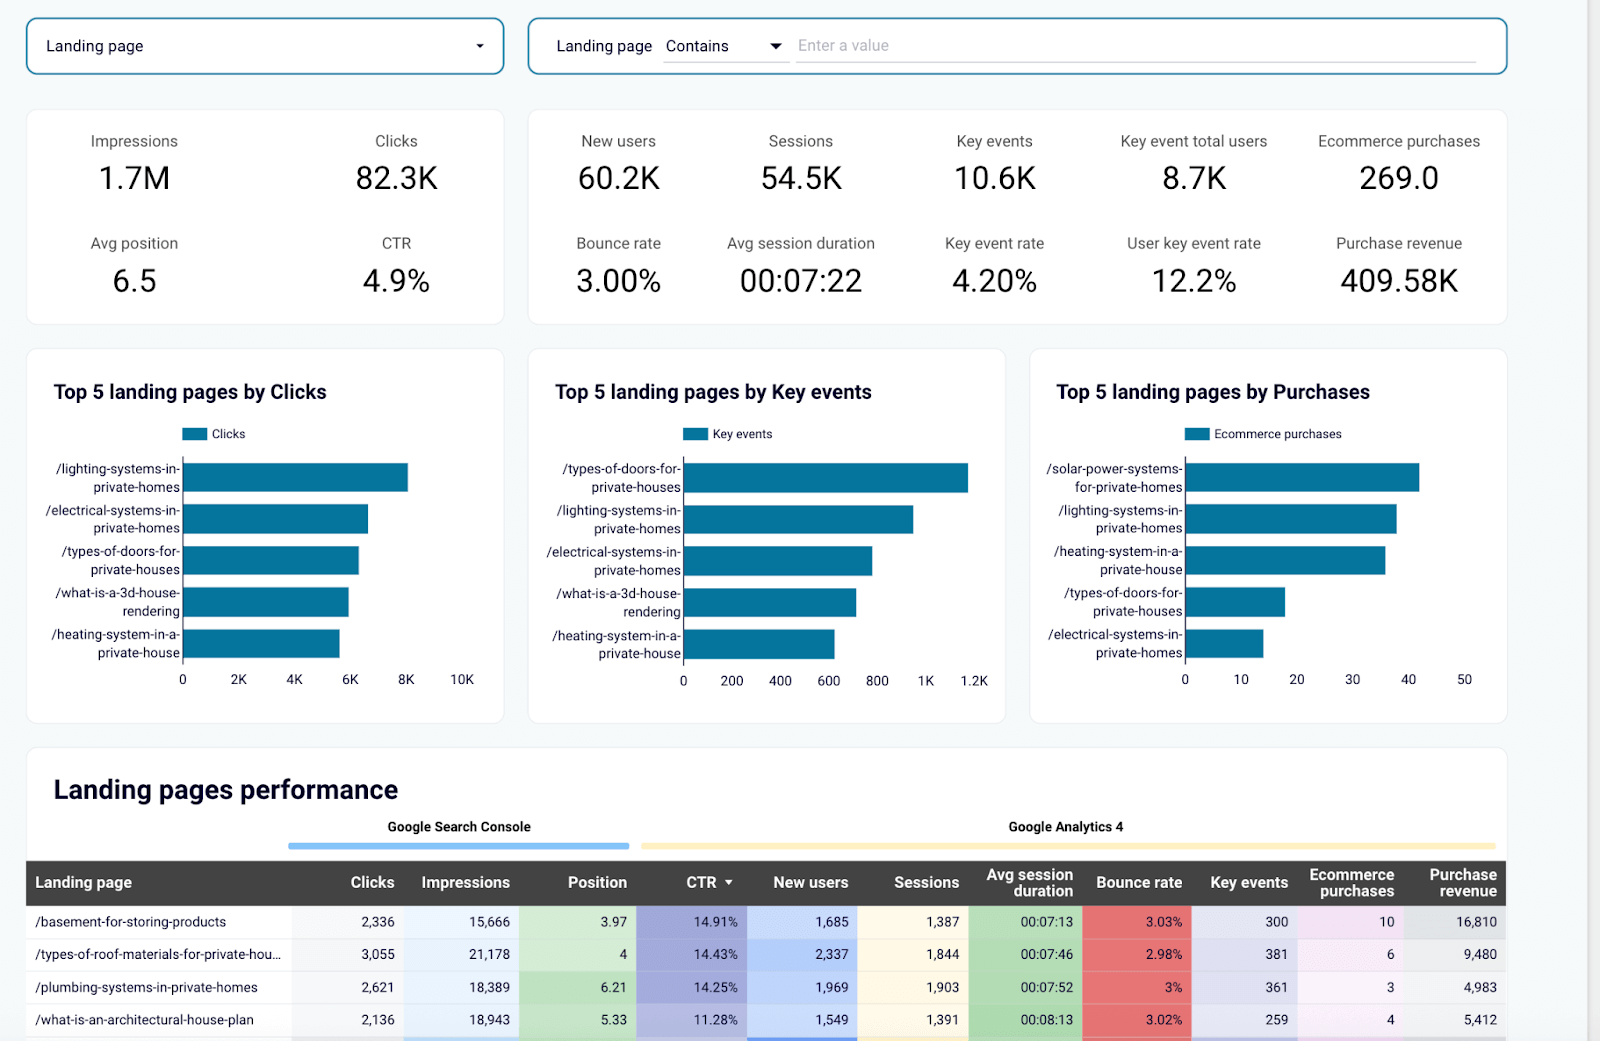
3. Analyzing website and landing page performance
It’s hard to understand how visitors behave on your landing pages when data lives only inside Google Analytics 4. You might see totals in GA4, but comparing pages, spotting drop-offs, or analyzing trends over time can be frustrating, especially if you’re working across multiple campaigns.
To tackle this challenge, you can pull landing page data, including key metrics such as new users, bounce rate, and key event rate, into one view. Once the data is unified and accessible, it’s much easier to compare performance, spot patterns, and optimize specific pages.
You can analyze this data week by week or month by month to track how changes – like copy updates or new offers – impact engagement over time.
Data source: Google Analytics 4
Data transformations: Only key metrics are included. Daily performance data is aggregated into weekly and monthly views.
How to implement: Use Coupler.io’s GA4 landing page performance dataset template if you want full control over how you sort, filter, or join the data with other sources.
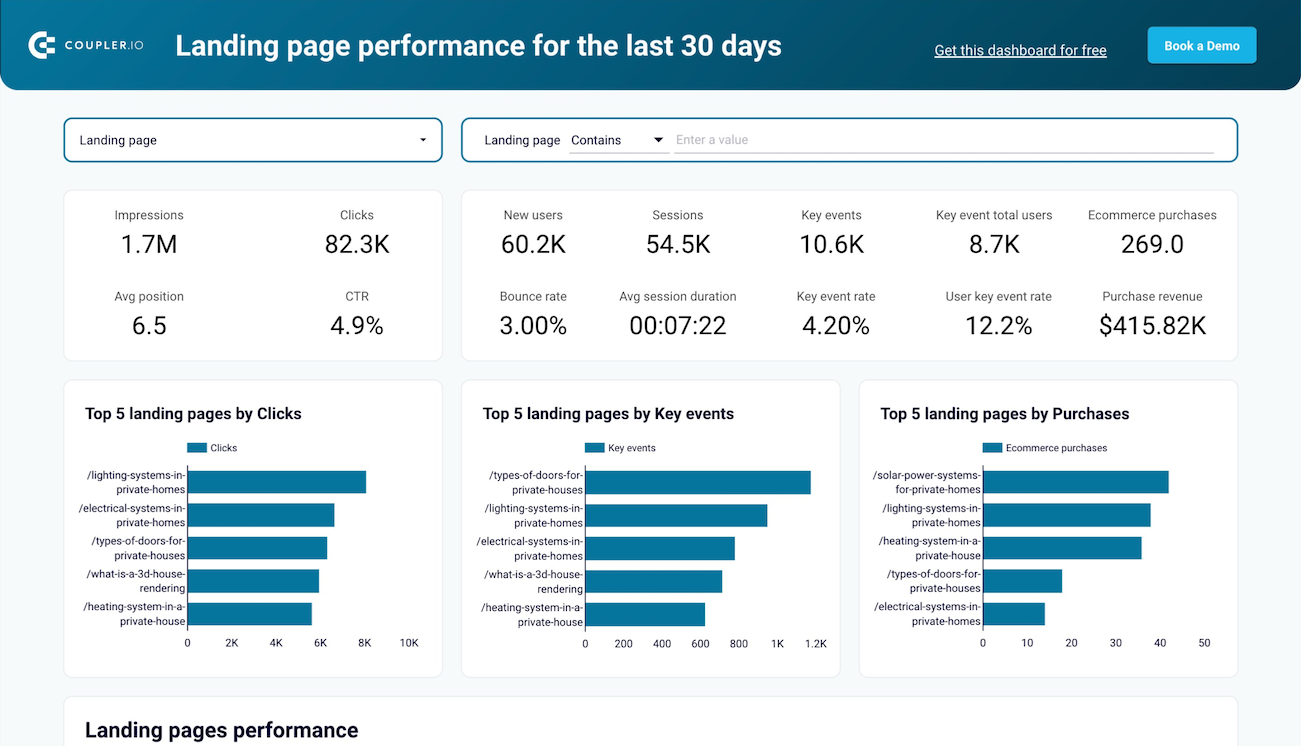
If you prefer to see trends and metrics right away, the dashboard gives you a ready-to-use visual overview of landing page performance. It combines data from both GA4 and Google Search Console, so you can track on-page engagement and organic search performance in one place – without having to build charts yourself.
Landing page performance dashboard
 Preview dashboard
Landing page performance dashboard
Preview dashboardTo use the dashboard, available in Google Sheets and Looker Studio, go to the Readme tab inside the template and follow the instructions to set it up.
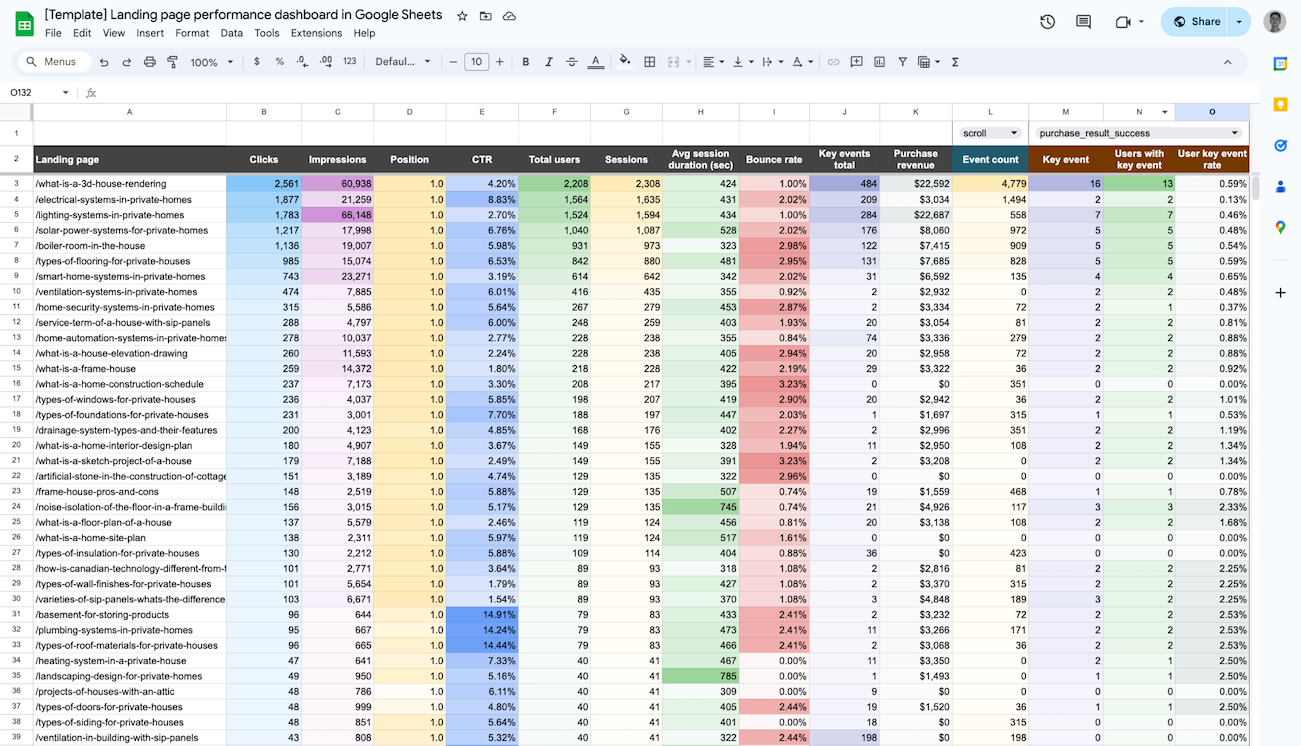
Landing page performance dashboard in Google Sheets
Analyze the effectiveness of your landing pages, from traffic and engagement to conversions, using data from GA4 and Search Console.

Landing page performance dashboard in Looker Studio
Evaluate the effectiveness of your landing pages such as traffic, clicks, bounce rate, and other metrics collected from GSC and GA4 in one dashboard.

4. SEO impact assessment
Google Search Console offers useful metrics, but analyzing them at scale is difficult. You’re limited in how far back you can go, and comparing multiple URLs or tracking trends across timeframes isn’t straightforward.
By setting up a process to extract and organize this data, you can work with metrics like impressions, clicks, CTR, and average position in a more flexible way. With structured data, it becomes easier to analyze performance week over week or month over month, identify which pages are gaining or losing visibility, and spot patterns in search behavior.
This kind of setup helps move from isolated snapshots to a broader understanding of your SEO performance – so you can act on what matters most.
Data source: Google Search Console
Data transformations: Metrics totals and aggregated data for weekly and monthly performance views.
How to implement: Go to Coupler.io to choose the Top pages performance dataset template. This lets you extract structured data showing key metrics for each top page. It’s helpful if you want to filter or compare performance across multiple URLs.
Prefer a visual summary? The dashboard version displays the same data with charts and filters already in place. It’s ideal for spotting high-performing content, tracking trends over time, or sharing SEO performance with your team.

This is available as a dashboard in Coupler.io, or alternatively as a template for Google Sheets, Looker Studio, and Power BI. To use the latter, just follow the step-by-step instructions in the template’s Readme tab.
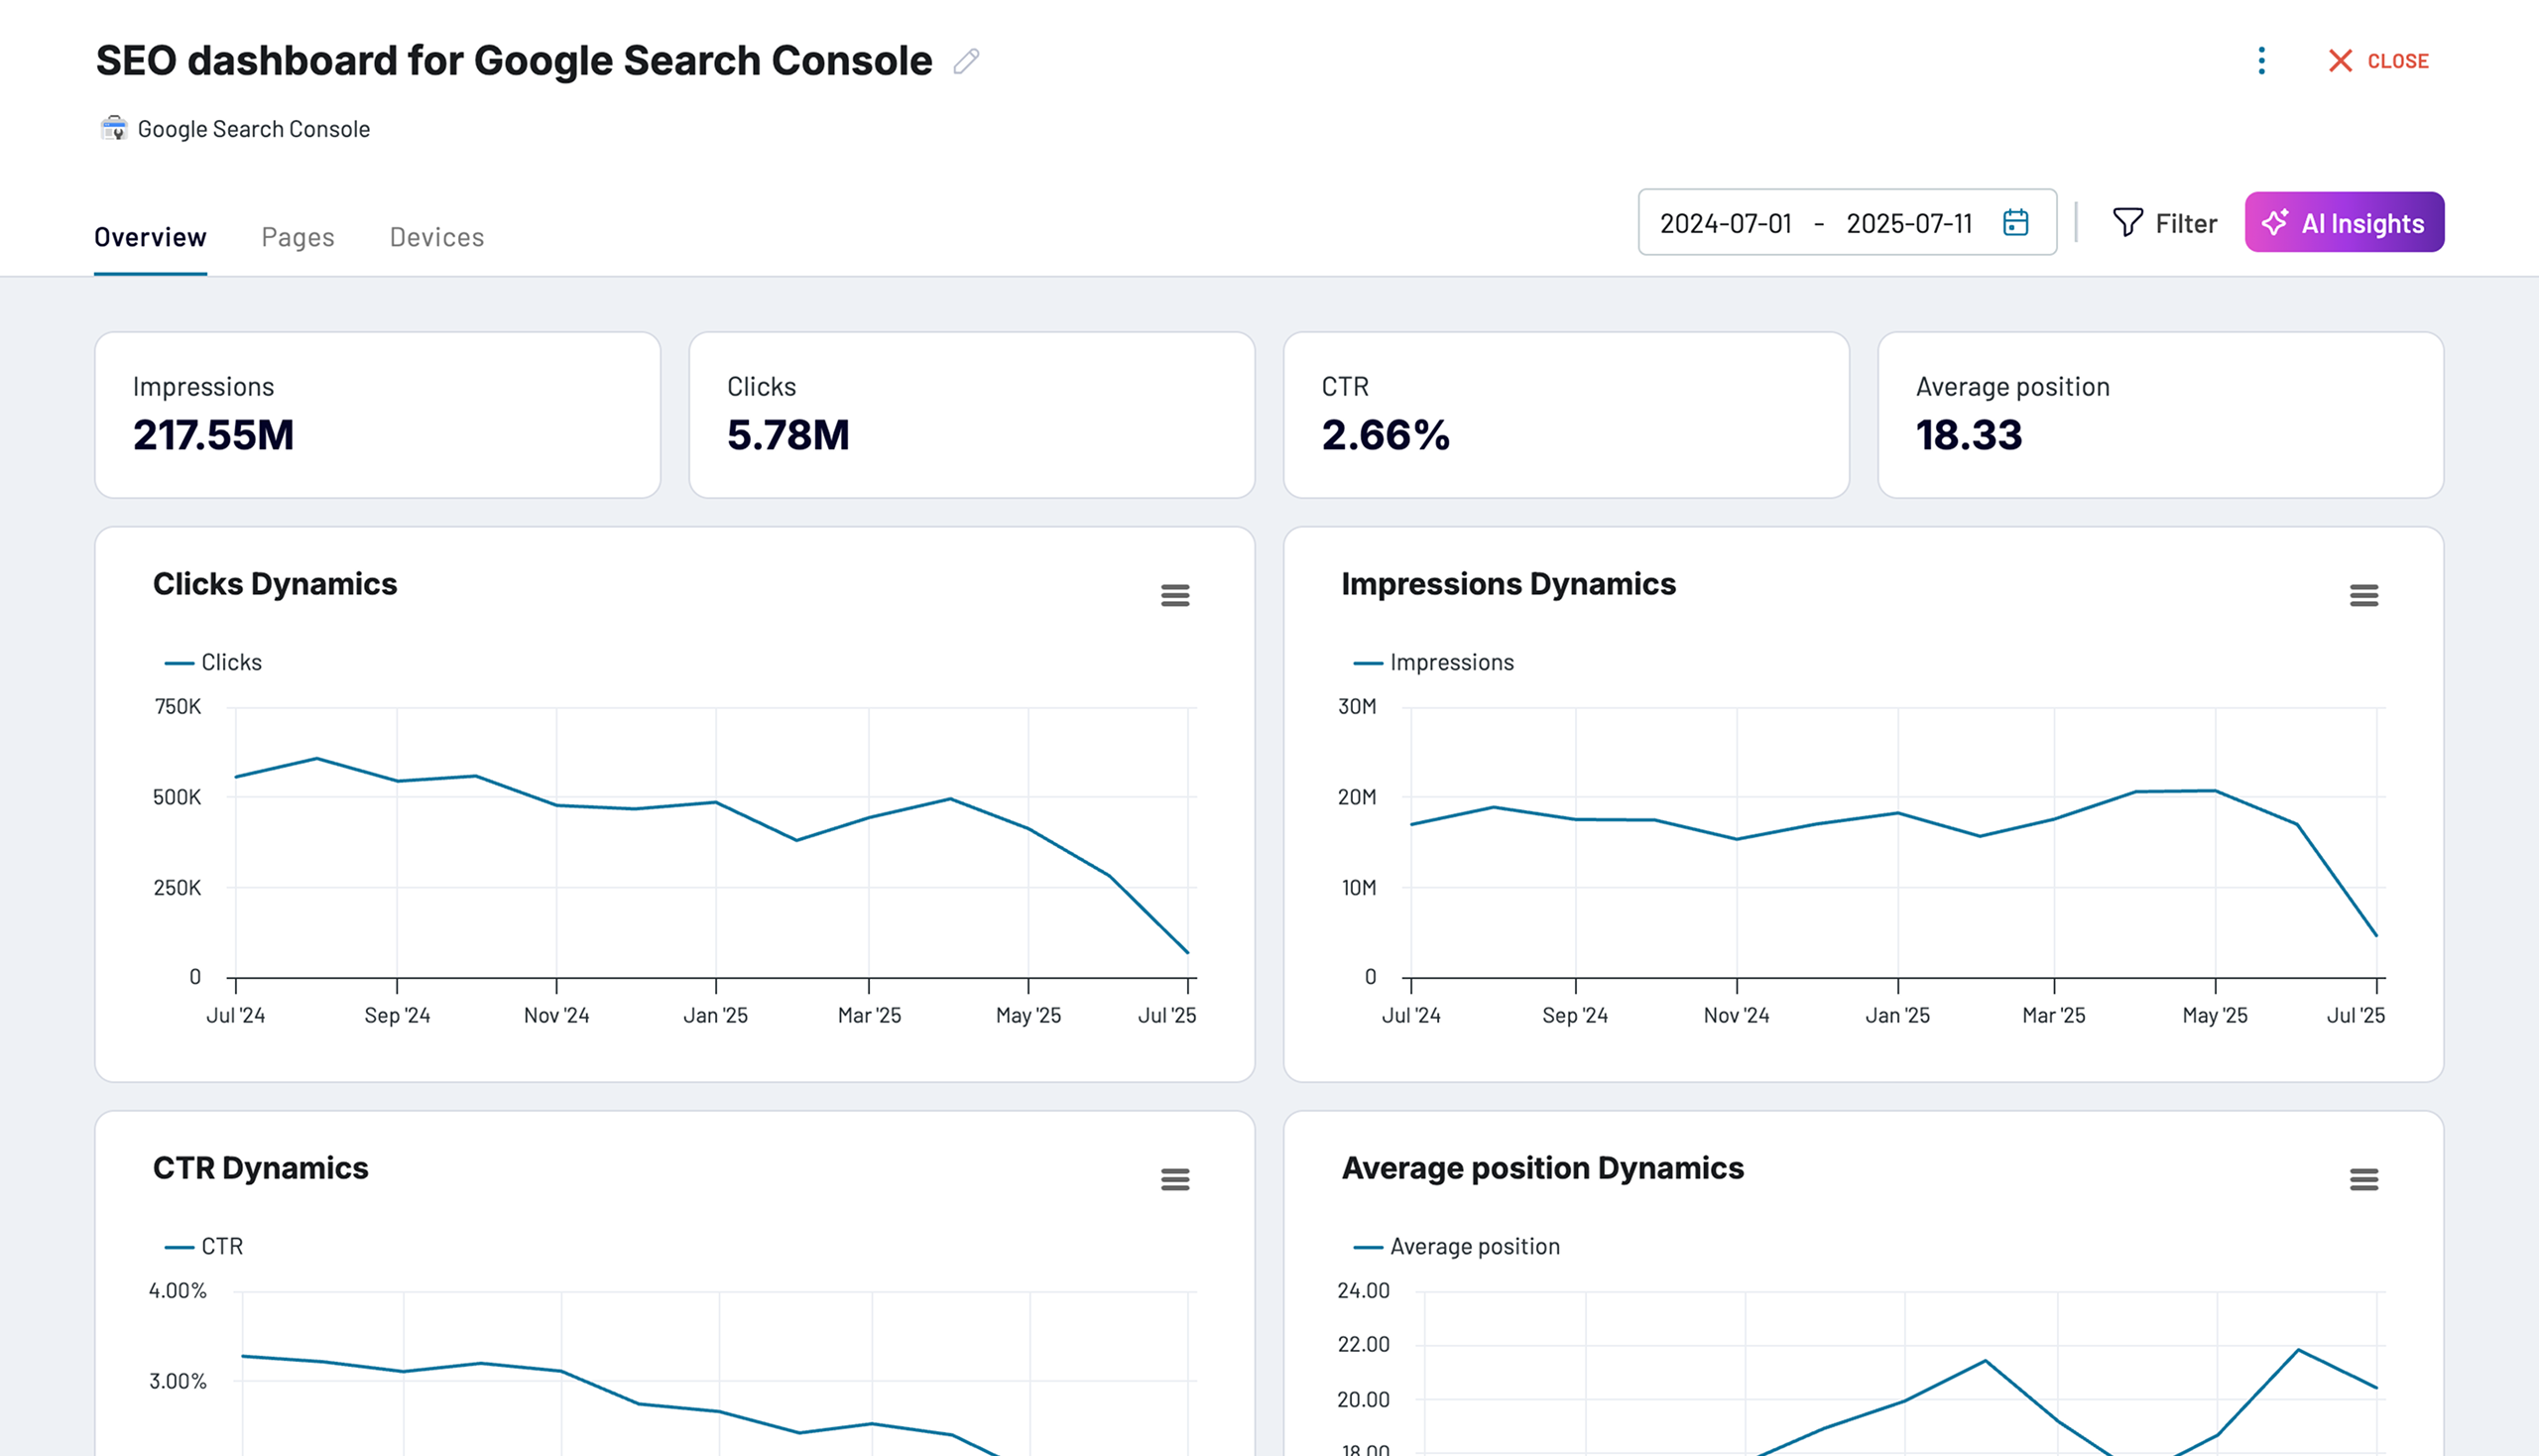
SEO dashboard for Google Search Console
Monitor your website’s search performance with detailed analysis of keyword rankings, click-through rates, and indexing status to improve organic visibility and drive qualified traffic.
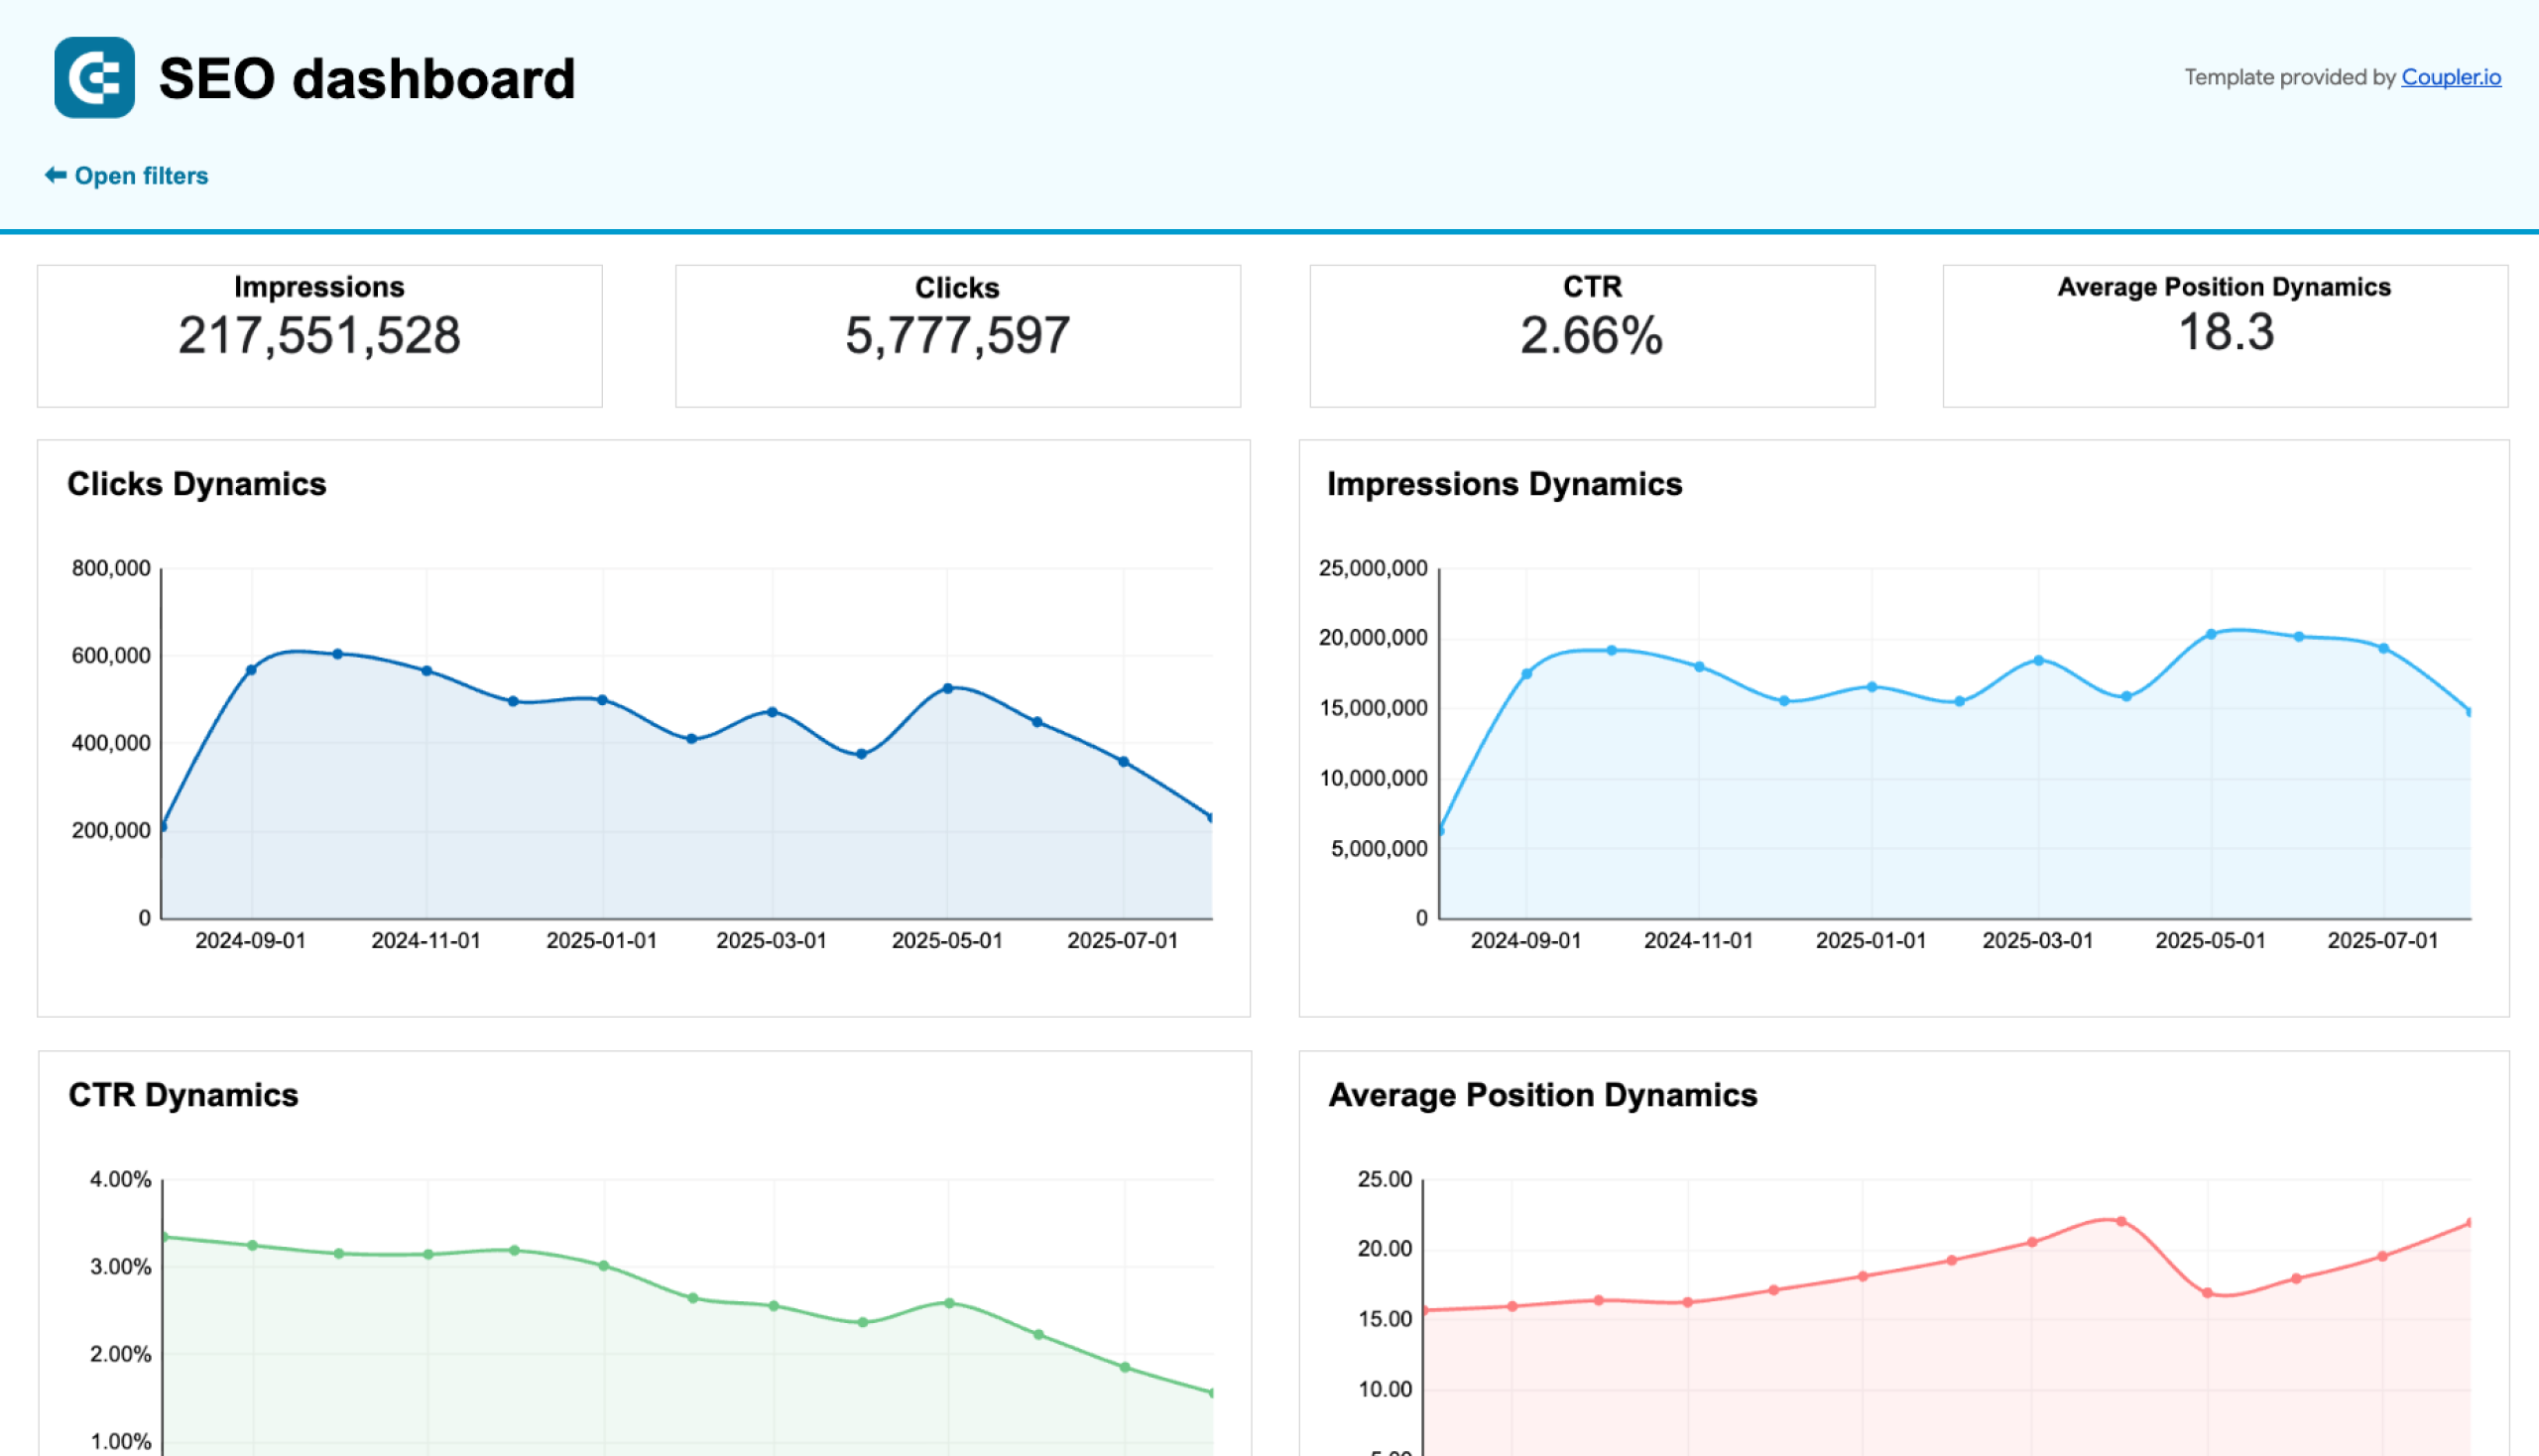
SEO dashboard for Google Search Console in Google Sheets
Get an overview and details of the key performance metrics from Google Search Console required for SEO of your websites.
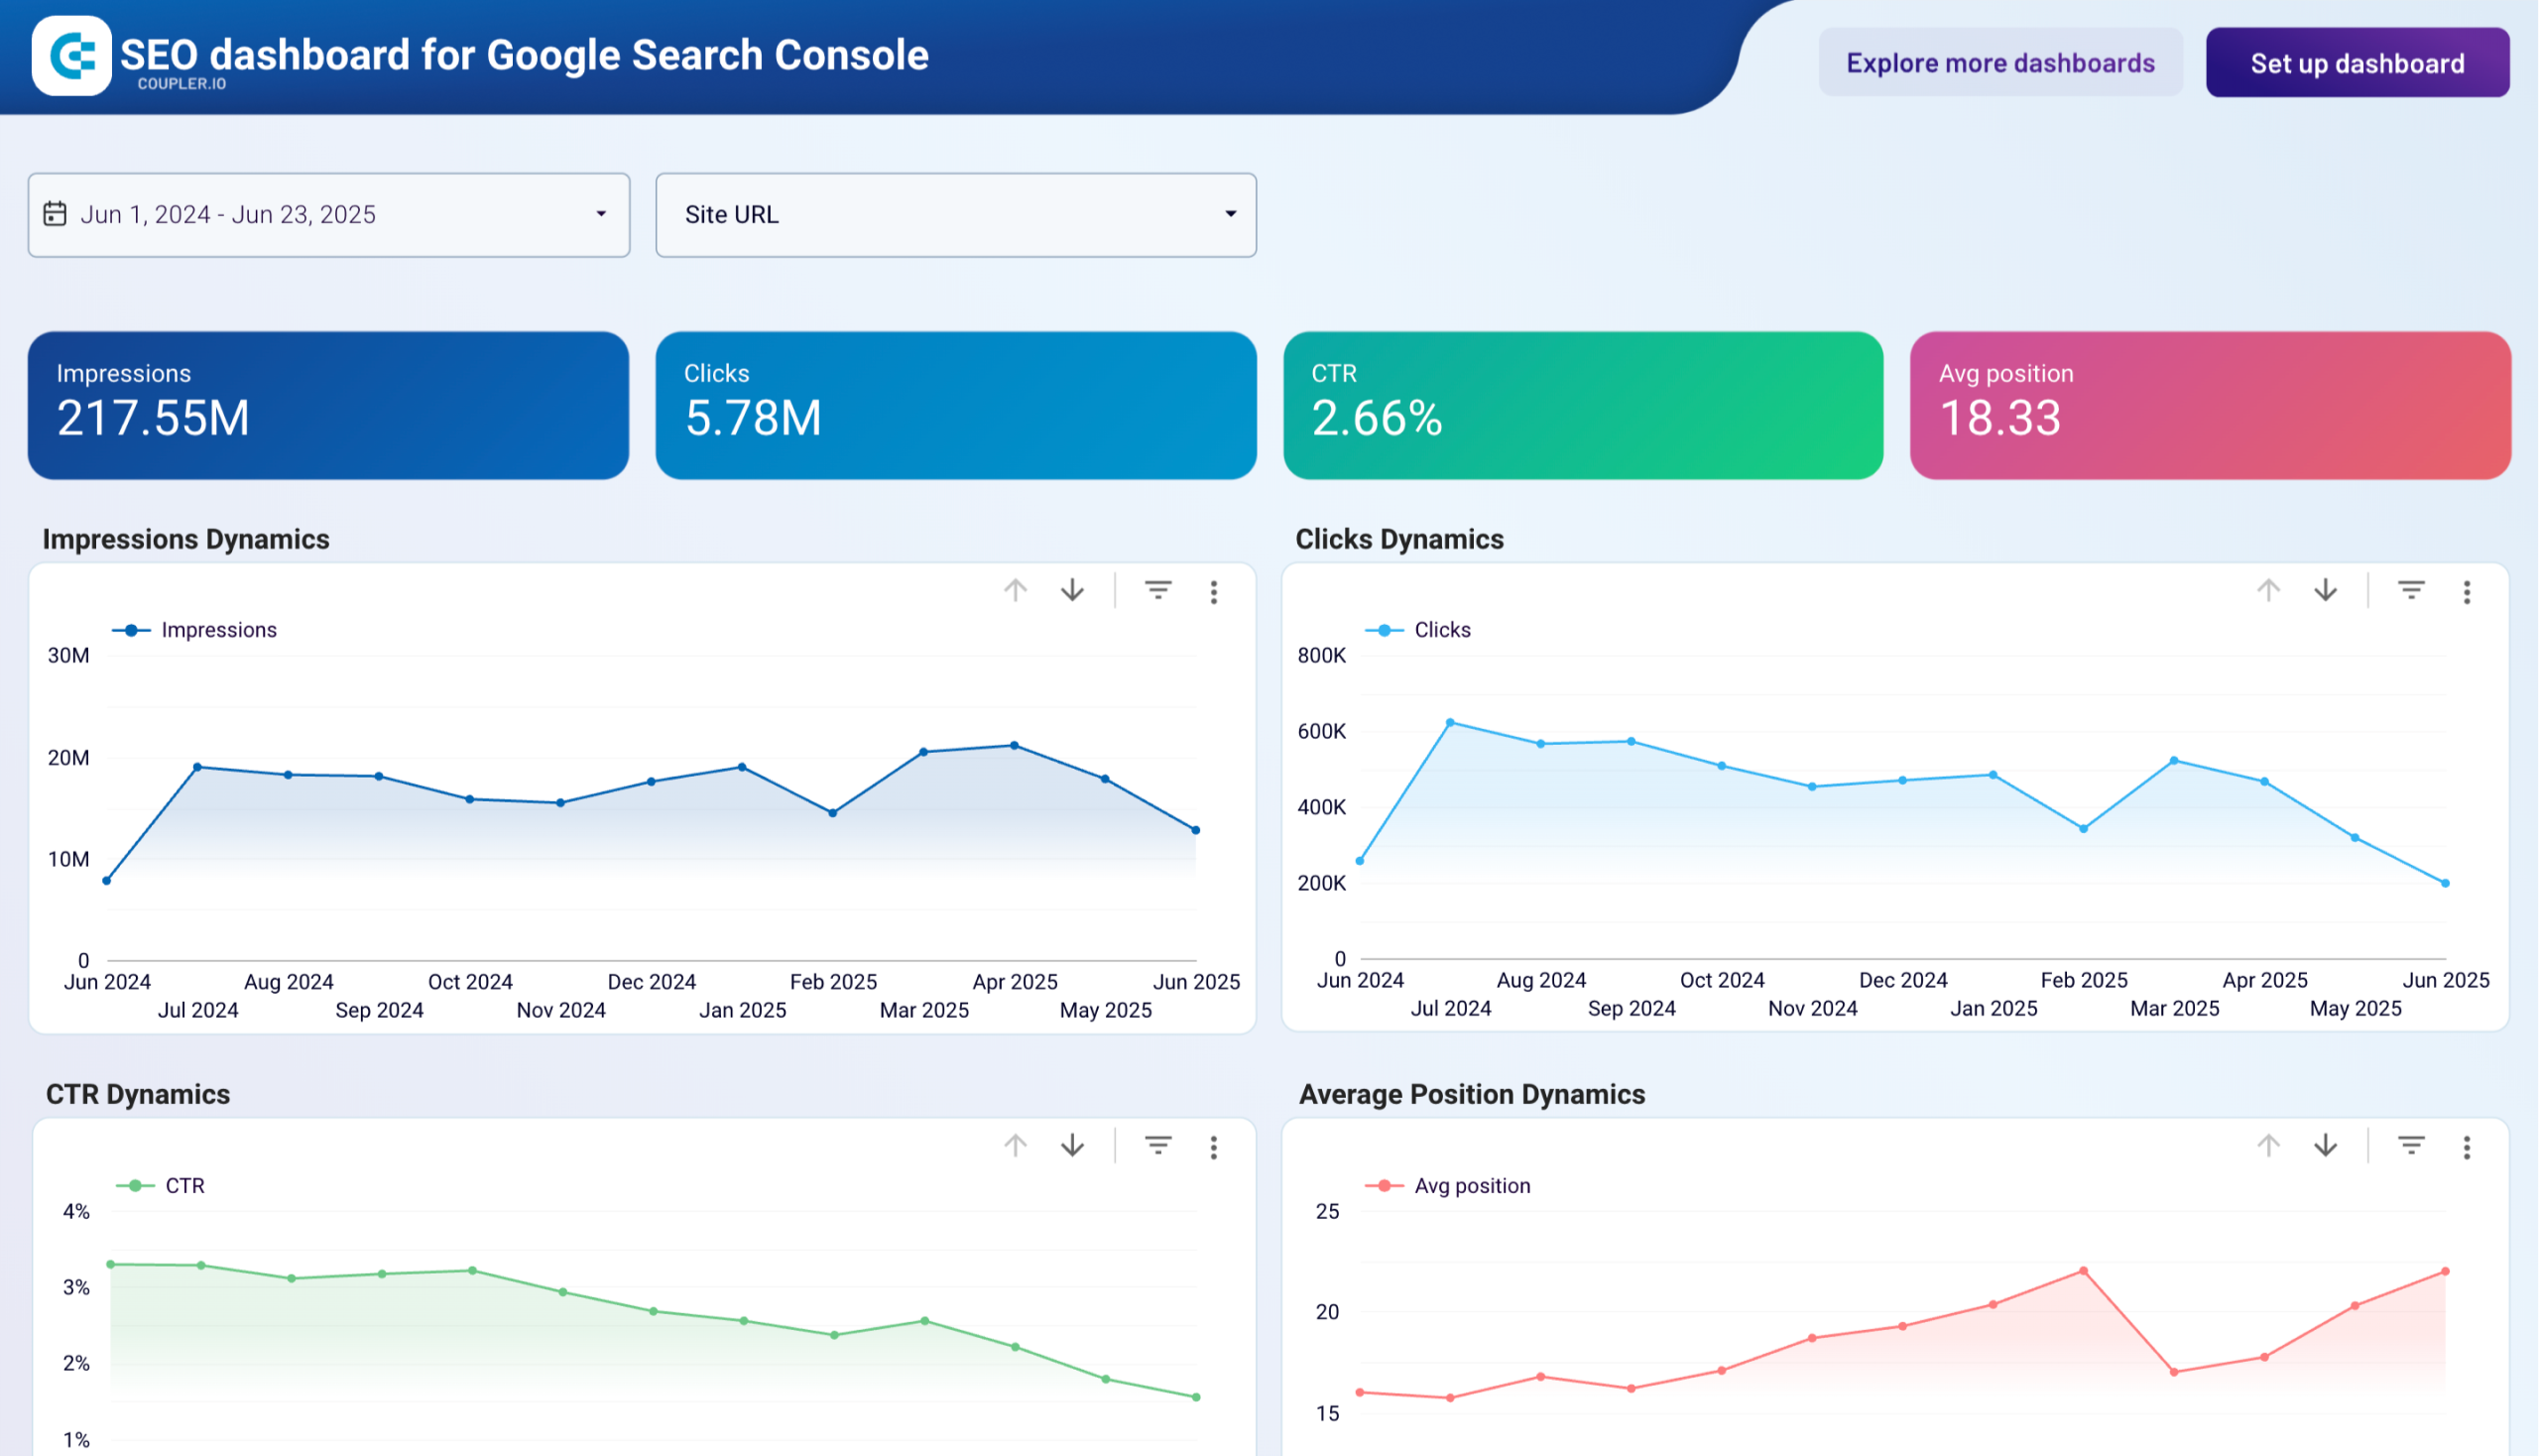
SEO dashboard for Google Search Console in Looker Studio
Optimize SEO with Looker Studio’s dashboard for Google Search Console. Track and enhance page rankings, CTRs, and organic traffic efficiently.
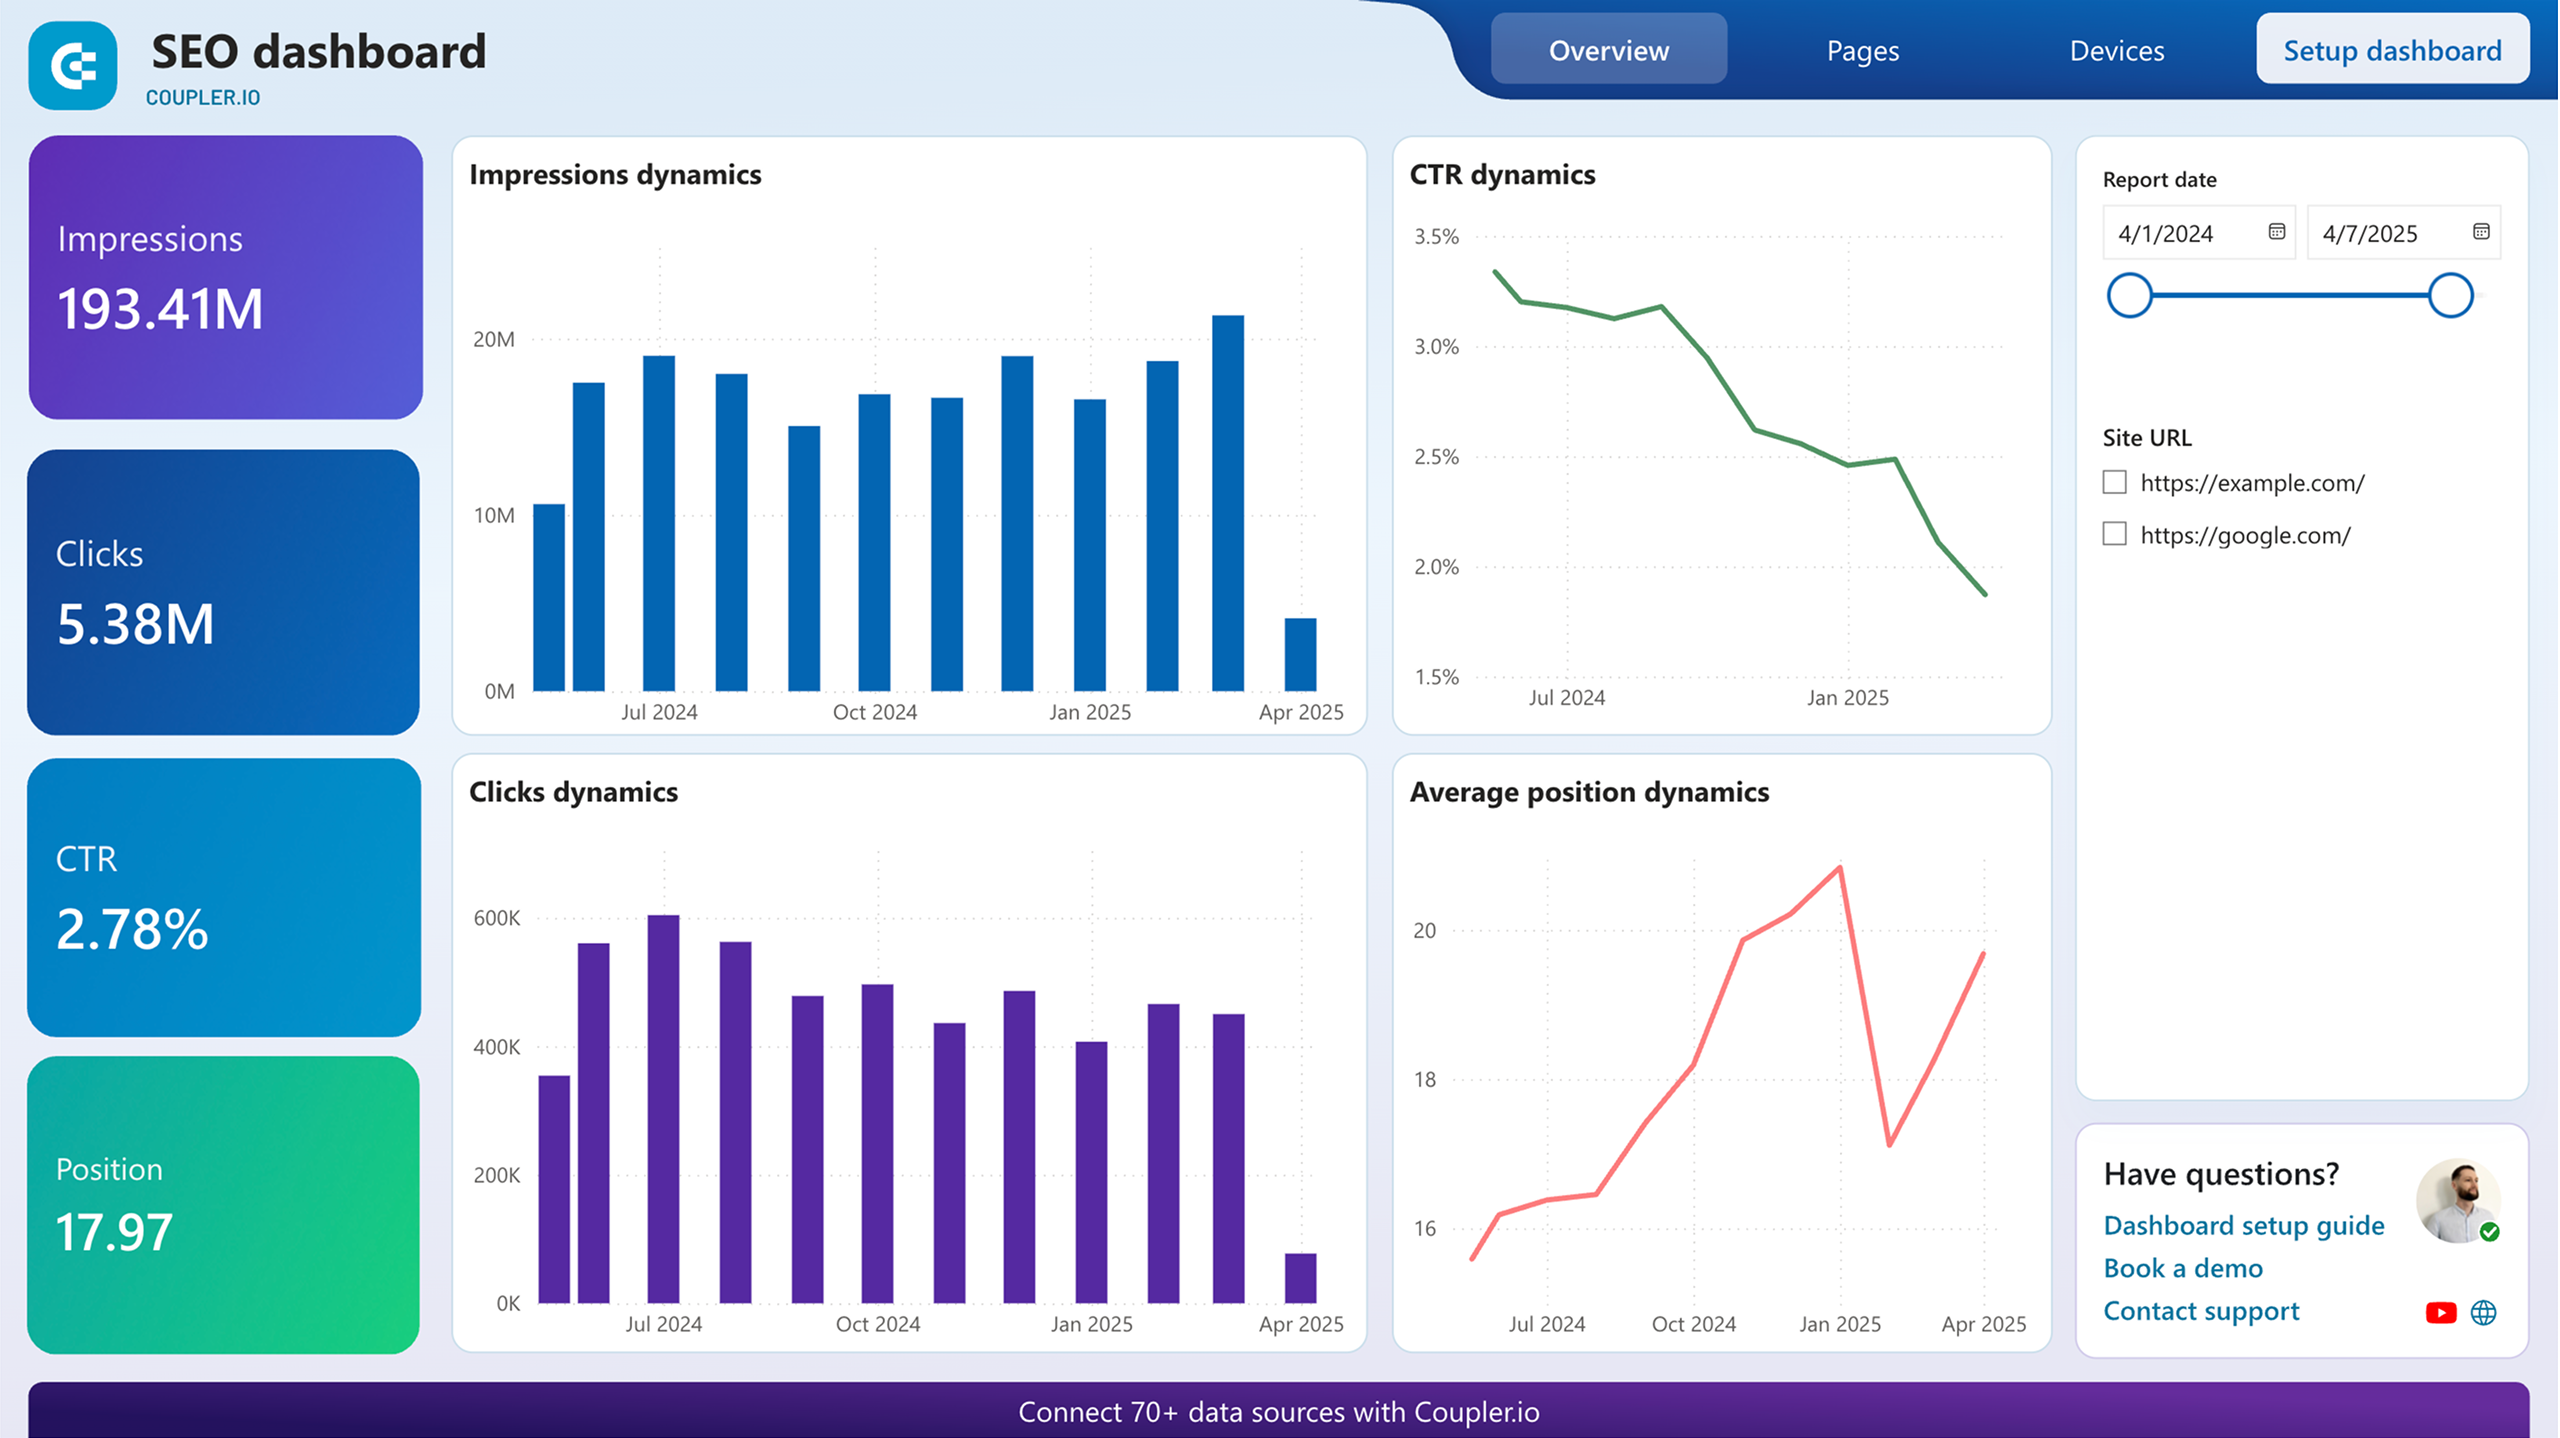
SEO dashboard for Google Search Console in Power BI
Optimize SEO with PowerBI’s dashboard for Google Search Console. Track page rankings, CTRs, and organic traffic efficiently.
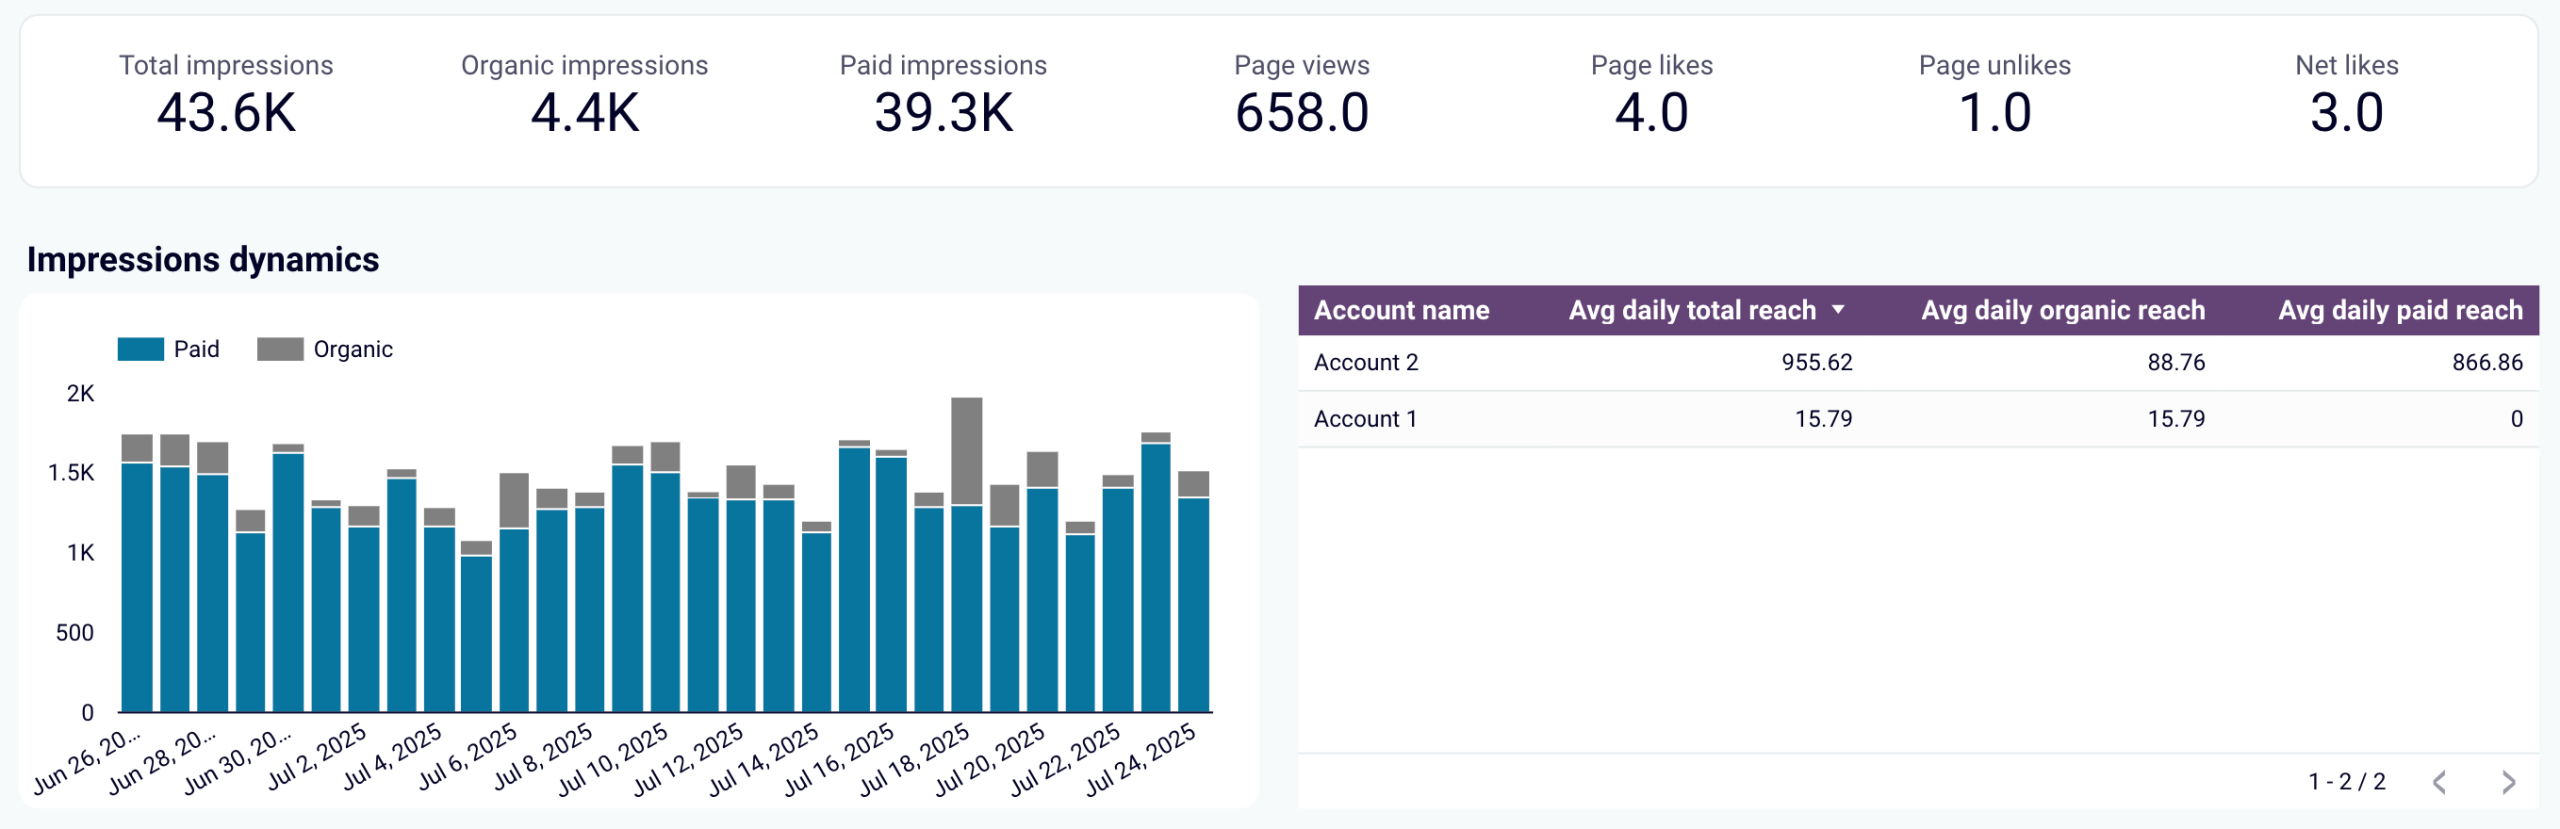
5. Meta engagement and reach analytics
Tracking how individual Facebook and Instagram posts perform can be tricky when engagement data is scattered or hard to compare. Without clear, detailed insights, it’s tough to know which types of posts connect best with your audience or which topics to focus on.
By setting up an ETL pipeline that collects engagement metrics for each post, you can organize this data in one place. This lets you easily see which posts get the most likes, comments, and shares. With this information, you can identify content that works well and adjust your strategy to create more of what your audience prefers.
Over time, this approach helps you spend your effort on posts that deliver better results and keeps improving your content based on actual performance.
Data source: Facebook Page Insights
Data transformations: Irrelevant columns are hidden to enhance report readability and relevance.
How to implement: You have two ways to work with Facebook post engagement data, depending on your needs. Using Coupler.io’s Facebook post engagement dataset template, you can extract detailed metrics for each post. This gives you raw, structured data you can analyze or combine with other sources.
To see your data visually, the Facebook Page Insights dashboard template provides an easy-to-use overview of post performance. It helps you quickly spot trends and compare content types.
You can set up this dashboard in Looker Studio. To do so, use the instructions you can find in the template’s Readme tab.
Facebook Page Insights dashboard
 Preview dashboard
Facebook Page Insights dashboard
Preview dashboard6. Exploring LinkedIn post engagement
LinkedIn doesn’t make it easy to compare how different post types – like image ads, video content, or sponsored posts – perform over time. Without organized data, it’s hard to know what’s working and where to adjust your strategy.
Through an ETL pipeline, you can pull post performance data from LinkedIn and organize it by ad type and date. This allows you to track key engagement metrics – such as clicks, impressions, and reactions – over time.
With this view, you can easily compare formats, identify trends, and refine your social media content strategy based on actual performance.
Data source: LinkedIn company pages
Data transformations: Unnecessary columns are hidden. Key performance metrics are aggregated into weekly and monthly views.
How to implement: The LinkedIn engagement metrics for social media posts dataset template lets you extract detailed metrics like clicks, impressions, and reactions for each post. This raw data is great for deep analysis, combining with other data sources, or building custom reports.
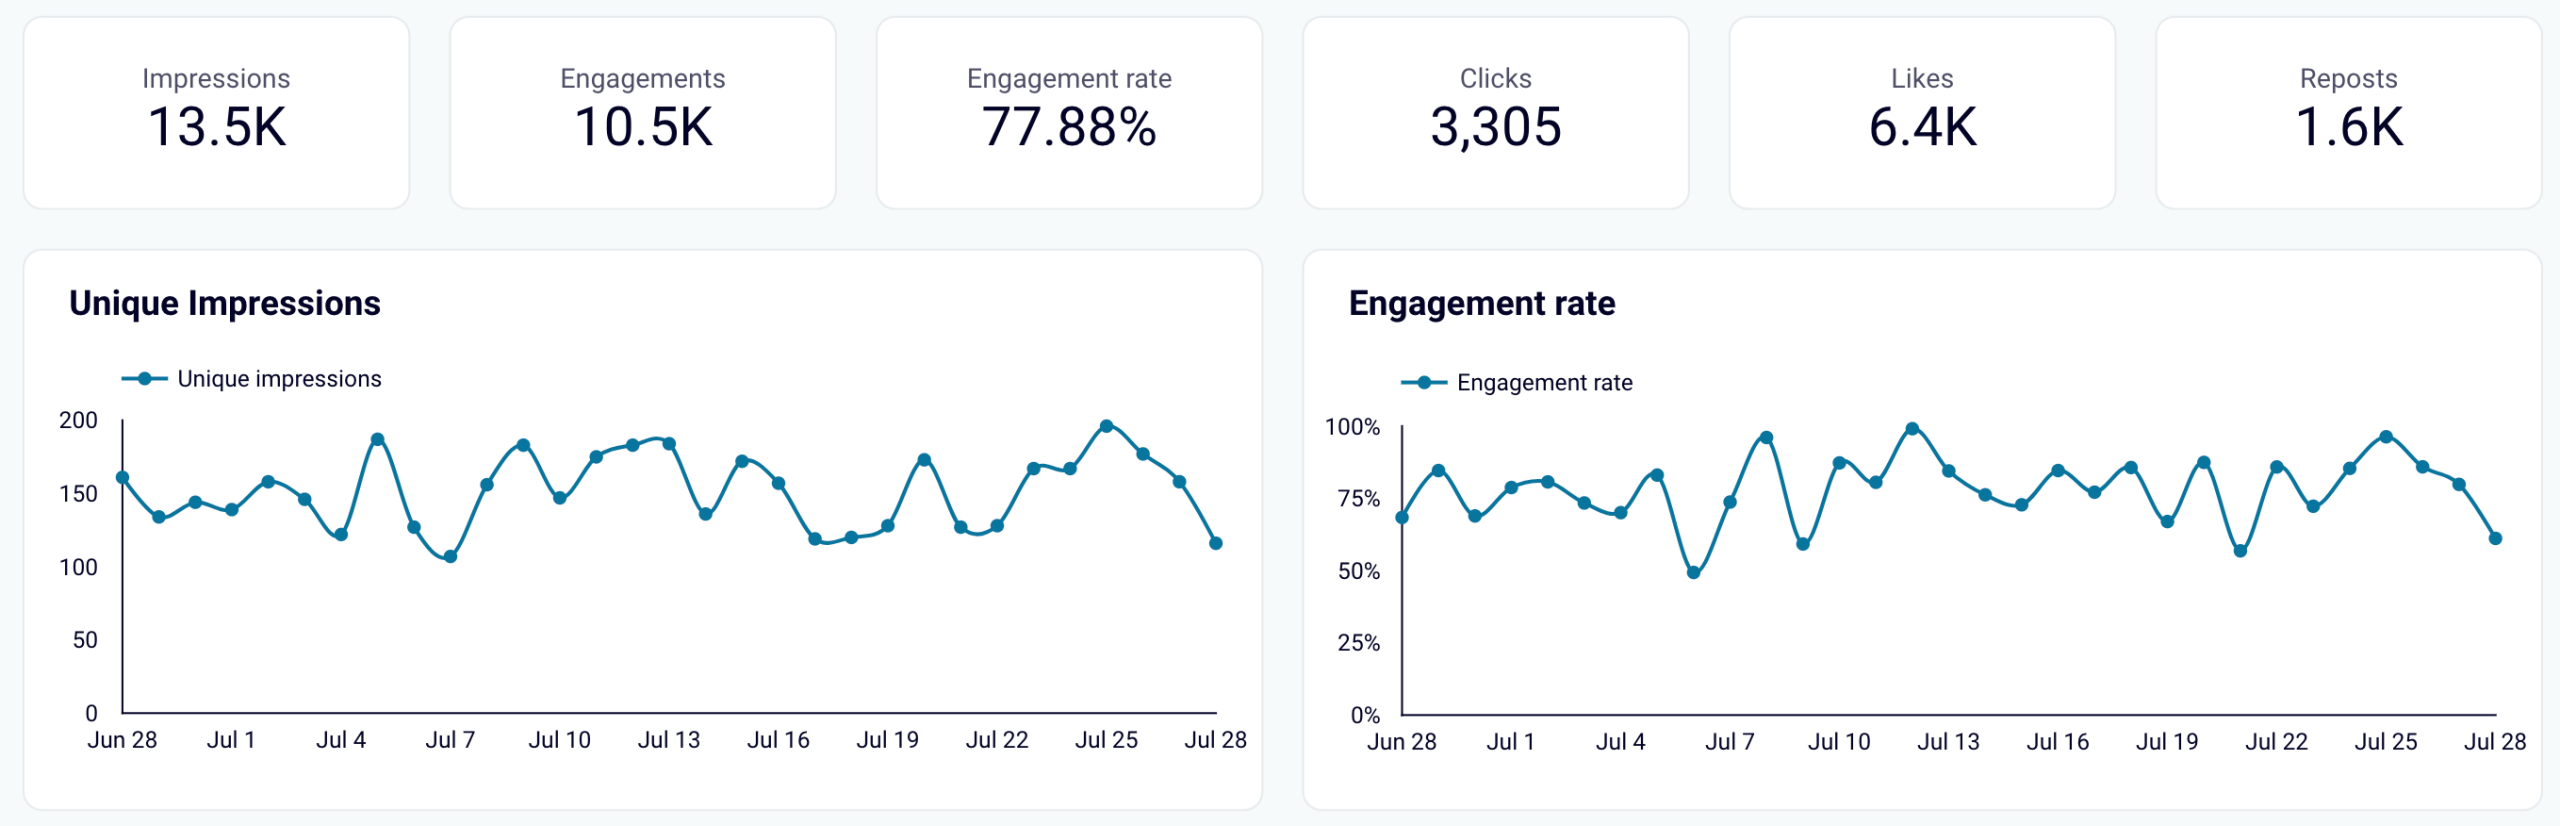
For a visual summary of your data, the LinkedIn company page performance dashboard provides ready-made charts and tables that help you quickly spot engagement trends by post type and over time.
You can set up this dashboard in Looker Studio by following the Readme instructions inside the template.
LinkedIn company page performance dashboard
 Preview dashboard
LinkedIn company page performance dashboard
Preview dashboard7. Estimating your sales efforts
In HubSpot, deal and contact data are often stored in separate views. This makes it harder to get a complete picture of your sales pipeline, track deal progress, forecast revenue, or understand which opportunities are most likely to close.
An ETL pipeline helps by bringing sales and customer data together. You can track deal stages, amounts, and statuses, and connect that data with contact details to see who’s behind each opportunity.
With everything unified, it becomes easier to spot pipeline bottlenecks, estimate revenue more accurately, and tailor your outreach based on real customer insights. This leads to smarter decisions and a more focused sales process.
Data source: HubSpot
Data transformations: Deals, contacts, and companies’ data are unified, aligning rows based on shared columns. There are a few aggregated views to show deals with associated contacts.
How to implement: Coupler.io’s HubSpot Deals with Contacts and Companies dataset template helps you extract deal data alongside key contact and company details. This makes it easier to analyze deal stages, track sales progress, and connect pipeline activity to specific people or organizations.
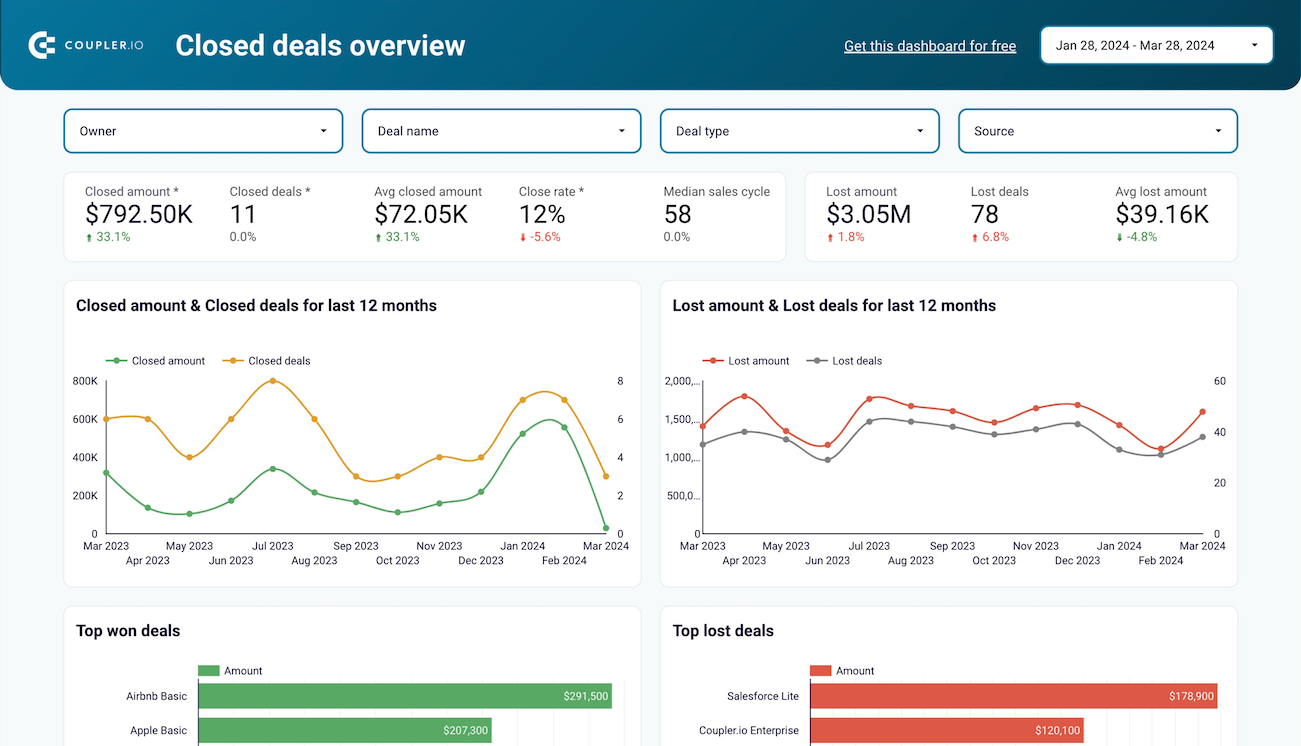
For a faster way to interpret your data, the HubSpot sales KPI dashboard template visualizes deal flow, status breakdowns, and contact-level insights. It’s ideal for monitoring pipeline health, spotting stuck deals, and sharing clear reports with your team – no manual setup required.
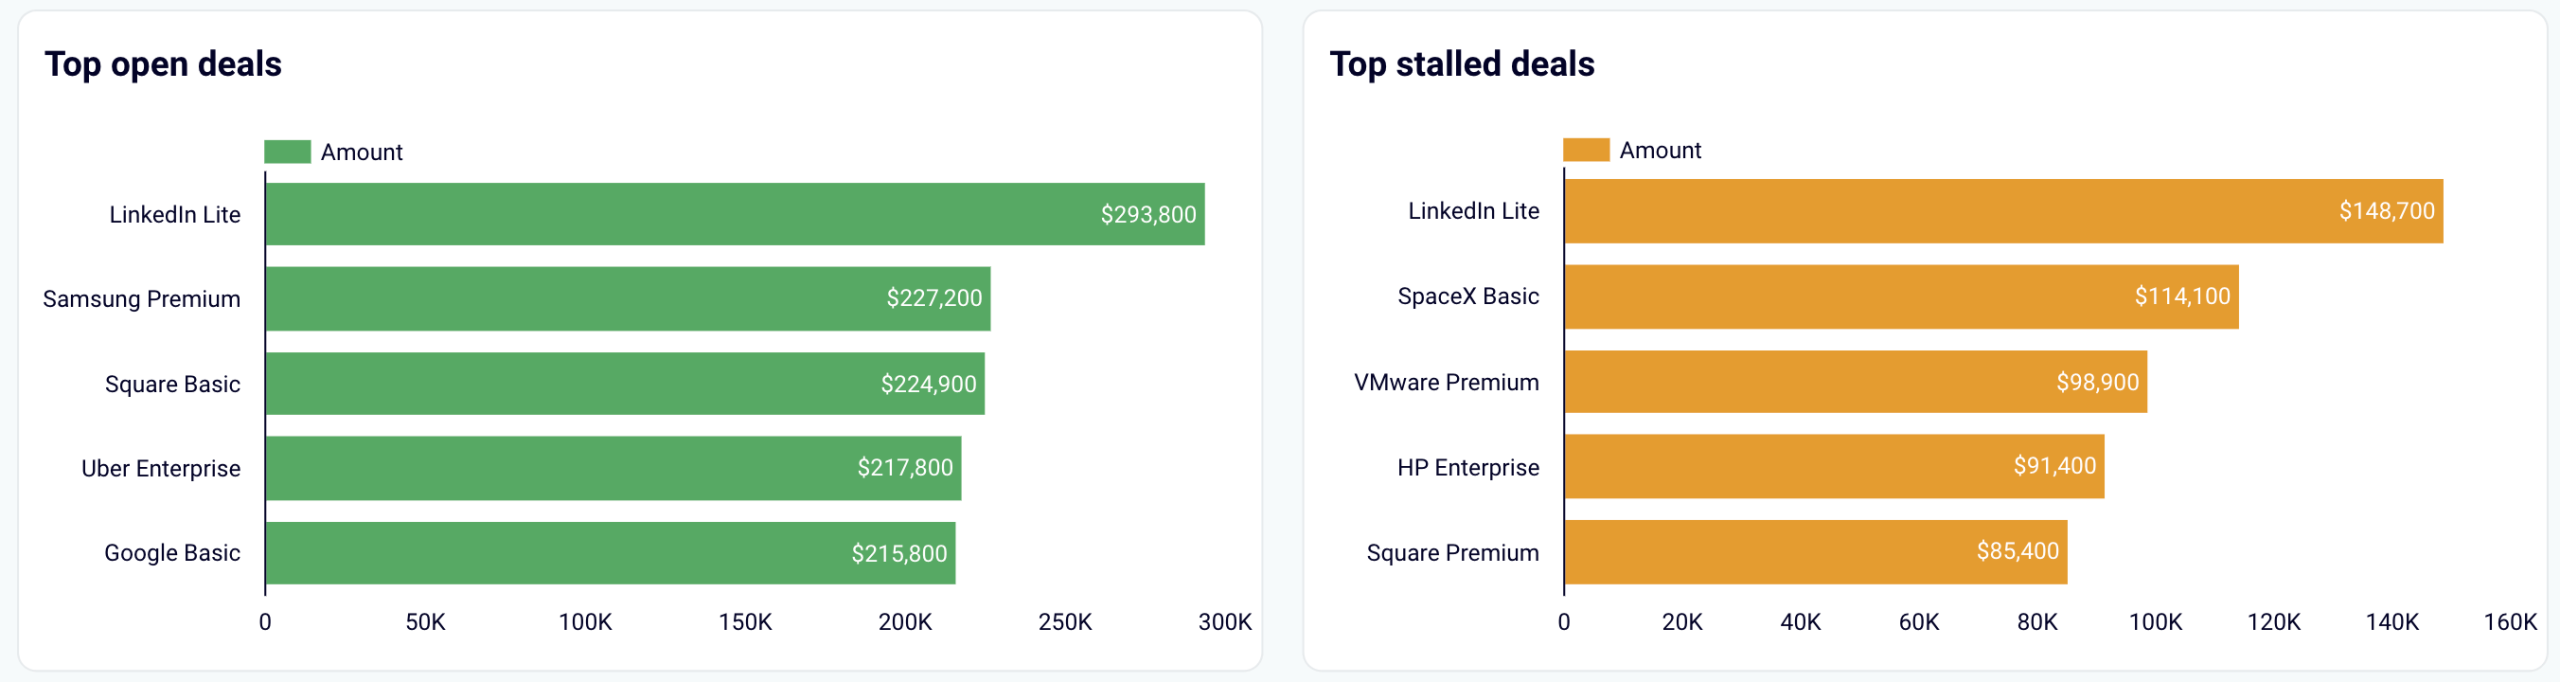
The dashboard is available in Looker Studio for HubSpot, as well as Pipedrive and GoHighLevel. Just visit the Readme tab inside the template and learn how to set up the dashboard for your needs.
Sales KPI dashboard for HubSpot in Looker Studio
Get an overview of the HubSpot sales metrics and KPIs to derive insights into pipeline health using our sales KPI dashboard.

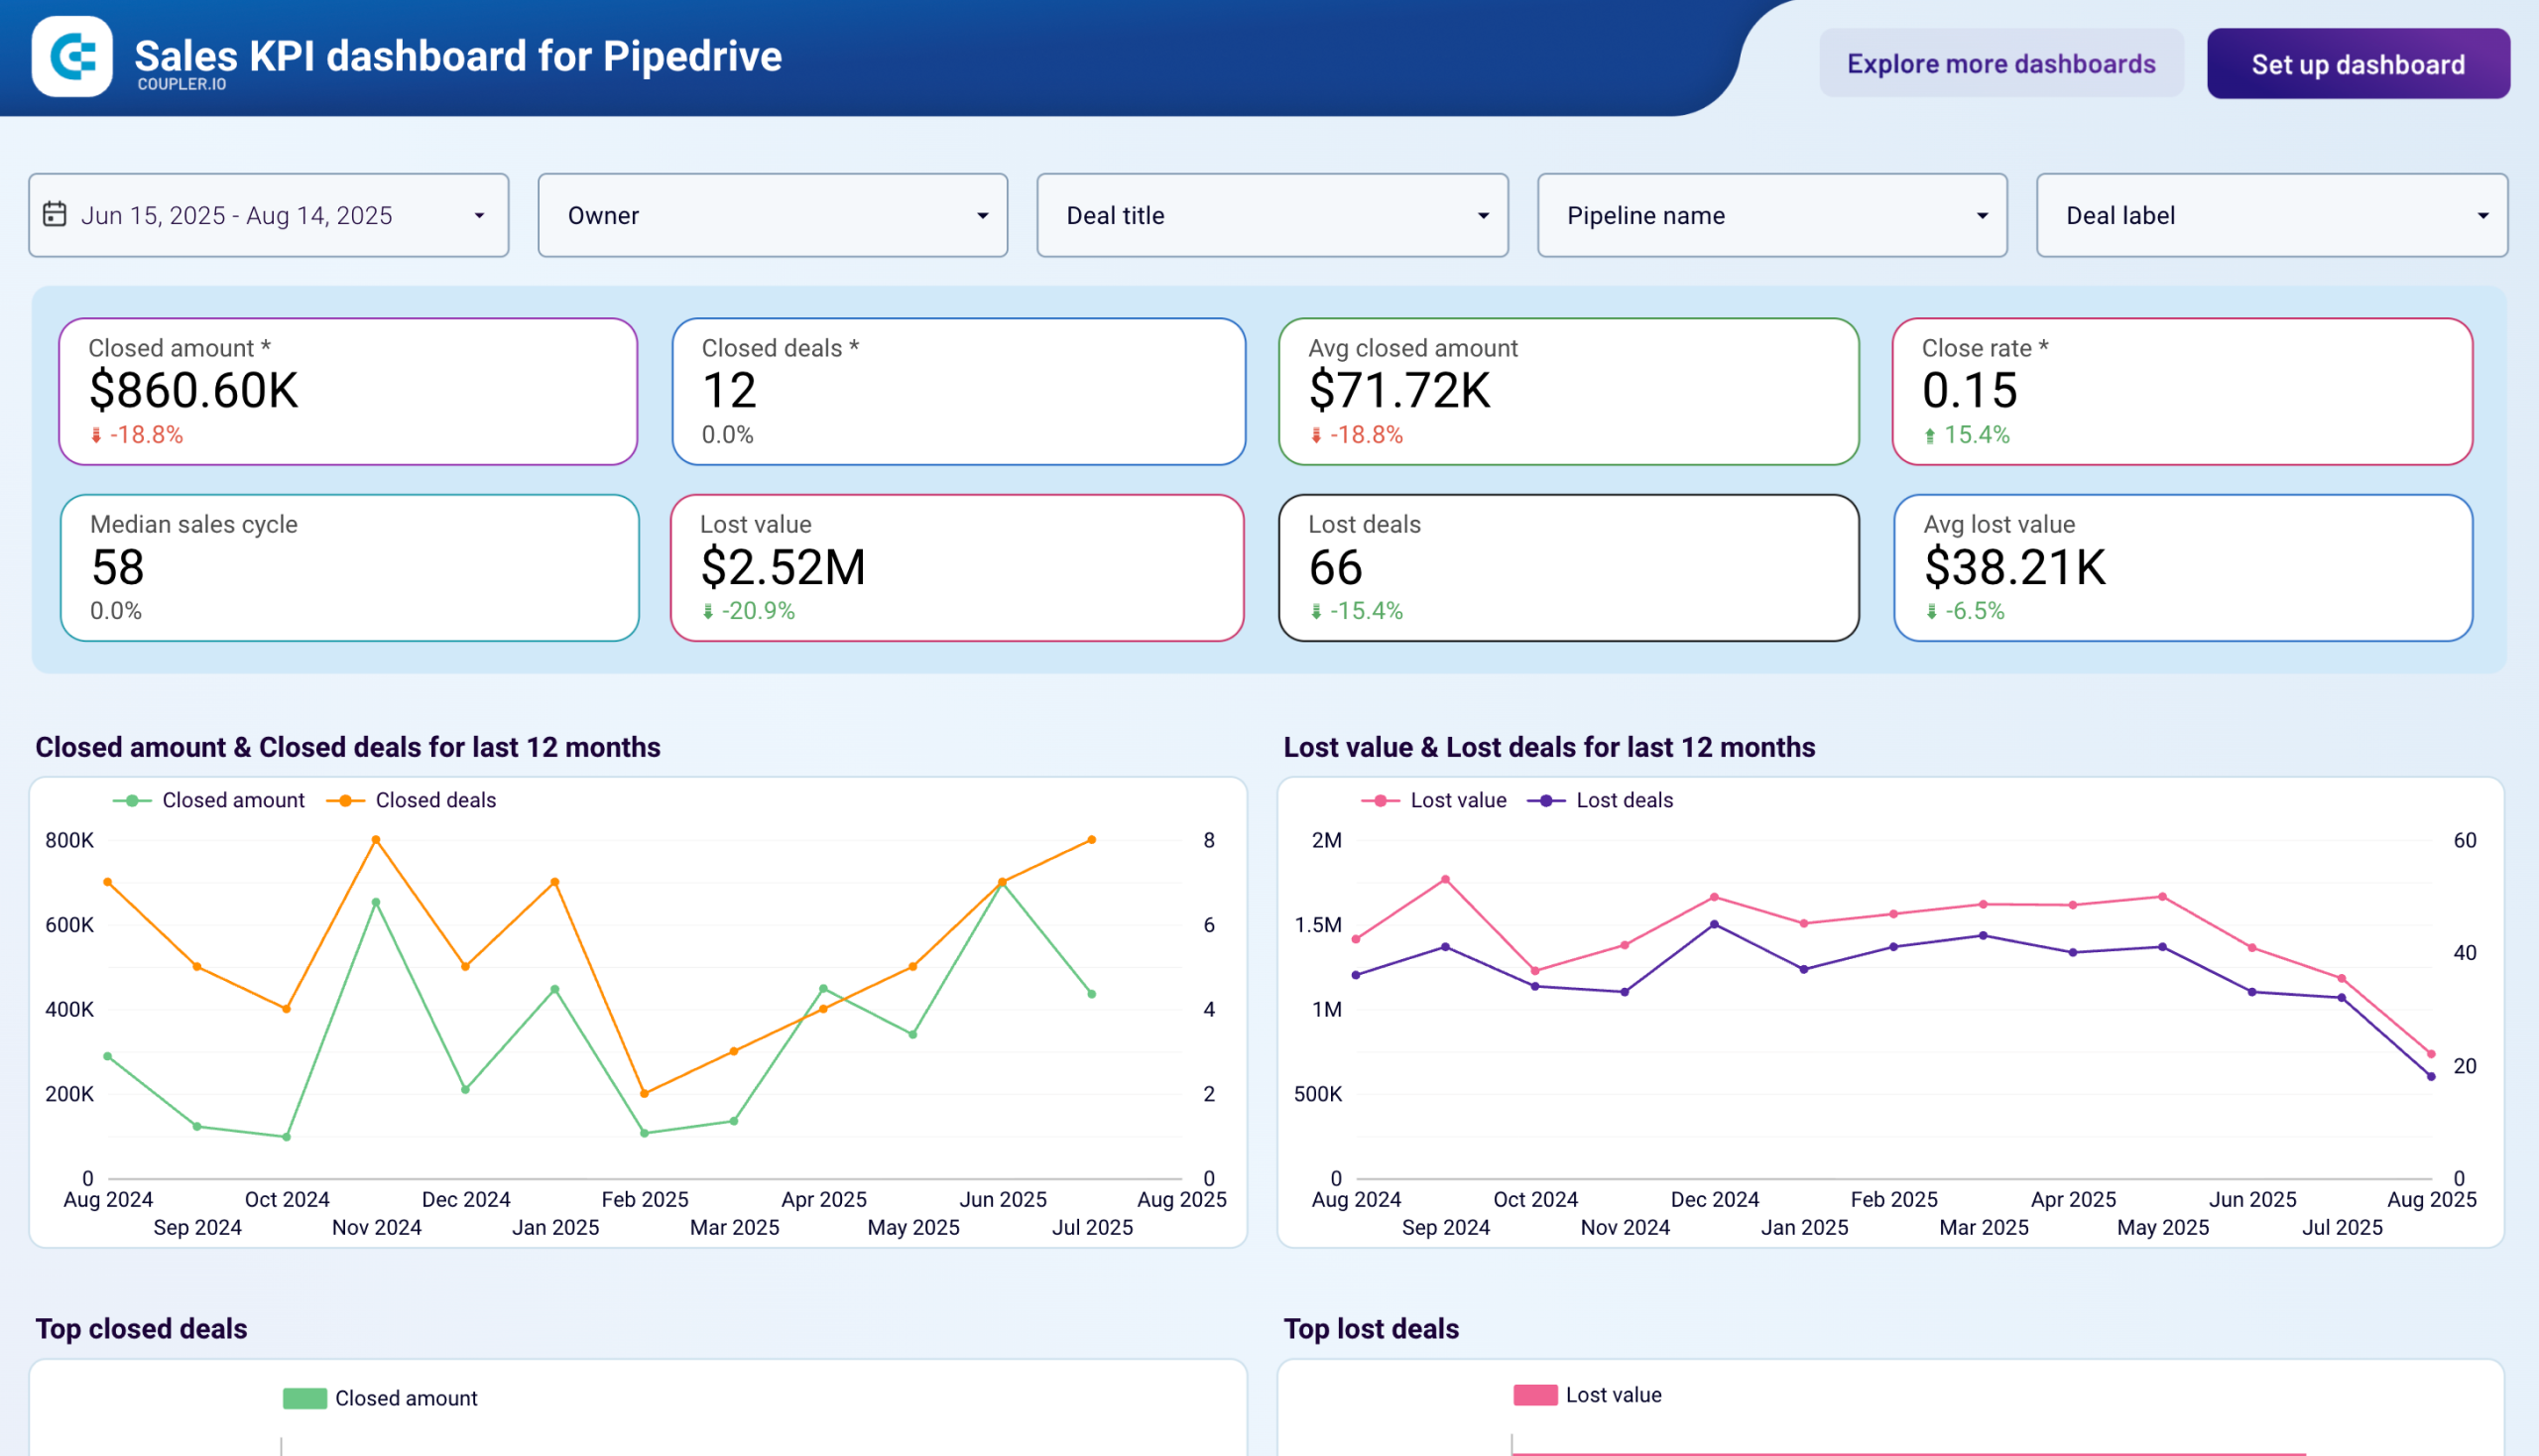
Sales KPI dashboard for Pipedrive in Looker Studio
Analyze the critical sales metrics and key performance indicators from Pipedrive to make smart strategic decisions.

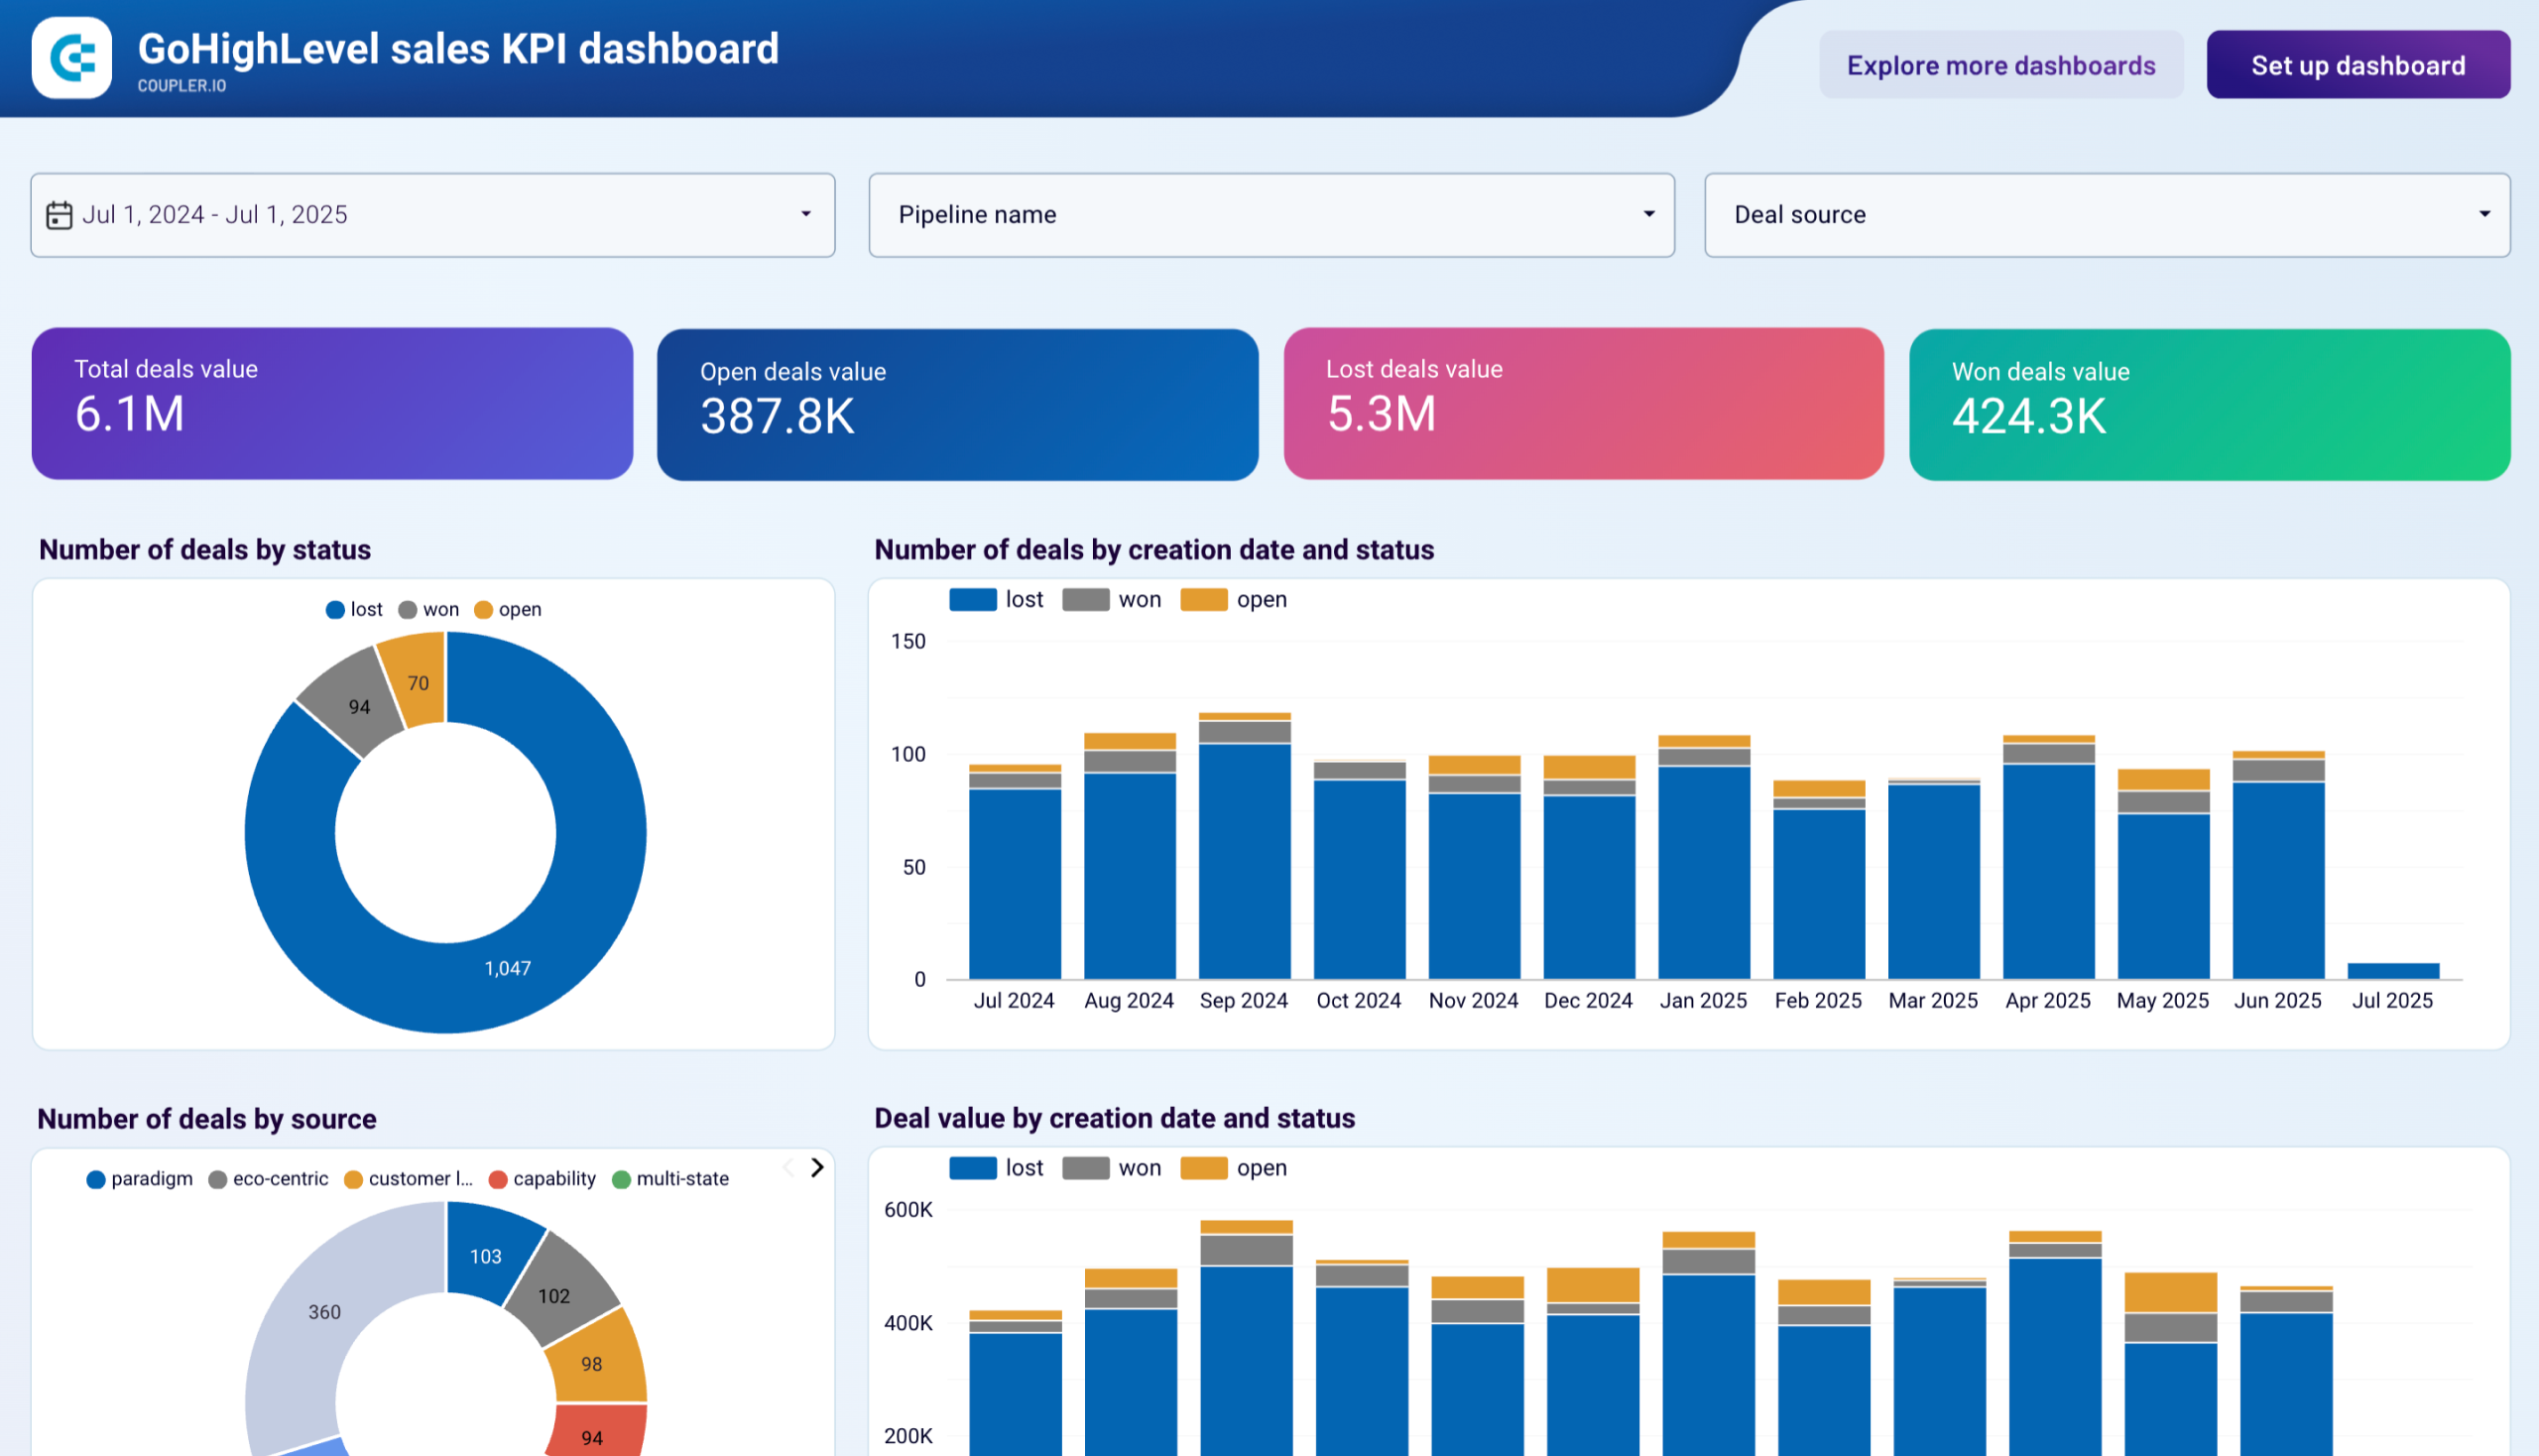
GoHighLevel sales KPI dashboard in Looker Studio
Evaluate sales team performance and pipeline health with key metrics on deal progression, revenue trends, and conversion rates to identify best practices and optimize your sales process.

8. Financial performance reporting
QuickBooks shows revenue and expense data, but it’s not easy to track financial performance over time or calculate key profitability metrics in one place. It’s especially challenging if you need to break down transactions by category, period, or business unit.
By setting up an ETL pipeline to pull your financial data out of QuickBooks, you can organize transaction details into a structured format. This gives you a clear view of income and expenses across different time periods and categories.
This helps you monitor financial health and compare actuals against targets based on real-time numbers.
Data source: QuickBooks
Data transformations: A few custom metrics are created and only the relevant columns are kept.
How to implement: Coupler.io’s QuickBooks P&L Annual dataset template lets you extract detailed revenue and expense records, broken down by category and time period. It’s useful for building custom reports, running calculations like gross or net profit, and aligning financial data with other business metrics.
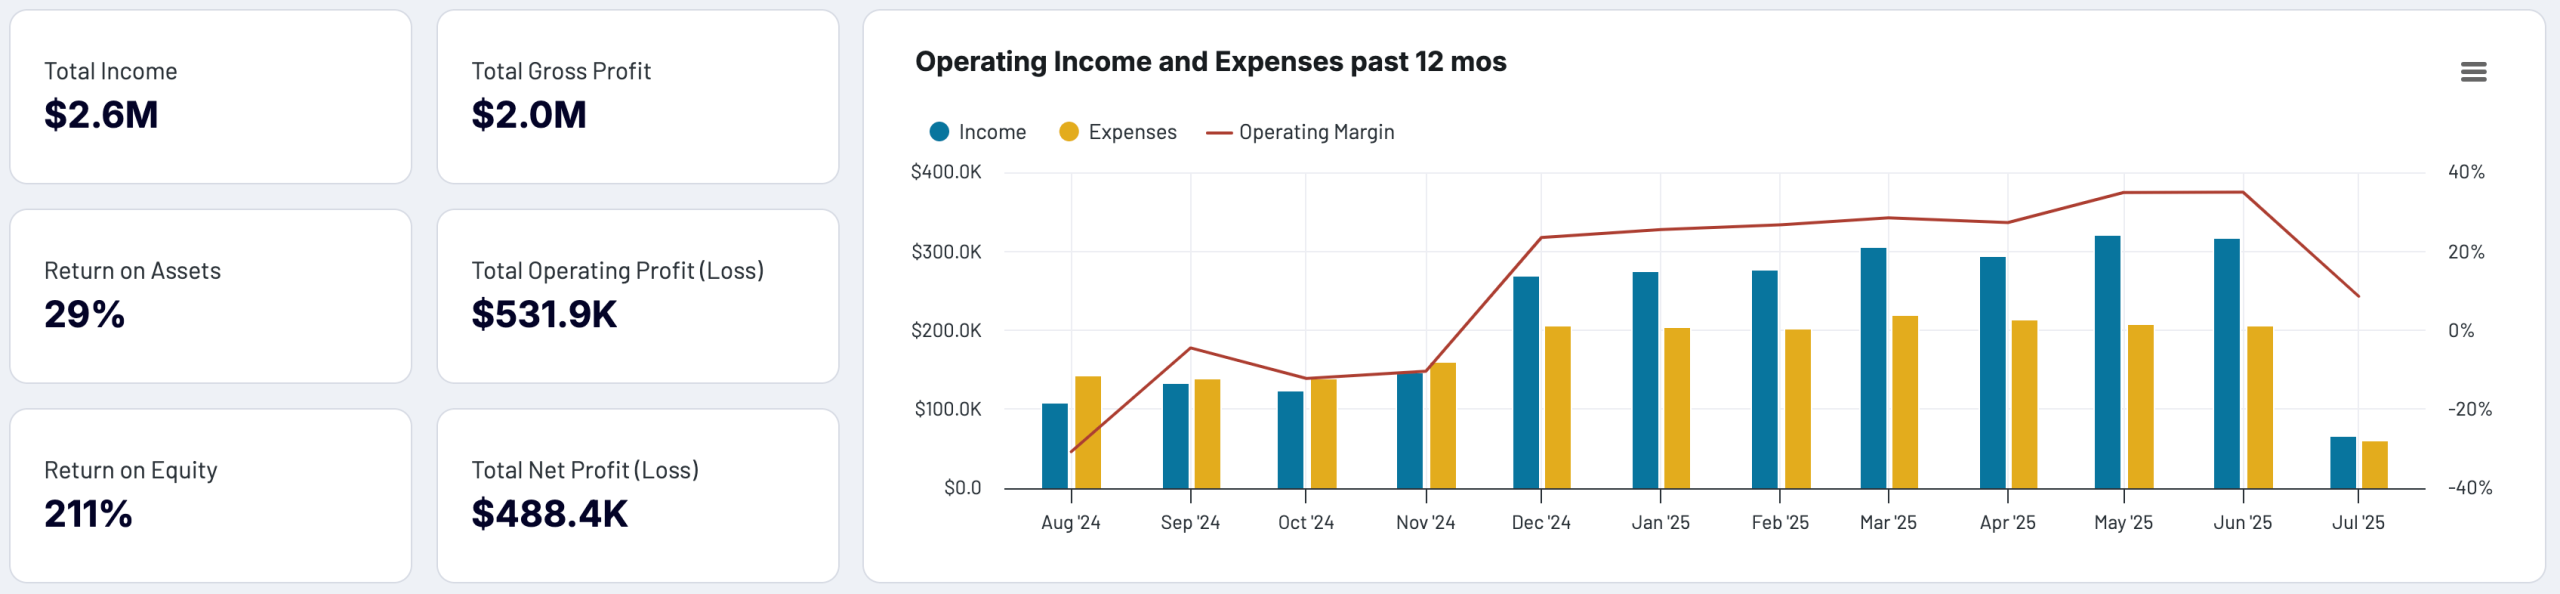
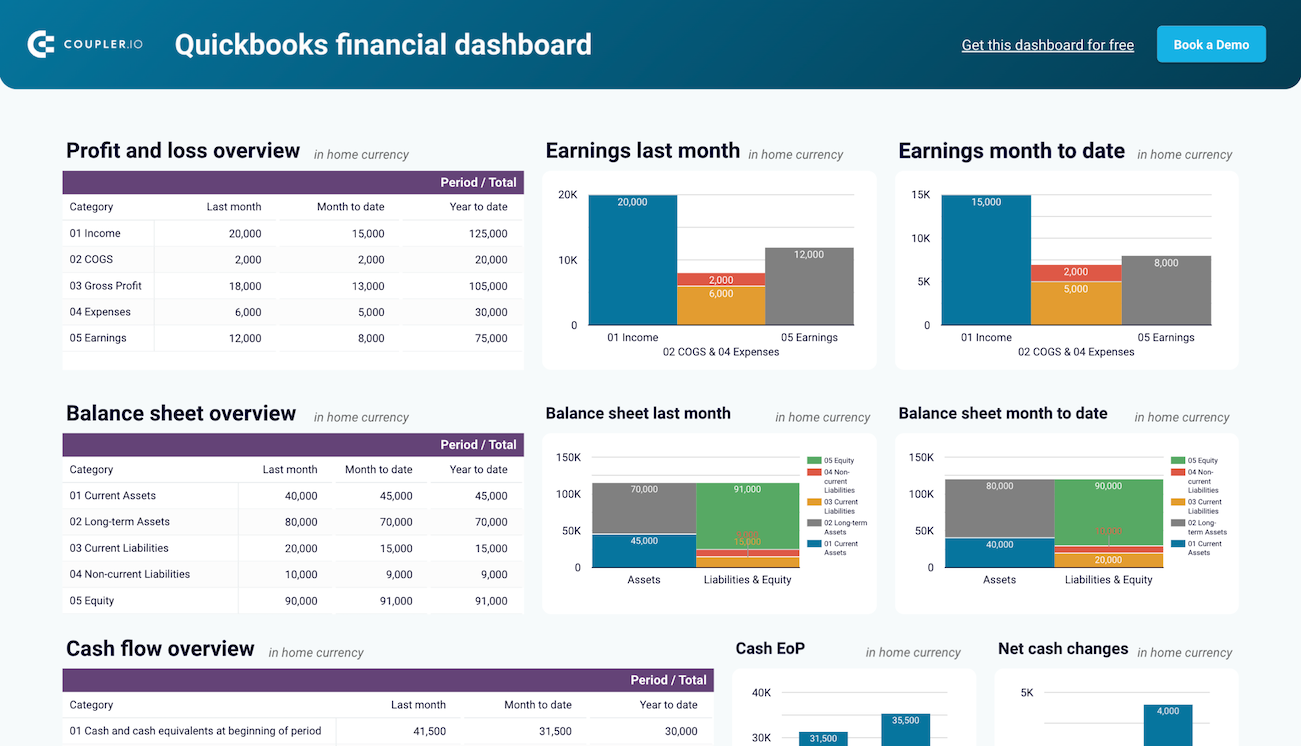
If you want to skip manual setup and go straight to insights, the QuickBooks financial dashboard gives you a visual breakdown of your profit and loss performance. It’s ideal for tracking trends, reviewing financial KPIs, and presenting data to stakeholders in a clear, digestible format.
This is available as a dashboard in Coupler.io or alternatively as a template for Google Sheets and Looker Studio. In the latter case, you need to find setup instructions in the template’s Readme tab.
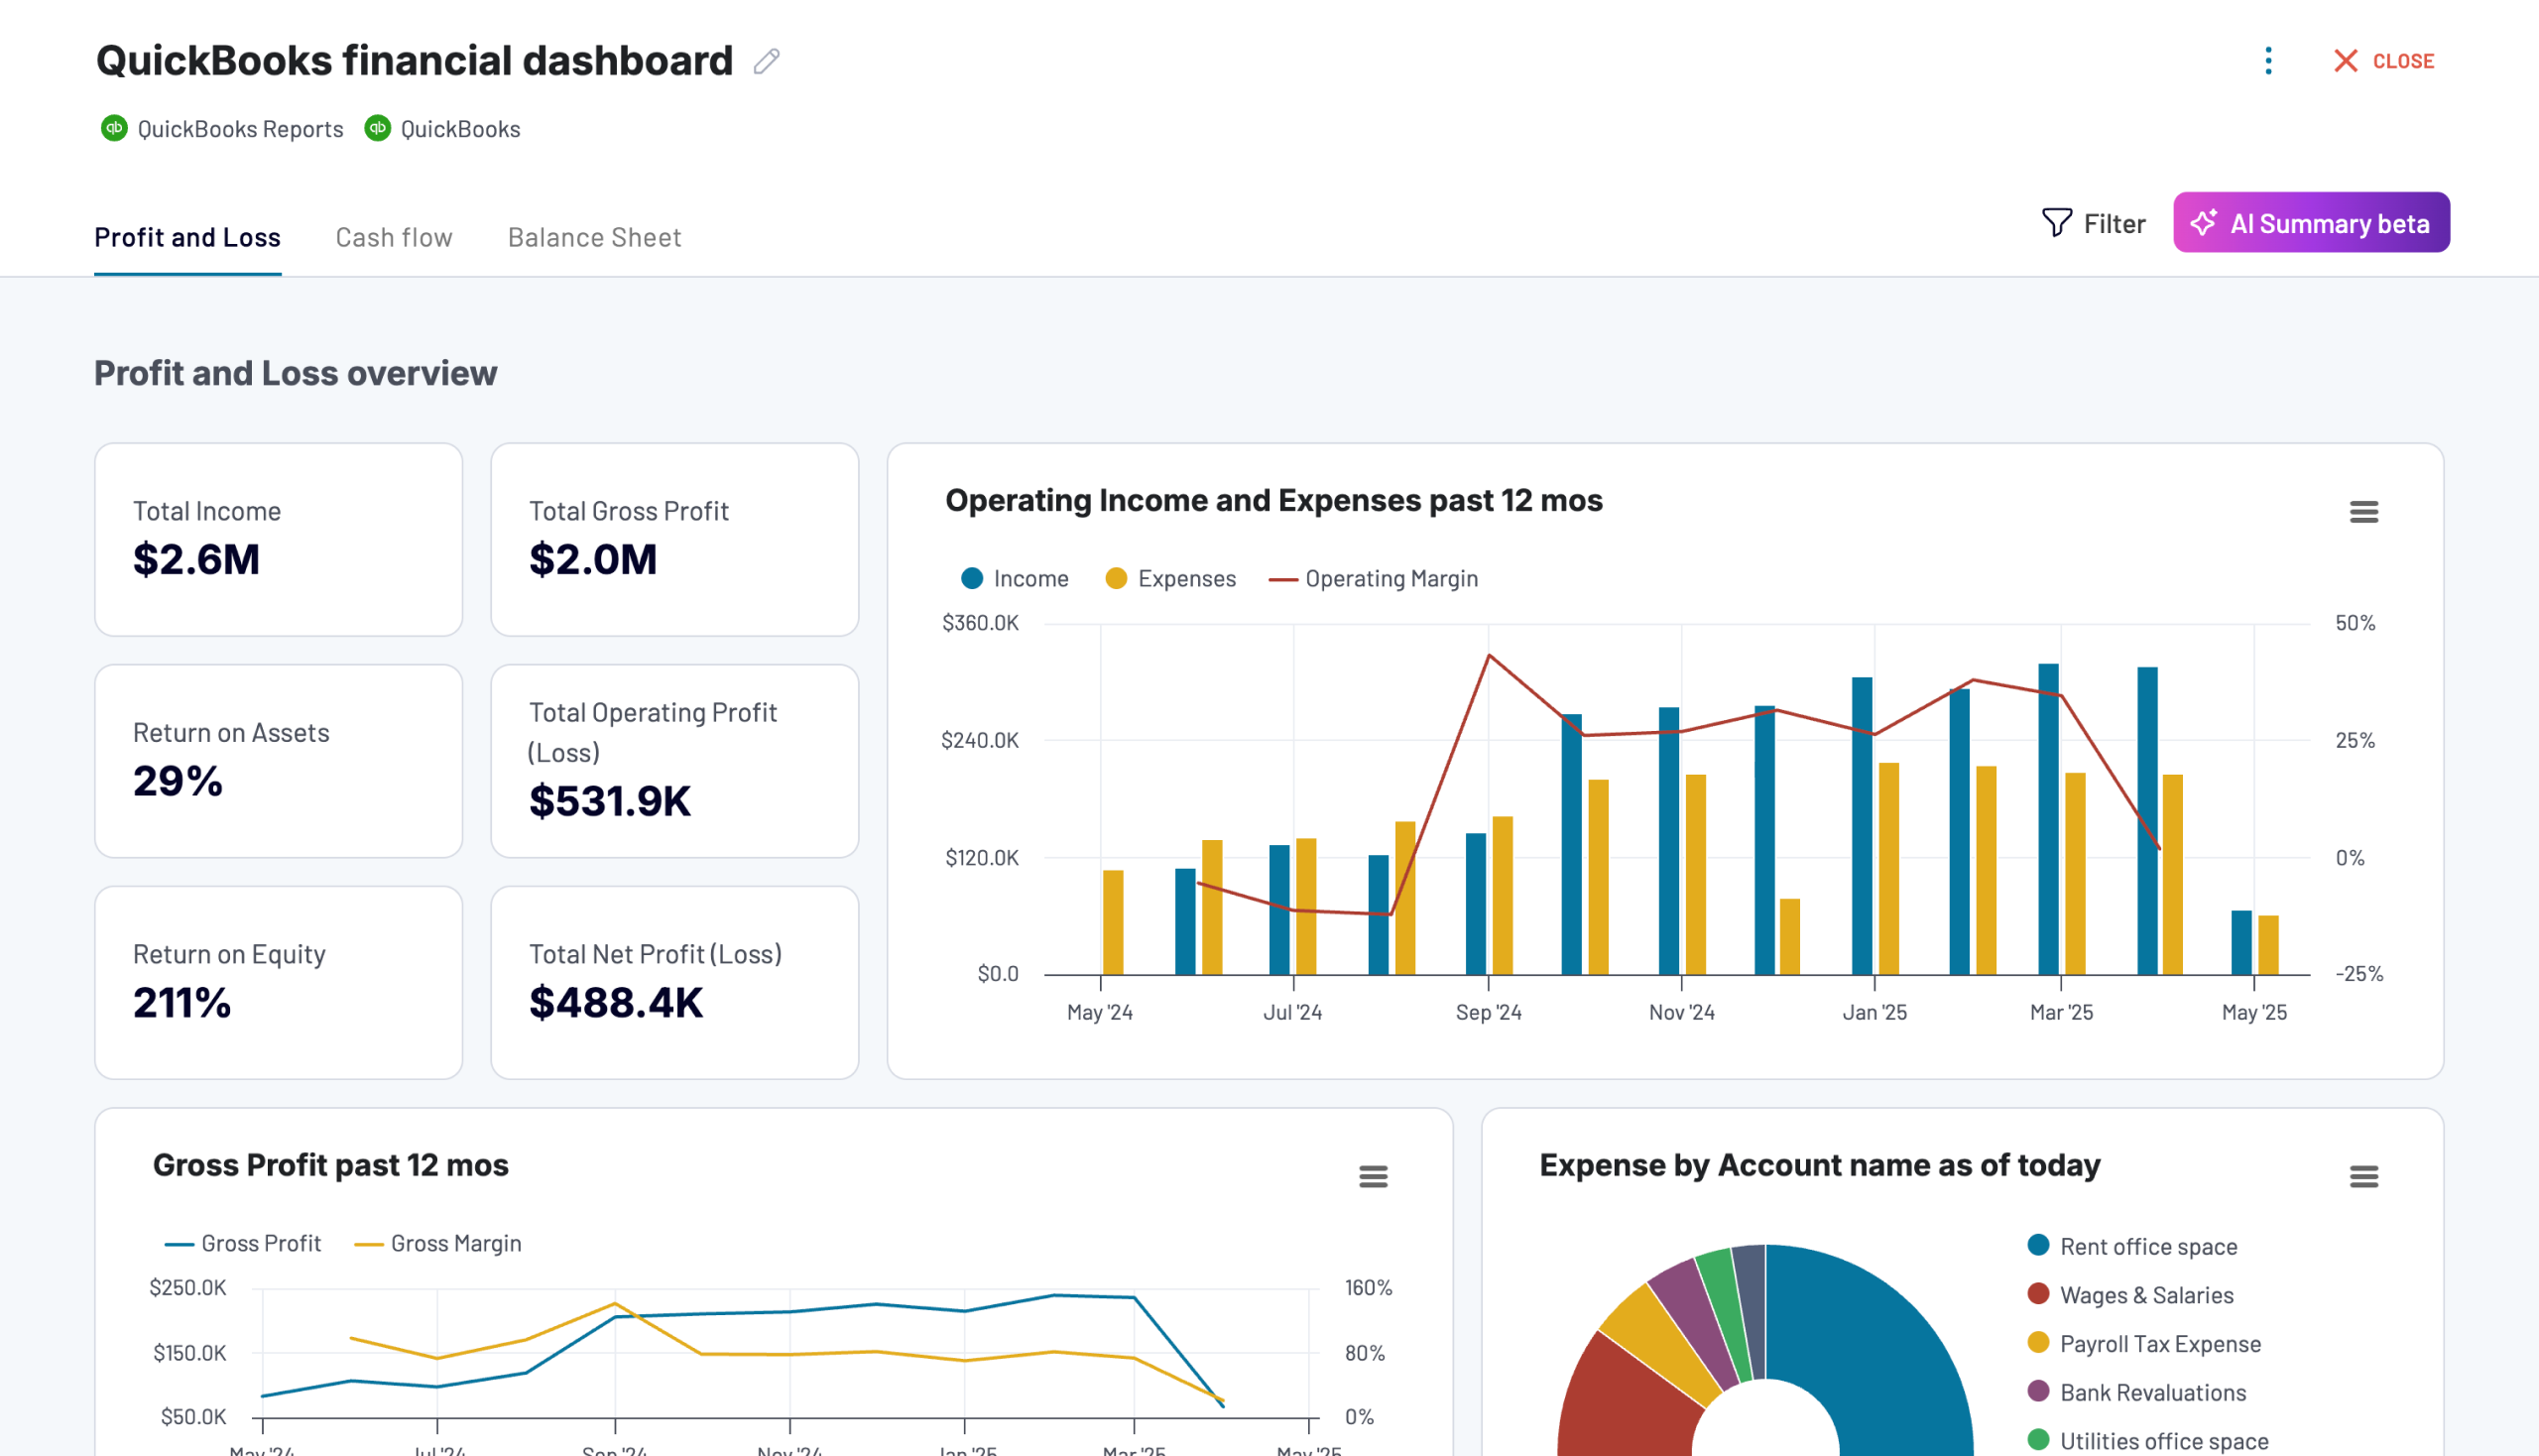
QuickBooks financial dashboard
Tracks earnings, monitor cash flow, and analyze balance sheet changes with a dedicated dashboard that provides a clear picture of your business finances.

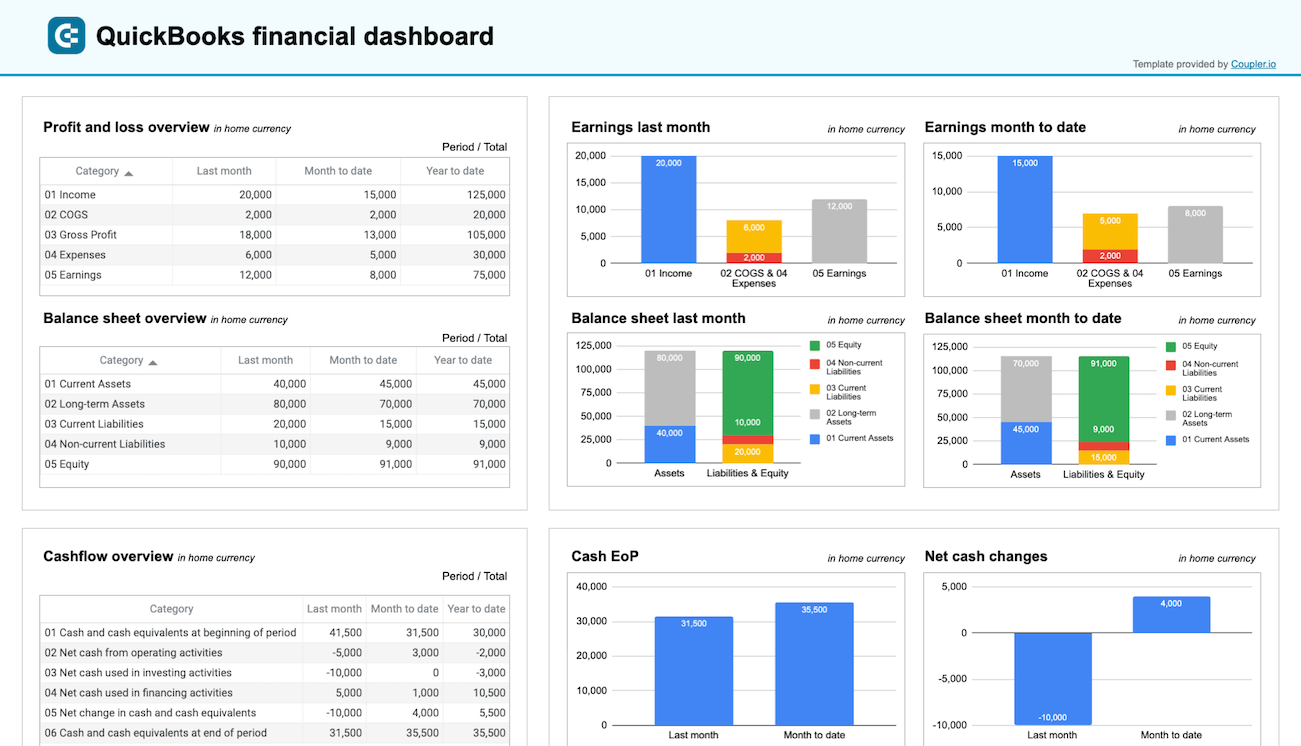
QuickBooks financial dashboard in Google Sheets
Get a clear snapshot of your business finances, including cash flow, P&L, balance sheets, and bank accounts, powered by data from QuickBooks Online.
Quickbooks financial dashboard in Looker Studio
Monitor and analyze your business’s financial health with real-time insights into profit and loss, balance sheet, cash flow, and bank & cash accounts.
9. Summing up your business’s bank activity
Xero shows cash flow and bank activity, but it’s not easy to analyze that data across different time periods or accounts. You might need to jump between reports to understand where money is coming in, where it’s going out, or how your balances are changing.
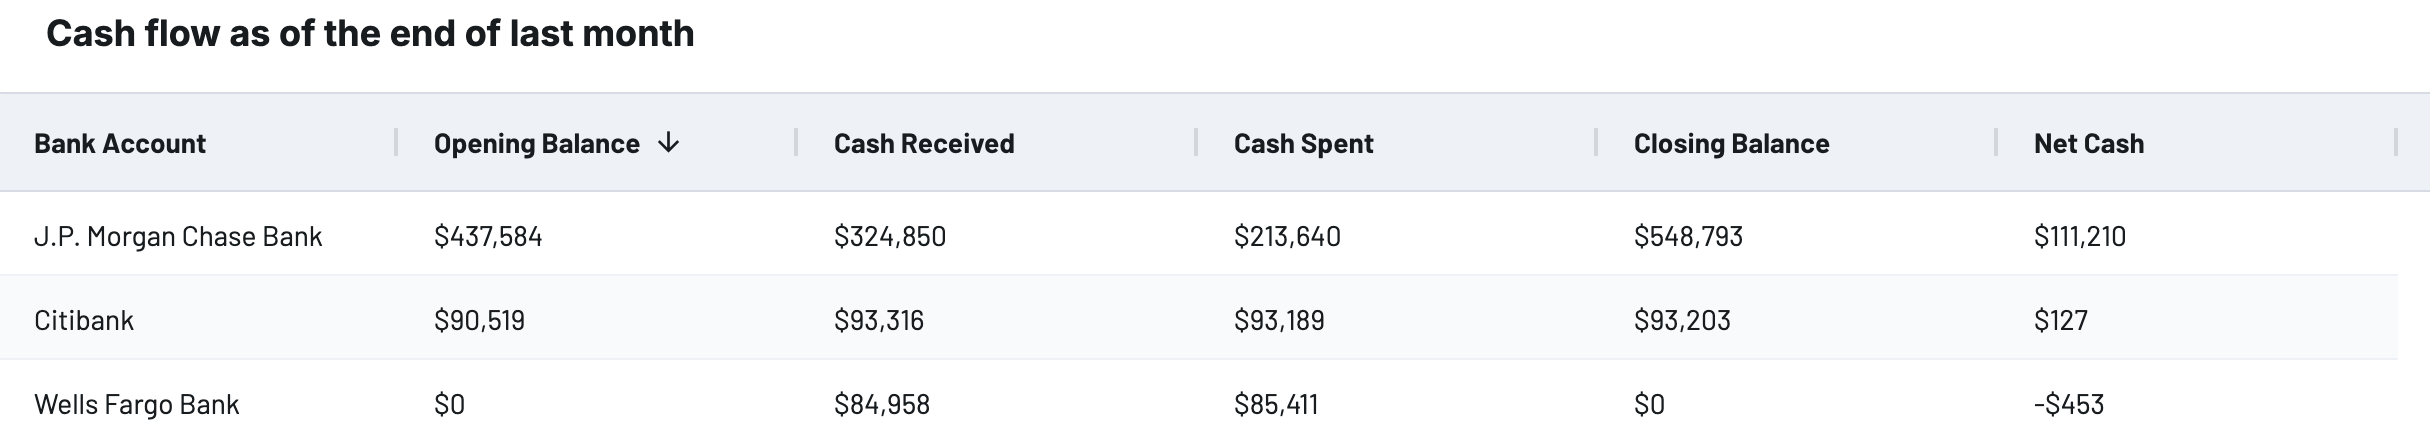
An ETL pipeline can pull financial data from Xero into a structured format. This makes it easier to analyze opening balances, total inflows, outflows, and net cash movement for each bank account over time.
With this setup, you can track cash flow more clearly, compare periods side by side, and get a real-time view of your financial position – all in one place.
Data source: Xero
Data transformations: Unnecessary columns are hidden to keep the report straight to the point.
How to implement: Coupler.io’s Xero Bank Summary This/Last Month dataset template helps you extract detailed cash flow metrics for each bank account. It’s useful for comparing activity across accounts or tracking changes over time.
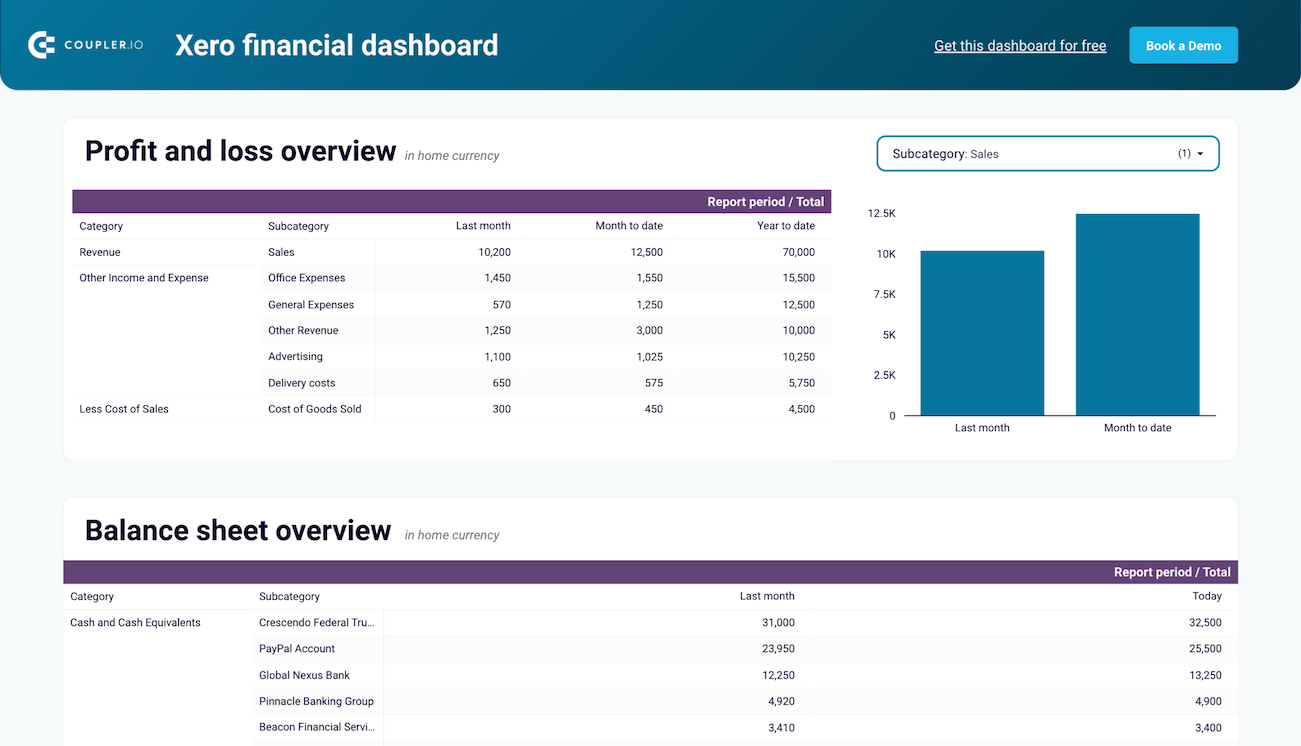
If you prefer visualization, the Financial dashboard for Xero displays your cash flow data in charts and tables. It’s ideal for spotting trends or reviewing liquidity at a glance:
The dashboard can be used in Coupler.io or as a template for Google Sheets and Looker Studio. If you choose the latter, just set it up following the instructions in the template’s Readme tab.
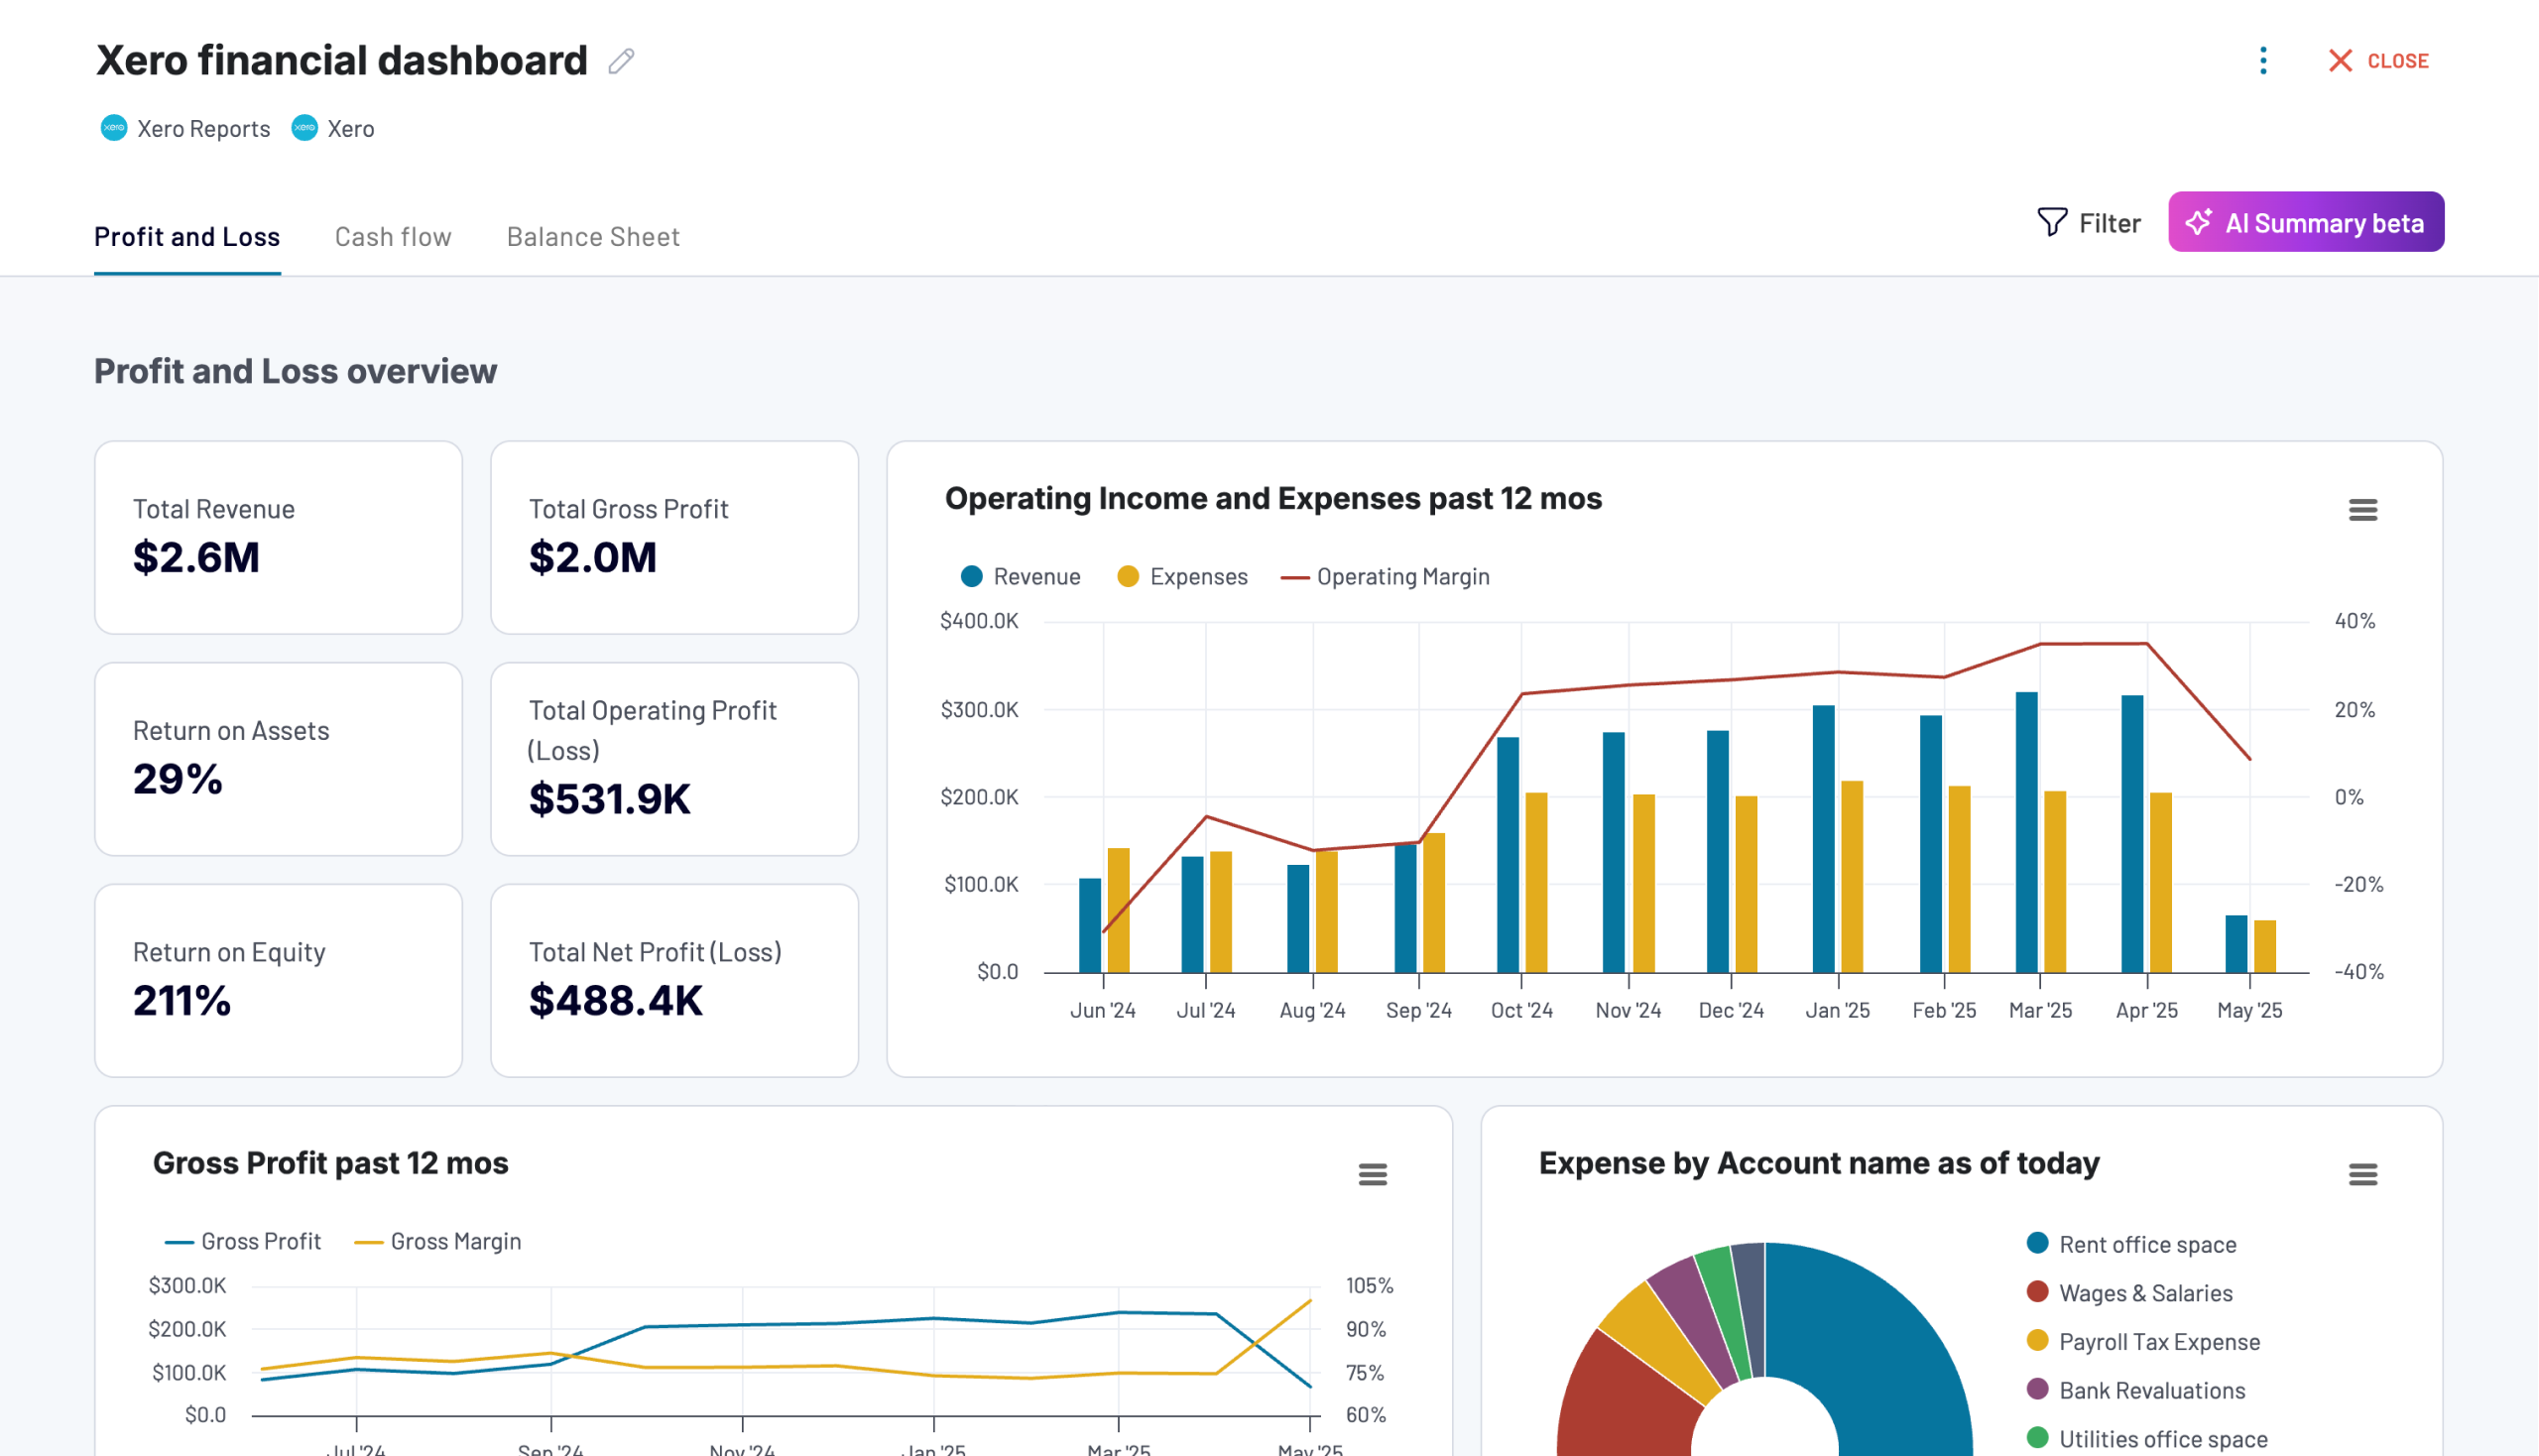
Xero financial dashboard
Get comprehensive financial insights from your Xero account with key performance metrics, balance sheet analysis, and cash flow projections. Quickly assess your business health and make informed financial decisions.

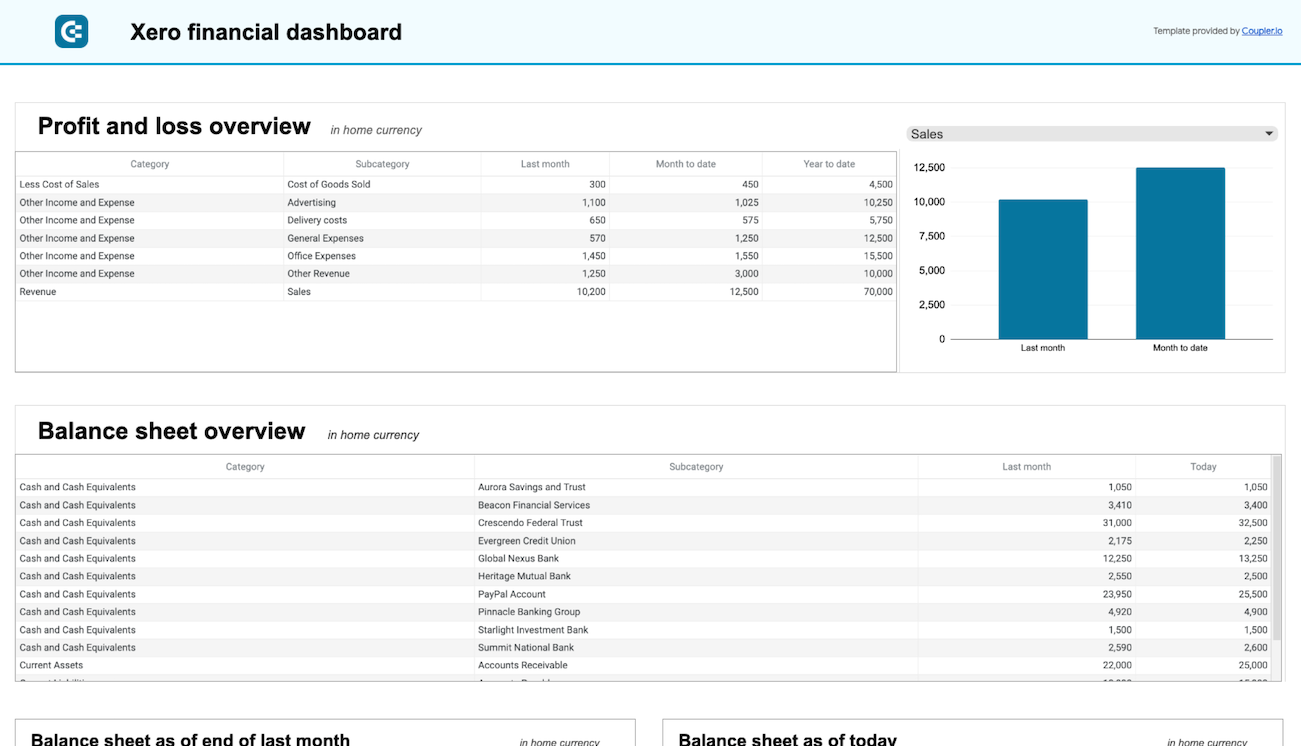
Xero financial dashboard in Google Sheets
Get instant visibility into your company’s financial health through key performance reports from Xero such as cash flow, income statement, and balance sheet.
Xero financial dashboard in Looker Studio
Analyze your financial performance with a unified dashboard featuring key reports from Xero like cash flow, profit and loss, balance sheet, and others.
10. Tracking order status and financial flow
Using Shopify, it’s difficult to track which orders are still pending, which have been refunded, or where transactions have stalled. Without a clear view, teams may miss revenue delays or fail to respond to blocked purchases in time.
An ETL pipeline can collect order and financial status data in one place. With this setup, you can filter by order status (pending, refunded, completed) and identify issues quickly – like transactions stuck in processing or needing customer follow-up.
You can also break the data down by region or product to see patterns in failed or refunded orders. This helps prioritize support efforts, resolve blockers faster, and keep your cash flow steady.
Data source: Shopify
Data transformations: Unnecessary columns are hidden, and some filters are applied. Data is aggregated to show weekly and monthly performance views.
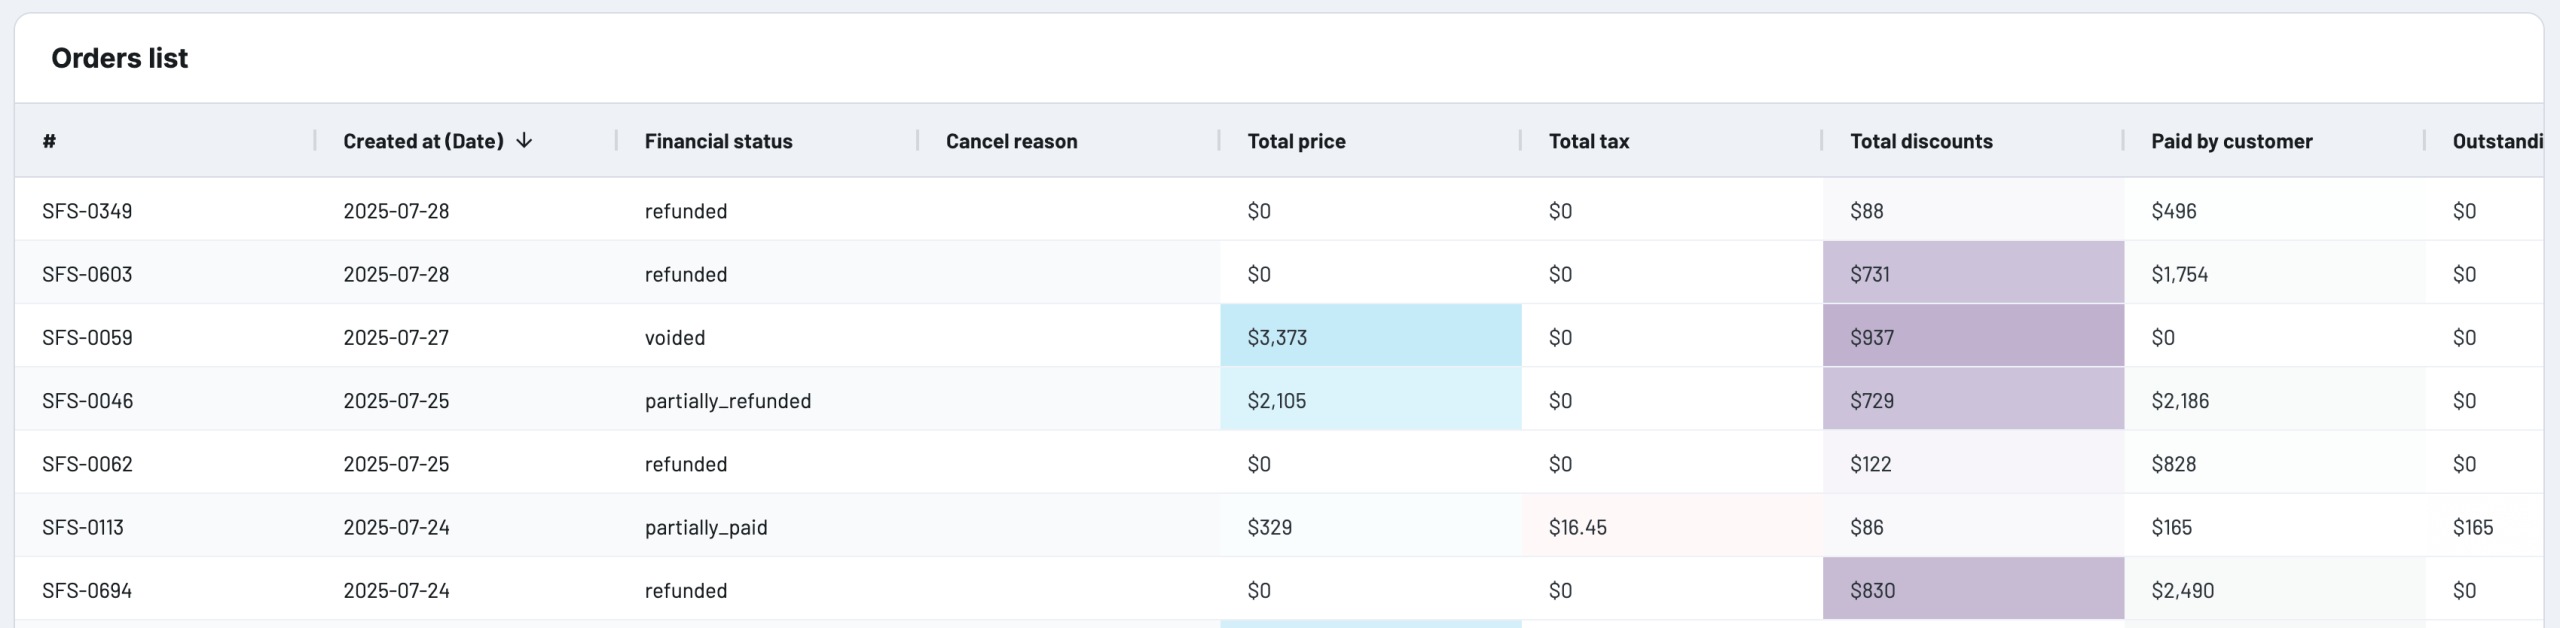
How to implement: The Shopify orders essentials dataset template in Coupler.io helps you extract key details like order status, financial status, fulfillment, and timestamps. It’s great for spotting patterns in pending, completed, or refunded orders, and for creating custom reports.
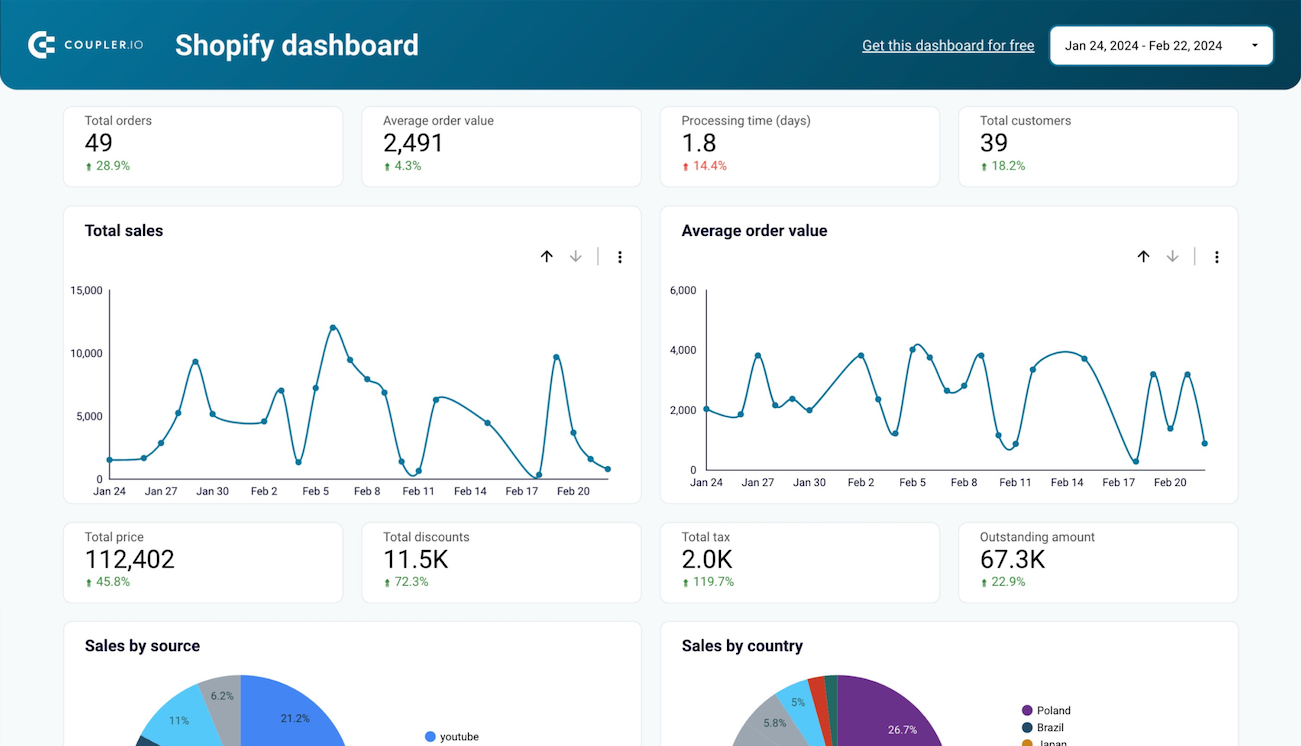
Alternatively, you can use the Shopify orders dashboard to have your order data presented through pre-built charts and tables. It’s best for quickly identifying blocked transactions, monitoring cash flow impact, and filtering by product or region.
This dashboard is available in Coupler.io or as a template for Google Sheets, Looker Studio, and Power BI. For the latter, you’ll need to set it up following the instructions in the chosen template’s Readme tab.
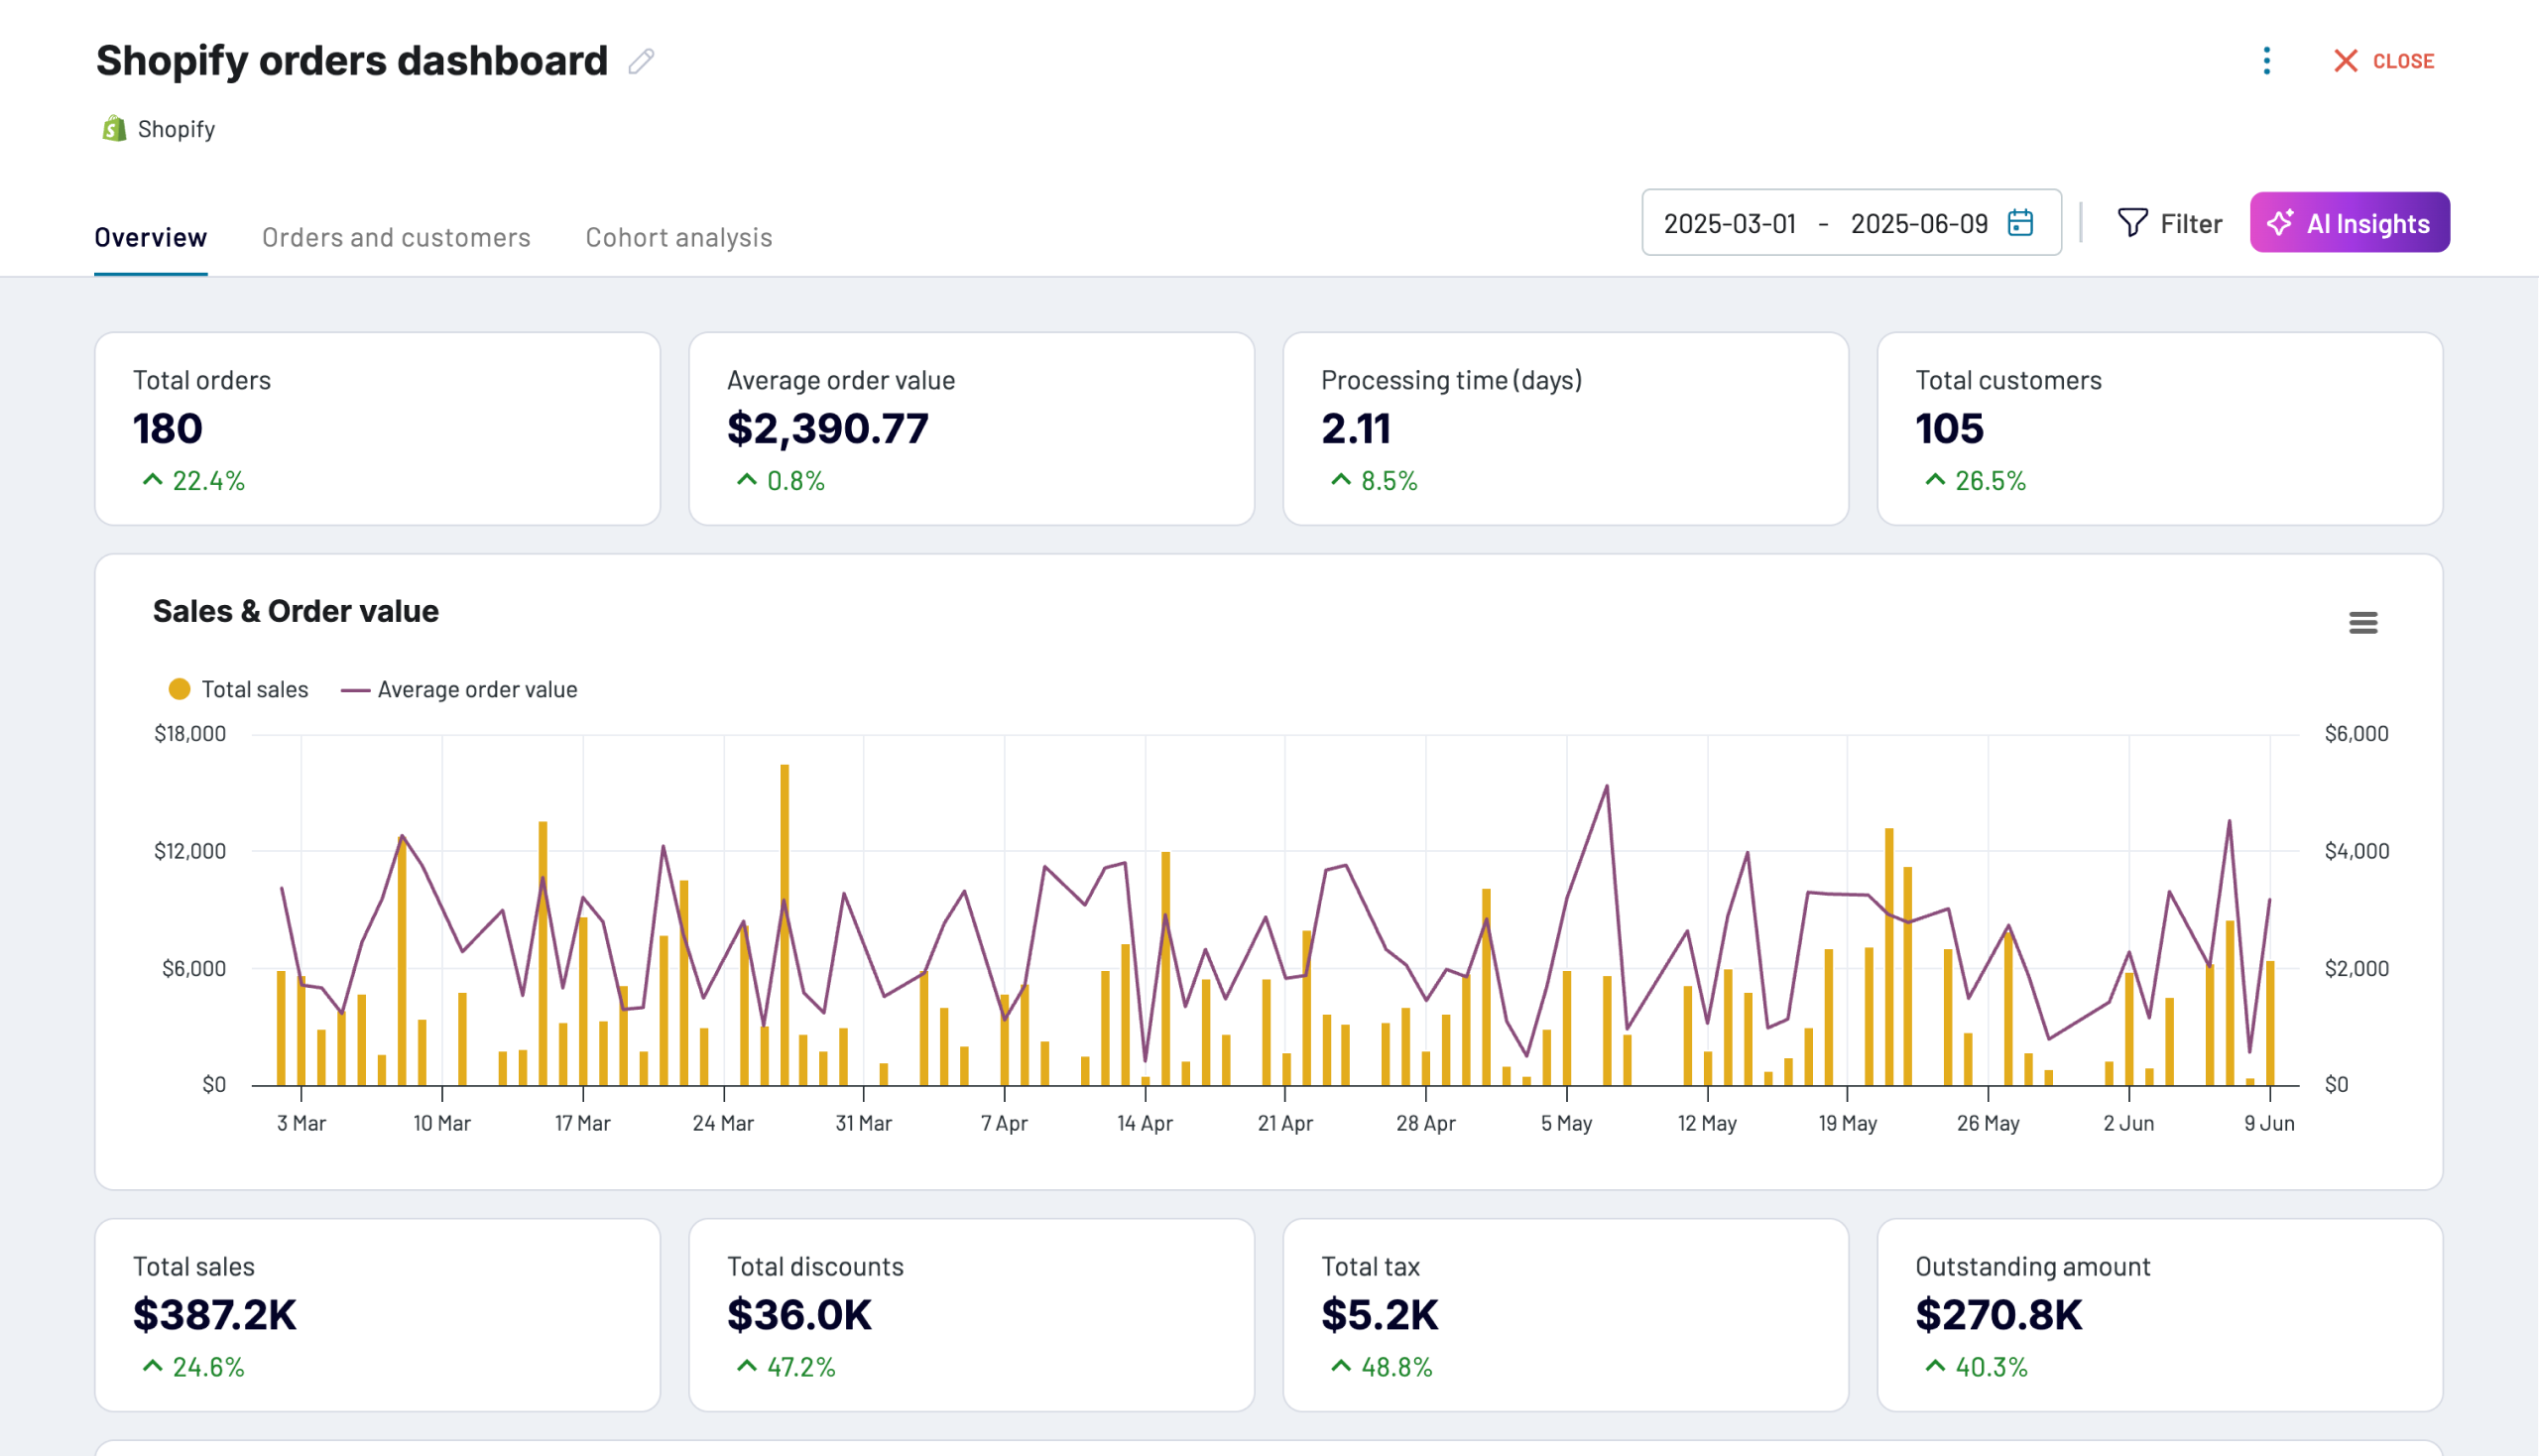
Shopify orders dashboard
Monitor your e-commerce order flow with comprehensive insights into sales patterns, customer behavior, and fulfillment metrics.

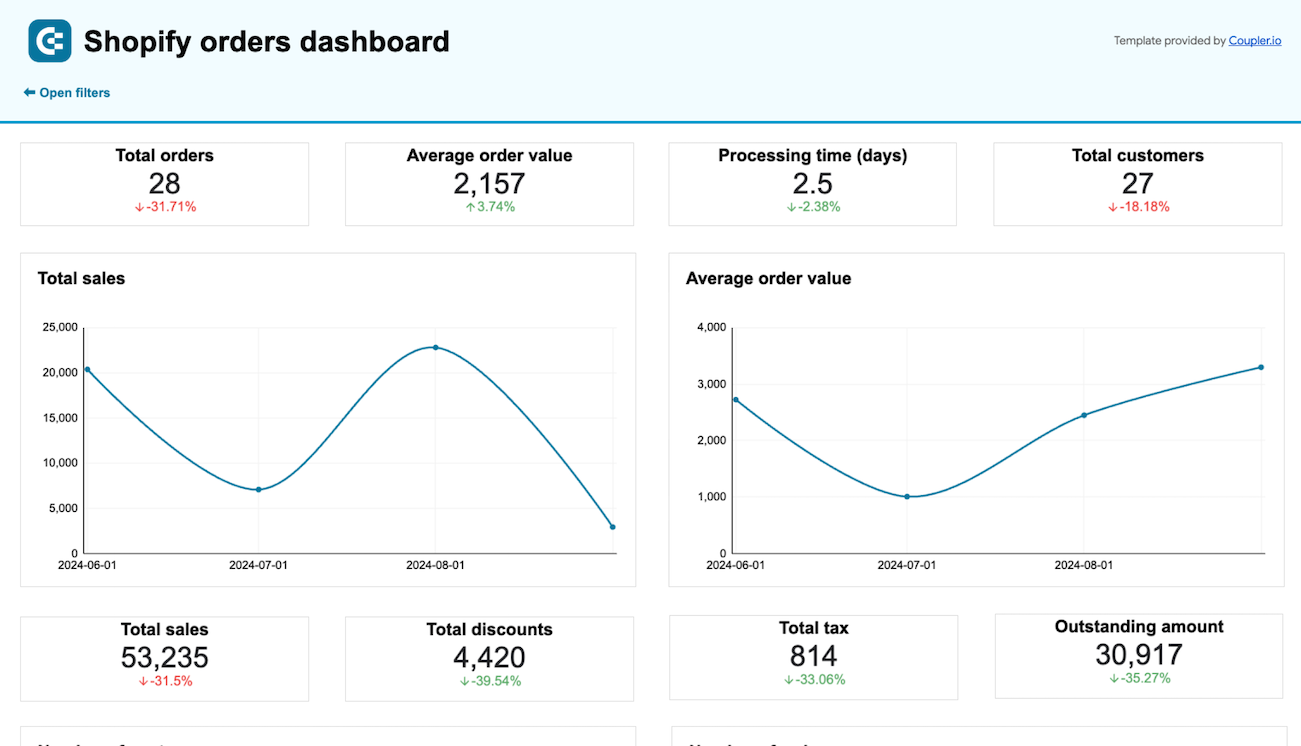
Shopify orders dashboard in Google Sheets
Monitor your Shopify store’s orders to efficiently manage sales, shipping, inventory, and identify customer trends.
Shopify orders dashboard in Looker Studio
Access the performance of your Shopify ecommerce store and uncover critical insights into how to manage your orders effectively.
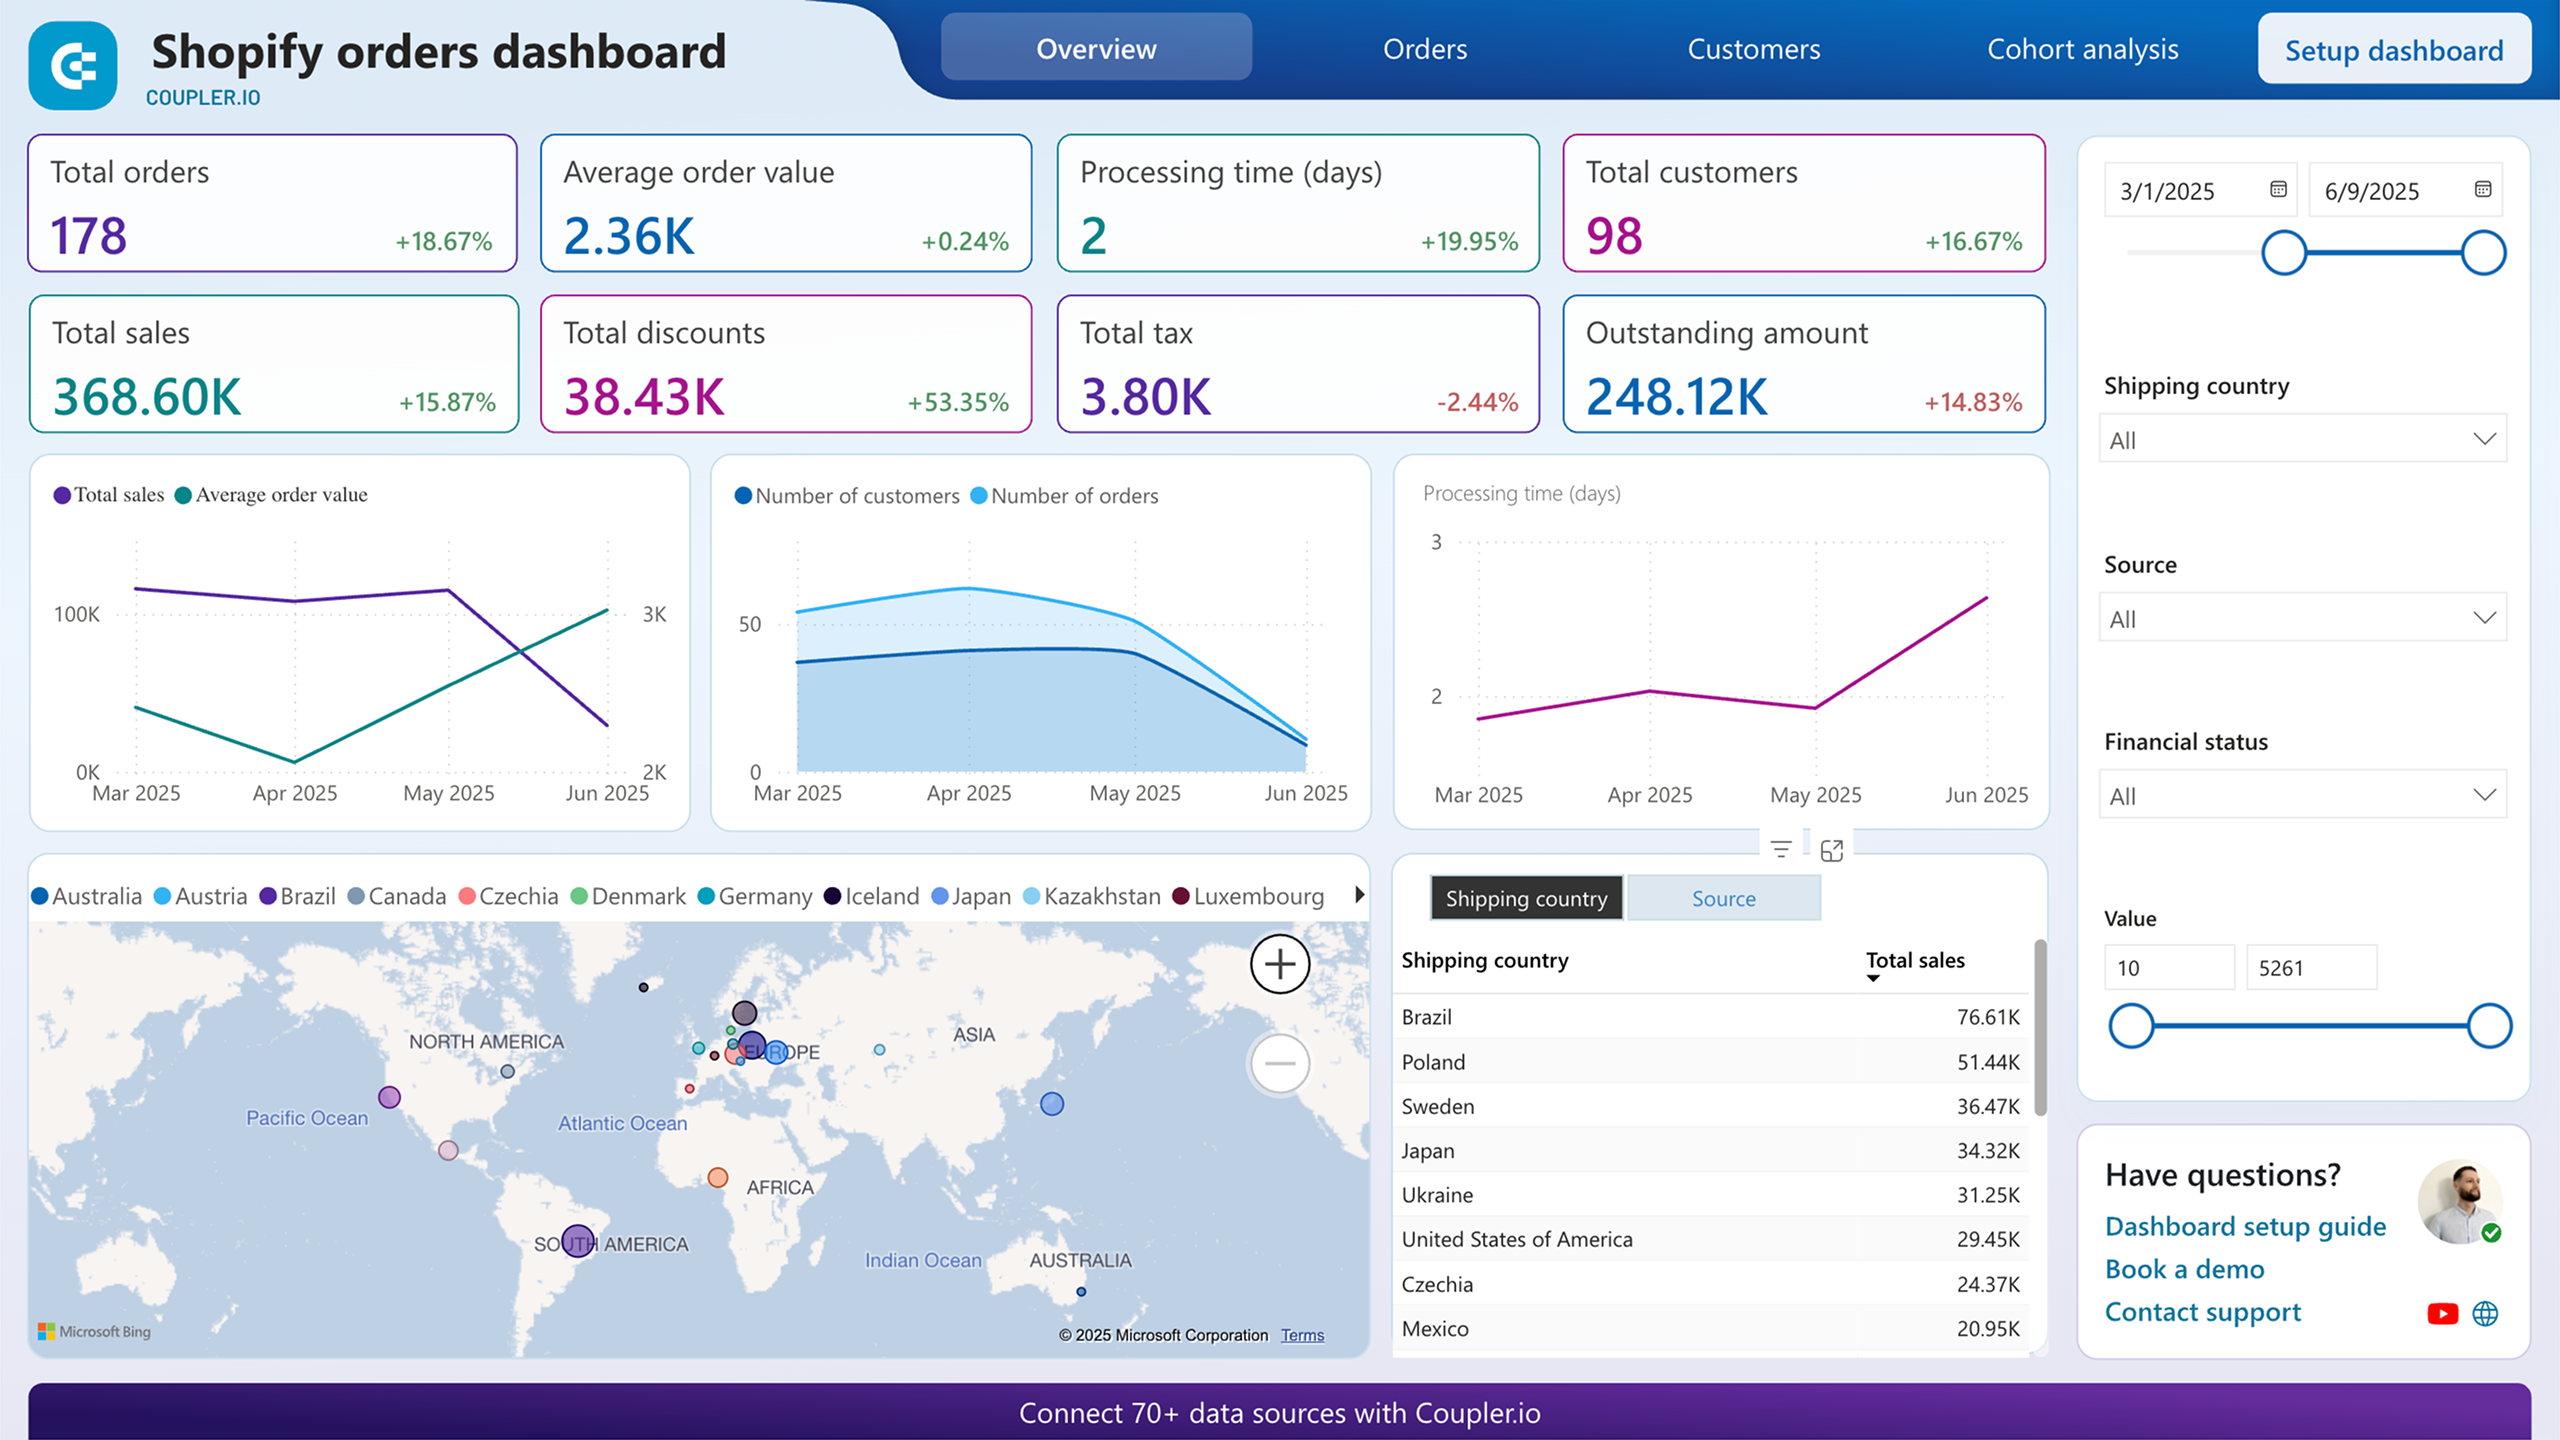
Shopify orders dashboard in Power BI
Track order volumes, payment statuses, and shipping performance with detailed visualizations of your Shopify store’s transaction data.
Coupler.io’s data set templates, with their various connectors, are designed to be invaluable for whether you’re a marketer, paid ad agency, or a business owner. Just find the perfect one for your specific case and simplify the way you process data. We’re committed to continually adding new templates based on real-world use cases of ETL, so expect even more solutions ahead!
Explore prebuilt ETL pipelines in Coupler.io
Get started for freeUsing AI ETL to make your data talk
Simple business questions shouldn’t require hours to answer. With AI agents, you can get instant, accurate insights and make timely decisions.
Imagine a different reality: simply asking an AI assistant, “How did our sales perform last quarter?” or “Which marketing channel drove the most conversions this month?” While “talking to data” might sound unusual, it’s rapidly becoming the new standard.
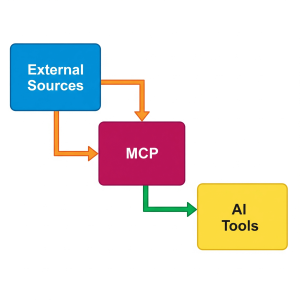
You can do this using the AI integrations by Coupler.io. It uses the Coupler.io MCP server as a bridge between your external sources and advanced AI tools. As a result, you can integrate your data flows to AI and have natural language conversations about insights, ask AI to query data, make calculations, or even create charts.
The AI integrations based on the MCP server completely transform the way you interact with your business data and eliminate the need for complex queries or specialized technical expertise. Instead, you can engage naturally with your data and draw conclusions in mere seconds.
Having integrated your data with AI using Coupler.io, you can:
- Generate instant reports for your team and cut down on manual compilation time. For example, ask “Can you create a weekly sales summary by region?” or “Generate a report showing inventory turnover trends for the past quarter.”
- Stay in the know of the latest developments by simply asking questions. Let’s say you may inquire, “What are the top 5 customer complaints this week?” or “Which campaigns led to the highest user sign-ups yesterday?”
- Filter data to precisely focus on the information that truly matters. For instance, prompt with “Show me conversion rates for users in Europe aged 25-34” or “Filter support tickets by urgency and product line.”
- Foster immediate action and empower every team member to think analytically. Suppose a marketer could ask, “Which keywords are driving the most qualified leads?” while a product manager might request, “Highlight features with the highest churn correlation.”
- Reduce reliance on technical specialists. To give you an idea, non-technical users can ask “Compare last month’s and this month’s customer acquisition costs” without needing to write SQL queries or access dashboards.
The best part is that you won’t have to make any complex setups or integrations. Just create a data flow in Coupler.io and connect it to your AI agent, such as Claude or ChatGPT. Coupler.io will keep your ETL pipeline up-to-date so AI has access to fresh data all the time.
Integrate your ETL pipelines with AI using Coupler.io
Get started for freeWhy ETL is critical for data-driven business success
Here’s how ETL becomes not just a technical process, but a strategic advantage for your business:
Faster time-to-insight
The challenge with raw data is that it’s rarely ready for immediate analysis. Imagine needing to streamline a marketing campaign in real-time or get an up-to-the-minute view of your sales pipeline. Without a proper data stack and preparation, you face significant delays, which slow down your ability to react and capitalize on opportunities.
By structuring and cleaning data upfront through ETL tools like Coupler.io, you enable rapid querying and reporting. This step reduces the lag between data extraction and insights, so you can seize emerging trends and stay ahead of the competition. Additional features like incremental fetching also contribute to the reduction in data processing time. It only retrieves new or updated records from your data sources after the initial sync, rather than re-downloading everything each time.
Case in point: ClaritySeed used Coupler.io to automate dashboards across Stripe, Intercom, and GA4. This saved them over 40 hours per month, allowed them to deliver reports 5 hours faster, and eliminated 10+ hours of manual work weekly.
Data compliance and security
Sensitive customer data comes with immense responsibility and strict regulatory demands like GDPR and CCPA. Storing raw, unmasked data can expose your business to security risks and compliance headaches. IBM’s Cost of a Data Breach 2023 report found that the average global cost of a breach was $4.45 million. Companies that implemented automated data masking and lifecycle management saved over $300K per breach on average.
ETL pipelines are designed to bake security and compliance directly into your data flow. During the transformation process, ETL can mask or anonymize personally identifiable information (PII) before it’s stored or used for data analysis. So, you gain superior control over data governance to minimize the likelihood of breaches and fully align with legal standards.
Coupler.io, for instance, ensures the security of your data by protecting it using Transport Layer Security (TLS). Your data is stored only as long as you have an active Coupler.io account or until you choose to delete it. Besides, Coupler.io implements a range of organizational and technical measures to comply with global privacy regulations, including GDPR.
Reduced data storage costs
Unprocessed, complex data is often bulky, redundant, and inefficient to store. As your data volume grows, e.g., from ad platforms or CRM systems like Salesforce and HubSpot, so does your pricing for storage providers. Paying for unoptimized data can quickly become a significant drain on your budget.
Through ETL, you can tackle storage inefficiencies by optimizing your data before the loading process. This involves preliminary data processing and filtering, removing unnecessary fields, aggregating metrics, and consolidating records. As a result, only clean, relevant information makes its way into your storage systems like BigQuery or Redshift. This leads to substantial cost savings in the context of scalability, particularly crucial when managing high-volume data sources.
Case in point: Project Alfred applied Coupler.io’s filtering options to avoid loading full HubSpot and Facebook Ads datasets and only extract specific data. This reduced BigQuery storage usage and eliminated the need for manual data exports, saving them 20–40 hours/month in the process.
Mature ETL tools and ecosystem
New types of data initiatives can feel daunting, especially when counting on unproven technologies or struggling with limited support. The lack of time-tested tools and established best practices leads to unreliable data pipelines, complex integrations, and a steep learning curve.
ETL, with over two decades as a cornerstone of data infrastructure, offers a mature ecosystem you can trust. This long history has fostered robust tools and verified frameworks, backed by extensive community support and vendor expertise. This translates into more dependable pipelines, seamless integration with popular source systems, and faster onboarding for data engineers and analysts.
For instance, Coupler.io has developed a robust infrastructure with:
- 70+ data sources (including analytics tools, ad platforms, email marketing tools, social media, CRMs, financial management systems, and more)
- 10+ destinations such as spreadsheet apps, business intelligence tools, databases, data warehouses, etc.
Case in point: SellThru used Coupler.io to integrate Shopify and GA4 data in BigQuery. They cut setup time from 2 weeks to just 2–3 days, saved at least 1 hour per day, and achieved 95%+ tracking reliability across their marketing stack.
Automated data workflows
Manual data management is a complex, error-prone, and time-consuming task. This often affects data quality and the accuracy of your numbers, which hampers business decision-making.
To deal with this challenge, use ETL processes to automate the flow of data into unified reports and dashboards, which reduces manual work, minimizes errors, and improves data integrity. This allows you to confidently make choices based on reliable numbers.
Consider the case of United Way Northwest Indiana’s marketing team. They were spending 80 hours each month manually extracting and consolidating data from Facebook Ads, Google Ads, Google Search Console, and GA4. By implementing automated data flows with Coupler.io, they eliminated this manual work entirely – saving $20,000 annually in labor costs. Their new pipeline automatically pulls data from multiple platforms, applies pre-built transformations, and feeds standardized, real-time data into Looker Studio dashboards.
Feel free to explore other Coupler.io use cases of ETL, as well as MCP use cases to instantly converse with your real-time data using AI.
Ready to transform your workflows involving data? Try Coupler.io’s ETL solutions for free and see how it leads your large volumes of data from various sources to actionable insights.
Automate ETL pipelines with Coupler.io
Get started for free


